Embed Size (px)
Citation preview
S A S K P O W E R 2 0 1 5 - 1 6 A N N U A L R E P O R T
A powerful
C O N N E C T I O N

SaskPower has changed its fiscal year-end to March 31 to coincide with that of the Province of Saskatchewan.
The first complete fiscal period subsequent to the change is presented in this annual report and consists of the fifteen months ended March 31, 2016. It includes:
• Quarter 1 (Q1) through quarter 4 (Q4) = January 1, 2015 through December 31, 2015
• Quarter 5 (Q5) = January 1, 2016, through March 31, 2016
Subsequent fiscal years will consist of the twelve months from April 1 through March 31.
SASKPOWE R 2 015 -16 ANNUAL RE PORT 1
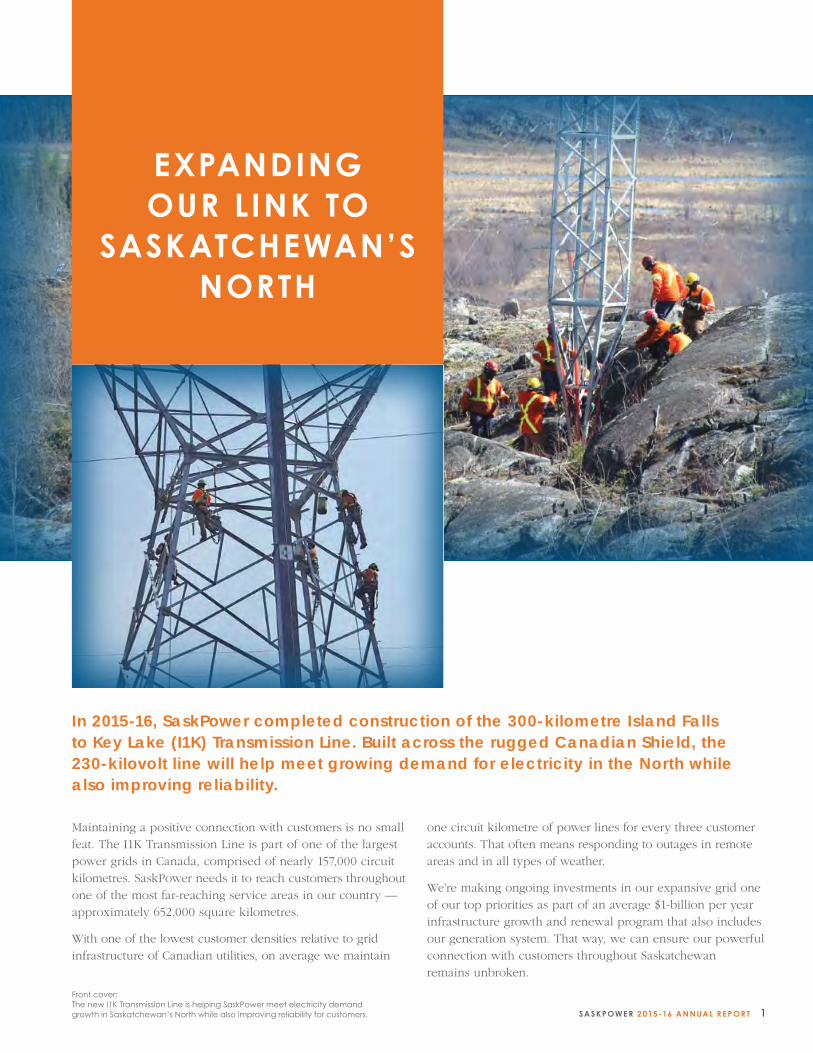
In 2015-16, SaskPower completed construction of the 300-kilometre Island Falls to Key Lake (I1K) Transmission Line. Built across the rugged Canadian Shield, the 230-kilovolt line will help meet growing demand for electricity in the North while also improving reliability.
Maintaining a positive connection with customers is no small feat. The I1K Transmission Line is part of one of the largest power grids in Canada, comprised of nearly 157,000 circuit kilometres. SaskPower needs it to reach customers throughout one of the most far-reaching service areas in our country — approximately 652,000 square kilometres.
With one of the lowest customer densities relative to grid infrastructure of Canadian utilities, on average we maintain
one circuit kilometre of power lines for every three customer accounts. That often means responding to outages in remote areas and in all types of weather.
We’re making ongoing investments in our expansive grid one of our top priorities as part of an average $1-billion per year infrastructure growth and renewal program that also includes our generation system. That way, we can ensure our powerful connection with customers throughout Saskatchewan remains unbroken.
EXPANDING OUR LINK TO
SASKATCHEWAN’S NORTH
Front cover:The new I1K Transmission Line is helping SaskPower meet electricity demand growth in Saskatchewan’s North while also improving reliability for customers.

2 SASKPOWE R 2 015 -16 ANNUAL RE PORT
CORPORATE PROFILE
Established in 1929, SaskPower is
Saskatchewan’s leading energy supplier.
We are defined by our commitment to
support economic growth and enhance
quality of life in our province. Our
corporate mission: ensuring reliable,
sustainable and cost-effective power
for our customers.
SaskPower’s team is made up of nearly
3,150 permanent full-time employees.
We manage over $10 billion in
generation, transmission, distribution and
other assets. Our company operates five
natural gas stations, three coal-fired
power stations, seven hydroelectric
stations, and two wind facilities.
Combined, they generate 3,542
megawatts (MW) of electricity.
SaskPower also buys power from various
independent power producers (IPPs),
including the North Battleford
Generating Station, Cory Cogeneration
Station, Meridian Cogeneration Station,
Spy Hill Generating Station, Morse Wind
Energy Facility, Red Lily Wind Power
Facility and SunBridge Wind Power
Facility. At the end of the year, our
company’s total available generation
capacity was 4,437 MW.
We are responsible for serving nearly
522,000 customer accounts within
Saskatchewan’s geographic area of
652,000 square kilometres. About three
customer accounts are supplied per
circuit kilometre. We maintain nearly
157,000 kilometres of power lines, 55 high
voltage switching stations and 194
distribution substations. Our company also
has interties at the Manitoba, Alberta
and North Dakota borders.
SASKPOWE R 2 015 -16 ANNUAL RE PORT 3
CONTENTS04 Per formance highl ights
06 Letter of transmittal
07 Our strategic context
08 A message to our stakeholders
10 2015-16 year at a glance
26 Management’s discussion and analysis
94 Consol idated f inancial statements and notes
132 Corporate governance
150 Five-year f inancial summary
151 Five-year revenue statistics
152 Five-year generating and operating statistics
153 Glossary
154 System map
4 SASKPOWE R 2 015 -16 ANNUAL RE PORT
$0
$400
$800
$1,200
$1,600
CAPITAL EXPENDITURES (Q5)
CAPITAL EXPENDITURES (Q1-Q4)
2015-162014201320122011
CAPITAL EXPENDITURES
CAPITAL EXPENDITURES (MILLIONS) Q1 - Q4
CAPITAL EXPENDITURES (MILLIONS) Q5
40%
55%
70%
85%
100%
PER CENT DEBT RATIO (Q5)
PER CENT DEBT RATIO (Q1-Q4)
LONG-TERM TARGET RANGE
2015-162014201320122011
PER CENT DEBT RATIOVS LONG-TERM RANGE
PER CENT DEBT RATIO Q4
PER CENT DEBT RATIO Q5
LONG-TERM TARGET RANGE
F INANCIAL INDICATORSFifteen months
March 31Three months
March 31Twelve months December 31
(in millions) 2016 2016 2015 2014 Change
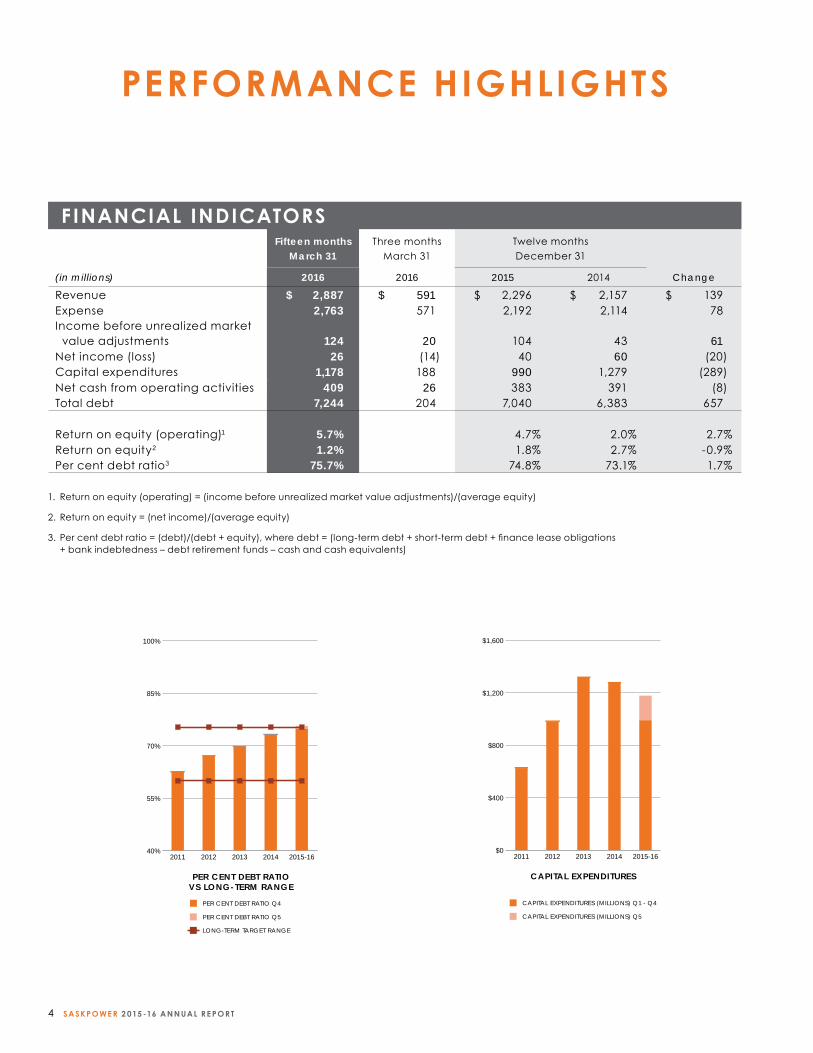
Revenue $ 2,887 $ 591 $ 2,296 $ 2,157 $ 139 Expense 2,763 571 2,192 2,114 78 Income before unrealized market value adjustments 124 20 104 43 61 Net income (loss) 26 (14) 40 60 (20)Capital expenditures 1,178 188 990 1,279 (289)Net cash from operating activities 409 26 383 391 (8)Total debt 7,244 204 7,040 6,383 657
Return on equity (operating)1 5.7% 4.7% 2.0% 2.7%Return on equity2 1.2% 1.8% 2.7% -0.9%Per cent debt ratio3 75.7% 74.8% 73.1% 1.7%
1. Return on equity (operating) = (income before unrealized market value adjustments)/(average equity)
2. Return on equity = (net income)/(average equity)
3. Per cent debt ratio = (debt)/(debt + equity), where debt = (long-term debt + short-term debt + finance lease obligations + bank indebtedness – debt retirement funds – cash and cash equivalents)
PERFORMANCE HIGHLIGHTS
SASKPOWE R 2 015 -16 ANNUAL RE PORT 5
$0
$700
$1,400
$2,100
$2,800
18,000
20,500
23,000
25,500
28,000
ELECTRICITY SALES Q5ELECTRICITY SALES (MILLIONS) Q1-Q4ELECTRICITY SALES (GWh)
2015-162014201320122011
SASKATCHEWAN ELECTRICITY SALES
ELECTRICITY SALES (MILLIONS) Q5
ELECTRICITY SALES (MILLIONS) Q1 - Q4
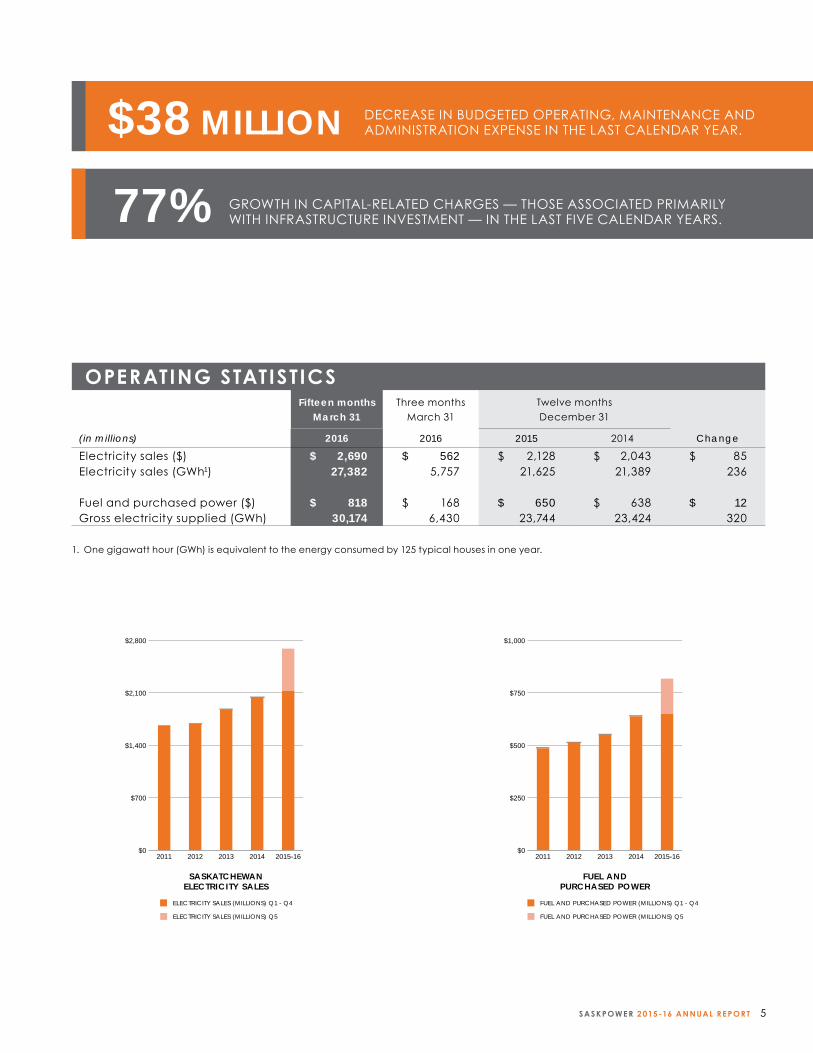
$38 MILLION DECREASE IN BUDGETED OPERATING, MAINTENANCE ANDADMINISTRATION EXPENSE IN THE LAST CALENDAR YEAR.
77% GROWTH IN CAPITAL-RELATED CHARGES — THOSE ASSOCIATED PRIMARILYWITH INFRASTRUCTURE INVESTMENT — IN THE LAST FIVE CALENDAR YEARS.
OPERATING STATISTICSFifteen months
March 31Three months
March 31Twelve months December 31
(in millions) 2016 2016 2015 2014 Change
Electricity sales ($) $ 2,690 $ 562 $ 2,128 $ 2,043 $ 85 Electricity sales (GWh1) 27,382 5,757 21,625 21,389 236
Fuel and purchased power ($) $ 818 $ 168 $ 650 $ 638 $ 12 Gross electricity supplied (GWh) 30,174 6,430 23,744 23,424 320
1. One gigawatt hour (GWh) is equivalent to the energy consumed by 125 typical houses in one year.
$0
$250
$500
$750
$1,000
21,000
23,500
26,000
28,500
31,000
FUEL AND PURCHASED POWER (MILLIONS) Q5
FUEL AND PURCHASED POWER (MILLIONS) Q1-Q4
GROSS ELECTRICITY SUPPLIED (GWh)
2015-162014201320122011
FUEL AND PURCHASED POWER
FUEL AND PURCHASED POWER (MILLIONS) Q5
FUEL AND PURCHASED POWER (MILLIONS) Q1 - Q4

6 SASKPOWE R 2 015 -16 ANNUAL RE PORT
Regina
June 2016
To Her Honour
The Honourable Vaughn Solomon Schofield, S.O.M., S.V.M.
Lieutenant Governor of Saskatchewan
Province of Saskatchewan
Madame:
I have the honour to submit herewith the Annual Report of the Saskatchewan Power Corporation
for the fifteen months ending March 31, 2016.
The report includes the financial statements for the year in the form approved by the Treasury
Board, duly certified by the auditors of the Saskatchewan Power Corporation, all in accordance
with The Power Corporation Act.
I have the honour to be, Madame, your obedient servant,
Honourable Bill Boyd
Minister Responsible for Saskatchewan Power Corporation
LET TER OF TRANSMITTAL

SASKPOWE R 2 015 -16 ANNUAL RE PORT 7
OUR VISION An industry-leading company,
powering Saskatchewan through
innovation, performance and service.
OUR MISSION Ensuring reliable, sustainable
and cost-effective power
for our customers.
OUR VALUES Safety, openness,
dedication and respect.
OUR STRATEGIC CONTEXT
CORPORATE PILLARS
CUSTOMER EXPERIENCE & STAKEHOLDER RELATIONS [p 33]
WORKFORCE EXCELLENCE [p 40]
EFFICIENCY, QUALITY & COST MANAGEMENT [p 44]
SUSTAINABLE INFRASTRUCTURE & RELIABILITY [p 50]

8 SASKPOWE R 2 015 -16 ANNUAL RE PORT
A MESSAGE TO OUR STAKEHOLDERS
From the rocky Canadian Shield in the North to the Prairie grasslands in the South, Saskatchewan is an incredibly diverse place to live. Despite our geographic differences, we are all connected as one community through the electrical grid in our province.
SaskPower’s job is to help keep this community linked and energized; our mission is ensuring our customers have the reliable, sustainable and cost-effective power they need today and into the future.
To make sure we’re able to deliver on our corporate mission, this year we reset our vision: an industry-leading company, powering Saskatchewan through innovation, performance and service. We also identified the pillars we need to strengthen our company’s foundation: customer experience and stakeholder relations; workforce excellence; efficiency, quality and cost management; and sustainable infrastructure and reliability. Through these pillars, we’re making sure that every decision we make connects what we do to what is important to the people of our province.
CONNECTING TO CUSTOMERSWith our company adding an average of 9,500 customer accounts annually over the past five years, providing a high level of service is a major area of focus. Demand for power continues to grow, rising 16% over the same time period. While meeting this high level of growth, SaskPower has been able to maintain a competitive level of customer satisfaction. In fact, during the year a national survey by the Canadian Electricity Association ranked our company with the highest level of overall satisfaction amongst electric utilities.
Going forward, it’s more important than ever to talk to our customers about what they can do to save power, and save money on their bills. We’re always looking at the efficiency and conservation programs we offer and seeing what we can change and improve. During the year, our company surpassed our 10-year target to achieve an accumulated peak demand reduction in excess of 100 megawatts (MW) two years early. This represents about the same electricity capacity as the Island Falls Hydroelectric Station.
Connecting to SaskPower’s customers also means engaging with the people of Saskatchewan to share information about our future plans. Our company’s Power to Grow tour continues to engage residents about Saskatchewan’s electrical infrastructure challenges and the urgent need to invest in our power system. To-date, SaskPower has made 227 stops and
reached nearly 70,000 people in communities throughout the province.
How we connect with our customers – and how our customers are able to connect with us – has also become increasingly important. We’re using social media for faster and more responsive outage communications and we’ve added new functionality to our website to allow customers to easily gather information on their most common questions. We’ve also enhanced self-service options on their online accounts, which provide an alternative to the traditional method of calling in to Customer Services Representatives. With additional methods on the horizon, we continue to look for programs and service delivery options that make our customers’ lives easier.
CONNECTING TO OUR WORKFORCEIt’s our dedicated employees – nearly 3,150 across the province – who make us who we are. They work hard to provide power to the province 24 hours a day, 365 days a year. And while most of us take for granted that the lights will come on when we flip the switch, it’s dangerous work for many. The safety of the public and our employees always comes first – it’s a value that underpins everything we do.
During the year, our Safety Improvement Working Group took the time to meet with employees, asking what they would recommend to help us get better. Those recommendations have led to the creation of our Safety Improvement Program; its goal is to bring workplace injuries down to zero and to create a safety-first culture at SaskPower.
We have a lot to be proud of this year when it comes to our workforce. Once again we’ve been named among Canada’s Top Diversity Employers, Canada’s Top Employers for Young People and Saskatchewan’s Top Employers. As well, for the first time, Forbes Magazine named us among its top employers across the country.

SASKPOWE R 2 015 -16 ANNUAL RE PORT 9
CONNECTING TO EFFICIENCY AND QUALITYThis year, SaskPower and other Crown corporations realigned their fiscal years to mirror the April-March fiscal year of other government ministries and departments. This means that this current annual report covers the 15-month period from January 1, 2015, to March 31, 2016.
During this time, SaskPower achieved an operating income of $124 million and an operating return on equity (ROE) of 5.7% before unrealized market value adjustments. However, as a result of non-cash losses on SaskPower’s natural gas hedges our company recorded $98 million in unrealized market value adjustments. This brought our net income to $26 million, resulting in a net ROE of 1.2%. There are several factors that are affecting financial performance, but the most influential forces continue to be capital-related expenses – depreciation, finance charges, taxes and other expenses.
We are continually looking for efficiencies to mitigate the impact of our capital program on rates. In the 2015 calendar year alone, SaskPower reduced its budgeted operating, maintenance and administration spending by $38 million. This was done through freezing management salaries, reducing spending on training, travel and contract services, and reducing the budgeted number of employees by not filling vacancies as people retire or leave the company.
Similarly, we’re finding ways to reduce costs by doing our work differently. Through collaboration with other Crown corporations on the Joint Servicing Initiative, we’ve benefited from shared trenching and contractor costs. We’ve also started using an innovative technology that insulates deteriorated and cracked underground cables, providing up to an additional 30 years of use. At a fraction of the cost, this new process provides an alternative to our conventional repair method of digging up and replacing underground cable.
CONNECTING TO OUR SYSTEMIn the fall, SaskPower and the province announced our plan to significantly increase the amount of renewable electricity in Saskatchewan’s generation mix – from over 25% today to as much as 50% by 2030. This is expected to help us reduce SaskPower’s greenhouse gas (GHG) emissions by approximately 40% from 2005 levels by 2030.
With project-specific announcements ahead, SaskPower is evaluating a full range of generation options, which will allow us to determine the portfolio that best enables us to deliver reliable, sustainable, and cost-effective power. Meanwhile, the Boundary Dam Integrated Carbon Capture and Storage (ICCS) Demonstration Project is showing stronger performance and is on target to capture 800,000 tonnes of carbon dioxide in 2016. With the recent announcement
of the BHP Billiton-SaskPower Carbon Capture and Storage (CCS) Knowledge Centre in Regina, we’re proud to continue supporting the development and application of CCS technology worldwide as a key way to reduce GHG emissions from power production.
Our transmission and distribution infrastructure is also being renewed and expanded to meet new growth while addressing our aging grid. SaskPower invested $672 million on growth and compliance initiatives, and $491 million to sustain existing infrastructure.
Major projects this fiscal year included:
• The commissioning of a $510-million expansion ofSaskatoon’s Queen Elizabeth Power Station on budget,which added 204 MW to the grid;
• The completion of the $327-million I1K Transmission Lineon budget, which offers improved service and reliability tothe people of Northern Saskatchewan; and
• The completion of over 9,800 new customer accountconnections at a cost of nearly $200 million.
These are just a few examples of the ways SaskPower is working to connect our province. We would like to thank our customers as well as our employees, Executive and Board Members, both past and present, for their dedication and support. We look forward to meeting the challenges and pursuing the opportunities of 2016-17 and beyond.
Rob Pletch Mike Marsh
Chair, Board of Directors President & CEO
10 SASKPOWE R 2 015 -16 ANNUAL RE PORT
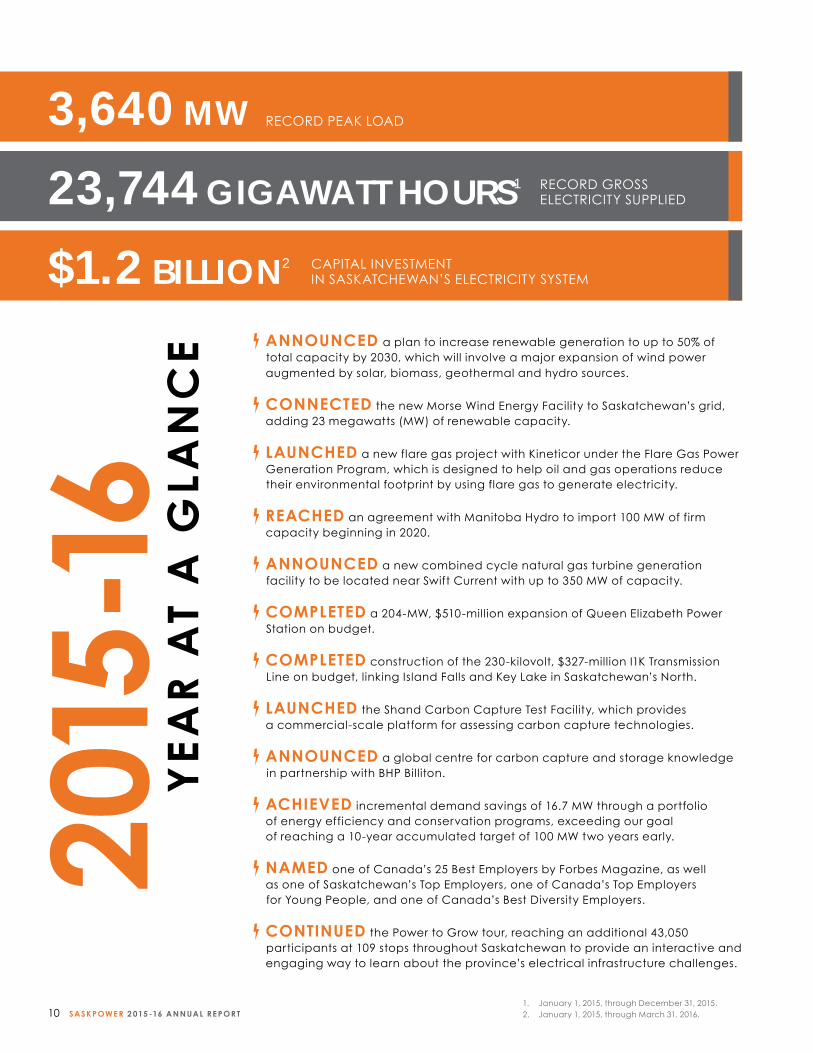
3,640 MW RECORD PEAK LOAD
23,744 GIGAWATT HOURS1 RECORD GROSSELECTRICITY SUPPLIED
ANNOUNCED a plan to increase renewable generation to up to 50% oftotal capacity by 2030, which will involve a major expansion of wind power augmented by solar, biomass, geothermal and hydro sources.
CONNECTED the new Morse Wind Energy Facility to Saskatchewan’s grid,adding 23 megawatts (MW) of renewable capacity.
LAUNCHED a new flare gas project with Kineticor under the Flare Gas PowerGeneration Program, which is designed to help oil and gas operations reduce their environmental footprint by using flare gas to generate electricity.
REACHED an agreement with Manitoba Hydro to import 100 MW of firmcapacity beginning in 2020.
ANNOUNCED a new combined cycle natural gas turbine generationfacility to be located near Swift Current with up to 350 MW of capacity.
COMPLETED a 204-MW, $510-million expansion of Queen Elizabeth PowerStation on budget.
COMPLETED construction of the 230-kilovolt, $327-million I1K TransmissionLine on budget, linking Island Falls and Key Lake in Saskatchewan’s North.
LAUNCHED the Shand Carbon Capture Test Facility, which providesa commercial-scale platform for assessing carbon capture technologies.
ANNOUNCED a global centre for carbon capture and storage knowledgein partnership with BHP Billiton.
ACHIEVED incremental demand savings of 16.7 MW through a portfolioof energy efficiency and conservation programs, exceeding our goal of reaching a 10-year accumulated target of 100 MW two years early.
NAMED one of Canada’s 25 Best Employers by Forbes Magazine, as wellas one of Saskatchewan’s Top Employers, one of Canada’s Top Employers for Young People, and one of Canada’s Best Diversity Employers.
CONTINUED the Power to Grow tour, reaching an additional 43,050participants at 109 stops throughout Saskatchewan to provide an interactive and engaging way to learn about the province’s electrical infrastructure challenges.
YE
AR
AT
A G
LAN
CE
2015
-16
$1.2 BILLION2 CAPITAL INVESTMENTIN SASKATCHEWAN’S ELECTRICITY SYSTEM
1. January 1, 2015, through December 31, 2015.2. January 1, 2015, through March 31, 2016.
SASKPOWE R 2 015 -16 ANNUAL RE PORT 11
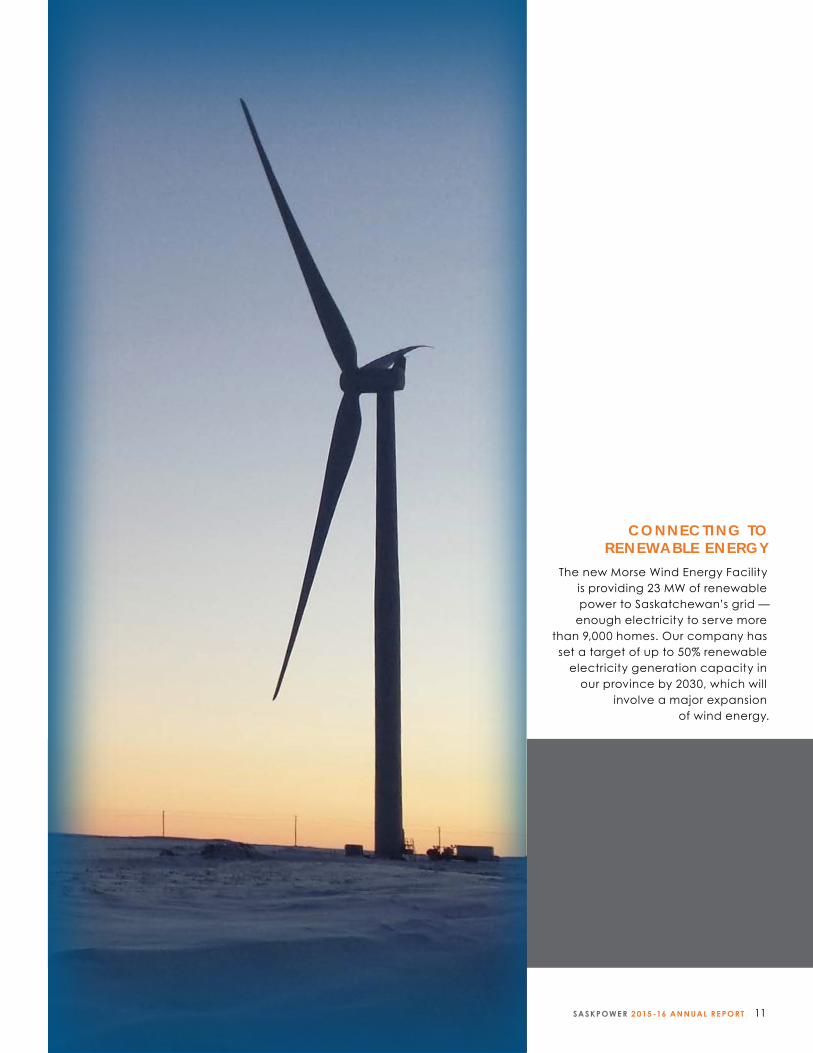
CONNECTING TO RENEWABLE ENERGY
The new Morse Wind Energy Facility is providing 23 MW of renewable power to Saskatchewan’s grid —
enough electricity to serve more than 9,000 homes. Our company has set a target of up to 50% renewable
electricity generation capacity in our province by 2030, which will
involve a major expansion of wind energy.

12 SASKPOWE R 2 015 -16 ANNUAL RE PORT
CONNECTING TO GROWTH A $510 million expansion of Queen Elizabeth Power Station adds
204 MW of natural gas-fired capacity to our province’s system, enough power for more than 200,000 homes. Because of its ability to act as a backup source, additional natural gas generation supports
our company’s plans for the introduction of more wind capacity.

SASKPOWE R 2 015 -16 ANNUAL RE PORT 13
14 SASKPOWE R 2 015 -16 ANNUAL RE PORT
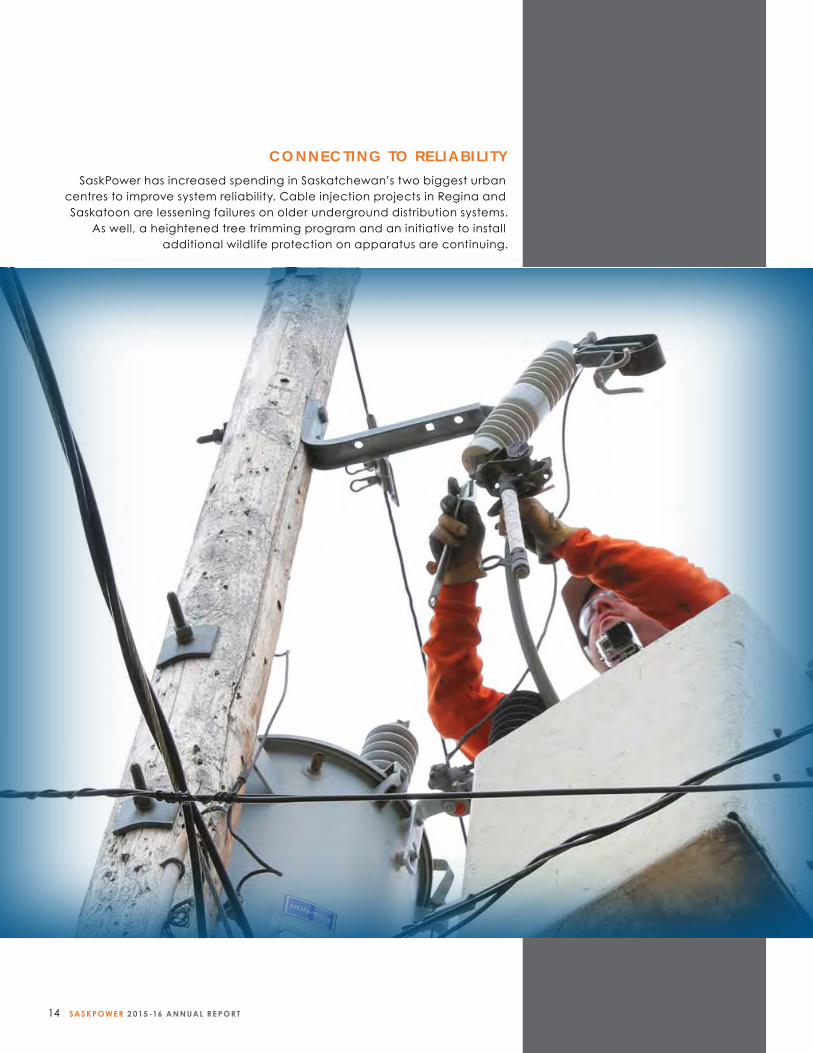
CONNECTING TO RELIABILITY
SaskPower has increased spending in Saskatchewan’s two biggest urban centres to improve system reliability. Cable injection projects in Regina and Saskatoon are lessening failures on older underground distribution systems.
As well, a heightened tree trimming program and an initiative to install additional wildlife protection on apparatus are continuing.
SASKPOWE R 2 015 -16 ANNUAL RE PORT 15
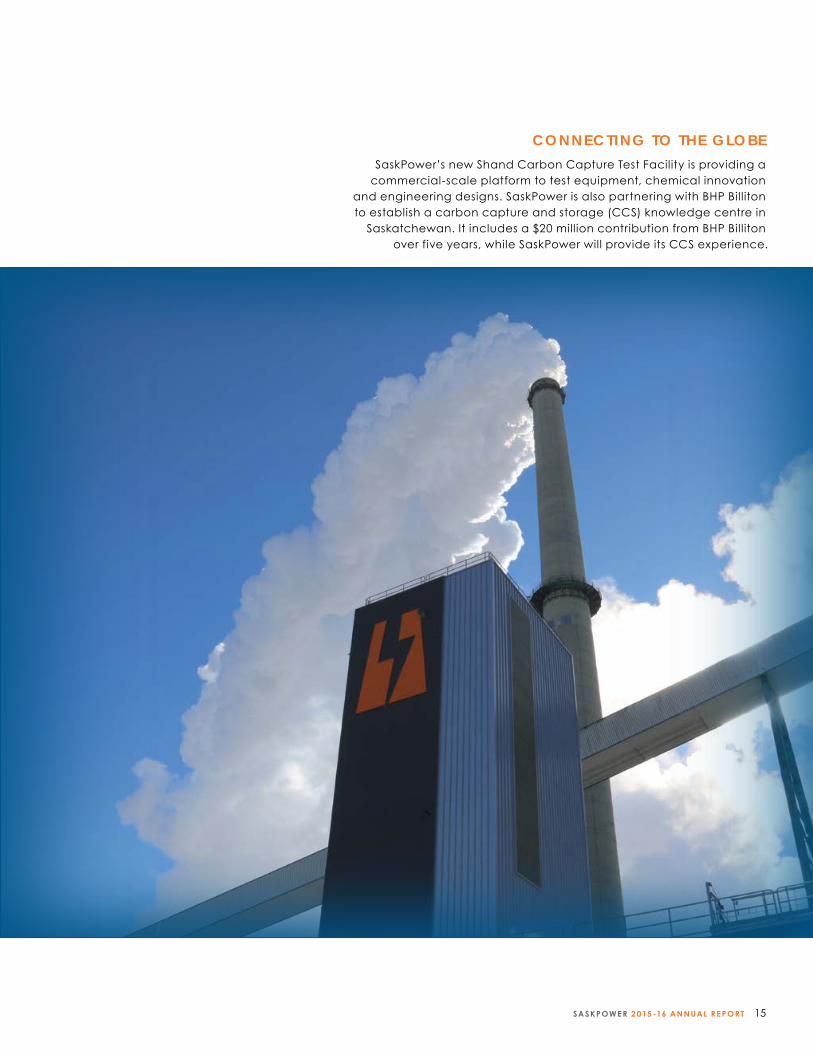
CONNECTING TO THE GLOBE
SaskPower’s new Shand Carbon Capture Test Facility is providing a commercial-scale platform to test equipment, chemical innovation
and engineering designs. SaskPower is also partnering with BHP Billiton to establish a carbon capture and storage (CCS) knowledge centre in
Saskatchewan. It includes a $20 million contribution from BHP Billiton over five years, while SaskPower will provide its CCS experience.

16 SASKPOWE R 2 015 -16 ANNUAL RE PORT
SASKPOWE R 2 015 -16 ANNUAL RE PORT 17
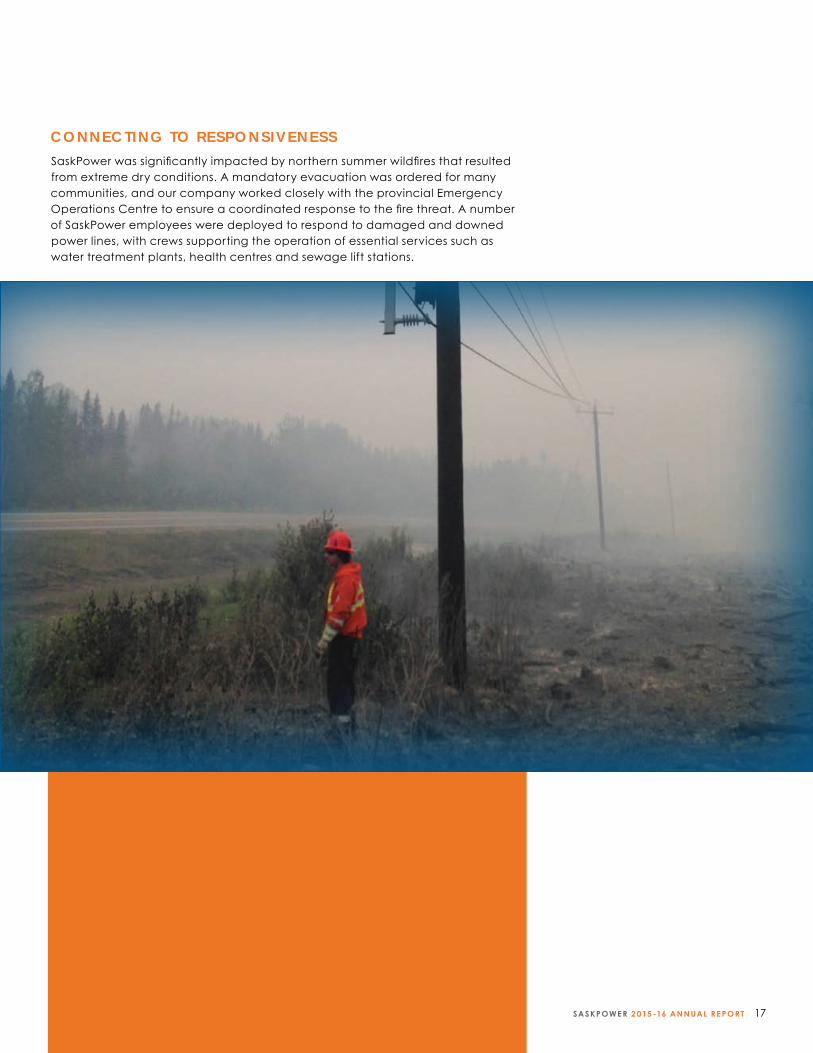
CONNECTING TO RESPONSIVENESS
SaskPower was significantly impacted by northern summer wildfires that resulted from extreme dry conditions. A mandatory evacuation was ordered for many communities, and our company worked closely with the provincial Emergency Operations Centre to ensure a coordinated response to the fire threat. A number of SaskPower employees were deployed to respond to damaged and downed power lines, with crews supporting the operation of essential services such as water treatment plants, health centres and sewage lift stations.

18 SASKPOWE R 2 015 -16 ANNUAL RE PORT
CONNECTING TO CUSTOMERS
During the year, SaskPower’s Lighting Discount Program reached 35,000 customers in 12 communities across Saskatchewan. The goal is to provide customers with
information to make informed energy-efficient product purchases, which will help them use less power and save money. For the second year in a row, the program received an
award from Lieutenant Governor Vaughn Solomon Schofield and the Saskatchewan Regional Centre of Expertise on Education for Sustainable Development.

SASKPOWE R 2 015 -16 ANNUAL RE PORT 19

20 SASKPOWE R 2 015 -16 ANNUAL RE PORT

SASKPOWE R 2 015 -16 ANNUAL RE PORT 21
CONNECTING TO SAFETY A Safety Improvement Working Group – made up of 13 representatives from high-risk work groups across the company – has evaluated the current state of safety at SaskPower, benchmarked best practices, gathered feedback from employees and created recommendations to achieve our goal of zero injuries. As a result, a new Safety Improvement Program has been initiated to develop and implement solutions to our company’s safety challenges.
22 SASKPOWE R 2 015 -16 ANNUAL RE PORT
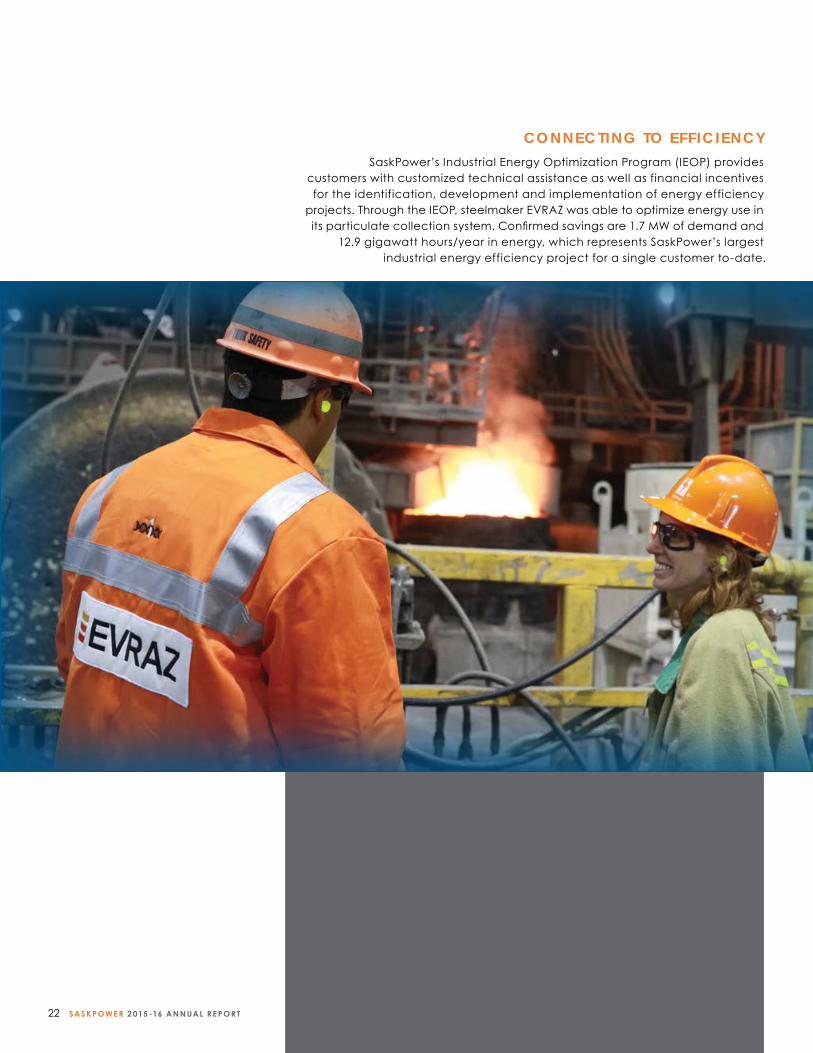
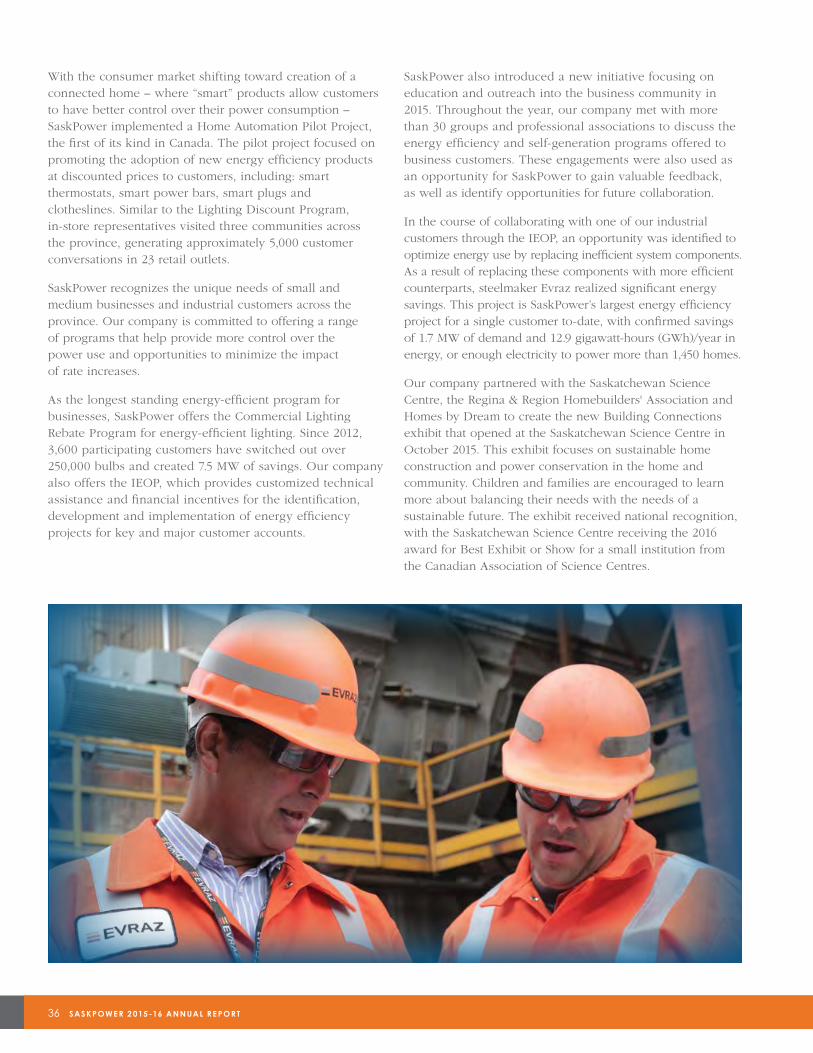
CONNECTING TO EFF ICIENCY SaskPower’s Industrial Energy Optimization Program (IEOP) provides
customers with customized technical assistance as well as financial incentives for the identification, development and implementation of energy efficiency
projects. Through the IEOP, steelmaker EVRAZ was able to optimize energy use in its particulate collection system. Confirmed savings are 1.7 MW of demand and
12.9 gigawatt hours/year in energy, which represents SaskPower’s largest industrial energy efficiency project for a single customer to-date.

SASKPOWE R 2 015 -16 ANNUAL RE PORT 23

24 SASKPOWE R 2 015 -16 ANNUAL RE PORT
CONNECTING TO INCLUSIVITY
Once again named one of Canada’s Best Diversity Employers, our company places a premium on workplace diversity and inclusiveness. SaskPower’s
Diversity Program is made up of several affinity groups, many of which work together to organize special events and awareness campaigns.

SASKPOWE R 2 015 -16 ANNUAL RE PORT 25
CONNECTING TO COMMUNITY
SaskPower’s Knapsack Program aims to help keep kids in school by providing them everything they need for success, as statistics show children are less likely to
attend school if their families cannot afford school supplies. For each of the past six summers, SaskPower employees have collected enough supplies for an entire
school. During the past year, knapsacks filled with over 14,000 school supplies were delivered to students at the Prince Arthur Community School in Moose Jaw.

26 SASKPOWE R 2 015 -16 ANNUAL RE PORT
MANAGEMENT'S DISCUSSION AND ANALYSIS
June 1, 2016
The following is a discussion of the consolidated
financial condition and results of the operations
of Saskatchewan Power Corporation (SaskPower;
the Corporation) for the 12 months ended
December 31, 2015, and the 15 months ended
March 31, 2016. It should be read in conjunction with
the audited financial statements and accompanying
notes. The financial information discussed herein has
been prepared in accordance with International
Financial Reporting Standards (IFRS).
Under the direction of the Government of
Saskatchewan Ministry of Finance, the Corporation's
financial reporting year-end has transitioned from
December 31 to March 31. This change will bring
alignment across the Crowns and government for
budgeting, planning and reporting purposes. For
the current transition year, comparative information
is presented for the 2014 and 2015 calendar years
(SaskPower's prior fiscal reporting period). As well,
financial results are provided for the first three months
of 2016 and the 15 months ended March 31, 2016.
This management’s discussion and analysis (MD&A)
contains forward-looking statements based on the
Corporation’s estimates and assumptions concerning
future results and events. Due to the risks and
uncertainties inherent in any forecast outlook, the
actual results of the Corporation could differ materially
from those anticipated. These risks and uncertainties
include natural gas prices; coal and hydro availability;
weather; economic conditions; number of customers;
and market conditions in other jurisdictions.
CONTENTS27 Our business
28 Our capability to deliver results
30 Our enterprise-wide strategic context
32 Our performance measures, targets and strategic initiatives
62 2015-16 financial results
71 2015-16 quarterly results
72 Financial condition
73 Liquidity and capital resources
78 Capital investments
80 Outlook
82 Analysis of critical accounting policies and estimates
85 Recent and future accounting policy changes
86 Risk management
MANAGEMENT’S DISCUSSION AND ANALYSIS 27MANAGEMENT’S DISCUSSION AND ANALYSIS 27
OUR BUSINESS
At SaskPower, we are committed to supporting economic growth and enhancing quality of life in Saskatchewan. At the foundation of our business strategy is the pursuit of our vision of being an industry-leading company, powering Saskatchewan through innovation, performance and service. We work around the clock to provide power generation, transmission and distribution services to almost 522,000 customer accounts. Our company prides itself on maintaining one of the largest service areas in Canada — a geographic region of approximately 652,000 square kilometres.
SaskPower is a vertically integrated utility with nearly 3,150 permanent full-time employees. Almost one-half of our workforce is comprised of members of the International Brotherhood of Electrical Workers Local 2067. Approximately 15% of workers belong to Unifor Local 649, with out-of-scope staff accounting for the balance.
Our company manages more than $10 billion in assets, relying on a generating fleet that uses a wide range of fuels that include natural gas, coal, hydro, and wind. This diversity provides a hedge against supply and price volatility, protecting customers from some of the risk inherent in any single fuel. SaskPower has two wholly owned subsidiaries — NorthPoint Energy Solutions and SaskPower International.
521,745 NUMBER OF CUSTOMER ACCOUNTS
MANDATESaskPower traces its origins to the Saskatchewan Power Commission that was founded in 1929. In 1949, our company was incorporated as a provincial Crown corporation under the authority and mandate of The Power Corporation Act (the Act). The Act has had a number of modifications over its lifetime. However, SaskPower’s mission — ensuring reliable, sustainable and cost-effective power — has not fundamentally changed.
The Act grants SaskPower the exclusive franchise within the province of Saskatchewan (except for the City of Saskatoon and the City of Swift Current) to supply, transmit and distribute electricity, as well as to provide retail services to customers. The reseller class of customer is
restricted to two cities that retained their municipal franchise — the City of Swift Current and the City of Saskatoon.
SaskPower opened Saskatchewan’s wholesale electricity market to competition through an open access transmission tariff (OATT) in 2001. It allows competitors to schedule access to our transmission system, enabling them to wheel power through Saskatchewan or sell to SaskPower’s wholesale (reseller) customers.
Our company’s vision, mission and values flow from the Act and SaskPower’s relationship with our parent company, Crown Investments Corporation (CIC) of Saskatchewan. We support the strategic direction provided by CIC. In turn, CIC is responsive to general government
direction as articulated in a variety of ways, such as through the annual Speech from the Throne or formal policy statements.
Pursuant to the Act, the President and Chief Executive Officer of SaskPower reports to a Board of Directors appointed by the Lieutenant Governor in Council. Through the Chair, our company’s Board of Directors is accountable to the Minister Responsible for Saskatchewan Power Corporation. The Minister functions as a link between SaskPower and provincial cabinet, as well as the Saskatchewan Legislative Assembly.
28 SASKPOWE R 2 015 -16 ANNUAL RE PORT
OUR CAPABILITY TO DELIVER RESULTS
SaskPower maintains an extensive province-wide system of generation, transmission and distribution assets. With a history of innovation spanning more than 85 years, our company remains focused on strengthening our customers’ experience while achieving our mission of providing Saskatchewan with a reliable, sustainable and cost-effective supply of electricity.
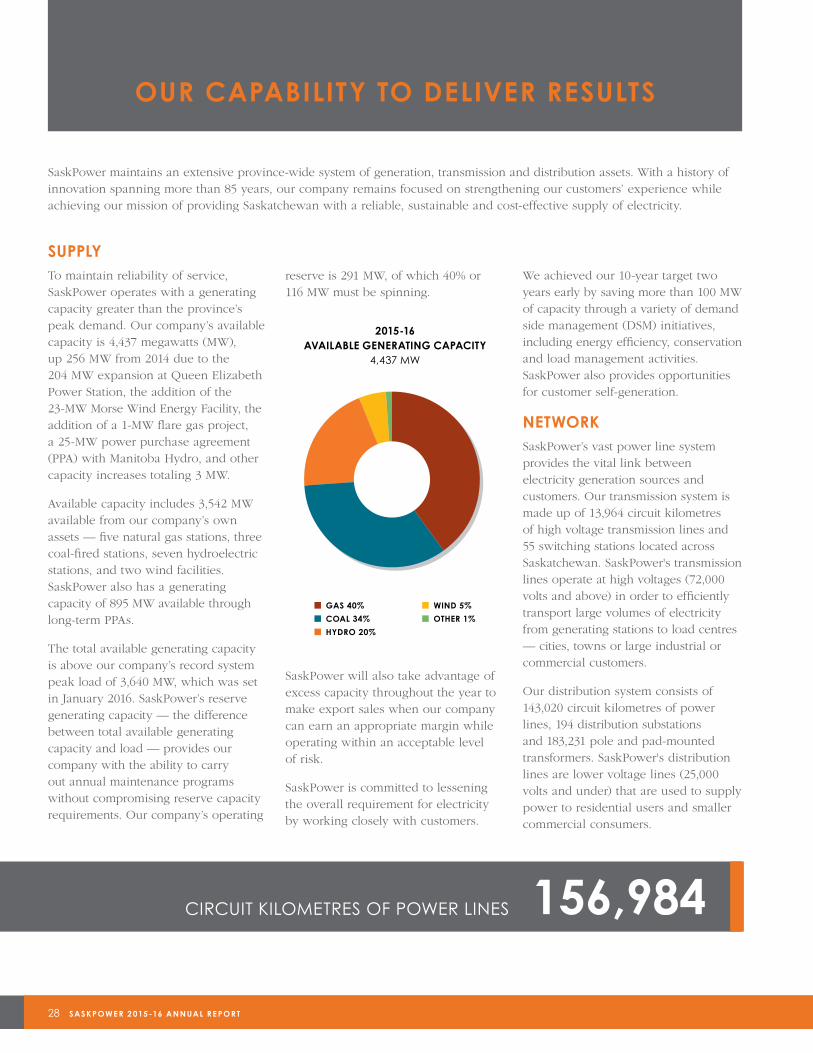
SUPPLYTo maintain reliability of service, SaskPower operates with a generating capacity greater than the province’s peak demand. Our company’s available capacity is 4,437 megawatts (MW), up 256 MW from 2014 due to the 204 MW expansion at Queen Elizabeth Power Station, the addition of the 23-MW Morse Wind Energy Facility, theaddition of a 1-MW flare gas project,a 25-MW power purchase agreement(PPA) with Manitoba Hydro, and othercapacity increases totaling 3 MW.
Available capacity includes 3,542 MW available from our company’s own assets — five natural gas stations, three coal-fired stations, seven hydroelectric stations, and two wind facilities. SaskPower also has a generating capacity of 895 MW available through long-term PPAs.
The total available generating capacity is above our company’s record system peak load of 3,640 MW, which was set in January 2016. SaskPower’s reserve generating capacity — the difference between total available generating capacity and load — provides our company with the ability to carry out annual maintenance programs without compromising reserve capacity requirements. Our company’s operating
reserve is 291 MW, of which 40% or 116 MW must be spinning.
2015-16 AVAILABLE GENERATING CAPACITY
4,437 MW
SaskPower will also take advantage of excess capacity throughout the year to make export sales when our company can earn an appropriate margin while operating within an acceptable level of risk.
SaskPower is committed to lessening the overall requirement for electricity by working closely with customers.
We achieved our 10-year target two years early by saving more than 100 MW of capacity through a variety of demand side management (DSM) initiatives, including energy efficiency, conservation and load management activities. SaskPower also provides opportunities for customer self-generation.
NETWORK SaskPower’s vast power line system provides the vital link between electricity generation sources and customers. Our transmission system is made up of 13,964 circuit kilometres of high voltage transmission lines and 55 switching stations located across Saskatchewan. SaskPower's transmission lines operate at high voltages (72,000 volts and above) in order to efficiently transport large volumes of electricity from generating stations to load centres — cities, towns or large industrial or commercial customers.
Our distribution system consists of 143,020 circuit kilometres of power lines, 194 distribution substations and 183,231 pole and pad-mounted transformers. SaskPower's distribution lines are lower voltage lines (25,000 volts and under) that are used to supply power to residential users and smaller commercial consumers.
156,984CIRCUIT KILOMETRES OF POWER LINES
Other
Wind
Hydro
Coal
Gas
■ GAS 40% ■ WIND 5%
■ COAL 34% ■ OTHER 1%
■ HYDRO 20%
MANAGEMENT’S DISCUSSION AND ANALYSIS 29
SaskPower’s infrastructure includes the Grid Control Centre, which directs the safe and reliable operation of the power system, as well as the Supervisory Control and Data Acquisition (SCADA) system that enables the remote operation and control of our facilities. The challenge of managing our transmission and distribution systems is considerable because of the large geographic size of the province, locations of various sources of generation, and a dispersed and relatively small population.
SaskPower has transmission interconnections with Manitoba, Alberta and North Dakota. These provide our company with the capability to import or export electricity to meet higher internal demand or take advantage of export market opportunities. Under normal system conditions, the import capability is up to 220 MW from Manitoba, 75 MW from Alberta and 50 MW from North Dakota. The export capability is up to 90 MW to Manitoba, 153 MW to Alberta and 100 MW to North Dakota.
These interconnection capabilities vary with system conditions, including generation and load level. In compliance with the OATT, SaskPower is required to compete with other suppliers for access to these interconnections.
OUTLOOKSaskPower is currently in one of the most challenging eras in company history. While growth in Saskatchewan is tapering off, in recent years SaskPower has directed a great deal of resources
to facilitate unprecedented economic and population expansion.
Meanwhile, our company's generation, transmission and distribution infrastructure is aging and will require us to rebuild, replace or renew it in its entirety over the next 40 years.
As well, challenges associated with climate change are heightening. Federal carbon dioxide (CO
2) emissions
regulations are in place that will eliminate one of our primary baseload electricity sources — conventional coal-fired generation. In addition, CO
2 regulations
governing natural gas generation emissions are expected in the future.
Peak load records continue to be set annually, signalling our ongoing need to source new generation. Large-scale industrial and commercial customers represent a significant amount of Saskatchewan's total electricity demand — less than 50 customers account for almost 40% of our province's load. Decisions made by these large customers can significantly affect the province's electricity requirements.
To address the challenges around meeting future demand, we are continuously engaged in extensive system planning. A new Integrated Resource Plan — bringing together a strategic outlook for generation supply, the transmission system and DSM activities — is expected in 2016-17.
Over the past five fiscal years, SaskPower has added 641 MW of new capacity while retiring 156 MW of coal-fired generation and an additional 30 MW of other generation.
We have also reached an agreement with Manitoba Hydro to import 100 MW of firm capacity from 2020 to 2040. Approximately 350 MW will be added to the system via a combined cycle gas turbine near Swift Current in 2019.
During the year, SaskPower and the province announced our renewables strategy with an objective of reaching up to 50% renewable capacity by 2030. Our target is to reduce SaskPower’s greenhouse gas emissions by over 40% from 2005 levels by 2030.
It is expected that significant additions of wind power will be augmented by other renewables, such as biomass and solar. In fact, our longer-term goal is to have 30% wind power capacity — involving the addition of up to 1,600 MW — by 2030. Meanwhile, our company estimates the addition of 100-300 MW of solar generation during the same time period.
In 2016-17, our company will be investing significantly in the grid as well, with an estimated $148 million directed to transmission and distribution sustainment projects and $256 million directed to transmission and distribution growth projects.
50% TARGETED AMOUNT OF RENEWABLE GENERATION CAPACITY BY 2030
30 SASKPOWE R 2 015 -16 ANNUAL RE PORT
OUR ENTERPRISE-WIDE STRATEGIC CONTEXT
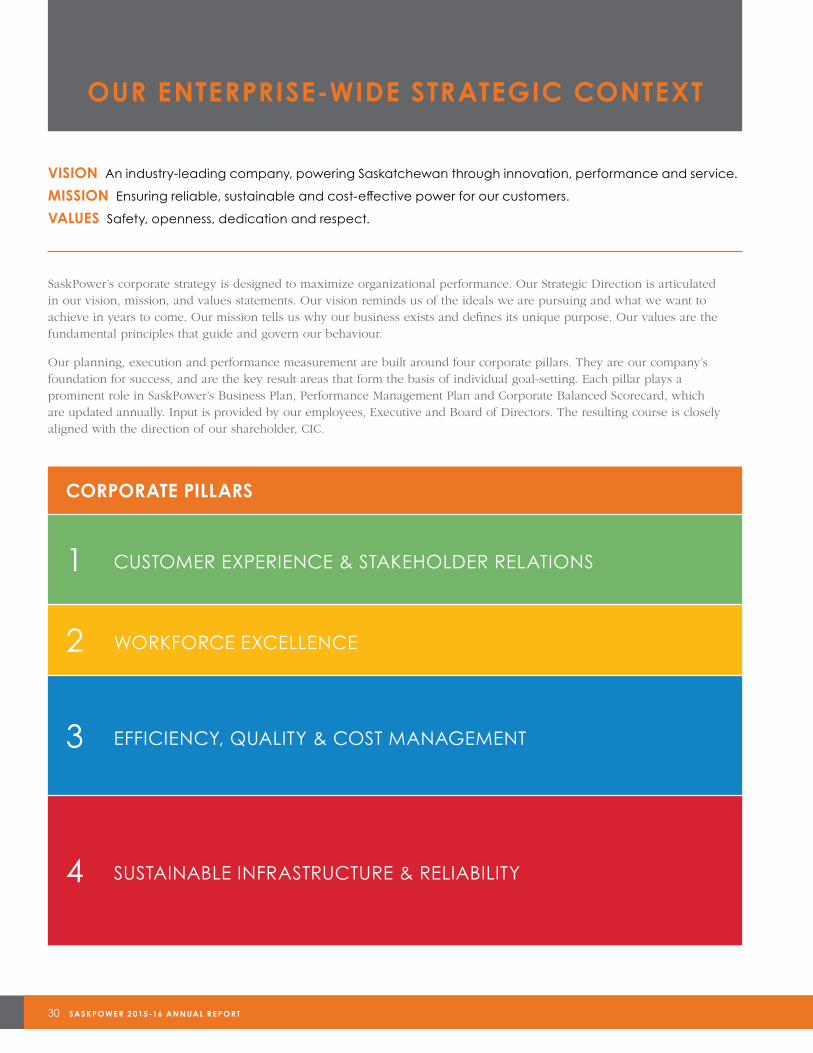
VISION An industry-leading company, powering Saskatchewan through innovation, performance and service.
MISSION Ensuring reliable, sustainable and cost-effective power for our customers.
VALUES Safety, openness, dedication and respect.
SaskPower’s corporate strategy is designed to maximize organizational performance. Our Strategic Direction is articulated in our vision, mission, and values statements. Our vision reminds us of the ideals we are pursuing and what we want to achieve in years to come. Our mission tells us why our business exists and defines its unique purpose. Our values are the fundamental principles that guide and govern our behaviour.
Our planning, execution and performance measurement are built around four corporate pillars. They are our company’s foundation for success, and are the key result areas that form the basis of individual goal-setting. Each pillar plays a prominent role in SaskPower’s Business Plan, Performance Management Plan and Corporate Balanced Scorecard, which are updated annually. Input is provided by our employees, Executive and Board of Directors. The resulting course is closely aligned with the direction of our shareholder, CIC.
CORPORATE PILLARS
1 CUSTOMER EXPERIENCE & STAKEHOLDER RELATIONS
2 WORKFORCE EXCELLENCE
3 EFFICIENCY, QUALITY & COST MANAGEMENT
4 SUSTAINABLE INFRASTRUCTURE & RELIABILITY
MANAGEMENT’S DISCUSSION AND ANALYSIS 31
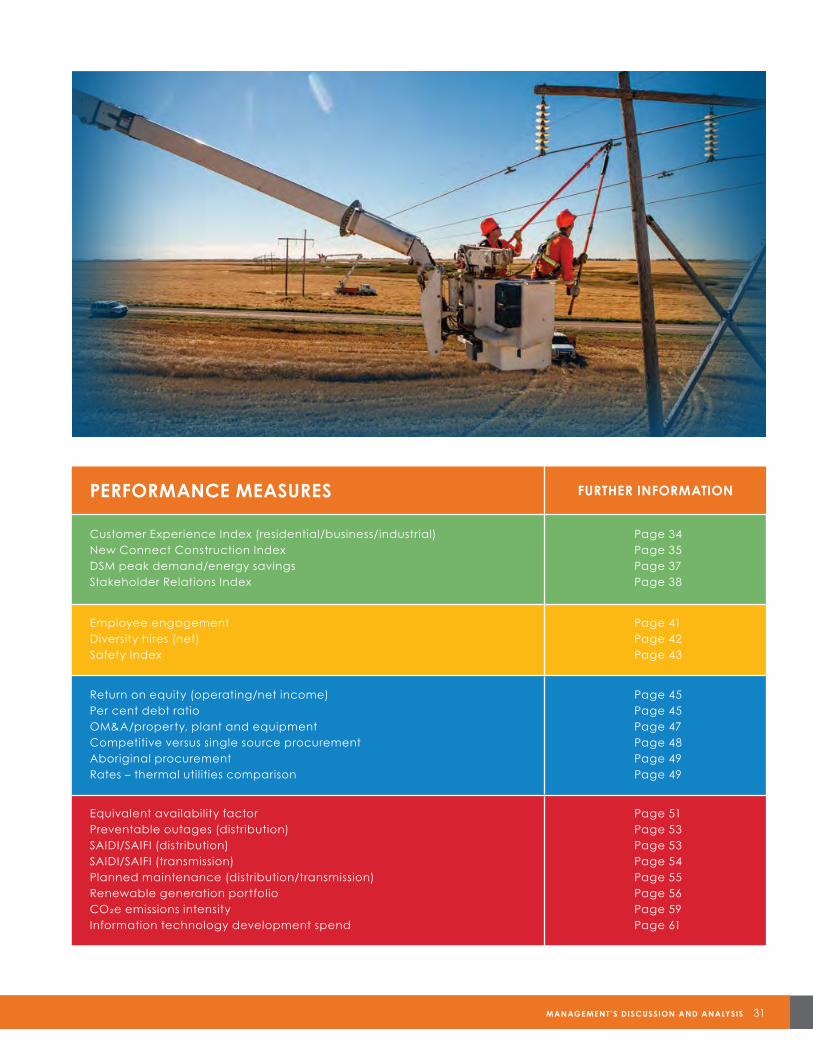
PERFORMANCE MEASURES FURTHER INFORMATION
Customer Experience Index (residential/business/industrial)New Connect Construction IndexDSM peak demand/energy savingsStakeholder Relations Index
Page 34Page 35Page 37Page 38
Employee engagementDiversity hires (net)Safety Index
Page 41Page 42Page 43
Return on equity (operating/net income)Per cent debt ratioOM&A/property, plant and equipmentCompetitive versus single source procurementAboriginal procurementRates – thermal utilities comparison
Page 45Page 45Page 47Page 48Page 49Page 49
Equivalent availability factorPreventable outages (distribution)SAIDI/SAIFI (distribution)SAIDI/SAIFI (transmission)Planned maintenance (distribution/transmission)Renewable generation portfolioCO2e emissions intensityInformation technology development spend
Page 51Page 53Page 53Page 54Page 55Page 56Page 59Page 61
32 SASKPOWE R 2 015 -16 ANNUAL RE PORT
OUR PERFORMANCE MEASURES, TARGETSAND STRATEGIC INITIATIVES
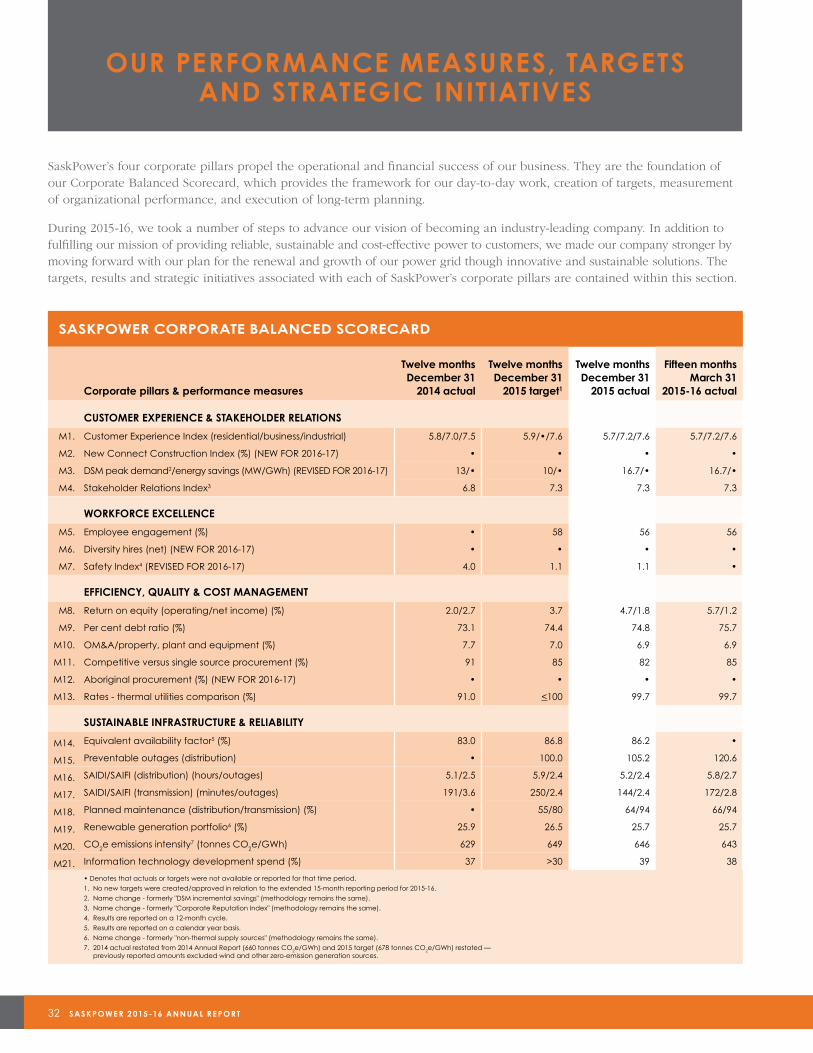
SaskPower’s four corporate pillars propel the operational and financial success of our business. They are the foundation of our Corporate Balanced Scorecard, which provides the framework for our day-to-day work, creation of targets, measurement of organizational performance, and execution of long-term planning.
During 2015-16, we took a number of steps to advance our vision of becoming an industry-leading company. In addition to fulfilling our mission of providing reliable, sustainable and cost-effective power to customers, we made our company stronger by moving forward with our plan for the renewal and growth of our power grid though innovative and sustainable solutions. The targets, results and strategic initiatives associated with each of SaskPower’s corporate pillars are contained within this section.
SASKPOWER CORPORATE BALANCED SCORECARD
Corporate pillars & performance measures
Twelve months December 31
2014 actual
Twelve months December 31
2015 target1
Twelve months December 31
2015 actual
Fifteen months March 31
2015-16 actual
CUSTOMER EXPERIENCE & STAKEHOLDER RELATIONS
M1. Customer Experience Index (residential/business/industrial) 5.8/7.0/7.5 5.9/•/7.6 5.7/7.2/7.6 5.7/7.2/7.6
M2. New Connect Construction Index (%) (NEW FOR 2016-17) • • • •
M3. DSM peak demand2/energy savings (MW/GWh) (REVISED FOR 2016-17) 13/• 10/• 16.7/• 16.7/•
M4. Stakeholder Relations Index3 6.8 7.3 7.3 7.3
WORKFORCE EXCELLENCE
M5. Employee engagement (%) • 58 56 56
M6. Diversity hires (net) (NEW FOR 2016-17) • • • •
M7. Safety Index4 (REVISED FOR 2016-17) 4.0 1.1 1.1 •
EFFICIENCY, QUALITY & COST MANAGEMENT
M8. Return on equity (operating/net income) (%) 2.0/2.7 3.7 4.7/1.8 5.7/1.2
M9. Per cent debt ratio (%) 73.1 74.4 74.8 75.7
M10. OM&A/property, plant and equipment (%) 7.7 7.0 6.9 6.9
M11. Competitive versus single source procurement (%) 91 85 82 85
M12. Aboriginal procurement (%) (NEW FOR 2016-17) • • • •
M13. Rates - thermal utilities comparison (%) 91.0 <100 99.7 99.7
SUSTAINABLE INFRASTRUCTURE & RELIABILITY
M14. Equivalent availability factor5 (%) 83.0 86.8 86.2 •
M15. Preventable outages (distribution) • 100.0 105.2 120.6
M16. SAIDI/SAIFI (distribution) (hours/outages) 5.1/2.5 5.9/2.4 5.2/2.4 5.8/2.7
M17. SAIDI/SAIFI (transmission) (minutes/outages) 191/3.6 250/2.4 144/2.4 172/2.8
M18. Planned maintenance (distribution/transmission) (%) • 55/80 64/94 66/94
M19. Renewable generation portfolio6 (%) 25.9 26.5 25.7 25.7
M20. CO2e emissions intensity7 (tonnes CO2e/GWh) 629 649 646 643
M21. Information technology development spend (%) 37 >30 39 38
• Denotes that actuals or targets were not available or reported for that time period.1. No new targets were created/approved in relation to the extended 15-month reporting period for 2015-16.2. Name change - formerly "DSM incremental savings" (methodology remains the same).3. Name change - formerly "Corporate Reputation Index" (methodology remains the same).4. Results are reported on a 12-month cycle.5. Results are reported on a calendar year basis.6. Name change - formerly "non-thermal supply sources" (methodology remains the same).7. 2014 actual restated from 2014 Annual Report (660 tonnes CO2e/GWh) and 2015 target (678 tonnes CO2e/GWh) restated —
previously reported amounts excluded wind and other zero-emission generation sources.
MANAGEMENT’S DISCUSSION AND ANALYSIS 33
OUR BUSINESS IS DEFINED BY OUR
RELATIONSHIPS WITH CUSTOMERS AND
STAKEHOLDERS AT ALL LEVELS. WE ARE
WORKING TO PROVIDE OUR CUSTOMERS
WITH MORE CHOICE, CONTROL AND
CONVENIENCE, WHILE IMPROVING OUR
COMMUNICATION AND TRANSPARENCY BY
ENGAGING ON WHAT MATTERS MOST TO
THEM. WE WELCOME DIALOGUE AND
WORK TO CREATE OPPORTUNITIES FOR
STAKEHOLDERS TO PROVIDE INPUT.
CORPORATE PILLAR 1
CUSTOMER EXPERIENCE &STAKEHOLDER RELATIONS
CUSTOMER EXPERIENCEDelivering an exceptional customer experience is a top priority for our company. Customers continue to expect more choice and control over their electrical service to help make their lives easier. SaskPower’s customer experience strategy focuses on the four key areas that have the greatest impact on customer experience:
• Create a customer-focused culture – Build a workplaceenvironment that puts the customer first and recognizesthe benefits of focusing on customers.
• Optimize customer interactions – Meet customerexpectations during every interaction by consistentlyproviding high quality, convenient service on their terms.
• Deliver value to customers – Develop services thatprovide customers with greater control over theirpower use and opportunities to minimize the impactof rate increases.
• Engage customers and stakeholders – Build positivecustomer relationships through active promotionof programs and services and frequentcustomer engagement.
Our customers expect us to deliver segment-specific programs, services and support; provide faster and easier access to information that matters to them; increase customer engagement and transparency; and deliver reliable power. SaskPower continues to demonstrate its customer focus through continuous improvements to service delivery and enhancements to programs and services, such as:
KEY AND MAJOR CUSTOMERS
• Delivering personalized service – SaskPower remainscommitted to providing an enhanced level of service toour largest industrial and commercial accounts throughdedicated key account managers, assigned Executivesponsors, regular strategic meetings, and dialogueregarding power rates and system reliability.
• Demonstrating a commitment to better understandour customers’ businesses – SaskPower participates incustomer-coordinated site tours and hosts operationsand plant tours and demonstrations to facilitate a mutualunderstanding of each other’s businesses.
r
1,115,728 NUMBER OF CUSTOMER TELEPHONE INQUIRIES
34 SASKPOWE R 2 015 -16 ANNUAL RE PORT
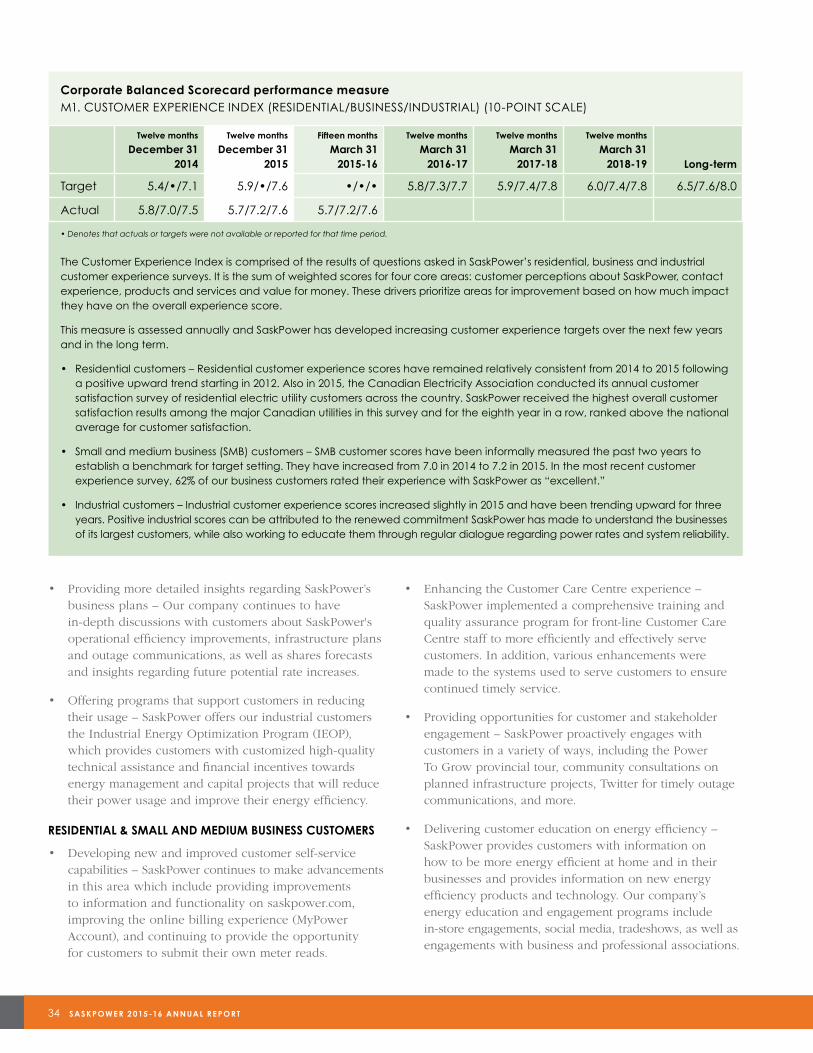
Corporate Balanced Scorecard performance measureM1. CUSTOMER EXPERIENCE INDEX (RESIDENTIAL/BUSINESS/INDUSTRIAL) (10-POINT SCALE)
Twelve months
December 312014
Twelve months
December 31 2015
Fifteen months
March 312015-16
Twelve months
March 312016-17
Twelve months
March 312017-18
Twelve months
March 312018-19 Long-term
Target 5.4/•/7.1 5.9/•/7.6 •/•/• 5.8/7.3/7.7 5.9/7.4/7.8 6.0/7.4/7.8 6.5/7.6/8.0
Actual 5.8/7.0/7.5 5.7/7.2/7.6 5.7/7.2/7.6
• Denotes that actuals or targets were not available or reported for that time period.
The Customer Experience Index is comprised of the results of questions asked in SaskPower’s residential, business and industrial customer experience surveys. It is the sum of weighted scores for four core areas: customer perceptions about SaskPower, contact experience, products and services and value for money. These drivers prioritize areas for improvement based on how much impact they have on the overall experience score.
This measure is assessed annually and SaskPower has developed increasing customer experience targets over the next few years and in the long term.
• Residential customers – Residential customer experience scores have remained relatively consistent from 2014 to 2015 followinga positive upward trend starting in 2012. Also in 2015, the Canadian Electricity Association conducted its annual customersatisfaction survey of residential electric utility customers across the country. SaskPower received the highest overall customersatisfaction results among the major Canadian utilities in this survey and for the eighth year in a row, ranked above the nationalaverage for customer satisfaction.
• Small and medium business (SMB) customers – SMB customer scores have been informally measured the past two years toestablish a benchmark for target setting. They have increased from 7.0 in 2014 to 7.2 in 2015. In the most recent customerexperience survey, 62% of our business customers rated their experience with SaskPower as “excellent.”
• Industrial customers – Industrial customer experience scores increased slightly in 2015 and have been trending upward for threeyears. Positive industrial scores can be attributed to the renewed commitment SaskPower has made to understand the businessesof its largest customers, while also working to educate them through regular dialogue regarding power rates and system reliability.
• Providing more detailed insights regarding SaskPower’sbusiness plans – Our company continues to havein-depth discussions with customers about SaskPower'soperational efficiency improvements, infrastructure plansand outage communications, as well as shares forecastsand insights regarding future potential rate increases.
• Offering programs that support customers in reducingtheir usage – SaskPower offers our industrial customersthe Industrial Energy Optimization Program (IEOP),which provides customers with customized high-qualitytechnical assistance and financial incentives towardsenergy management and capital projects that will reducetheir power usage and improve their energy efficiency.
RESIDENTIAL & SMALL AND MEDIUM BUSINESS CUSTOMERS
• Developing new and improved customer self-servicecapabilities – SaskPower continues to make advancementsin this area which include providing improvementsto information and functionality on saskpower.com,improving the online billing experience (MyPowerAccount), and continuing to provide the opportunityfor customers to submit their own meter reads.
• Enhancing the Customer Care Centre experience –SaskPower implemented a comprehensive training andquality assurance program for front-line Customer CareCentre staff to more efficiently and effectively servecustomers. In addition, various enhancements weremade to the systems used to serve customers to ensurecontinued timely service.
• Providing opportunities for customer and stakeholderengagement – SaskPower proactively engages withcustomers in a variety of ways, including the PowerTo Grow provincial tour, community consultations onplanned infrastructure projects, Twitter for timely outagecommunications, and more.
• Delivering customer education on energy efficiency –SaskPower provides customers with information onhow to be more energy efficient at home and in theirbusinesses and provides information on new energyefficiency products and technology. Our company’senergy education and engagement programs includein-store engagements, social media, tradeshows, as well asengagements with business and professional associations.
MANAGEMENT’S DISCUSSION AND ANALYSIS 35
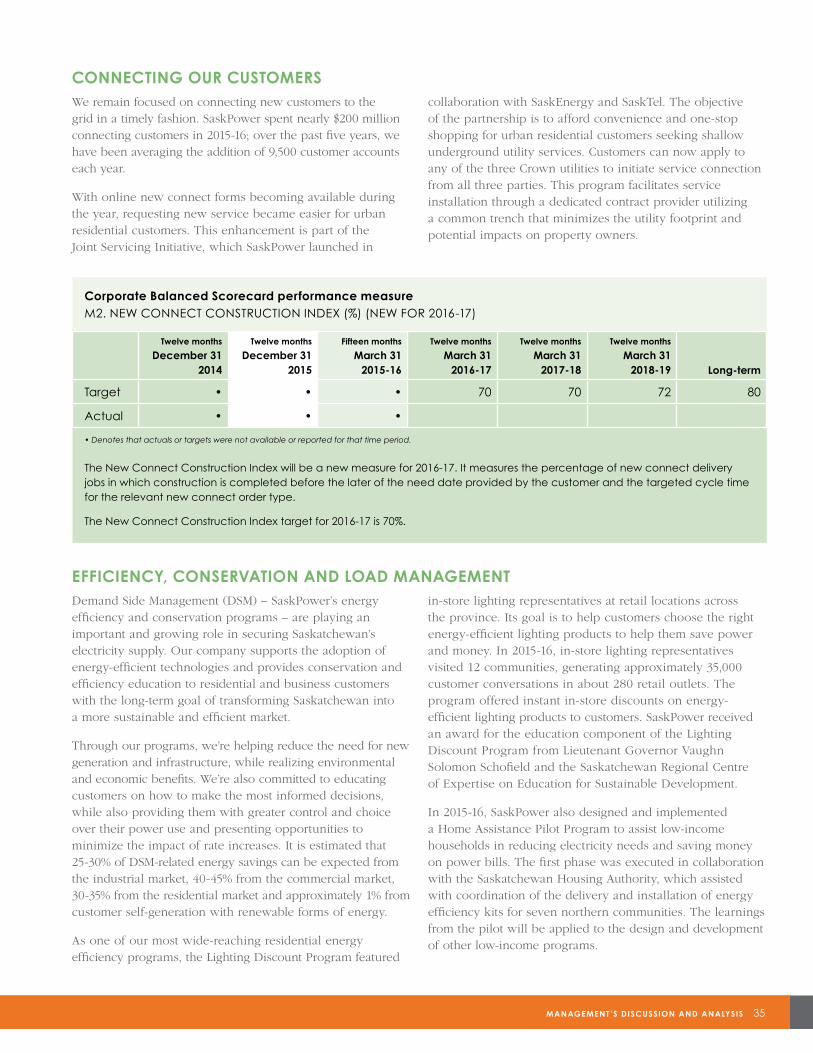
Corporate Balanced Scorecard performance measureM2. NEW CONNECT CONSTRUCTION INDEX (%) (NEW FOR 2016-17)
Twelve months
December 312014
Twelve months
December 31 2015
Fifteen months
March 312015-16
Twelve months
March 312016-17
Twelve months
March 312017-18
Twelve months
March 312018-19 Long-term
Target • • • 70 70 72 80
Actual • • •
• Denotes that actuals or targets were not available or reported for that time period.
The New Connect Construction Index will be a new measure for 2016-17. It measures the percentage of new connect delivery jobs in which construction is completed before the later of the need date provided by the customer and the targeted cycle time for the relevant new connect order type.
The New Connect Construction Index target for 2016-17 is 70%.
CONNECTING OUR CUSTOMERSWe remain focused on connecting new customers to the grid in a timely fashion. SaskPower spent nearly $200 million connecting customers in 2015-16; over the past five years, we have been averaging the addition of 9,500 customer accounts each year.
With online new connect forms becoming available during the year, requesting new service became easier for urban residential customers. This enhancement is part of the Joint Servicing Initiative, which SaskPower launched in
collaboration with SaskEnergy and SaskTel. The objective of the partnership is to afford convenience and one-stop shopping for urban residential customers seeking shallow underground utility services. Customers can now apply to any of the three Crown utilities to initiate service connection from all three parties. This program facilitates service installation through a dedicated contract provider utilizing a common trench that minimizes the utility footprint and potential impacts on property owners.
EFFICIENCY, CONSERVATION AND LOAD MANAGEMENTDemand Side Management (DSM) – SaskPower’s energy efficiency and conservation programs – are playing an important and growing role in securing Saskatchewan’s electricity supply. Our company supports the adoption of energy-efficient technologies and provides conservation and efficiency education to residential and business customers with the long-term goal of transforming Saskatchewan into a more sustainable and efficient market.
Through our programs, we’re helping reduce the need for new generation and infrastructure, while realizing environmental and economic benefits. We’re also committed to educating customers on how to make the most informed decisions, while also providing them with greater control and choice over their power use and presenting opportunities to minimize the impact of rate increases. It is estimated that 25-30% of DSM-related energy savings can be expected from the industrial market, 40-45% from the commercial market, 30-35% from the residential market and approximately 1% from customer self-generation with renewable forms of energy.
As one of our most wide-reaching residential energy efficiency programs, the Lighting Discount Program featured
in-store lighting representatives at retail locations across the province. Its goal is to help customers choose the right energy-efficient lighting products to help them save power and money. In 2015-16, in-store lighting representatives visited 12 communities, generating approximately 35,000 customer conversations in about 280 retail outlets. The program offered instant in-store discounts on energy-efficient lighting products to customers. SaskPower received an award for the education component of the Lighting Discount Program from Lieutenant Governor Vaughn Solomon Schofield and the Saskatchewan Regional Centre of Expertise on Education for Sustainable Development.
In 2015-16, SaskPower also designed and implemented a Home Assistance Pilot Program to assist low-income households in reducing electricity needs and saving money on power bills. The first phase was executed in collaboration with the Saskatchewan Housing Authority, which assisted with coordination of the delivery and installation of energy efficiency kits for seven northern communities. The learnings from the pilot will be applied to the design and development of other low-income programs.
36 SASKPOWE R 2 015 -16 ANNUAL RE PORT
With the consumer market shifting toward creation of a connected home – where “smart” products allow customers to have better control over their power consumption – SaskPower implemented a Home Automation Pilot Project, the first of its kind in Canada. The pilot project focused on promoting the adoption of new energy efficiency products at discounted prices to customers, including: smart thermostats, smart power bars, smart plugs and clotheslines. Similar to the Lighting Discount Program, in-store representatives visited three communities across the province, generating approximately 5,000 customer conversations in 23 retail outlets.
SaskPower recognizes the unique needs of small and medium businesses and industrial customers across the province. Our company is committed to offering a range of programs that help provide more control over the power use and opportunities to minimize the impact of rate increases.
As the longest standing energy-efficient program for businesses, SaskPower offers the Commercial Lighting Rebate Program for energy-efficient lighting. Since 2012, 3,600 participating customers have switched out over 250,000 bulbs and created 7.5 MW of savings. Our company also offers the IEOP, which provides customized technical assistance and financial incentives for the identification, development and implementation of energy efficiency projects for key and major customer accounts.
SaskPower also introduced a new initiative focusing on education and outreach into the business community in 2015. Throughout the year, our company met with more than 30 groups and professional associations to discuss the energy efficiency and self-generation programs offered to business customers. These engagements were also used as an opportunity for SaskPower to gain valuable feedback, as well as identify opportunities for future collaboration.
In the course of collaborating with one of our industrial customers through the IEOP, an opportunity was identified to optimize energy use by replacing inefficient system components. As a result of replacing these components with more efficient counterparts, steelmaker Evraz realized significant energy savings. This project is SaskPower’s largest energy efficiency project for a single customer to-date, with confirmed savings of 1.7 MW of demand and 12.9 gigawatt-hours (GWh)/year in energy, or enough electricity to power more than 1,450 homes.
Our company partnered with the Saskatchewan Science Centre, the Regina & Region Homebuilders' Association and Homes by Dream to create the new Building Connections exhibit that opened at the Saskatchewan Science Centre in October 2015. This exhibit focuses on sustainable home construction and power conservation in the home and community. Children and families are encouraged to learn more about balancing their needs with the needs of a sustainable future. The exhibit received national recognition, with the Saskatchewan Science Centre receiving the 2016 award for Best Exhibit or Show for a small institution from the Canadian Association of Science Centres.
MANAGEMENT’S DISCUSSION AND ANALYSIS 37
STAKEHOLDER RELATIONSConsultation programs for SaskPower projects are designed to engage a wide variety of stakeholders and rights holders, including customers, communities, landowners, Aboriginal groups, businesses, municipalities, regulators and government agencies. Successful engagement with stakeholders is essential to obtaining regulatory approval in order to construct new infrastructure or upgrade existing facilities.
SaskPower’s consultation programs typically include early contact with local officials through delivery of project presentations; broad distribution of detailed project information; public open house information sessions; meetings with individuals and interest groups; media releases; advertisements; and direct correspondence and discussion.
In 2015-16, SaskPower engaged stakeholders on a variety of infrastructure projects, including the Martensville to Saskatoon 230-138 kilovolt (kV) Transmission Line; Aberdeen to Wolverine 230-kV Transmission Line; Pasqua to Swift Current 230-138-kVTransmission Line; Vale to Rowatt 230-kV Transmission Line;Pasqua to K+S Potash 230-kV Transmission Line; Superb138-25-kV Substation; Albert Park 72-25-kV Substation; andIsland Falls and Whitesand Dam Safety Projects.
Meanwhile, stakeholder consultations were completed in Swift Current regarding a potential site for a new natural gas generation project. In northern Saskatchewan, consultations were held related to SaskPower’s Trapper Compensation Program and Integrated Vegetation Management Program.
As well, support was also provided to the community of Black Lake as it held a vote related to the proposed Tazi Twé Hydroelectric Project. Results indicated a majority of residents are in favour of the project and a partnership with SaskPower. Partnership agreements are still pending and the project is subject to final approval from the provincial government.
SaskPower’s provincial Power to Grow tour continues to be successful in engaging residents about the province’s electrical infrastructure challenges and the urgent need to invest in our power system. Since launching the tour in July 2014, our company has made 227 stops in communities throughout Saskatchewan and has reached nearly 70,000 people.
ABORIGINAL RELATIONSSaskatchewan’s First Nations and Métis communities are key SaskPower stakeholders. This is reflected in our company’s
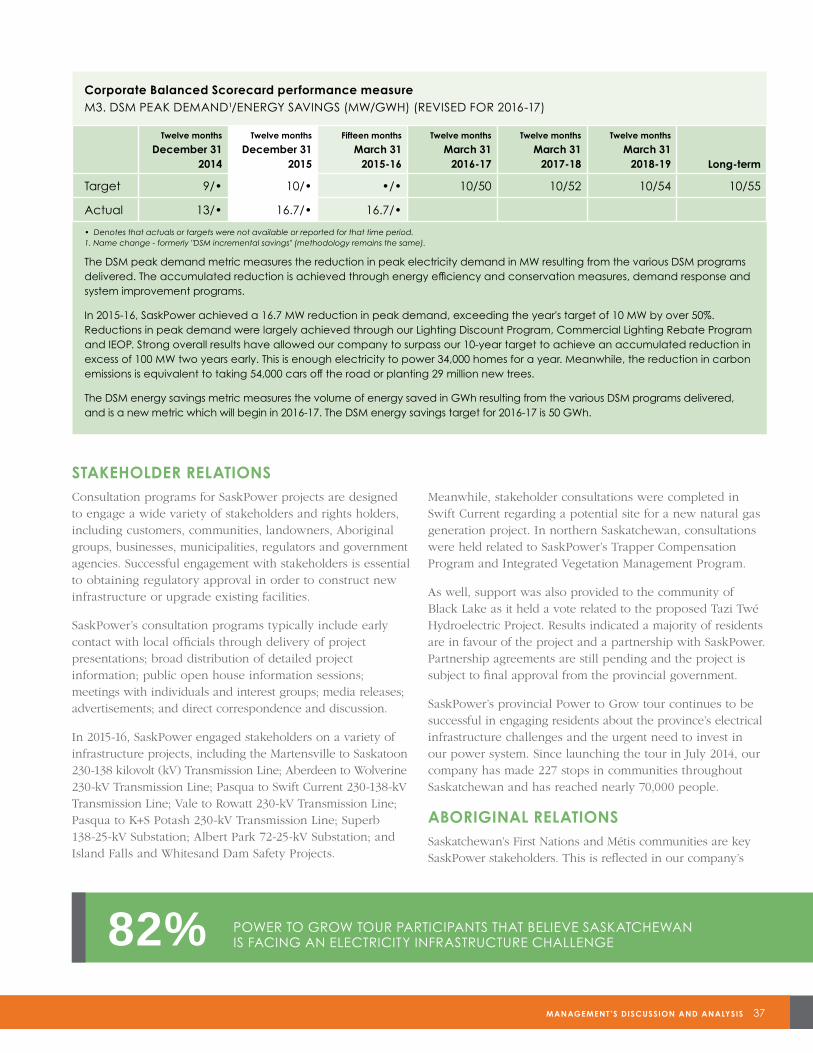
Corporate Balanced Scorecard performance measureM3. DSM PEAK DEMAND1/ENERGY SAVINGS (MW/GWH) (REVISED FOR 2016-17)
Twelve months
December 31 2014
Twelve months
December 31 2015
Fifteen months
March 312015-16
Twelve months
March 312016-17
Twelve months
March 312017-18
Twelve months
March 312018-19 Long-term
Target 9/• 10/• •/• 10/50 10/52 10/54 10/55
Actual 13/• 16.7/• 16.7/•
• Denotes that actuals or targets were not available or reported for that time period.1. Name change - formerly "DSM incremental savings" (methodology remains the same).
The DSM peak demand metric measures the reduction in peak electricity demand in MW resulting from the various DSM programs delivered. The accumulated reduction is achieved through energy efficiency and conservation measures, demand response and system improvement programs.
In 2015-16, SaskPower achieved a 16.7 MW reduction in peak demand, exceeding the year's target of 10 MW by over 50%. Reductions in peak demand were largely achieved through our Lighting Discount Program, Commercial Lighting Rebate Program and IEOP. Strong overall results have allowed our company to surpass our 10-year target to achieve an accumulated reduction in excess of 100 MW two years early. This is enough electricity to power 34,000 homes for a year. Meanwhile, the reduction in carbon emissions is equivalent to taking 54,000 cars off the road or planting 29 million new trees.
The DSM energy savings metric measures the volume of energy saved in GWh resulting from the various DSM programs delivered, and is a new metric which will begin in 2016-17. The DSM energy savings target for 2016-17 is 50 GWh.
82% POWER TO GROW TOUR PARTICIPANTS THAT BELIEVE SASKATCHEWANIS FACING AN ELECTRICITY INFRASTRUCTURE CHALLENGE
38 SASKPOWE R 2 015 -16 ANNUAL RE PORT
Aboriginal Relations Policy, which enables SaskPower to build positive long-term relationships with Aboriginal communities and facilitates the achievement of specific business objectives for SaskPower. It supports Aboriginal economic development activities in Saskatchewan and promotes clear and open communication in response to social, economic and environmental issues that are of mutual concern.
SaskPower is working closely with Aboriginal communities out of respect for Aboriginal people and culture, and because their input is an integral component of successful project development, project operation and mitigation of impacts. Our company is committed to informing and consulting with Aboriginal people and communities at an early stage with respect to planned activities, and we are incorporating traditional knowledge and community input along the way.
The formation of business partnerships is one way in which SaskPower and Aboriginal people, communities and businesses are mutually benefiting from electricity-related projects and operations. SaskPower is also focused on providing employment, contracting, and other opportunities. In Saskatchewan, the Aboriginal population is one of the fastest growing segments, and represents an important source of future employment.
In 2015-16, SaskPower transitioned its Aboriginal Relations area to an operational model. The department not only continues to help our company advance key Aboriginal initiatives identified in the strategic framework, but also continues to move forward efforts regarding resolution to outstanding historical issues. During the year, our company continued to strengthen existing relationships and build new connections with Aboriginal people as potential employees, customers, suppliers, contractors and partners in large business ventures.
Activities also included:
• Continuing to implement a five-year relationship andinvestment strategy with the northern village of Sandy Bay;
• Continuing efforts to increase Aboriginal businessparticipation, including refining our company's AboriginalProcurement Policy with specific language and weightingmeasures for requests for proposals (RFPs);
• Signing a renewed three-year funding agreement withFirst Nations Power Authority, increasing its capacity tofacilitate First Nations participation in power generationopportunities; and
• Supporting the facilitation and delivery of the NorthlandsCollege Power Line Technician Training Program.
During the year, SaskPower also continued a far north pilot project to further advance several first-ever projects that aim to improve energy efficiency, promote environmental protection, and employ people in northern Saskatchewan.
One notable example is the Athabasca Region Recycling Project. A continuation of a pilot project undertaken in 2014, it is an appliance recycling program that will remove approximately 250,000 pounds of solid and hazardous waste from the Black Lake First Nation in northern Saskatchewan.
The initiative has created 12 temporary full-time positions and provided valuable training opportunities and work experience to local residents. Environmental benefits include the removal of white metal appliances from on-reserve landfills and mitigation of environmental contamination from hazardous materials such as mercury, halocarbons, petro-chemical lubricants and CO
2.
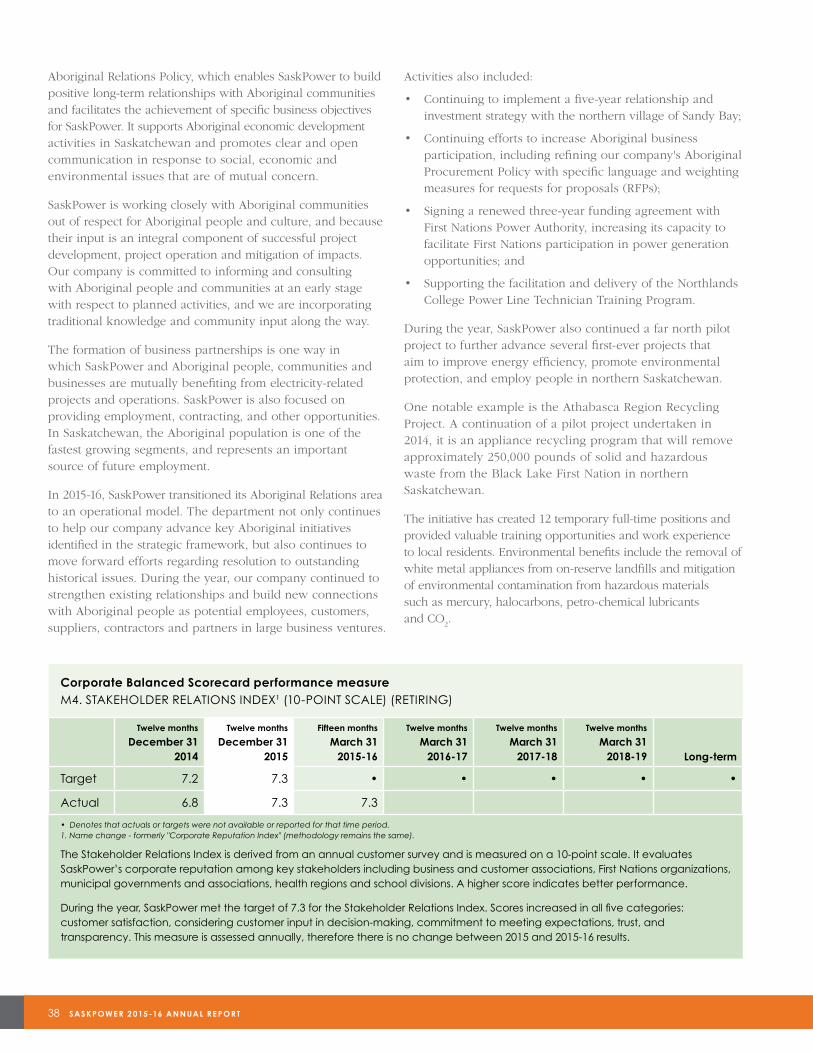
Corporate Balanced Scorecard performance measureM4. STAKEHOLDER RELATIONS INDEX1 (10-POINT SCALE) (RETIRING)
Twelve months
December 312014
Twelve months
December 312015
Fifteen months
March 312015-16
Twelve months
March 312016-17
Twelve months
March 312017-18
Twelve months
March 312018-19 Long-term
Target 7.2 7.3 • • • • •
Actual 6.8 7.3 7.3
• Denotes that actuals or targets were not available or reported for that time period.1. Name change - formerly "Corporate Reputation Index" (methodology remains the same).
The Stakeholder Relations Index is derived from an annual customer survey and is measured on a 10-point scale. It evaluates SaskPower’s corporate reputation among key stakeholders including business and customer associations, First Nations organizations, municipal governments and associations, health regions and school divisions. A higher score indicates better performance.
During the year, SaskPower met the target of 7.3 for the Stakeholder Relations Index. Scores increased in all five categories: customer satisfaction, considering customer input in decision-making, commitment to meeting expectations, trust, and transparency. This measure is assessed annually, therefore there is no change between 2015 and 2015-16 results.

MANAGEMENT’S DISCUSSION AND ANALYSIS 39
COMMUNITY INVOLVEMENTSaskPower's Community Investment Policy, which ensures our sponsorships are closely aligned to our company's strategic priorities, focuses on educational programming within three areas: workforce excellence (building our next generation of employees); safety (keeping our customers safe around electricity); and conservation and efficiency (creating a community of customers who find ways to save power and protect the environment). In 2015-16, our company invested just under $1.9 million in Saskatchewan communities.
Youth who are both our potential future customers and employees remain a key target audience for SaskPower. Throughout 2015-16, our company continued to focus on programs aimed at improving educational outcomes. Partnering with the YMCA of Moose Jaw, SaskPower sponsored the new Shared Services Mentorship Program, Steps 4 Success. The program specializes in self-esteem, belonging and identity-related subject matter. It ran in eight elementary and high schools throughout the Holy Trinity Catholic School and Prairie South School Divisions. The goal is to increase graduation rates while lowering dropout rates by providing students with resiliency skills, support, and resources to decrease barriers.
Meanwhile, for the sixth consecutive year SaskPower employees collected enough supplies for an entire school as part of our company's Knapsack Program. On the first day of the educational year, 300 backpacks containing more than 14,000 school supplies were delivered to elementary students at Moose Jaw’s Prince Arthur Community School. Statistics show children are less likely to attend school if their families cannot afford to provide them school supplies. The program
is aimed at keeping kids in school and providing them with the tools they need to succeed, with the intent that they will consider SaskPower as a future employer when entering high school and planning their careers.
After a decade of continuous support, SaskPower seized the opportunity in 2015 to become the title sponsor of the Northern Reading Program, organized by the Pahkisimon Nuye?ah Library System. This engaging program promotes literacy and higher learning in parts of the province where students may not always have the same opportunities as children in our larger towns and cities. While 21 communities participated in the program's Readingest Community in Northern Saskatchewan challenge, 10 schools were visited by the program's tour as part of Aboriginal Storytelling Month in Saskatchewan.
SaskPower also called on employees across the province to donate books for the new Power of Reading Program. Employees collected 4,490 books, exceeding the goal of 3,600. Across the province, 19 communities, including 11 in the North, will receive the books through a combined partnership with United Way Regina and KidsFirst. These books will give parents and caregivers an opportunity to sit down with their kids to develop reading skills, setting them up for success in school and strengthening their families.
In addition in 2015-16, SaskPower employees continued to be involved in their local communities. They logged over 6,200 hours of volunteer time and, on their behalf, SaskPower donated over $19,000. Employees from across the province also raised more than $336,000 (including SaskPower’s matching donation) for the United Way.
250,000 LBS APPROXIMATE TOTAL WEIGHT OF INEFFICIENT APPLIANCESTO BE REMOVED FROM BLACK LAKE DENESULINE FIRST NATION HOMES AND LANDFILLS
40 SASKPOWE R 2 015 -16 ANNUAL RE PORT
THE SUCCESS OF OUR COMPANY IS
DEPENDENT UPON THE STRENGTH
OF OUR WORKFORCE. WE STRIVE TO
BE AN EMPLOYER OF CHOICE, WITH
DEDICATED, ENGAGED EMPLOYEES
WORKING TO EXECUTE SASKPOWER’S
STRATEGY. ABOVE ALL ELSE, IN ALL
ACTIVITIES THE SAFETY OF OUR
EMPLOYEES AND THE PUBLIC IS VITAL.
CORPORATE PILLAR 2
WORKFORCE EXCELLENCE
OUR EMPLOYEESAt SaskPower, we know that our role in our province is more than keeping the lights on. We’re invested in the future of Saskatchewan, and we’re committed to making responsible decisions about our people and our communities as we work to power the province’s future. Part of that important investment is making sure we have the right people in the right places at the right time. This will ensure that we are positioned to meet the challenges we’re facing today and in the years ahead. We’re seeing growing demand, aging infrastructure and a complex labour environment; it’s more important than ever that we have a plan.
SaskPower’s age profile matches the typical North American corporate generational workforce of boom, bust and echo. Over the last five years, SaskPower has begun to see the impact of retirements — 453 employees retired while 226 employees remain working past the average retirement age of 59. The next retirement bubble will begin to hit SaskPower in 2016-17, with the peak year of potential retirements being 2020-21.
During the year, SaskPower’s workforce planning process continued to mature with 38 business areas developing people strategies. These rolled up into a Five-Year Workforce Plan that focuses on two main corporate themes: sourcing and recruitment of qualified applicants, as well as development and succession for critical positions.
Corporate-wide, SaskPower continues to enhance learning through implementation of new training programs, development of a new Succession Planning Program, and the maintenance of close relationships with both secondary and post-secondary schools. In addition, our company’s apprenticeship programs continue to ensure the availability of skilled employees such as industrial mechanics, electricians and power line technicians.
Power Engineers are critical to the electricity industry across the country, and these specialized positions are difficult to recruit. SaskPower, in partnership with the Prairie South School Division, has launched a new tool to help young people start their career in this profession.
453EMPLOYEE RETIREMENTS DURING THE LAST FIVE YEARS
MANAGEMENT’S DISCUSSION AND ANALYSIS 41
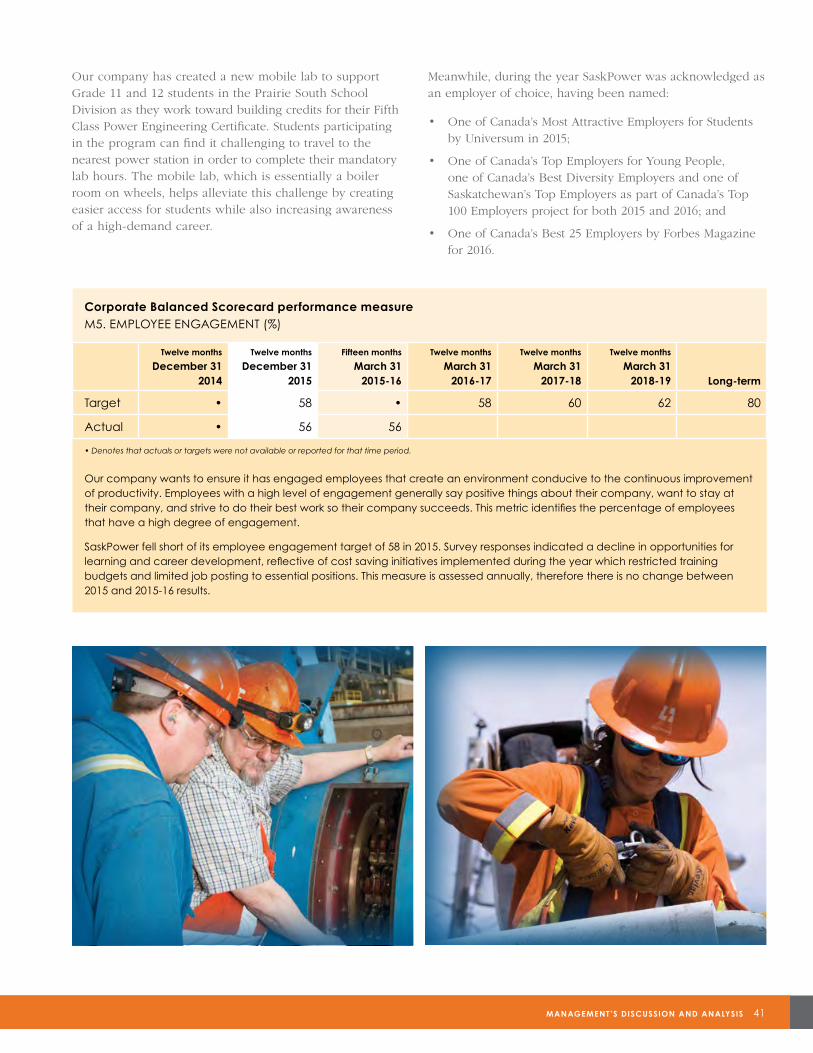
Corporate Balanced Scorecard performance measureM5. EMPLOYEE ENGAGEMENT (%)
Twelve months
December 312014
Twelve months
December 312015
Fifteen months
March 312015-16
Twelve months
March 312016-17
Twelve months
March 312017-18
Twelve months
March 312018-19 Long-term
Target • 58 • 58 60 62 80
Actual • 56 56
• Denotes that actuals or targets were not available or reported for that time period.
Our company wants to ensure it has engaged employees that create an environment conducive to the continuous improvement of productivity. Employees with a high level of engagement generally say positive things about their company, want to stay at their company, and strive to do their best work so their company succeeds. This metric identifies the percentage of employees that have a high degree of engagement.
SaskPower fell short of its employee engagement target of 58 in 2015. Survey responses indicated a decline in opportunities for learning and career development, reflective of cost saving initiatives implemented during the year which restricted training budgets and limited job posting to essential positions. This measure is assessed annually, therefore there is no change between 2015 and 2015-16 results.
Our company has created a new mobile lab to support Grade 11 and 12 students in the Prairie South School Division as they work toward building credits for their Fifth Class Power Engineering Certificate. Students participating in the program can find it challenging to travel to the nearest power station in order to complete their mandatory lab hours. The mobile lab, which is essentially a boiler room on wheels, helps alleviate this challenge by creating easier access for students while also increasing awareness of a high-demand career.
Meanwhile, during the year SaskPower was acknowledged as an employer of choice, having been named:
• One of Canada’s Most Attractive Employers for Students by Universum in 2015;
• One of Canada’s Top Employers for Young People, one of Canada’s Best Diversity Employers and one of Saskatchewan’s Top Employers as part of Canada’s Top 100 Employers project for both 2015 and 2016; and
• One of Canada’s Best 25 Employers by Forbes Magazine for 2016.
42 SASKPOWE R 2 015 -16 ANNUAL RE PORT
SAFETYOur company insists that the safety of our customers, employees and contractors comes first and cannot be compromised. As a result, SaskPower makes safety an inherent element of our company's day-to-day operations.
Notable progress was achieved in 2015-16, such as a reduction of critical incidents by 60% from 2014. During the year, the importance of ingraining safety in our workplace continued to be emphasized, with safety and environment stand-downs held in numerous areas of our operations. Safety expectations are communicated, lessons learned from critical incidents and critical near misses are shared, and workers are provided with an opportunity to propose safety actions.
In spite of this, SaskPower recognizes there are still considerable improvements to be made. In response to the safety challenges our company continues to face, SaskPower established a Safety Improvement Working Group (SIWG) comprised of 13 representatives from high-risk work groups. The SIWG evaluated the current state of safety at SaskPower, benchmarked safety best practices, gathered feedback from employees to understand how we could improve safety in the workplace, and created a list of recommendations to address our safety challenges.
Based on recommendations from the SIWG, SaskPower has initiated the Safety Improvement Program (SIP) to develop and implement solutions. The goal of the SIP is to bring workplace injuries down to zero and to instill a safety-first culture at SaskPower. The solutions address safety issues in four main categories: Leadership; Learning & Capability; Safety Absolutes; and Safety Excellence. All solutions will put an emphasis on sustainability and accountability to ensure effective and lasting change.
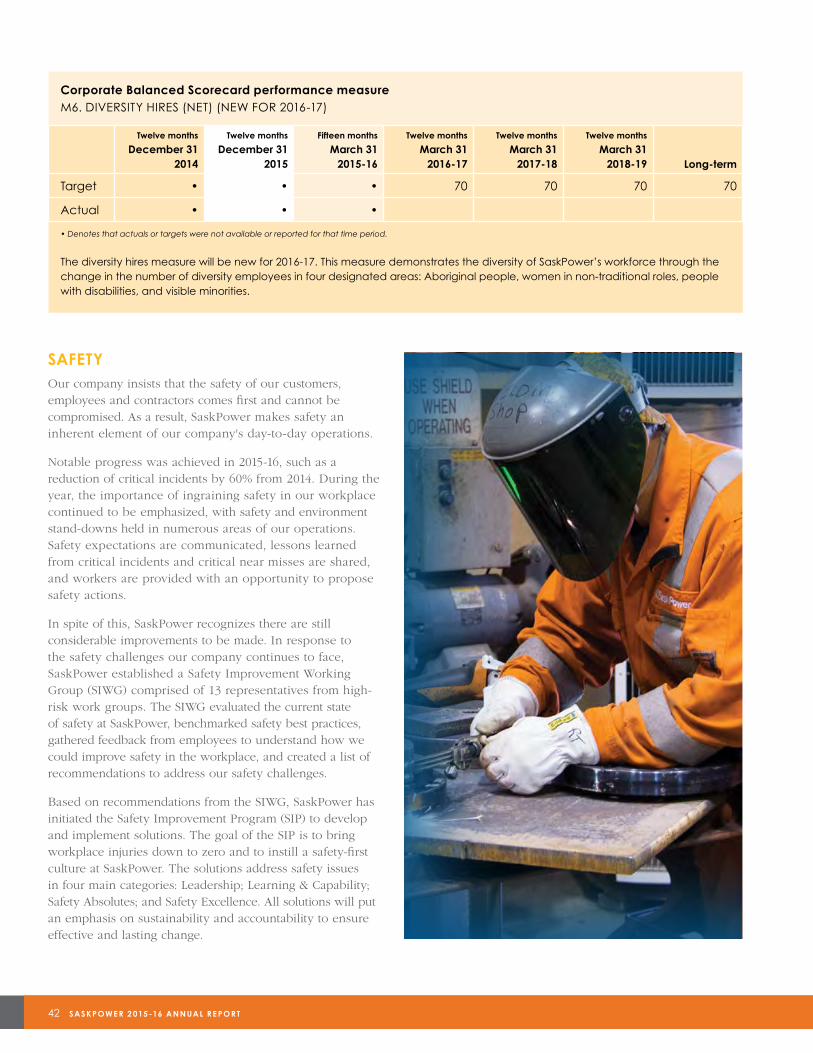
Corporate Balanced Scorecard performance measureM6. DIVERSITY HIRES (NET) (NEW FOR 2016-17)
Twelve months
December 312014
Twelve months
December 312015
Fifteen months
March 312015-16
Twelve months
March 312016-17
Twelve months
March 312017-18
Twelve months
March 312018-19 Long-term
Target • • • 70 70 70 70
Actual • • •
• Denotes that actuals or targets were not available or reported for that time period.
The diversity hires measure will be new for 2016-17. This measure demonstrates the diversity of SaskPower’s workforce through the change in the number of diversity employees in four designated areas: Aboriginal people, women in non-traditional roles, people with disabilities, and visible minorities.
MANAGEMENT’S DISCUSSION AND ANALYSIS 43
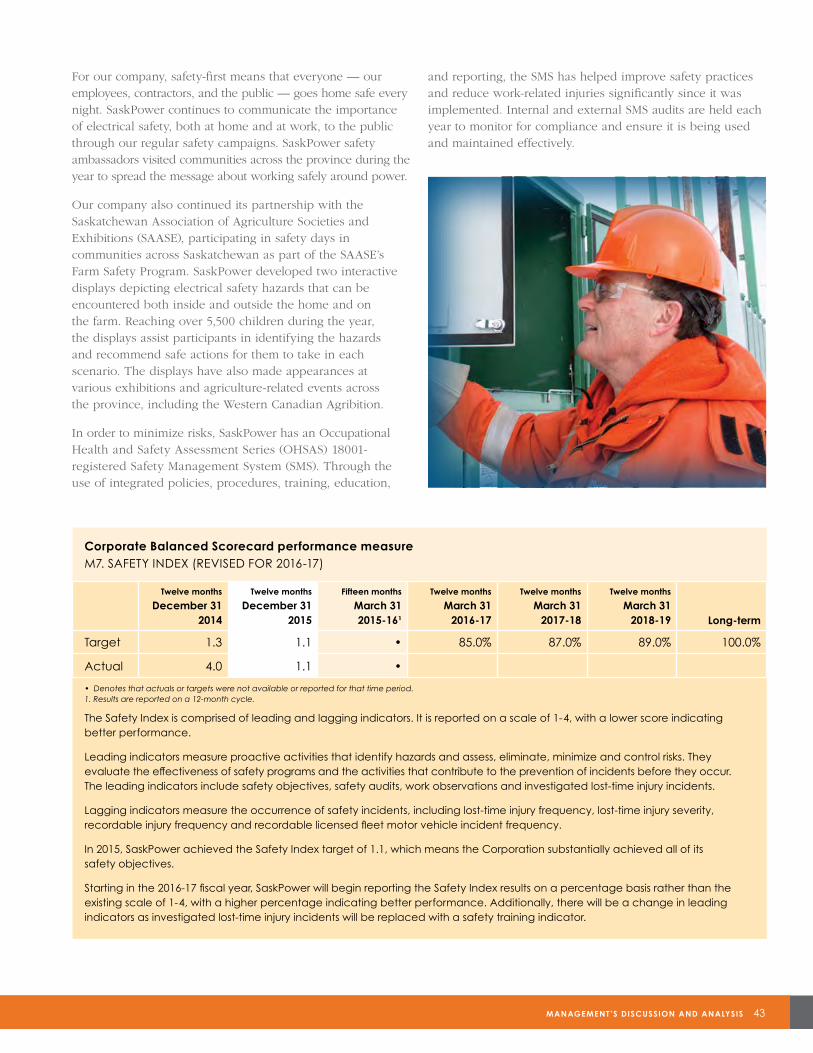
Corporate Balanced Scorecard performance measureM7. SAFETY INDEX (REVISED FOR 2016-17)
Twelve months
December 312014
Twelve months
December 312015
Fifteen months
March 312015-161
Twelve months
March 312016-17
Twelve months
March 312017-18
Twelve months
March 312018-19 Long-term
Target 1.3 1.1 • 85.0% 87.0% 89.0% 100.0%
Actual 4.0 1.1 •
• Denotes that actuals or targets were not available or reported for that time period. 1. Results are reported on a 12-month cycle.
The Safety Index is comprised of leading and lagging indicators. It is reported on a scale of 1-4, with a lower score indicating better performance.
Leading indicators measure proactive activities that identify hazards and assess, eliminate, minimize and control risks. They evaluate the effectiveness of safety programs and the activities that contribute to the prevention of incidents before they occur. The leading indicators include safety objectives, safety audits, work observations and investigated lost-time injury incidents.
Lagging indicators measure the occurrence of safety incidents, including lost-time injury frequency, lost-time injury severity, recordable injury frequency and recordable licensed fleet motor vehicle incident frequency.
In 2015, SaskPower achieved the Safety Index target of 1.1, which means the Corporation substantially achieved all of its safety objectives.
Starting in the 2016-17 fiscal year, SaskPower will begin reporting the Safety Index results on a percentage basis rather than the existing scale of 1-4, with a higher percentage indicating better performance. Additionally, there will be a change in leading indicators as investigated lost-time injury incidents will be replaced with a safety training indicator.
For our company, safety-first means that everyone — our employees, contractors, and the public — goes home safe every night. SaskPower continues to communicate the importance of electrical safety, both at home and at work, to the public through our regular safety campaigns. SaskPower safety ambassadors visited communities across the province during the year to spread the message about working safely around power.
Our company also continued its partnership with the Saskatchewan Association of Agriculture Societies and Exhibitions (SAASE), participating in safety days in communities across Saskatchewan as part of the SAASE’s Farm Safety Program. SaskPower developed two interactive displays depicting electrical safety hazards that can be encountered both inside and outside the home and on the farm. Reaching over 5,500 children during the year, the displays assist participants in identifying the hazards and recommend safe actions for them to take in each scenario. The displays have also made appearances at various exhibitions and agriculture-related events across the province, including the Western Canadian Agribition.
In order to minimize risks, SaskPower has an Occupational Health and Safety Assessment Series (OHSAS) 18001- registered Safety Management System (SMS). Through the use of integrated policies, procedures, training, education,
and reporting, the SMS has helped improve safety practices and reduce work-related injuries significantly since it was implemented. Internal and external SMS audits are held each year to monitor for compliance and ensure it is being used and maintained effectively.
44 SASKPOWE R 2 015 -16 ANNUAL RE PORT
SASKPOWER’S AIM IS TO CONTINUE
PROVIDING COMPETITIVE RATES IN
THE FACE OF AN UNPRECEDENTED
PERIOD OF INFRASTRUCTURE RENEWAL
AND CONTINUING GROWTH. WE RECOGNIZE
OUR ROLE IN SUPPORTING BUSINESS
AND QUALITY OF LIFE, AND BELIEVE
WE HAVE A RESPONSIBILITY TO
CAREFULLY AND PRUDENTLY MANAGE
OUR COMPANY’S FINANCES.
CORPORATE PILLAR 3
EFFICIENCY, QUALITY & COST MANAGEMENT
EFFICIENCY AND PROCESS IMPROVEMENTSaskPower is making historic investments to maintain and improve our electricity system to ensure it meets our province’s growing demand for power. As our company's debt level continues to grow, greater scrutiny is being placed on SaskPower's capital budget. It is essential to execute effective prioritization to meet the needs of growing electricity demand and renew an aging system while managing costs; keeping our debt level within the target range; maintaining acceptable reliability and power quality levels; and demonstrating rate competitiveness.
As a result, SaskPower will need to rely on effective cost management and increasing efficiencies. In 2015, our company reduced its budgeted operating, maintenance and administration (OM&A) spending by $38.2 million. Going forward, SaskPower will be working to reduce budgeted OM&A spending by an additional $52.9 million over the next three years for a total savings of $91.1 million over four years. In 2015, SaskPower also reduced its budgeted capital spending by $210 million. Our company has targeted another $790 million reduction to capital spending over the next three years. This will provide a total savings of $1 billion over four years.
During the year, the need to identify additional opportunities where expenses could be further reduced was communicated to Crown corporations by the Government of Saskatchewan. Crown corporations underwent a hiring freeze for the first three months of 2015, as well as a wage freeze for out-of-scope employees.
Crown corporations were also directed by CIC to make a 2.5% reduction in full-time equivalent (FTE) positions by the end of 2015. In response, SaskPower reduced its 2015 target by 96 FTE positions from the original CIC-approved budget. By December 31, 2015, our company achieved its revised target and eliminated an additional 99 FTE positions, resulting in a total reduction of 195 FTE positions. SaskPower plans to continue prudent hiring practices in an effort to further reduce and consolidate non-essential positions where possible. Increased restraint was also exercised in other areas, including restrictions on out-of-province travel and training.
CROWN COLLABORATION
Through the collaboration of SaskPower, SaskEnergy and SaskTel, the Joint Servicing Initiative was launched in 2015-16.
$91 MILLIONPROJECTED OM&A SAVINGS IN FOUR YEARS
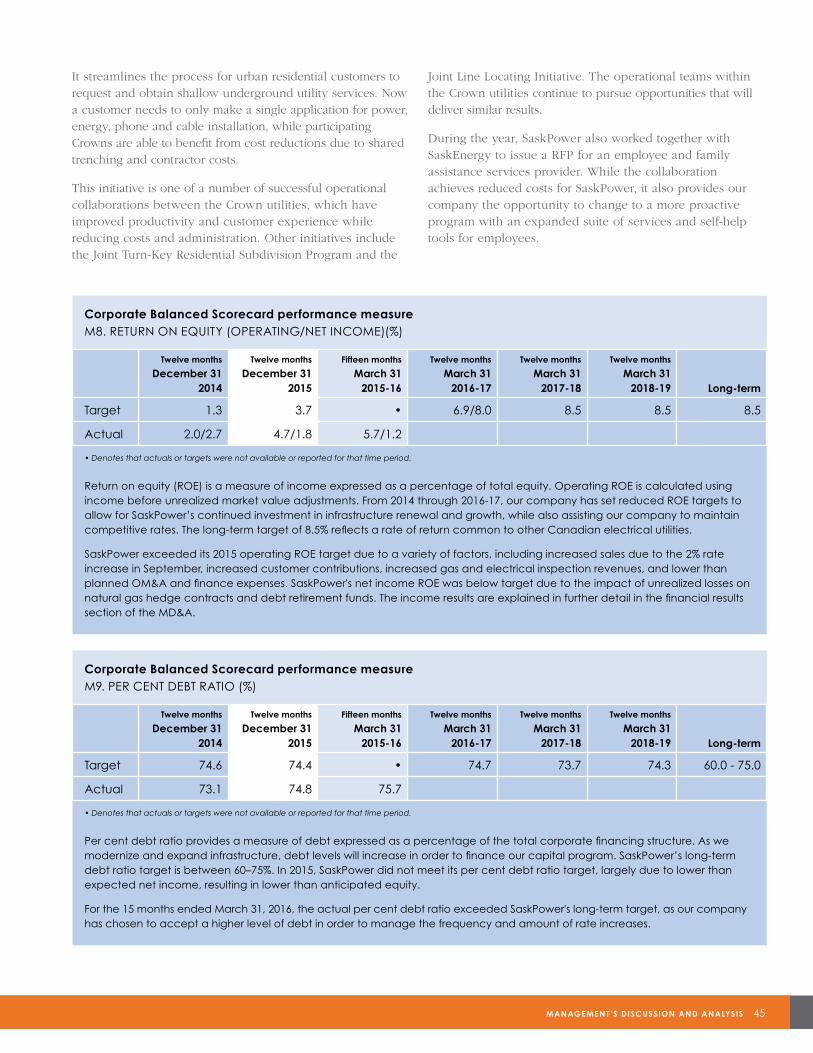
MANAGEMENT’S DISCUSSION AND ANALYSIS 45
It streamlines the process for urban residential customers to request and obtain shallow underground utility services. Now a customer needs to only make a single application for power, energy, phone and cable installation, while participating Crowns are able to benefit from cost reductions due to shared trenching and contractor costs.
This initiative is one of a number of successful operational collaborations between the Crown utilities, which have improved productivity and customer experience while reducing costs and administration. Other initiatives include the Joint Turn-Key Residential Subdivision Program and the
Joint Line Locating Initiative. The operational teams within the Crown utilities continue to pursue opportunities that will deliver similar results.
During the year, SaskPower also worked together with SaskEnergy to issue a RFP for an employee and family assistance services provider. While the collaboration achieves reduced costs for SaskPower, it also provides our company the opportunity to change to a more proactive program with an expanded suite of services and self-help tools for employees.
Corporate Balanced Scorecard performance measureM8. RETURN ON EQUITY (OPERATING/NET INCOME)(%)
Twelve months
December 312014
Twelve months
December 312015
Fifteen months
March 312015-16
Twelve months
March 312016-17
Twelve months
March 312017-18
Twelve months
March 312018-19 Long-term
Target 1.3 3.7 • 6.9/8.0 8.5 8.5 8.5
Actual 2.0/2.7 4.7/1.8 5.7/1.2
• Denotes that actuals or targets were not available or reported for that time period.
Return on equity (ROE) is a measure of income expressed as a percentage of total equity. Operating ROE is calculated using income before unrealized market value adjustments. From 2014 through 2016-17, our company has set reduced ROE targets to allow for SaskPower’s continued investment in infrastructure renewal and growth, while also assisting our company to maintain competitive rates. The long-term target of 8.5% reflects a rate of return common to other Canadian electrical utilities.
SaskPower exceeded its 2015 operating ROE target due to a variety of factors, including increased sales due to the 2% rate increase in September, increased customer contributions, increased gas and electrical inspection revenues, and lower than planned OM&A and finance expenses. SaskPower's net income ROE was below target due to the impact of unrealized losses on natural gas hedge contracts and debt retirement funds. The income results are explained in further detail in the financial results section of the MD&A.
Corporate Balanced Scorecard performance measureM9. PER CENT DEBT RATIO (%)
Twelve months
December 312014
Twelve months
December 312015
Fifteen months
March 312015-16
Twelve months
March 312016-17
Twelve months
March 312017-18
Twelve months
March 312018-19 Long-term
Target 74.6 74.4 • 74.7 73.7 74.3 60.0 - 75.0
Actual 73.1 74.8 75.7
• Denotes that actuals or targets were not available or reported for that time period.
Per cent debt ratio provides a measure of debt expressed as a percentage of the total corporate financing structure. As we modernize and expand infrastructure, debt levels will increase in order to finance our capital program. SaskPower’s long-term debt ratio target is between 60–75%. In 2015, SaskPower did not meet its per cent debt ratio target, largely due to lower than expected net income, resulting in lower than anticipated equity.
For the 15 months ended March 31, 2016, the actual per cent debt ratio exceeded SaskPower's long-term target, as our company has chosen to accept a higher level of debt in order to manage the frequency and amount of rate increases.
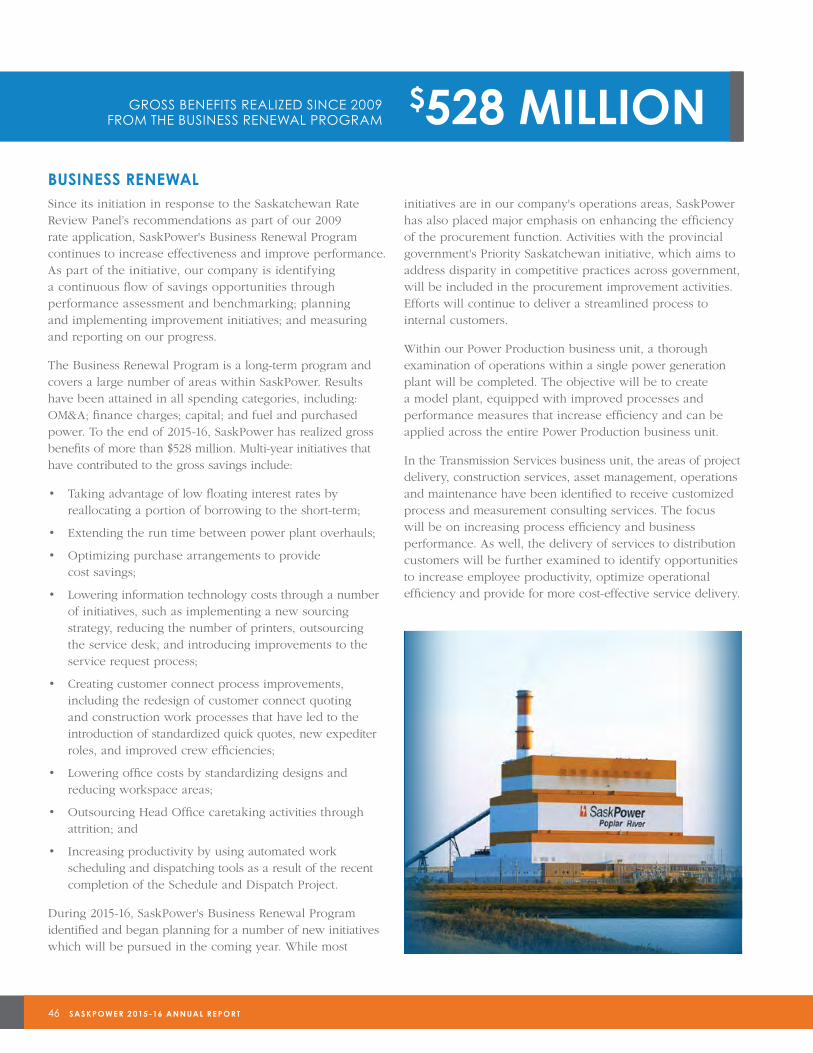
46 SASKPOWE R 2 015 -16 ANNUAL RE PORT
BUSINESS RENEWALSince its initiation in response to the Saskatchewan Rate Review Panel’s recommendations as part of our 2009 rate application, SaskPower's Business Renewal Program continues to increase effectiveness and improve performance. As part of the initiative, our company is identifying a continuous flow of savings opportunities through performance assessment and benchmarking; planning and implementing improvement initiatives; and measuring and reporting on our progress.
The Business Renewal Program is a long-term program and covers a large number of areas within SaskPower. Results have been attained in all spending categories, including: OM&A; finance charges; capital; and fuel and purchased power. To the end of 2015-16, SaskPower has realized gross benefits of more than $528 million. Multi-year initiatives that have contributed to the gross savings include:
• Taking advantage of low floating interest rates byreallocating a portion of borrowing to the short-term;
• Extending the run time between power plant overhauls;
• Optimizing purchase arrangements to providecost savings;
• Lowering information technology costs through a numberof initiatives, such as implementing a new sourcingstrategy, reducing the number of printers, outsourcingthe service desk, and introducing improvements to theservice request process;
• Creating customer connect process improvements,including the redesign of customer connect quotingand construction work processes that have led to theintroduction of standardized quick quotes, new expediterroles, and improved crew efficiencies;
• Lowering office costs by standardizing designs andreducing workspace areas;
• Outsourcing Head Office caretaking activities throughattrition; and
• Increasing productivity by using automated workscheduling and dispatching tools as a result of the recentcompletion of the Schedule and Dispatch Project.
During 2015-16, SaskPower's Business Renewal Program identified and began planning for a number of new initiatives which will be pursued in the coming year. While most
initiatives are in our company's operations areas, SaskPower has also placed major emphasis on enhancing the efficiency of the procurement function. Activities with the provincial government's Priority Saskatchewan initiative, which aims to address disparity in competitive practices across government, will be included in the procurement improvement activities. Efforts will continue to deliver a streamlined process to internal customers.
Within our Power Production business unit, a thorough examination of operations within a single power generation plant will be completed. The objective will be to create a model plant, equipped with improved processes and performance measures that increase efficiency and can be applied across the entire Power Production business unit.
In the Transmission Services business unit, the areas of project delivery, construction services, asset management, operations and maintenance have been identified to receive customized process and measurement consulting services. The focus will be on increasing process efficiency and business performance. As well, the delivery of services to distribution customers will be further examined to identify opportunities to increase employee productivity, optimize operational efficiency and provide for more cost-effective service delivery.
$528 MILLIONGROSS BENEFITS REALIZED SINCE 2009 FROM THE BUSINESS RENEWAL PROGRAM
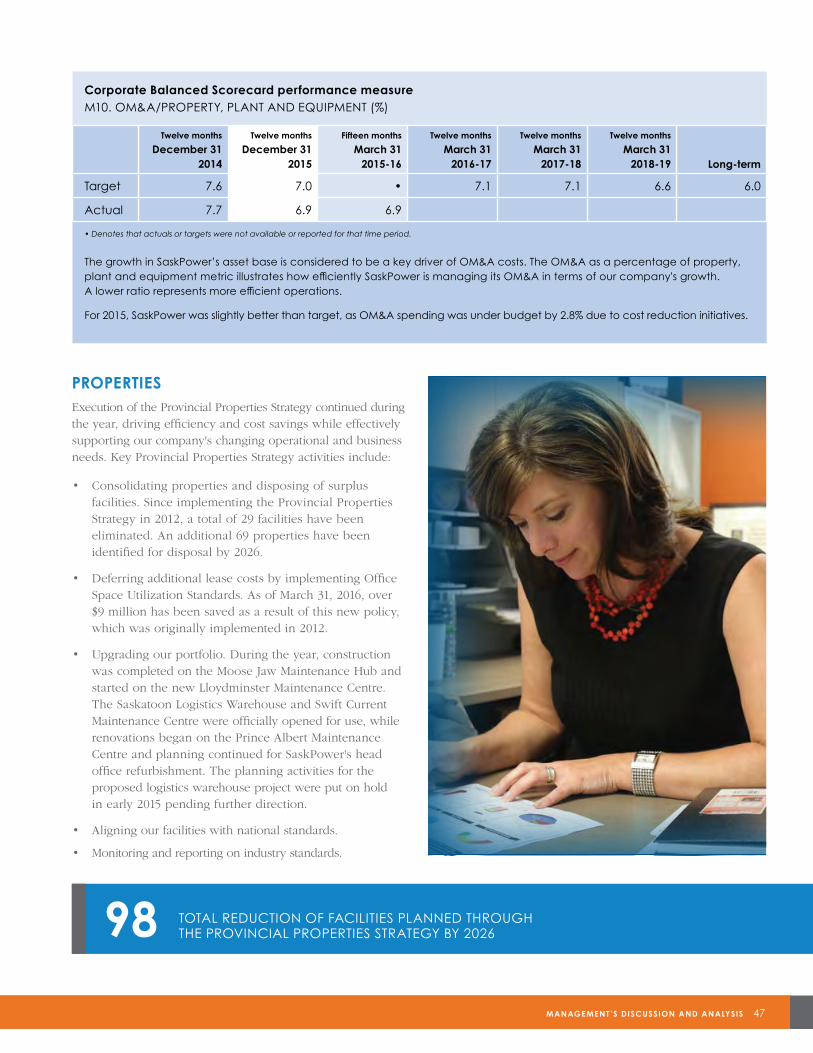
MANAGEMENT’S DISCUSSION AND ANALYSIS 47
PROPERTIESExecution of the Provincial Properties Strategy continued during the year, driving efficiency and cost savings while effectively supporting our company's changing operational and business needs. Key Provincial Properties Strategy activities include:
• Consolidating properties and disposing of surplus facilities. Since implementing the Provincial Properties Strategy in 2012, a total of 29 facilities have been eliminated. An additional 69 properties have been identified for disposal by 2026.
• Deferring additional lease costs by implementing Office Space Utilization Standards. As of March 31, 2016, over $9 million has been saved as a result of this new policy, which was originally implemented in 2012.
• Upgrading our portfolio. During the year, construction was completed on the Moose Jaw Maintenance Hub and started on the new Lloydminster Maintenance Centre. The Saskatoon Logistics Warehouse and Swift Current Maintenance Centre were officially opened for use, while renovations began on the Prince Albert Maintenance Centre and planning continued for SaskPower's head office refurbishment. The planning activities for the proposed logistics warehouse project were put on hold in early 2015 pending further direction.
• Aligning our facilities with national standards.
• Monitoring and reporting on industry standards.
Corporate Balanced Scorecard performance measureM10. OM&A/PROPERTY, PLANT AND EQUIPMENT (%)
Twelve months
December 312014
Twelve months
December 312015
Fifteen months
March 312015-16
Twelve months
March 312016-17
Twelve months
March 312017-18
Twelve months
March 312018-19 Long-term
Target 7.6 7.0 • 7.1 7.1 6.6 6.0
Actual 7.7 6.9 6.9
• Denotes that actuals or targets were not available or reported for that time period.
The growth in SaskPower’s asset base is considered to be a key driver of OM&A costs. The OM&A as a percentage of property, plant and equipment metric illustrates how efficiently SaskPower is managing its OM&A in terms of our company's growth. A lower ratio represents more efficient operations.
For 2015, SaskPower was slightly better than target, as OM&A spending was under budget by 2.8% due to cost reduction initiatives.
98 TOTAL REDUCTION OF FACILITIES PLANNED THROUGH THE PROVINCIAL PROPERTIES STRATEGY BY 2026
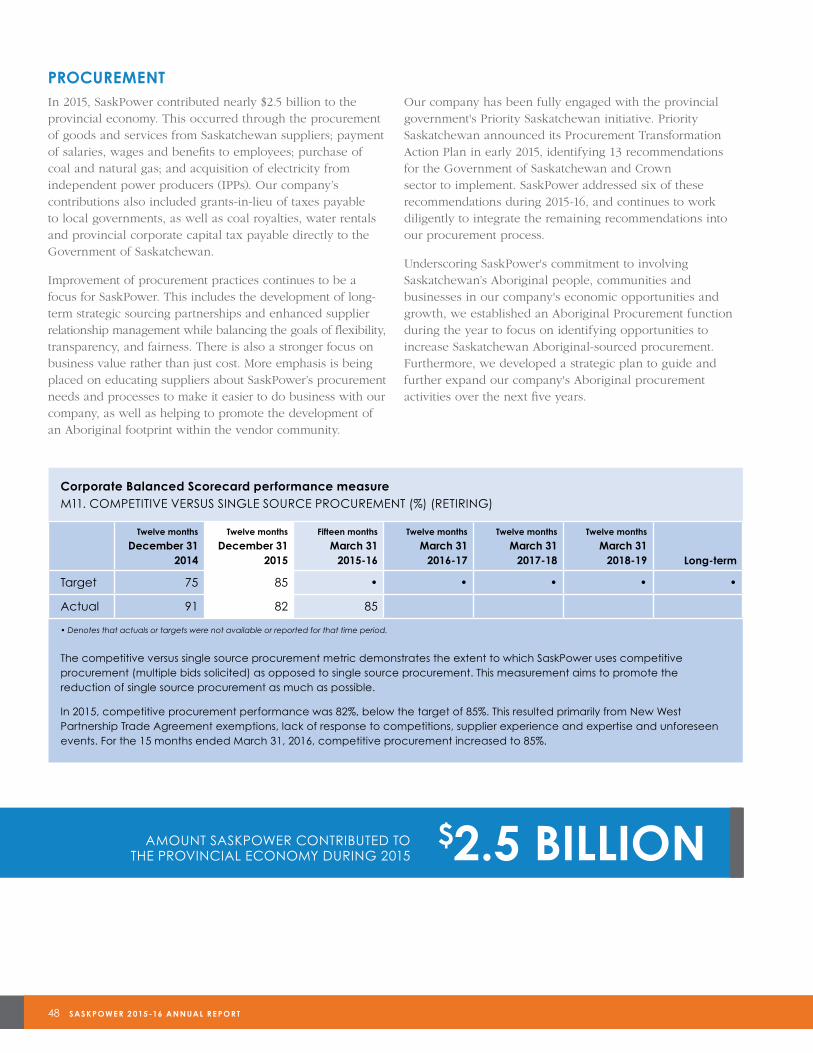
48 SASKPOWE R 2 015 -16 ANNUAL RE PORT
PROCUREMENTIn 2015, SaskPower contributed nearly $2.5 billion to the provincial economy. This occurred through the procurement of goods and services from Saskatchewan suppliers; payment of salaries, wages and benefits to employees; purchase of coal and natural gas; and acquisition of electricity from independent power producers (IPPs). Our company’s contributions also included grants-in-lieu of taxes payable to local governments, as well as coal royalties, water rentals and provincial corporate capital tax payable directly to the Government of Saskatchewan.
Improvement of procurement practices continues to be a focus for SaskPower. This includes the development of long-term strategic sourcing partnerships and enhanced supplier relationship management while balancing the goals of flexibility, transparency, and fairness. There is also a stronger focus on business value rather than just cost. More emphasis is being placed on educating suppliers about SaskPower’s procurement needs and processes to make it easier to do business with our company, as well as helping to promote the development of an Aboriginal footprint within the vendor community.
Our company has been fully engaged with the provincial government's Priority Saskatchewan initiative. Priority Saskatchewan announced its Procurement Transformation Action Plan in early 2015, identifying 13 recommendations for the Government of Saskatchewan and Crown sector to implement. SaskPower addressed six of these recommendations during 2015-16, and continues to work diligently to integrate the remaining recommendations into our procurement process.
Underscoring SaskPower's commitment to involving Saskatchewan’s Aboriginal people, communities and businesses in our company's economic opportunities and growth, we established an Aboriginal Procurement function during the year to focus on identifying opportunities to increase Saskatchewan Aboriginal-sourced procurement. Furthermore, we developed a strategic plan to guide and further expand our company's Aboriginal procurement activities over the next five years.
$2.5 BILLIONAMOUNT SASKPOWER CONTRIBUTED TOTHE PROVINCIAL ECONOMY DURING 2015
Corporate Balanced Scorecard performance measureM11. COMPETITIVE VERSUS SINGLE SOURCE PROCUREMENT (%) (RETIRING)
Twelve months
December 312014
Twelve months
December 312015
Fifteen months
March 312015-16
Twelve months
March 312016-17
Twelve months
March 312017-18
Twelve months
March 312018-19 Long-term
Target 75 85 • • • • •
Actual 91 82 85
• Denotes that actuals or targets were not available or reported for that time period.
The competitive versus single source procurement metric demonstrates the extent to which SaskPower uses competitive procurement (multiple bids solicited) as opposed to single source procurement. This measurement aims to promote the reduction of single source procurement as much as possible.
In 2015, competitive procurement performance was 82%, below the target of 85%. This resulted primarily from New West Partnership Trade Agreement exemptions, lack of response to competitions, supplier experience and expertise and unforeseen events. For the 15 months ended March 31, 2016, competitive procurement increased to 85%.
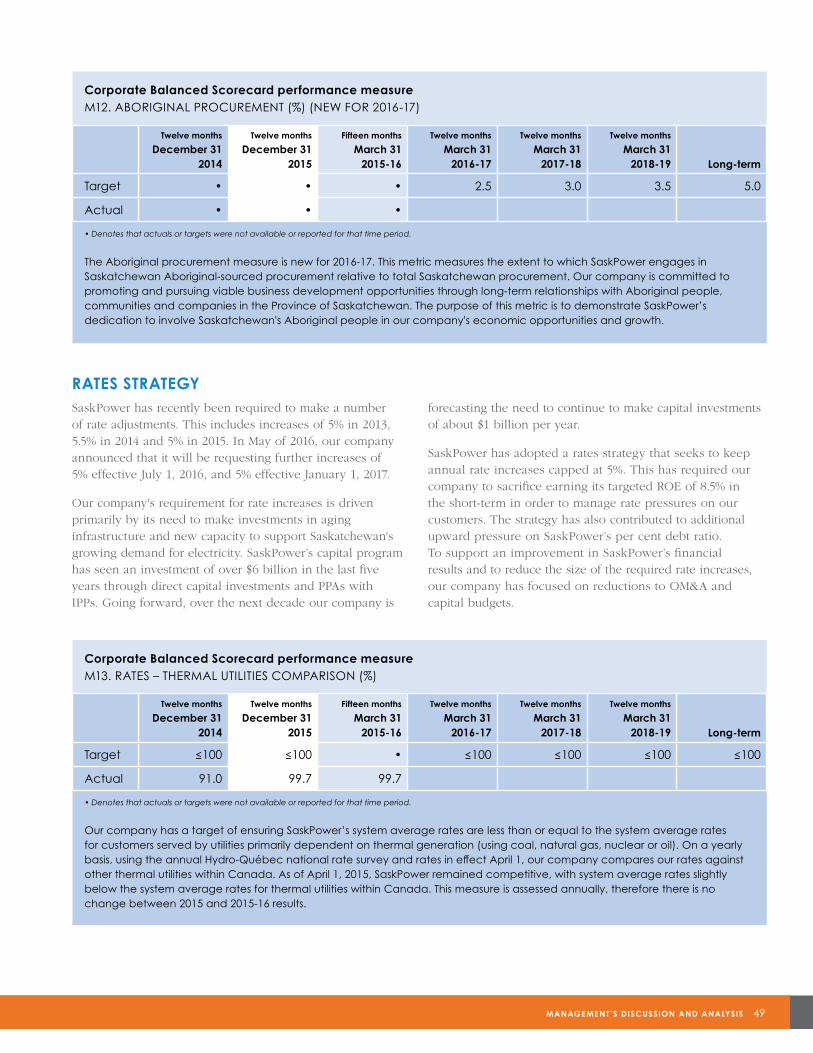
MANAGEMENT’S DISCUSSION AND ANALYSIS 49
RATES STRATEGY SaskPower has recently been required to make a number of rate adjustments. This includes increases of 5% in 2013, 5.5% in 2014 and 5% in 2015. In May of 2016, our company announced that it will be requesting further increases of 5% effective July 1, 2016, and 5% effective January 1, 2017.
Our company's requirement for rate increases is driven primarily by its need to make investments in aging infrastructure and new capacity to support Saskatchewan's growing demand for electricity. SaskPower’s capital program has seen an investment of over $6 billion in the last five years through direct capital investments and PPAs with IPPs. Going forward, over the next decade our company is
forecasting the need to continue to make capital investments of about $1 billion per year.
SaskPower has adopted a rates strategy that seeks to keep annual rate increases capped at 5%. This has required our company to sacrifice earning its targeted ROE of 8.5% in the short-term in order to manage rate pressures on our customers. The strategy has also contributed to additional upward pressure on SaskPower’s per cent debt ratio. To support an improvement in SaskPower’s financial results and to reduce the size of the required rate increases, our company has focused on reductions to OM&A and capital budgets.
Corporate Balanced Scorecard performance measureM12. ABORIGINAL PROCUREMENT (%) (NEW FOR 2016-17)
Twelve months
December 312014
Twelve months
December 312015
Fifteen months
March 312015-16
Twelve months
March 312016-17
Twelve months
March 312017-18
Twelve months
March 312018-19 Long-term
Target • • • 2.5 3.0 3.5 5.0
Actual • • •
• Denotes that actuals or targets were not available or reported for that time period.
The Aboriginal procurement measure is new for 2016-17. This metric measures the extent to which SaskPower engages in Saskatchewan Aboriginal-sourced procurement relative to total Saskatchewan procurement. Our company is committed to promoting and pursuing viable business development opportunities through long-term relationships with Aboriginal people, communities and companies in the Province of Saskatchewan. The purpose of this metric is to demonstrate SaskPower’s dedication to involve Saskatchewan's Aboriginal people in our company's economic opportunities and growth.
Corporate Balanced Scorecard performance measureM13. RATES – THERMAL UTILITIES COMPARISON (%)
Twelve months
December 312014
Twelve months
December 312015
Fifteen months
March 312015-16
Twelve months
March 312016-17
Twelve months
March 312017-18
Twelve months
March 312018-19 Long-term
Target ≤100 ≤100 • ≤100 ≤100 ≤100 ≤100
Actual 91.0 99.7 99.7
• Denotes that actuals or targets were not available or reported for that time period.
Our company has a target of ensuring SaskPower’s system average rates are less than or equal to the system average rates for customers served by utilities primarily dependent on thermal generation (using coal, natural gas, nuclear or oil). On a yearly basis, using the annual Hydro-Québec national rate survey and rates in effect April 1, our company compares our rates against other thermal utilities within Canada. As of April 1, 2015, SaskPower remained competitive, with system average rates slightly below the system average rates for thermal utilities within Canada. This measure is assessed annually, therefore there is no change between 2015 and 2015-16 results.
50 SASKPOWE R 2 015 -16 ANNUAL RE PORT
SUCCESSFULLY MEETING OUR MISSION OF
ENSURING RELIABLE, SUSTAINABLE AND COST-
EFFECTIVE POWER FOR OUR CUSTOMERS
MEANS SECURING THE PRESENT AND FUTURE
SUPPLY OF ELECTRICITY WHILE ADDRESSING
ENVIRONMENTAL RESPONSIBILITIES. AS WE
DEVELOP NEW CAPACITY, OUR COMPANY
IS ALSO MAINTAINING AND UPGRADING
EXISTING GENERATION, TRANSMISSION
AND DISTRIBUTION INFRASTRUCTURE
TO ENSURE RELIABILITY.
CORPORATE PILLAR 4
SUSTAINABLE INFRASTRUCTURE & RELIABILITY
SYSTEM SUSTAINMENTSaskPower's generation fleet, transmission network and distribution system — much of which was built between 1950 and 1985 — will require replacement, refurbishment or expansion over the next 40 years. As a result, more than ever before effective asset management is vital to sustaining our aging system.
Essential to fulfilling SaskPower's mission is a reliable generation fleet. Unplanned generation disruption will cause increased fuel and operating costs, while also increasing the risk of loss of electrical service to customers. Significant capital has been invested in our company’s generation assets over the past two decades, resulting in an improvement in reliability and performance. SaskPower is developing core in-house staff competencies in critical areas of turbine, generator, boiler, excitation and control systems in order to maintain system performance. Our company is also entering into longer-term support and maintenance contracts for critical needs.
In 2015-16, our Power Production business unit spent $143 million on generation infrastructure sustainment projects. These included completion of the Northern Hydro control system upgrades, dam rehabilitation and dike management; purchase of the Western Plants spare engine; and substantial completion of both the Poplar River Morrison Dam Spillway Capacity Project and Poplar River Power Station Unit #2 Long-Term Expenditures Project.
Similar to other Canadian utilities, our company’s transmission and distribution system performance is becoming increasingly difficult to maintain. This is primarily due to aging infrastructure, as well as the loss of retiring experienced employees. In order to reverse this trend, initiatives include the development of improved construction and maintenance standards, an increase of operating limits on several transmission lines, and expanded use of preventative measures such as infrared testing and improved condition assessments. We continue to focus on the highest risk assets, with an emphasis on ensuring the necessary maintenance work is completed.
SaskPower has one of the lowest customer densities relative to grid infrastructure in the country. We service an area covering approximately 652,000 square kilometres, providing power to just under 522,000 customer accounts by way of nearly 157,000 kilometres of power lines. This not only means longer response times in rural areas due to the time required for repair location identification and service crew travel, but also a smaller revenue base relative to the size of the grid which can make the funding of ongoing maintenance, as well as capacity increases, a challenge.
Saskatchewan’s widely variable and often extreme climate also has a significant impact on reliability. Wind, lightning, flooding, snow and ice all contribute to outages. Weather is often joined by other factors — including equipment failure/
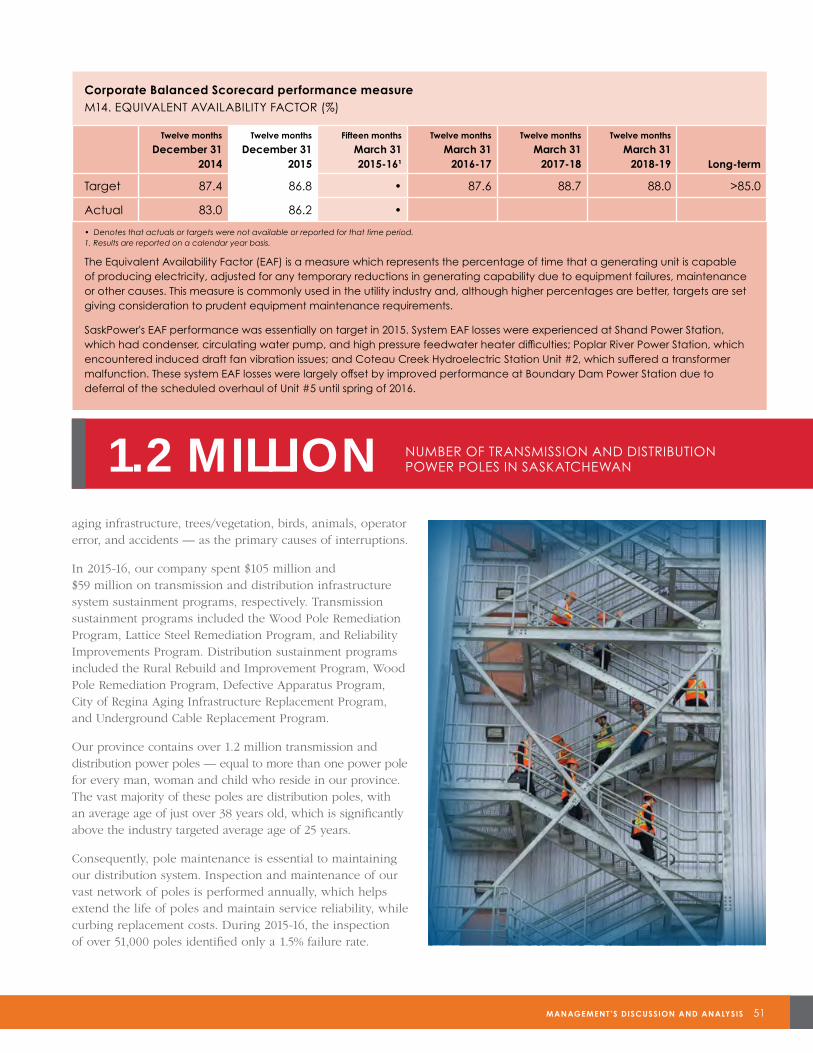
MANAGEMENT’S DISCUSSION AND ANALYSIS 51
Corporate Balanced Scorecard performance measureM14. EQUIVALENT AVAILABILITY FACTOR (%)
Twelve months
December 312014
Twelve months
December 312015
Fifteen months
March 312015-161
Twelve months
March 312016-17
Twelve months
March 312017-18
Twelve months
March 312018-19 Long-term
Target 87.4 86.8 • 87.6 88.7 88.0 >85.0
Actual 83.0 86.2 •
• Denotes that actuals or targets were not available or reported for that time period. 1. Results are reported on a calendar year basis.
The Equivalent Availability Factor (EAF) is a measure which represents the percentage of time that a generating unit is capable of producing electricity, adjusted for any temporary reductions in generating capability due to equipment failures, maintenance or other causes. This measure is commonly used in the utility industry and, although higher percentages are better, targets are set giving consideration to prudent equipment maintenance requirements.
SaskPower's EAF performance was essentially on target in 2015. System EAF losses were experienced at Shand Power Station, which had condenser, circulating water pump, and high pressure feedwater heater difficulties; Poplar River Power Station, which encountered induced draft fan vibration issues; and Coteau Creek Hydroelectric Station Unit #2, which suffered a transformer malfunction. These system EAF losses were largely offset by improved performance at Boundary Dam Power Station due to deferral of the scheduled overhaul of Unit #5 until spring of 2016.
aging infrastructure, trees/vegetation, birds, animals, operator error, and accidents — as the primary causes of interruptions.
In 2015-16, our company spent $105 million and $59 million on transmission and distribution infrastructure system sustainment programs, respectively. Transmission sustainment programs included the Wood Pole Remediation Program, Lattice Steel Remediation Program, and Reliability Improvements Program. Distribution sustainment programs included the Rural Rebuild and Improvement Program, Wood Pole Remediation Program, Defective Apparatus Program, City of Regina Aging Infrastructure Replacement Program, and Underground Cable Replacement Program.
Our province contains over 1.2 million transmission and distribution power poles — equal to more than one power pole for every man, woman and child who reside in our province. The vast majority of these poles are distribution poles, with an average age of just over 38 years old, which is significantly above the industry targeted average age of 25 years.
Consequently, pole maintenance is essential to maintaining our distribution system. Inspection and maintenance of our vast network of poles is performed annually, which helps extend the life of poles and maintain service reliability, while curbing replacement costs. During 2015-16, the inspection of over 51,000 poles identified only a 1.5% failure rate.
1.2 MILLION NUMBER OF TRANSMISSION AND DISTRIBUTION POWER POLES IN SASKATCHEWAN
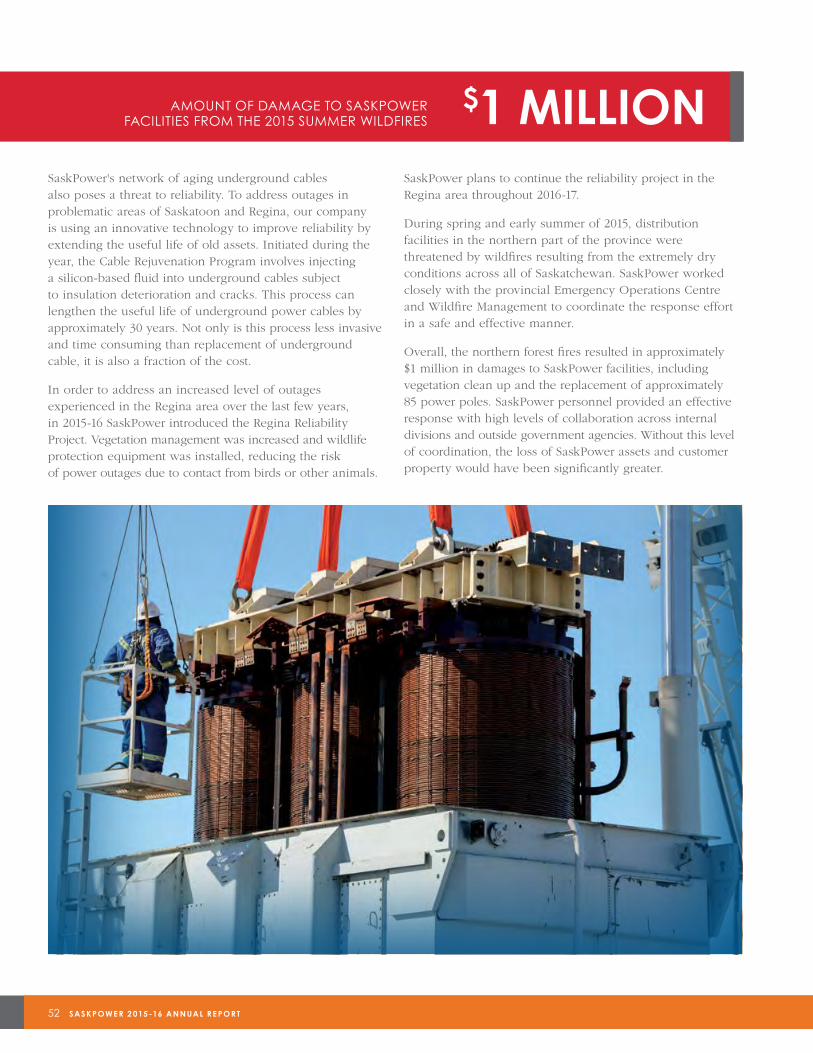
52 SASKPOWE R 2 015 -16 ANNUAL RE PORT
SaskPower's network of aging underground cables also poses a threat to reliability. To address outages in problematic areas of Saskatoon and Regina, our company is using an innovative technology to improve reliability by extending the useful life of old assets. Initiated during the year, the Cable Rejuvenation Program involves injecting a silicon-based fluid into underground cables subject to insulation deterioration and cracks. This process can lengthen the useful life of underground power cables by approximately 30 years. Not only is this process less invasive and time consuming than replacement of underground cable, it is also a fraction of the cost.
In order to address an increased level of outages experienced in the Regina area over the last few years, in 2015-16 SaskPower introduced the Regina Reliability Project. Vegetation management was increased and wildlife protection equipment was installed, reducing the risk of power outages due to contact from birds or other animals.
SaskPower plans to continue the reliability project in the Regina area throughout 2016-17.
During spring and early summer of 2015, distribution facilities in the northern part of the province were threatened by wildfires resulting from the extremely dry conditions across all of Saskatchewan. SaskPower worked closely with the provincial Emergency Operations Centre and Wildfire Management to coordinate the response effort in a safe and effective manner.
Overall, the northern forest fires resulted in approximately $1 million in damages to SaskPower facilities, including vegetation clean up and the replacement of approximately 85 power poles. SaskPower personnel provided an effective response with high levels of collaboration across internal divisions and outside government agencies. Without this level of coordination, the loss of SaskPower assets and customer property would have been significantly greater.
$1 MILLIONAMOUNT OF DAMAGE TO SASKPOWER FACILITIES FROM THE 2015 SUMMER WILDFIRES
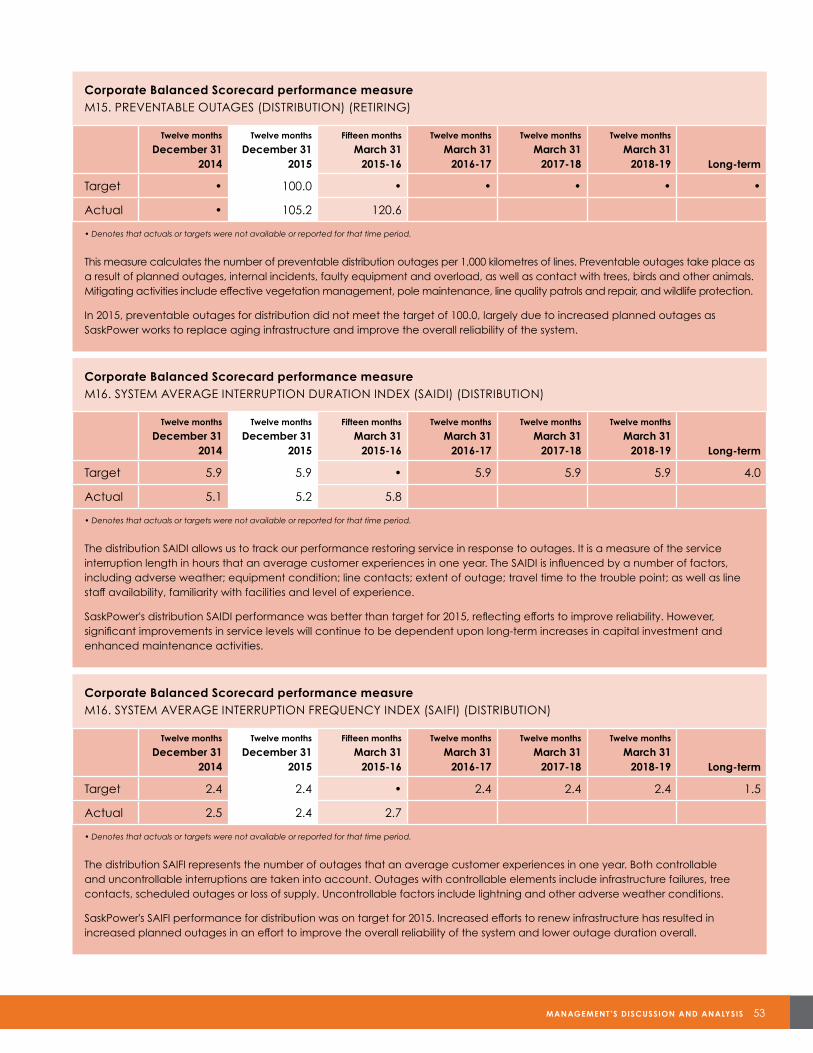
MANAGEMENT’S DISCUSSION AND ANALYSIS 53
Corporate Balanced Scorecard performance measureM15. PREVENTABLE OUTAGES (DISTRIBUTION) (RETIRING)
Twelve months
December 312014
Twelve months
December 312015
Fifteen months
March 312015-16
Twelve months
March 312016-17
Twelve months
March 312017-18
Twelve months
March 312018-19 Long-term
Target • 100.0 • • • • •
Actual • 105.2 120.6
• Denotes that actuals or targets were not available or reported for that time period.
This measure calculates the number of preventable distribution outages per 1,000 kilometres of lines. Preventable outages take place as a result of planned outages, internal incidents, faulty equipment and overload, as well as contact with trees, birds and other animals. Mitigating activities include effective vegetation management, pole maintenance, line quality patrols and repair, and wildlife protection.
In 2015, preventable outages for distribution did not meet the target of 100.0, largely due to increased planned outages as SaskPower works to replace aging infrastructure and improve the overall reliability of the system.
Corporate Balanced Scorecard performance measureM16. SYSTEM AVERAGE INTERRUPTION DURATION INDEX (SAIDI) (DISTRIBUTION)
Twelve months
December 312014
Twelve months
December 312015
Fifteen months
March 312015-16
Twelve months
March 312016-17
Twelve months
March 312017-18
Twelve months
March 312018-19 Long-term
Target 5.9 5.9 • 5.9 5.9 5.9 4.0
Actual 5.1 5.2 5.8
• Denotes that actuals or targets were not available or reported for that time period.
The distribution SAIDI allows us to track our performance restoring service in response to outages. It is a measure of the service interruption length in hours that an average customer experiences in one year. The SAIDI is influenced by a number of factors, including adverse weather; equipment condition; line contacts; extent of outage; travel time to the trouble point; as well as line staff availability, familiarity with facilities and level of experience.
SaskPower's distribution SAIDI performance was better than target for 2015, reflecting efforts to improve reliability. However, significant improvements in service levels will continue to be dependent upon long-term increases in capital investment and enhanced maintenance activities.
Corporate Balanced Scorecard performance measureM16. SYSTEM AVERAGE INTERRUPTION FREQUENCY INDEX (SAIFI) (DISTRIBUTION)
Twelve months
December 312014
Twelve months
December 312015
Fifteen months
March 312015-16
Twelve months
March 312016-17
Twelve months
March 312017-18
Twelve months
March 312018-19 Long-term
Target 2.4 2.4 • 2.4 2.4 2.4 1.5
Actual 2.5 2.4 2.7
• Denotes that actuals or targets were not available or reported for that time period.
The distribution SAIFI represents the number of outages that an average customer experiences in one year. Both controllable and uncontrollable interruptions are taken into account. Outages with controllable elements include infrastructure failures, tree contacts, scheduled outages or loss of supply. Uncontrollable factors include lightning and other adverse weather conditions.
SaskPower's SAIFI performance for distribution was on target for 2015. Increased efforts to renew infrastructure has resulted in increased planned outages in an effort to improve the overall reliability of the system and lower outage duration overall.
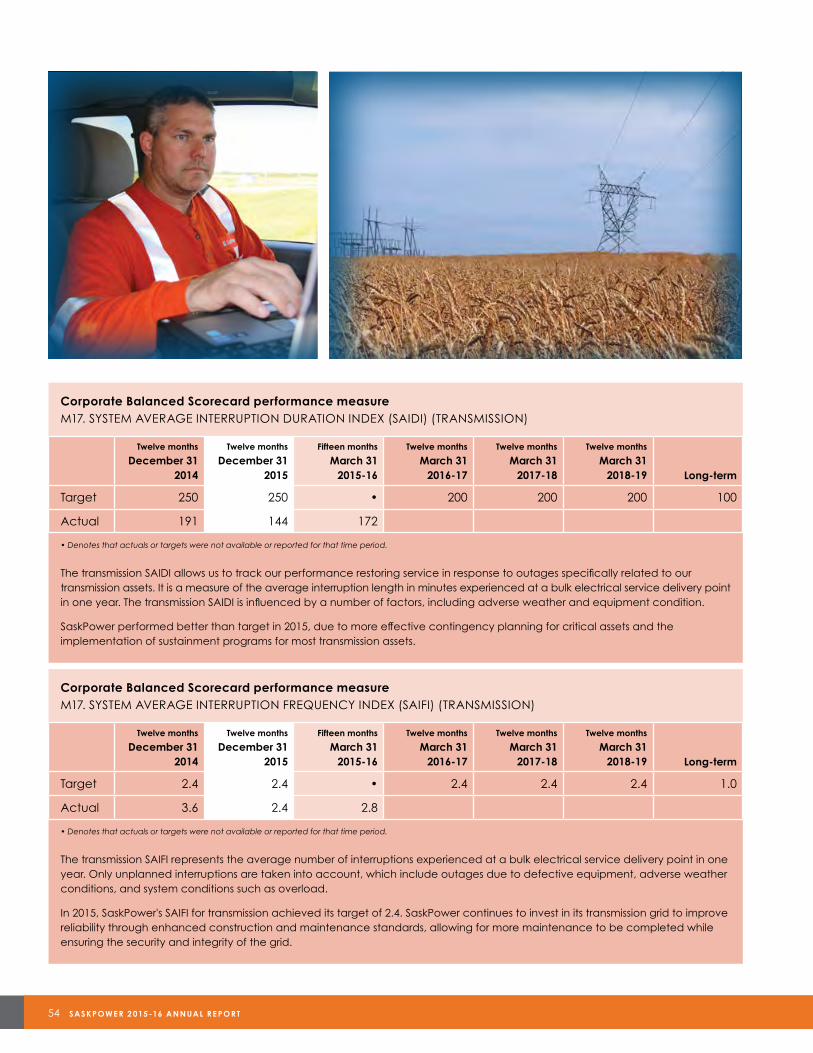
54 SASKPOWE R 2 015 -16 ANNUAL RE PORT
Corporate Balanced Scorecard performance measureM17. SYSTEM AVERAGE INTERRUPTION DURATION INDEX (SAIDI) (TRANSMISSION)
Twelve months
December 312014
Twelve months
December 312015
Fifteen months
March 312015-16
Twelve months
March 312016-17
Twelve months
March 312017-18
Twelve months
March 312018-19 Long-term
Target 250 250 • 200 200 200 100
Actual 191 144 172
• Denotes that actuals or targets were not available or reported for that time period.
The transmission SAIDI allows us to track our performance restoring service in response to outages specifically related to our transmission assets. It is a measure of the average interruption length in minutes experienced at a bulk electrical service delivery point in one year. The transmission SAIDI is influenced by a number of factors, including adverse weather and equipment condition.
SaskPower performed better than target in 2015, due to more effective contingency planning for critical assets and the implementation of sustainment programs for most transmission assets.
Corporate Balanced Scorecard performance measureM17. SYSTEM AVERAGE INTERRUPTION FREQUENCY INDEX (SAIFI) (TRANSMISSION)
Twelve months
December 312014
Twelve months
December 312015
Fifteen months
March 312015-16
Twelve months
March 312016-17
Twelve months
March 312017-18
Twelve months
March 312018-19 Long-term
Target 2.4 2.4 • 2.4 2.4 2.4 1.0
Actual 3.6 2.4 2.8
• Denotes that actuals or targets were not available or reported for that time period.
The transmission SAIFI represents the average number of interruptions experienced at a bulk electrical service delivery point in one year. Only unplanned interruptions are taken into account, which include outages due to defective equipment, adverse weather conditions, and system conditions such as overload.
In 2015, SaskPower's SAIFI for transmission achieved its target of 2.4. SaskPower continues to invest in its transmission grid to improve reliability through enhanced construction and maintenance standards, allowing for more maintenance to be completed while ensuring the security and integrity of the grid.
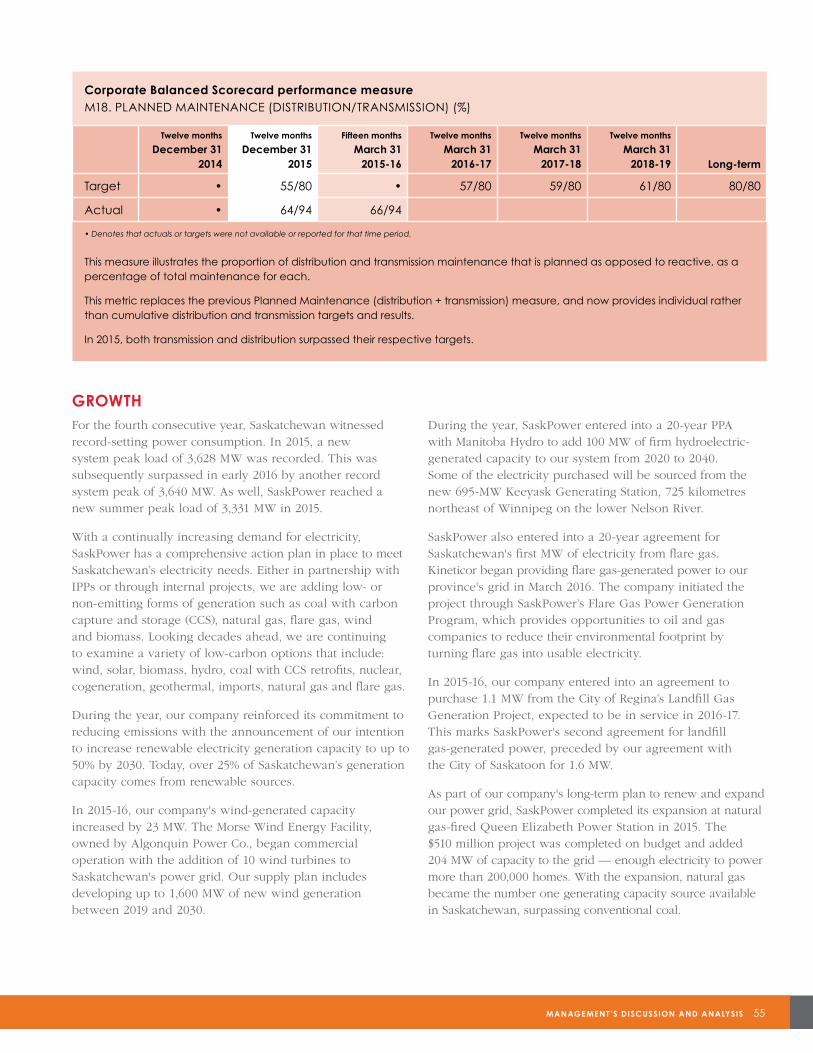
MANAGEMENT’S DISCUSSION AND ANALYSIS 55
GROWTHFor the fourth consecutive year, Saskatchewan witnessed record-setting power consumption. In 2015, a new system peak load of 3,628 MW was recorded. This was subsequently surpassed in early 2016 by another record system peak of 3,640 MW. As well, SaskPower reached a new summer peak load of 3,331 MW in 2015.
With a continually increasing demand for electricity, SaskPower has a comprehensive action plan in place to meet Saskatchewan’s electricity needs. Either in partnership with IPPs or through internal projects, we are adding low- or non-emitting forms of generation such as coal with carbon capture and storage (CCS), natural gas, flare gas, wind and biomass. Looking decades ahead, we are continuing to examine a variety of low-carbon options that include: wind, solar, biomass, hydro, coal with CCS retrofits, nuclear, cogeneration, geothermal, imports, natural gas and flare gas.
During the year, our company reinforced its commitment to reducing emissions with the announcement of our intention to increase renewable electricity generation capacity to up to 50% by 2030. Today, over 25% of Saskatchewan’s generation capacity comes from renewable sources.
In 2015-16, our company's wind-generated capacity increased by 23 MW. The Morse Wind Energy Facility, owned by Algonquin Power Co., began commercial operation with the addition of 10 wind turbines to Saskatchewan's power grid. Our supply plan includes developing up to 1,600 MW of new wind generation between 2019 and 2030.
During the year, SaskPower entered into a 20-year PPA with Manitoba Hydro to add 100 MW of firm hydroelectric-generated capacity to our system from 2020 to 2040. Some of the electricity purchased will be sourced from the new 695-MW Keeyask Generating Station, 725 kilometres northeast of Winnipeg on the lower Nelson River.
SaskPower also entered into a 20-year agreement for Saskatchewan's first MW of electricity from flare gas. Kineticor began providing flare gas-generated power to our province's grid in March 2016. The company initiated the project through SaskPower’s Flare Gas Power Generation Program, which provides opportunities to oil and gas companies to reduce their environmental footprint by turning flare gas into usable electricity.
In 2015-16, our company entered into an agreement to purchase 1.1 MW from the City of Regina’s Landfill Gas Generation Project, expected to be in service in 2016-17. This marks SaskPower's second agreement for landfill gas-generated power, preceded by our agreement with the City of Saskatoon for 1.6 MW.
As part of our company's long-term plan to renew and expand our power grid, SaskPower completed its expansion at natural gas-fired Queen Elizabeth Power Station in 2015. The $510 million project was completed on budget and added 204 MW of capacity to the grid — enough electricity to power more than 200,000 homes. With the expansion, natural gas became the number one generating capacity source available in Saskatchewan, surpassing conventional coal.
Corporate Balanced Scorecard performance measureM18. PLANNED MAINTENANCE (DISTRIBUTION/TRANSMISSION) (%)
Twelve months
December 312014
Twelve months
December 312015
Fifteen months
March 312015-16
Twelve months
March 312016-17
Twelve months
March 312017-18
Twelve months
March 312018-19 Long-term
Target • 55/80 • 57/80 59/80 61/80 80/80
Actual • 64/94 66/94
• Denotes that actuals or targets were not available or reported for that time period.
This measure illustrates the proportion of distribution and transmission maintenance that is planned as opposed to reactive, as a percentage of total maintenance for each.
This metric replaces the previous Planned Maintenance (distribution + transmission) measure, and now provides individual rather than cumulative distribution and transmission targets and results.
In 2015, both transmission and distribution surpassed their respective targets.
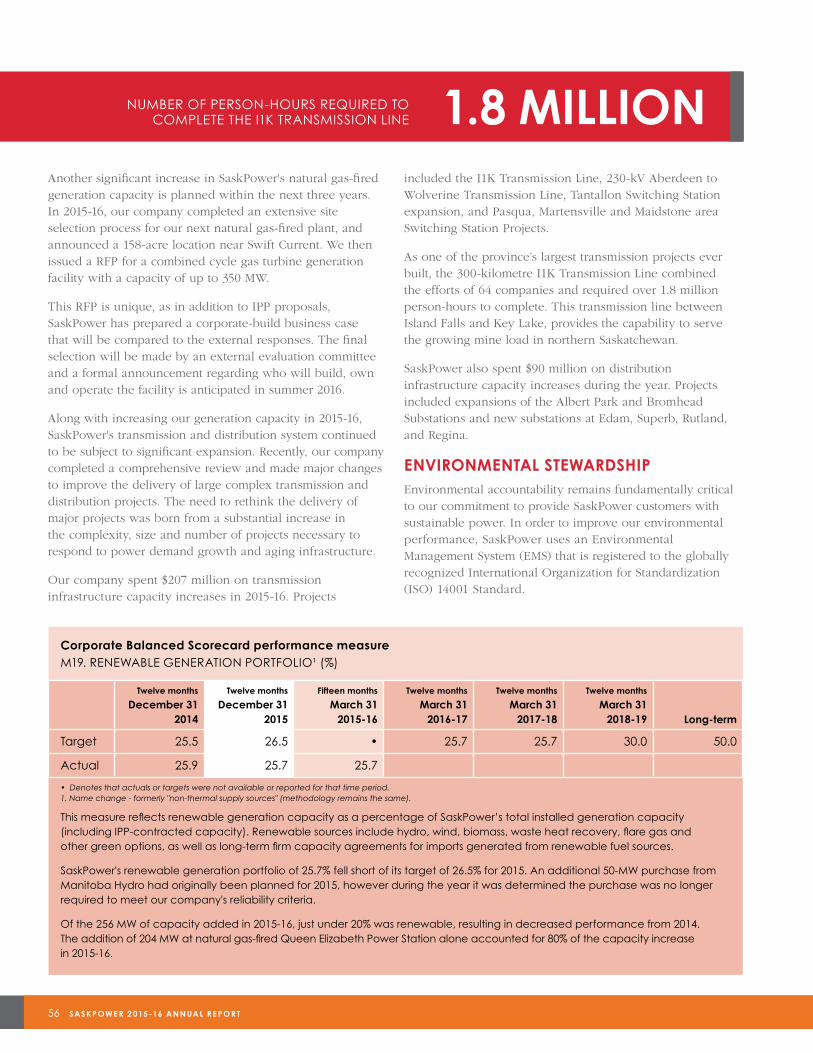
56 SASKPOWE R 2 015 -16 ANNUAL RE PORT
Another significant increase in SaskPower's natural gas-fired generation capacity is planned within the next three years. In 2015-16, our company completed an extensive site selection process for our next natural gas-fired plant, and announced a 158-acre location near Swift Current. We then issued a RFP for a combined cycle gas turbine generation facility with a capacity of up to 350 MW.
This RFP is unique, as in addition to IPP proposals, SaskPower has prepared a corporate-build business case that will be compared to the external responses. The final selection will be made by an external evaluation committee and a formal announcement regarding who will build, own and operate the facility is anticipated in summer 2016.
Along with increasing our generation capacity in 2015-16, SaskPower's transmission and distribution system continued to be subject to significant expansion. Recently, our company completed a comprehensive review and made major changes to improve the delivery of large complex transmission and distribution projects. The need to rethink the delivery of major projects was born from a substantial increase in the complexity, size and number of projects necessary to respond to power demand growth and aging infrastructure.
Our company spent $207 million on transmission infrastructure capacity increases in 2015-16. Projects
included the I1K Transmission Line, 230-kV Aberdeen to Wolverine Transmission Line, Tantallon Switching Station expansion, and Pasqua, Martensville and Maidstone area Switching Station Projects.
As one of the province’s largest transmission projects ever built, the 300-kilometre I1K Transmission Line combined the efforts of 64 companies and required over 1.8 million person-hours to complete. This transmission line between Island Falls and Key Lake, provides the capability to serve the growing mine load in northern Saskatchewan.
SaskPower also spent $90 million on distribution infrastructure capacity increases during the year. Projects included expansions of the Albert Park and Bromhead Substations and new substations at Edam, Superb, Rutland, and Regina.
ENVIRONMENTAL STEWARDSHIPEnvironmental accountability remains fundamentally critical to our commitment to provide SaskPower customers with sustainable power. In order to improve our environmental performance, SaskPower uses an Environmental Management System (EMS) that is registered to the globally recognized International Organization for Standardization (ISO) 14001 Standard.
1.8 MILLIONNUMBER OF PERSON-HOURS REQUIRED TO COMPLETE THE I1K TRANSMISSION LINE
Corporate Balanced Scorecard performance measureM19. RENEWABLE GENERATION PORTFOLIO1 (%)
Twelve months
December 312014
Twelve months
December 312015
Fifteen months
March 312015-16
Twelve months
March 312016-17
Twelve months
March 312017-18
Twelve months
March 312018-19 Long-term
Target 25.5 26.5 • 25.7 25.7 30.0 50.0
Actual 25.9 25.7 25.7
• Denotes that actuals or targets were not available or reported for that time period.1. Name change - formerly "non-thermal supply sources" (methodology remains the same).
This measure reflects renewable generation capacity as a percentage of SaskPower’s total installed generation capacity (including IPP-contracted capacity). Renewable sources include hydro, wind, biomass, waste heat recovery, flare gas and other green options, as well as long-term firm capacity agreements for imports generated from renewable fuel sources.
SaskPower's renewable generation portfolio of 25.7% fell short of its target of 26.5% for 2015. An additional 50-MW purchase from Manitoba Hydro had originally been planned for 2015, however during the year it was determined the purchase was no longer required to meet our company's reliability criteria.
Of the 256 MW of capacity added in 2015-16, just under 20% was renewable, resulting in decreased performance from 2014. The addition of 204 MW at natural gas-fired Queen Elizabeth Power Station alone accounted for 80% of the capacity increase in 2015-16.

MANAGEMENT’S DISCUSSION AND ANALYSIS 57
SaskPower’s EMS provides employees and contractors with a structure designed to help us identify, monitor and manage the impact of our business on the environment while encouraging continuous improvement. ISO 14001 registrations are maintained through annual independent EMS audits conducted at SaskPower facilities across the province. Qualified SaskPower personnel also conduct yearly internal EMS audits.
During the year, an Environmental Screening System (ESS) upgrade project went live. The ESS allows SaskPower to identify and understand the environmental risks of projects. Mitigating risks allows SaskPower to eliminate or minimize potential impacts from our construction and maintenance projects. The new system tracks and stores information for all applicable projects, making forecasting, auditing and planning easier and more efficient.
POLYCHLORINATED BIPHENYLS (PCBs)
Federal regulation has mandated an end-of-use deadline of December 31, 2025, for specific electrical equipment with PCB concentrations greater than or equal to 50 parts per million (ppm).
SaskPower is on track to meet and go beyond this federal regulation through the continued efforts of our PCB Action Plan. Under the initiative, SaskPower intends to remove all PCBs as required by federal regulations using a lower threshold of 2 ppm or greater in concentration on or before December 31, 2023.
During 2015-16, we completed PCB mitigation at the Poplar River Power Station and recently decommissioned the Success Power Station. At the end of 2015-16, approximately
1 million of the 2.9 million litres of PCB-contaminated oil identified by SaskPower had been removed and replaced. Nearly 9,000 pieces of equipment have either been sampled and confirmed to be PCB-free, removed from service, or had PCB-contaminated oil removed to make the equipment PCB-free.
FLY ASH
Created during the coal combustion process, fly ash is a by-product which is extracted and collected prior to exhaust gases entering the atmosphere. Fly ash is sold for use in ready-mix concrete, mine backfill, oil well cementing, road base stabilization and liquid waste stabilization applications.
Each tonne of fly ash captured and sold that replaces cement prevents roughly one tonne of CO
2 from entering
the atmosphere. During the year, our company sold approximately 179,350 tonnes from the Boundary Dam and Shand Power Stations.
SASKPOWER SHAND GREENHOUSE
Since 1991, SaskPower Shand Greenhouse has been using waste heat from the nearby Shand Power Station to grow millions of tree, shrub and native plant seedlings. They have been provided to the community for use in land reclamation and other environmental planting projects.
During the year, Shand Greenhouse distributed 461,728 seedlings throughout Saskatchewan, bringing total distribution since inception to over 10 million. Beyond growing seedlings, Shand Greenhouse staff help to educate future consumers about the impacts of their energy choices. School tours, presentations, and planting project partnerships reached approximately 250 students in 2015.
461,728 SASKPOWER SHAND GREENHOUSE SEEDLINGS DISTRIBUTED DURING THE YEAR

58 SASKPOWE R 2 015 -16 ANNUAL RE PORT
CARBON CAPTURE & STORAGE (CCS)Traditionally, coal has been widely used in Saskatchewan and around the world because it has been a secure and plentiful fuel and is more economical than any other baseload fossil fuel source. As well, the technology behind coal-fired generating plants, which operate around the clock, is well-developed and extremely reliable.
On July 1, 2015, new performance standards came into effect in Canada that apply to new coal-fired electricity generating units and units that have reached the end of their useful life, nominally 50 years. Moving forward, performance must meet the CO
2 emissions intensity of
420 tonnes/GWh, roughly equivalent to the emission intensity of current high efficiency natural gas combined cycle power plants.
As a result of these regulations, the long-term operation of conventional coal generation — one of SaskPower's largest sources of baseload generation — is no longer an option. In future, our company will have to rely on carbon capture technology if SaskPower continues to use coal.
In late 2014, SaskPower completed the Boundary Dam Integrated Carbon Capture and Storage (ICCS) Demonstration Project. It is the world’s first fully integrated CCS project at a coal-fired power station. The addition of CCS represents the largest environmental upgrade ever for a coal-fired power station in Canada. When operating at nameplate capacity, it is capable of producing electricity with significantly less CO
2 emissions than natural
gas-fired generation.
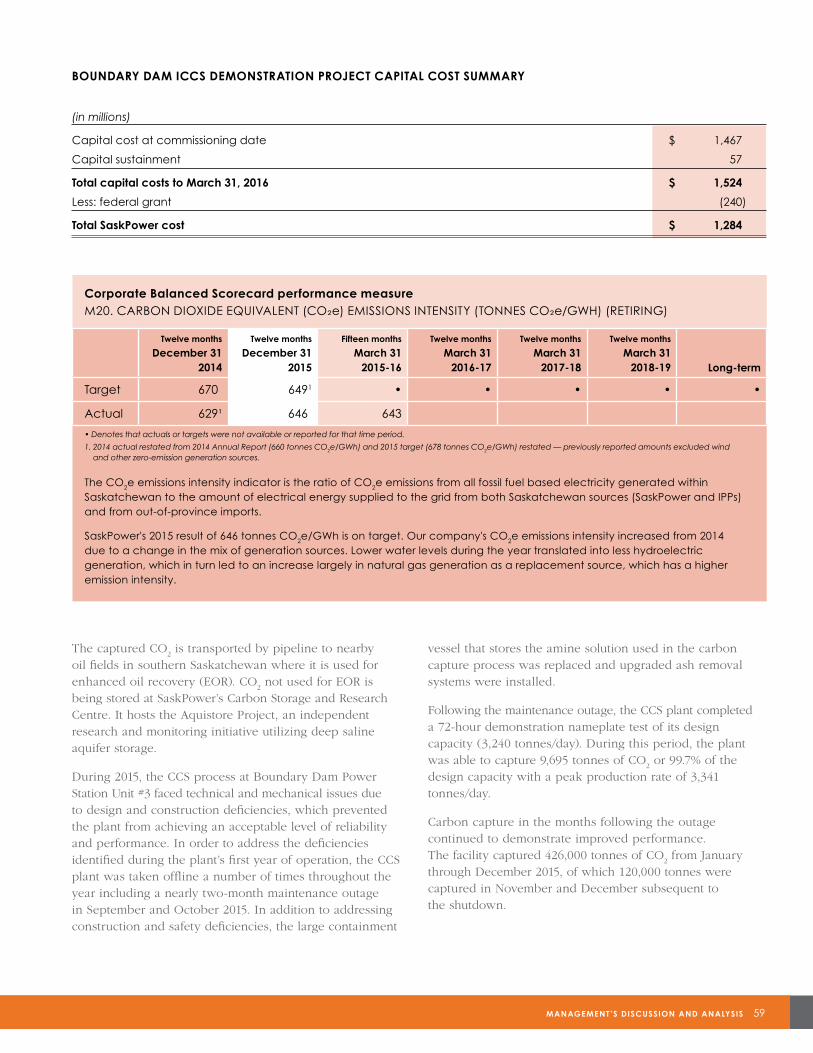
MANAGEMENT’S DISCUSSION AND ANALYSIS 59
The captured CO2 is transported by pipeline to nearby
oil fields in southern Saskatchewan where it is used for enhanced oil recovery (EOR). CO
2 not used for EOR is
being stored at SaskPower’s Carbon Storage and Research Centre. It hosts the Aquistore Project, an independent research and monitoring initiative utilizing deep saline aquifer storage.
During 2015, the CCS process at Boundary Dam Power Station Unit #3 faced technical and mechanical issues due to design and construction deficiencies, which prevented the plant from achieving an acceptable level of reliability and performance. In order to address the deficiencies identified during the plant’s first year of operation, the CCS plant was taken offline a number of times throughout the year including a nearly two-month maintenance outage in September and October 2015. In addition to addressing construction and safety deficiencies, the large containment
vessel that stores the amine solution used in the carbon capture process was replaced and upgraded ash removal systems were installed.
Following the maintenance outage, the CCS plant completed a 72-hour demonstration nameplate test of its design capacity (3,240 tonnes/day). During this period, the plant was able to capture 9,695 tonnes of CO
2 or 99.7% of the
design capacity with a peak production rate of 3,341 tonnes/day.
Carbon capture in the months following the outage continued to demonstrate improved performance. The facility captured 426,000 tonnes of CO
2 from January
through December 2015, of which 120,000 tonnes were captured in November and December subsequent to the shutdown.
Corporate Balanced Scorecard performance measureM20. CARBON DIOXIDE EQUIVALENT (CO2e) EMISSIONS INTENSITY (TONNES CO2e/GWH) (RETIRING)
Twelve months
December 312014
Twelve months
December 312015
Fifteen months
March 312015-16
Twelve months
March 312016-17
Twelve months
March 312017-18
Twelve months
March 312018-19 Long-term
Target 670 6491 • • • • •
Actual 6291 646 643
• Denotes that actuals or targets were not available or reported for that time period.
1. 2014 actual restated from 2014 Annual Report (660 tonnes CO2e/GWh) and 2015 target (678 tonnes CO2e/GWh) restated — previously reported amounts excluded wind and other zero-emission generation sources.
The CO2e emissions intensity indicator is the ratio of CO2e emissions from all fossil fuel based electricity generated within Saskatchewan to the amount of electrical energy supplied to the grid from both Saskatchewan sources (SaskPower and IPPs) and from out-of-province imports.
SaskPower's 2015 result of 646 tonnes CO2e/GWh is on target. Our company's CO2e emissions intensity increased from 2014 due to a change in the mix of generation sources. Lower water levels during the year translated into less hydroelectric generation, which in turn led to an increase largely in natural gas generation as a replacement source, which has a higher emission intensity.
BOUNDARY DAM ICCS DEMONSTRATION PROJECT CAPITAL COST SUMMARY
(in millions)
Capital cost at commissioning date $ 1,467
Capital sustainment 57
Total capital costs to March 31, 2016 $ 1,524
Less: federal grant (240)
Total SaskPower cost $ 1,284
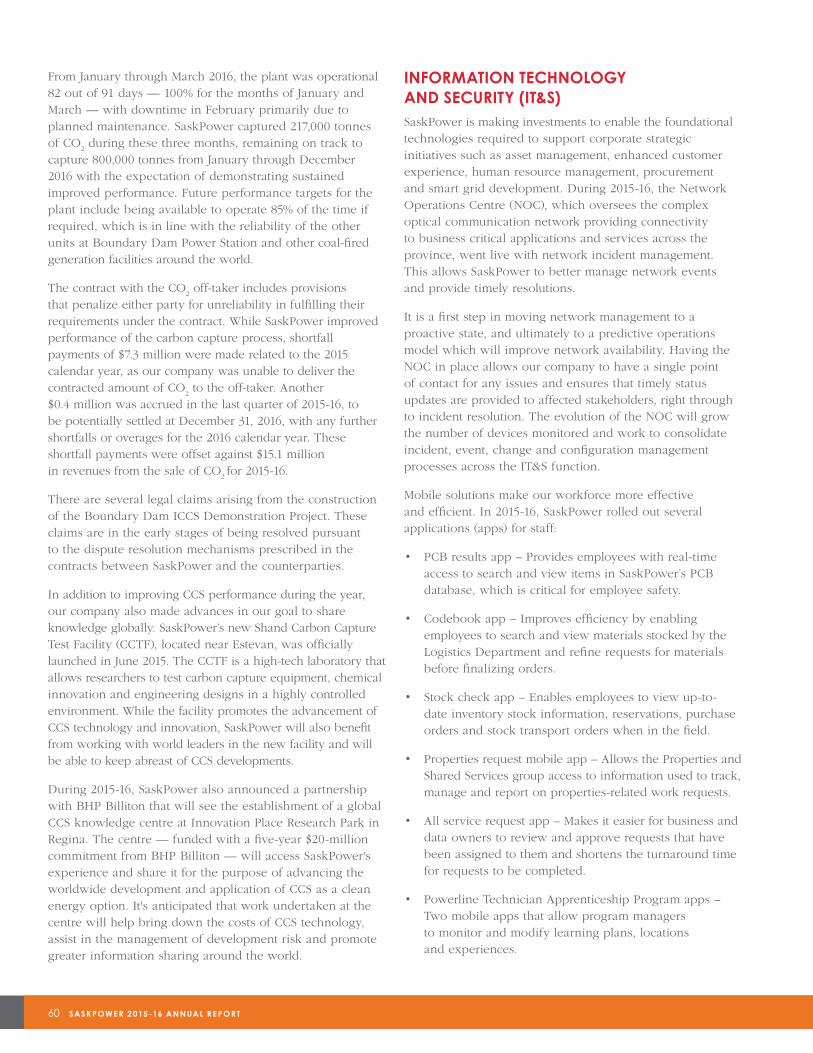
60 SASKPOWE R 2 015 -16 ANNUAL RE PORT
From January through March 2016, the plant was operational 82 out of 91 days — 100% for the months of January and March — with downtime in February primarily due to planned maintenance. SaskPower captured 217,000 tonnes of CO
2 during these three months, remaining on track to
capture 800,000 tonnes from January through December 2016 with the expectation of demonstrating sustained improved performance. Future performance targets for the plant include being available to operate 85% of the time if required, which is in line with the reliability of the other units at Boundary Dam Power Station and other coal-fired generation facilities around the world.
The contract with the CO2 off-taker includes provisions
that penalize either party for unreliability in fulfilling their requirements under the contract. While SaskPower improved performance of the carbon capture process, shortfall payments of $7.3 million were made related to the 2015 calendar year, as our company was unable to deliver the contracted amount of CO
2 to the off-taker. Another
$0.4 million was accrued in the last quarter of 2015-16, to be potentially settled at December 31, 2016, with any further shortfalls or overages for the 2016 calendar year. These shortfall payments were offset against $15.1 million in revenues from the sale of CO
2 for 2015-16.
There are several legal claims arising from the construction of the Boundary Dam ICCS Demonstration Project. These claims are in the early stages of being resolved pursuant to the dispute resolution mechanisms prescribed in the contracts between SaskPower and the counterparties.
In addition to improving CCS performance during the year, our company also made advances in our goal to share knowledge globally. SaskPower’s new Shand Carbon Capture Test Facility (CCTF), located near Estevan, was officially launched in June 2015. The CCTF is a high-tech laboratory that allows researchers to test carbon capture equipment, chemical innovation and engineering designs in a highly controlled environment. While the facility promotes the advancement of CCS technology and innovation, SaskPower will also benefit from working with world leaders in the new facility and will be able to keep abreast of CCS developments.
During 2015-16, SaskPower also announced a partnership with BHP Billiton that will see the establishment of a global CCS knowledge centre at Innovation Place Research Park in Regina. The centre — funded with a five-year $20-million commitment from BHP Billiton — will access SaskPower's experience and share it for the purpose of advancing the worldwide development and application of CCS as a clean energy option. It's anticipated that work undertaken at the centre will help bring down the costs of CCS technology, assist in the management of development risk and promote greater information sharing around the world.
INFORMATION TECHNOLOGY AND SECURITY (IT&S)SaskPower is making investments to enable the foundational technologies required to support corporate strategic initiatives such as asset management, enhanced customer experience, human resource management, procurement and smart grid development. During 2015-16, the Network Operations Centre (NOC), which oversees the complex optical communication network providing connectivity to business critical applications and services across the province, went live with network incident management. This allows SaskPower to better manage network events and provide timely resolutions.
It is a first step in moving network management to a proactive state, and ultimately to a predictive operations model which will improve network availability. Having the NOC in place allows our company to have a single point of contact for any issues and ensures that timely status updates are provided to affected stakeholders, right through to incident resolution. The evolution of the NOC will grow the number of devices monitored and work to consolidate incident, event, change and configuration management processes across the IT&S function.
Mobile solutions make our workforce more effective and efficient. In 2015-16, SaskPower rolled out several applications (apps) for staff:
• PCB results app – Provides employees with real-timeaccess to search and view items in SaskPower’s PCBdatabase, which is critical for employee safety.
• Codebook app – Improves efficiency by enablingemployees to search and view materials stocked by theLogistics Department and refine requests for materialsbefore finalizing orders.
• Stock check app – Enables employees to view up-to-date inventory stock information, reservations, purchaseorders and stock transport orders when in the field.
• Properties request mobile app – Allows the Properties andShared Services group access to information used to track,manage and report on properties-related work requests.
• All service request app – Makes it easier for business anddata owners to review and approve requests that havebeen assigned to them and shortens the turnaround timefor requests to be completed.
• Powerline Technician Apprenticeship Program apps –Two mobile apps that allow program managersto monitor and modify learning plans, locationsand experiences.
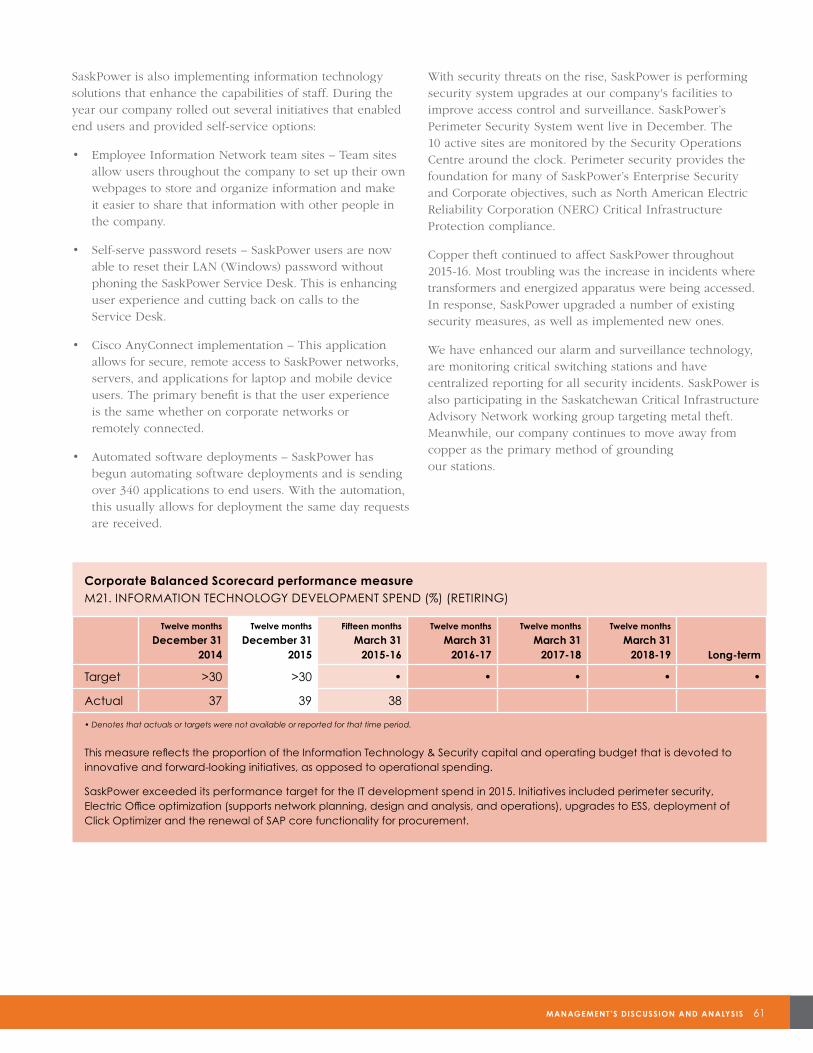
MANAGEMENT’S DISCUSSION AND ANALYSIS 61
SaskPower is also implementing information technology solutions that enhance the capabilities of staff. During the year our company rolled out several initiatives that enabled end users and provided self-service options:
• Employee Information Network team sites – Team sites allow users throughout the company to set up their own webpages to store and organize information and make it easier to share that information with other people in the company.
• Self-serve password resets – SaskPower users are now able to reset their LAN (Windows) password without phoning the SaskPower Service Desk. This is enhancing user experience and cutting back on calls to the Service Desk.
• Cisco AnyConnect implementation – This application allows for secure, remote access to SaskPower networks, servers, and applications for laptop and mobile device users. The primary benefit is that the user experience is the same whether on corporate networks or remotely connected.
• Automated software deployments – SaskPower has begun automating software deployments and is sending over 340 applications to end users. With the automation, this usually allows for deployment the same day requests are received.
With security threats on the rise, SaskPower is performing security system upgrades at our company's facilities to improve access control and surveillance. SaskPower’s Perimeter Security System went live in December. The 10 active sites are monitored by the Security Operations Centre around the clock. Perimeter security provides the foundation for many of SaskPower’s Enterprise Security and Corporate objectives, such as North American Electric Reliability Corporation (NERC) Critical Infrastructure Protection compliance.
Copper theft continued to affect SaskPower throughout 2015-16. Most troubling was the increase in incidents where transformers and energized apparatus were being accessed. In response, SaskPower upgraded a number of existing security measures, as well as implemented new ones.
We have enhanced our alarm and surveillance technology, are monitoring critical switching stations and have centralized reporting for all security incidents. SaskPower is also participating in the Saskatchewan Critical Infrastructure Advisory Network working group targeting metal theft. Meanwhile, our company continues to move away from copper as the primary method of grounding our stations.
Corporate Balanced Scorecard performance measureM21. INFORMATION TECHNOLOGY DEVELOPMENT SPEND (%) (RETIRING)
Twelve months
December 312014
Twelve months
December 312015
Fifteen months
March 312015-16
Twelve months
March 312016-17
Twelve months
March 312017-18
Twelve months
March 312018-19 Long-term
Target >30 >30 • • • • •
Actual 37 39 38
• Denotes that actuals or targets were not available or reported for that time period.
This measure reflects the proportion of the Information Technology & Security capital and operating budget that is devoted to innovative and forward-looking initiatives, as opposed to operational spending.
SaskPower exceeded its performance target for the IT development spend in 2015. Initiatives included perimeter security, Electric Office optimization (supports network planning, design and analysis, and operations), upgrades to ESS, deployment of Click Optimizer and the renewal of SAP core functionality for procurement.
62 SASKPOWE R 2 015 -16 ANNUAL RE PORT
2015-16 FINANCIAL RESULTS
Fifteen Months Three Months Twelve Months March 31 March 31 December 31
(in millions) 2016 2016 2015 2014 Change
Revenue
Saskatchewan electricity sales $ 2,690 $ 562 $ 2,128 $ 2,043 $ 85
Exports 9 1 8 7 1
Net costs from electricity trading (2) - (2) (2) -
Share of profit from equity accounted investees 2 1 1 2 (1)
Other revenue 188 27 161 107 54
2,887 591 2,296 2,157 139
Expense
Fuel and purchased power 818 168 650 638 12
Operating, maintenance and administration 793 159 634 656 (22)
Depreciation and amortization 571 119 452 389 63
Finance charges 463 101 362 326 36
Taxes 80 17 63 59 4
Other expenses 38 7 31 46 (15)
2,763 571 2,192 2,114 78
Income before the following $ 124 $ 20 $ 104 $ 43 $ 61
Unrealized market value adjustments (98) (34) (64) 17 (81)
Net income (loss) $ 26 $ (14) $ 40 $ 60 $ (20)
Return on equity (operating)1 5.7% 4.7% 2.0% 2.7%
Return on equity2 1.2% 1.8% 2.7% -0.9%
1. Return on equity (operating) = (income before unrealized market value adjustments)/(average equity).
2. Return on equity = (net income)/(average equity).
Change of year-endThe Corporation has been directed by the provincial government to change its fiscal year-end to March 31 to coincide with that of the Province of Saskatchewan. The first complete fiscal period will consist of the fifteen months ending March 31, 2016. Please see below for related references.
Q1 – Q4Quarter 1–Quarter 4 is defined as the period from January 1, 2015, to December 31, 2015.
Q5Quarter 5 is defined as the period from January 1, 2016, to March 31, 2016.
MANAGEMENT’S DISCUSSION AND ANALYSIS 63
HIGHLIGHTS AND SUMMARY OF RESULTS
Q1 – Q4SaskPower’s consolidated income before unrealized market value adjustments was $104 million in 2015, compared to $43 million in 2014. The increase in earnings was primarily due to higher revenue offset by an increase in expenses. SaskPower’s operating return on equity was 4.7% in 2015, up nearly three percentage points from the previous year.
Total revenue was $2,296 million, up $139 million from 2014. Saskatchewan electricity sales were up $85 million as a result of higher sales volumes as well as the system-wide average rate increase of 3.0% that became effective January 1, 2015. An additional system-wide average rate increase of 2.0% effective September 1, 2015, also contributed to the higher revenue realized in 2015. Electricity sales volumes to Saskatchewan customers were 21,625 gigawatt hours (GWh), up 236 GWh or 1.1% compared to the prior year.
In addition, other revenue increased $54 million as a result of higher customer contributions as well as rental fees from the Shand Carbon Capture Test Facility (CCTF). Export, trading and equity investment revenue was consistent with the prior year.
Total expense was $2,192 million, up $78 million from 2014. This is mainly attributable to capital-related expenses — depreciation, finance charges, taxes and other expenses — which increased $88 million in 2015 as a result of SaskPower’s capital program. Depreciation expense increased $63 million compared to 2014 as SaskPower invested $990 million in capital in 2015. Finance charges increased $36 million compared to 2014 due to additional interest expense incurred as a result of higher borrowings as well as lower interest capitalized. Taxes increased by $4 million as a result of growth in the Corporation’s capital tax base. Finally, other expenses decreased by $15 million largely due to the impairment loss on Advanced Metering Infrastructure (AMI) meters recognized in 2014.
Fuel and purchased power costs also increased $12 million, largely as a result of an unfavourable change in the fuel mix due to lower hydro generation being replaced by more expensive natural gas generation. This increase was offset by reduced operating, maintenance and administration (OM&A) costs, which were down $22 million in 2015 as compared to 2014, primarily as a result of reduced maintenance and cost-cutting initiatives.
SaskPower reported $64 million of unrealized market value net losses in 2015, compared to $17 million in net gains in 2014. The unrealized market value adjustments represent the change in the market value of our company’s outstanding natural gas hedges; electricity contracts; and debt retirement funds at year-end.
The net impact of SaskPower's operating results plus unrealized market value losses was a consolidated income of $40 million for the twelve months ended December 31, 2015.
Q5For the three months ended March 31, 2016, consolidated income before unrealized market value adjustments was $20 million. Total revenue was $591 million, with Saskatchewan electricity sales of $562 million and electricity sales volumes to Saskatchewan customers of 5,757 GWh. Exports, trading, and earnings from equity investments were $2 million, and other revenue was $27 million. Total expense was $571 million, including capital-related expenses of $244 million. Fuel and purchased power costs were $168 million, OM&A costs were $159 million, and $34 million of unrealized market value net losses were reported.
FIFTEEN MONTHSThe net impact of SaskPower's operating results plus unrealized market value losses was a consolidated income of $26 million for the fifteen months ended March 31, 2016.
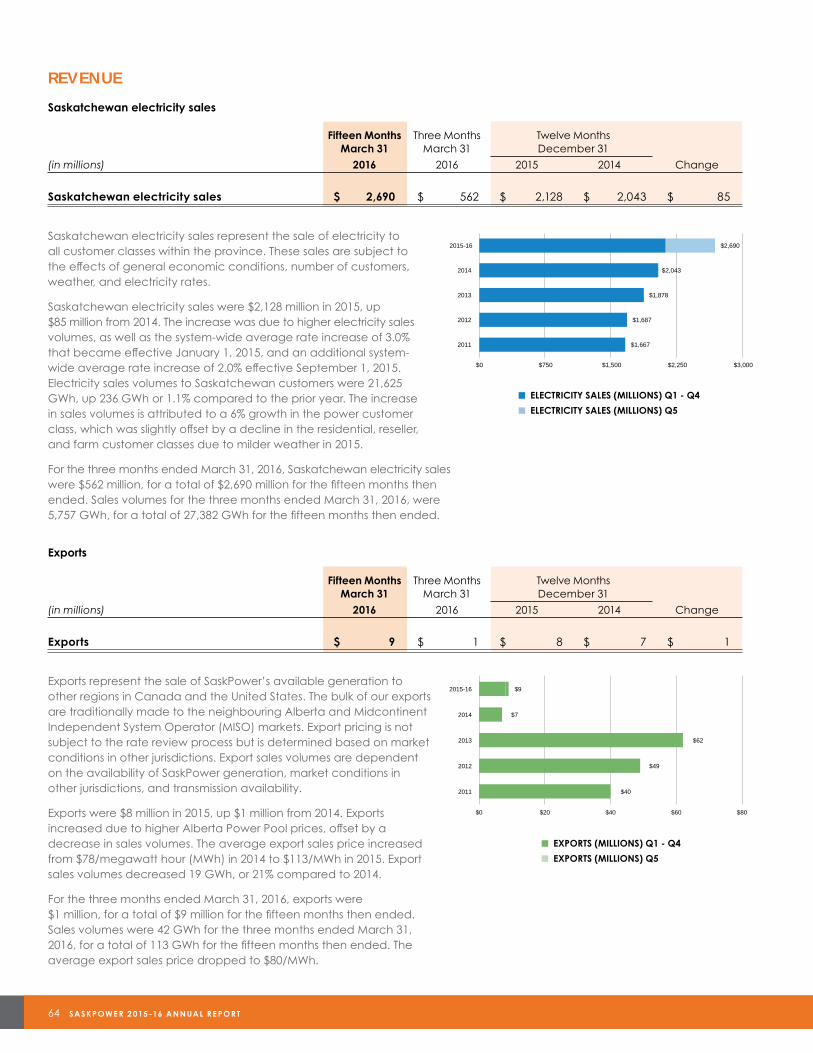
64 SASKPOWE R 2 015 -16 ANNUAL RE PORT
REVENUE
Saskatchewan electricity sales
Fifteen Months Three Months Twelve Months March 31 March 31 December 31
(in millions) 2016 2016 2015 2014 Change
Saskatchewan electricity sales $ 2,690 $ 562 $ 2,128 $ 2,043 $ 85
Saskatchewan electricity sales represent the sale of electricity to all customer classes within the province. These sales are subject to the effects of general economic conditions, number of customers, weather, and electricity rates.
Saskatchewan electricity sales were $2,128 million in 2015, up $85 million from 2014. The increase was due to higher electricity sales volumes, as well as the system-wide average rate increase of 3.0% that became effective January 1, 2015, and an additional system-wide average rate increase of 2.0% effective September 1, 2015. Electricity sales volumes to Saskatchewan customers were 21,625 GWh, up 236 GWh or 1.1% compared to the prior year. The increase in sales volumes is attributed to a 6% growth in the power customer class, which was slightly offset by a decline in the residential, reseller, and farm customer classes due to milder weather in 2015.
For the three months ended March 31, 2016, Saskatchewan electricity sales were $562 million, for a total of $2,690 million for the fifteen months then ended. Sales volumes for the three months ended March 31, 2016, were 5,757 GWh, for a total of 27,382 GWh for the fifteen months then ended.
Exports
Fifteen Months Three Months Twelve Months March 31 March 31 December 31
(in millions) 2016 2016 2015 2014 Change
Exports $ 9 $ 1 $ 8 $ 7 $ 1
Exports represent the sale of SaskPower’s available generation to other regions in Canada and the United States. The bulk of our exports are traditionally made to the neighbouring Alberta and Midcontinent Independent System Operator (MISO) markets. Export pricing is not subject to the rate review process but is determined based on market conditions in other jurisdictions. Export sales volumes are dependent on the availability of SaskPower generation, market conditions in other jurisdictions, and transmission availability.
Exports were $8 million in 2015, up $1 million from 2014. Exports increased due to higher Alberta Power Pool prices, offset by a decrease in sales volumes. The average export sales price increased from $78/megawatt hour (MWh) in 2014 to $113/MWh in 2015. Export sales volumes decreased 19 GWh, or 21% compared to 2014.
For the three months ended March 31, 2016, exports were $1 million, for a total of $9 million for the fifteen months then ended. Sales volumes were 42 GWh for the three months ended March 31, 2016, for a total of 113 GWh for the fifteen months then ended. The average export sales price dropped to $80/MWh.
Saskatchewan Electricity Sales2011 2012 2013 2014 2015-16
Electricity sales (millions) Q1 - Q4 1,667$ 1,687$ 1,878$ 2,043$ 2,128$Electricity sales (millions) Q5 -$ -$ -$ -$ 562$
$1,667
$1,687
$1,878
$2,043
$2,690
$0 $750 $1,500 $2,250 $3,000
2011
2012
2013
2014
2015-16
ELECTRICITY SALES (MILLIONS) Q1 - Q4 ELECTRICITY SALES (MILLIONS) Q5
Exports2011 2012 2013 2014
Exports (millions) Q1 - Q4 40$ 49$ 62$ 7$Exports (millions) Q5 -$ -$ -$ -$
$40
$49
$62
$7
$9
$0 $20 $40 $60 $80
2011
2012
2013
2014
2015-16
EXPORTS (MILLIONS) Q1 - Q4 EXPORTS (MILLIONS) Q5
Revised Graphs 05-24-16 p.4 Debt Ratio.pdf 1 2016-06-01 1:47 PM
■ ELECTRICITY SALES (MILLIONS) Q1 - Q4
■ ELECTRICITY SALES (MILLIONS) Q5
■ EXPORTS (MILLIONS) Q1 - Q4
■ EXPORTS (MILLIONS) Q5
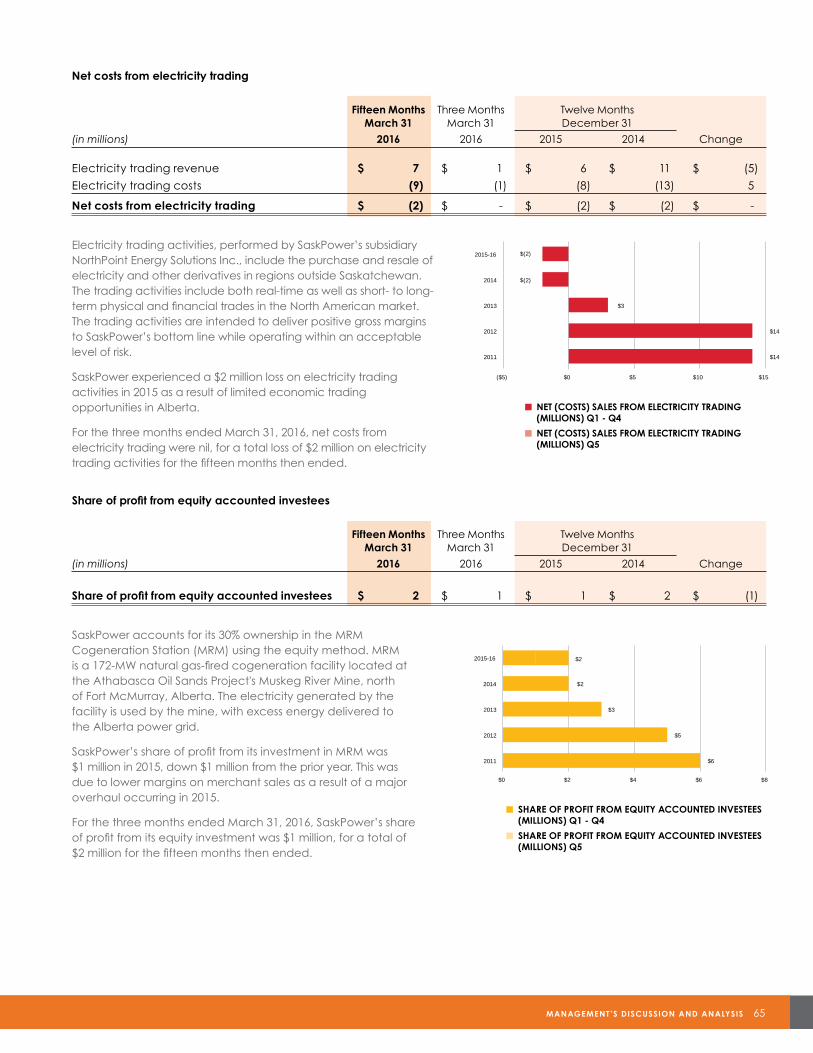
MANAGEMENT’S DISCUSSION AND ANALYSIS 65
Net costs from electricity trading
Fifteen Months Three Months Twelve Months March 31 March 31 December 31
(in millions) 2016 2016 2015 2014 Change
Electricity trading revenue $ 7 $ 1 $ 6 $ 11 $ (5)
Electricity trading costs (9) (1) (8) (13) 5
Net costs from electricity trading $ (2) $ - $ (2) $ (2) $ -
Electricity trading activities, performed by SaskPower’s subsidiary NorthPoint Energy Solutions Inc., include the purchase and resale of electricity and other derivatives in regions outside Saskatchewan. The trading activities include both real-time as well as short- to long-term physical and financial trades in the North American market. The trading activities are intended to deliver positive gross margins to SaskPower’s bottom line while operating within an acceptable level of risk.
SaskPower experienced a $2 million loss on electricity trading activities in 2015 as a result of limited economic trading opportunities in Alberta.
For the three months ended March 31, 2016, net costs from electricity trading were nil, for a total loss of $2 million on electricity trading activities for the fifteen months then ended.
Share of profit from equity accounted investees
Fifteen Months Three Months Twelve Months March 31 March 31 December 31
(in millions) 2016 2016 2015 2014 Change
Share of profit from equity accounted investees $ 2 $ 1 $ 1 $ 2 $ (1)
SaskPower accounts for its 30% ownership in the MRM Cogeneration Station (MRM) using the equity method. MRM is a 172-MW natural gas-fired cogeneration facility located at the Athabasca Oil Sands Project's Muskeg River Mine, north of Fort McMurray, Alberta. The electricity generated by the facility is used by the mine, with excess energy delivered to the Alberta power grid.
SaskPower’s share of profit from its investment in MRM was $1 million in 2015, down $1 million from the prior year. This was due to lower margins on merchant sales as a result of a major overhaul occurring in 2015.
For the three months ended March 31, 2016, SaskPower’s share of profit from its equity investment was $1 million, for a total of $2 million for the fifteen months then ended.
Net Sales from Electricity Trading2011 2012 2013 2014 2015-16
Net (costs) sales from electricity trading (millions) Q1 - Q4 14$ 14$ 3$ (2)$ (2)$Net (costs) sales from electricity trading (millions) Q5 -$ -$ -$ -$ -$
$14
$14
$3
$(2)
$(2)
($5) $0 $5 $10 $15
2011
2012
2013
2014
2015-16
NET (COSTS) SALES FROM ELECTRICITY TRADING (MILLIONS) Q1 - Q4
NET (COSTS) SALES FROM ELECTRICITY TRADING (MILLIONS) Q5
Share of profit from equity accounted investees2011 2012 2013 2014 2015-16
Share of profit from equity accounted investees (millions) Q1 - Q4 6$ 5$ 3$ 2$ 1$Share of profit from equity accounted investees (millions) Q5 -$ -$ -$ -$ 1$
$6
$5
$3
$2
$2
$0 $2 $4 $6 $8
2011
2012
2013
2014
2015-16
SHARE OF PROFIT FROM EQUITY ACCOUNTED INVESTEES (MILLIONS) Q1 - Q4
SHARE OF PROFIT FROM EQUITY ACCOUNTED INVESTEES (MILLIONS) Q5
MD&A 2015 Graphs(1) 4 Year ROE vs Long-term Target.pdf 1 2016-06-01 1:57 PM
MD&A 2015 Graphs(1) 4 Year ROE vs Long-term Target.pdf 1 2016-06-01 2:00 PM
MD&A 2015 Graphs(1) 4 Year ROE vs Long-term Target.pdf 1 2016-06-01 2:02 PM
MD&A 2015 Graphs(1) 4 Year ROE vs Long-term Target.pdf 1 2016-06-01 2:05 PM
■ NET (COSTS) SALES FROM ELECTRICITY TRADING (MILLIONS) Q1 - Q4
■ NET (COSTS) SALES FROM ELECTRICITY TRADING (MILLIONS) Q5
■ SHARE OF PROFIT FROM EQUITY ACCOUNTED INVESTEES(MILLIONS) Q1 - Q4
■ SHARE OF PROFIT FROM EQUITY ACCOUNTED INVESTEES(MILLIONS) Q5
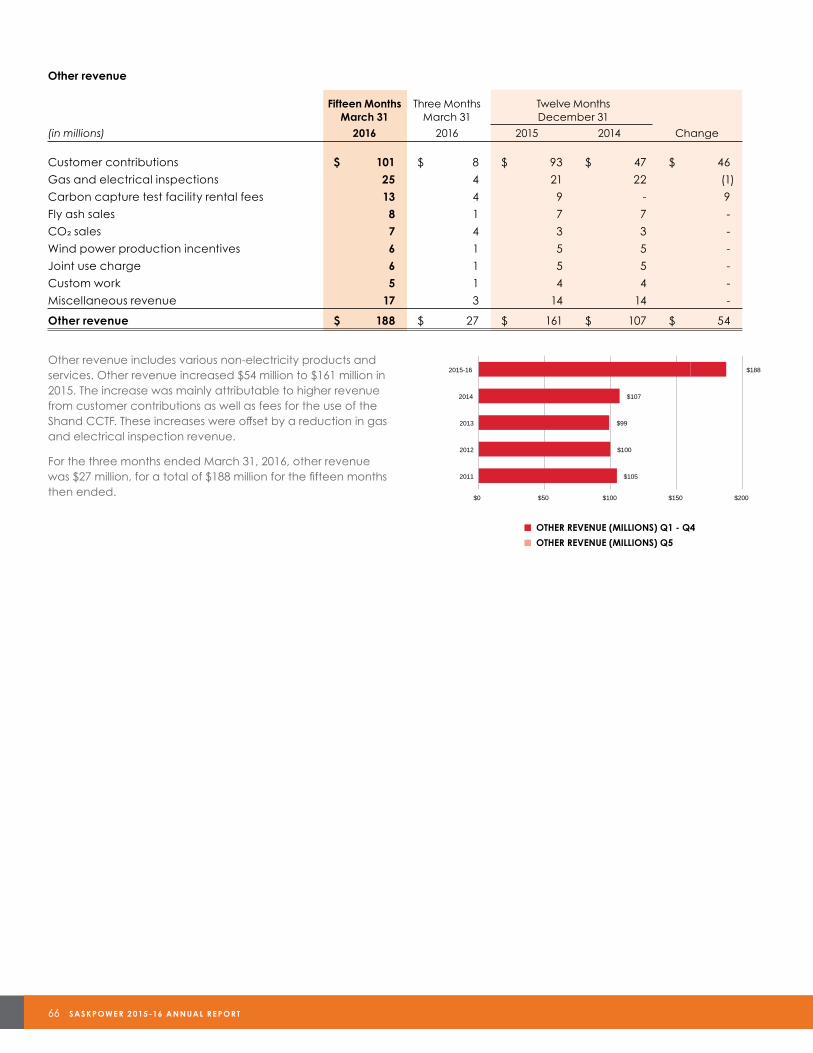
66 SASKPOWE R 2 015 -16 ANNUAL RE PORT
Other revenue
Fifteen Months Three Months Twelve Months March 31 March 31 December 31
(in millions) 2016 2016 2015 2014 Change
Customer contributions $ 101 $ 8 $ 93 $ 47 $ 46
Gas and electrical inspections 25 4 21 22 (1)
Carbon capture test facility rental fees 13 4 9 - 9
Fly ash sales 8 1 7 7 -
CO2 sales 7 4 3 3 -
Wind power production incentives 6 1 5 5 -
Joint use charge 6 1 5 5 -
Custom work 5 1 4 4 -
Miscellaneous revenue 17 3 14 14 -
Other revenue $ 188 $ 27 $ 161 $ 107 $ 54
Other revenue includes various non-electricity products and services. Other revenue increased $54 million to $161 million in 2015. The increase was mainly attributable to higher revenue from customer contributions as well as fees for the use of the Shand CCTF. These increases were offset by a reduction in gas and electrical inspection revenue.
For the three months ended March 31, 2016, other revenue was $27 million, for a total of $188 million for the fifteen months then ended.
Other revenue2011 2012 2013 2014 2015-16
Other revenue (millions) Q1 - Q4 105 100 99 107 161Other revenue (millions) Q5 - - - - 27
$105
$100
$99
$107
$0 $50 $100 $150 $200
2011
2012
2013
2014
2015-16
OTHER REVENUE (MILLIONS) Q1 - Q4 OTHER REVENUE (MILLIONS) Q5
$188
■ OTHER REVENUE (MILLIONS) Q1 - Q4
■ OTHER REVENUE (MILLIONS) Q5
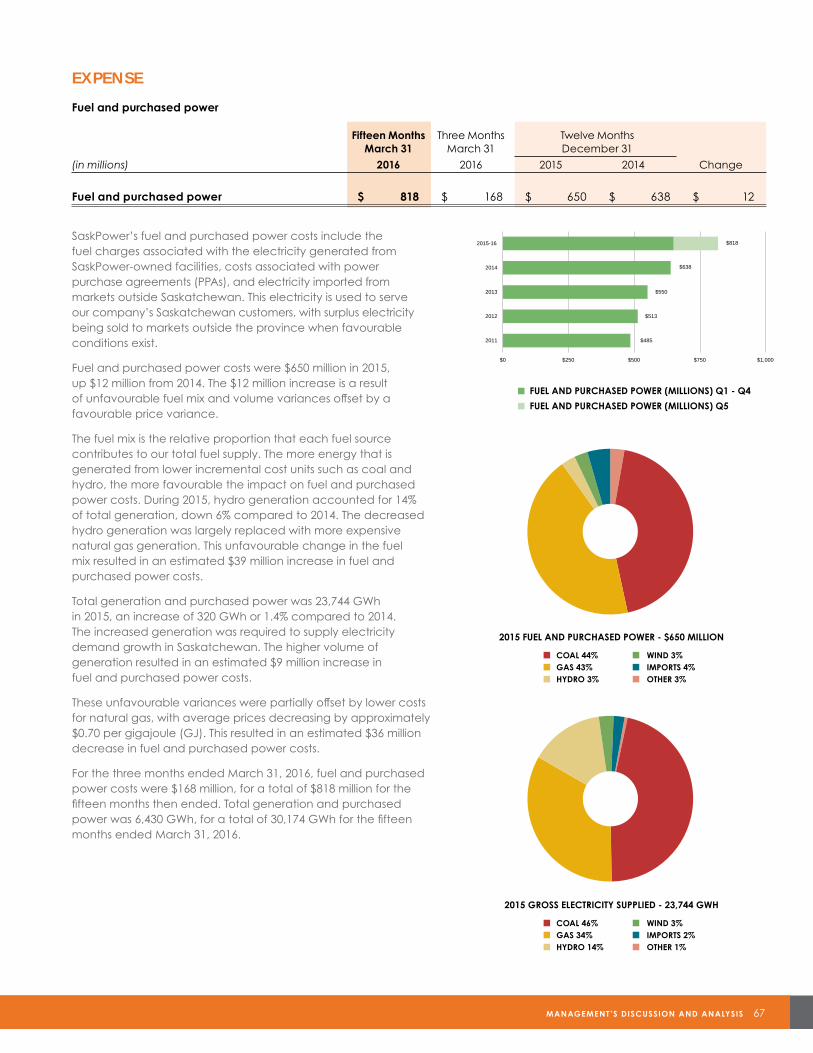
MANAGEMENT’S DISCUSSION AND ANALYSIS 67
EXPENSE
Fuel and purchased power
Fifteen Months Three Months Twelve Months March 31 March 31 December 31
(in millions) 2016 2016 2015 2014 Change
Fuel and purchased power $ 818 $ 168 $ 650 $ 638 $ 12
SaskPower’s fuel and purchased power costs include the fuel charges associated with the electricity generated from SaskPower-owned facilities, costs associated with power purchase agreements (PPAs), and electricity imported from markets outside Saskatchewan. This electricity is used to serve our company’s Saskatchewan customers, with surplus electricity being sold to markets outside the province when favourable conditions exist.
Fuel and purchased power costs were $650 million in 2015, up $12 million from 2014. The $12 million increase is a result of unfavourable fuel mix and volume variances offset by a favourable price variance.
The fuel mix is the relative proportion that each fuel source contributes to our total fuel supply. The more energy that is generated from lower incremental cost units such as coal and hydro, the more favourable the impact on fuel and purchased power costs. During 2015, hydro generation accounted for 14% of total generation, down 6% compared to 2014. The decreased hydro generation was largely replaced with more expensive natural gas generation. This unfavourable change in the fuel mix resulted in an estimated $39 million increase in fuel and purchased power costs.
Total generation and purchased power was 23,744 GWh in 2015, an increase of 320 GWh or 1.4% compared to 2014. The increased generation was required to supply electricity demand growth in Saskatchewan. The higher volume of generation resulted in an estimated $9 million increase in fuel and purchased power costs.
These unfavourable variances were partially offset by lower costs for natural gas, with average prices decreasing by approximately $0.70 per gigajoule (GJ). This resulted in an estimated $36 million decrease in fuel and purchased power costs.
For the three months ended March 31, 2016, fuel and purchased power costs were $168 million, for a total of $818 million for the fifteen months then ended. Total generation and purchased power was 6,430 GWh, for a total of 30,174 GWh for the fifteen months ended March 31, 2016.
OTHER 3%
COAL 44%
GAS 43%
HYDRO 3%
WIND 3%
IMPORTS 4%
2015 FUEL AND PURCHASED POWER - $650 MILLION
OTHER 1%
COAL 46%
GAS 34%
HYDRO 14%
WIND 3%
IMPORTS 2%
2015 GROSS ELECTRICITY SUPPLIED - 23,744 GWH
Fuel and Purchased Power2011 2012 2013 2014
Fuel and purchased power (millions) Q1 - Q4 485 513 550 638Fuel and purchased power (millions) Q5 - - - -
$0 $250 $500 $750
2011
2012
2013
2014
2015-16
FUEL AND PURCHASED POWER (MILLIONS) Q1 - Q4 FUEL AND PURCHASED POWER (MILLIONS) Q5
$1,000
$818
$638
$550
$513
$485
■ FUEL AND PURCHASED POWER (MILLIONS) Q1 - Q4
■ FUEL AND PURCHASED POWER (MILLIONS) Q5
2015 FUEL AND PURCHASED POWER - $650 MILLION
■ COAL 44% ■ WIND 3%
■ GAS 43% ■ IMPORTS 4%
■ HYDRO 3% ■ OTHER 3%
2015 GROSS ELECTRICITY SUPPLIED - 23,744 GWH
■ COAL 46% ■ WIND 3%
■ GAS 34% ■ IMPORTS 2%
■ HYDRO 14% ■ OTHER 1%
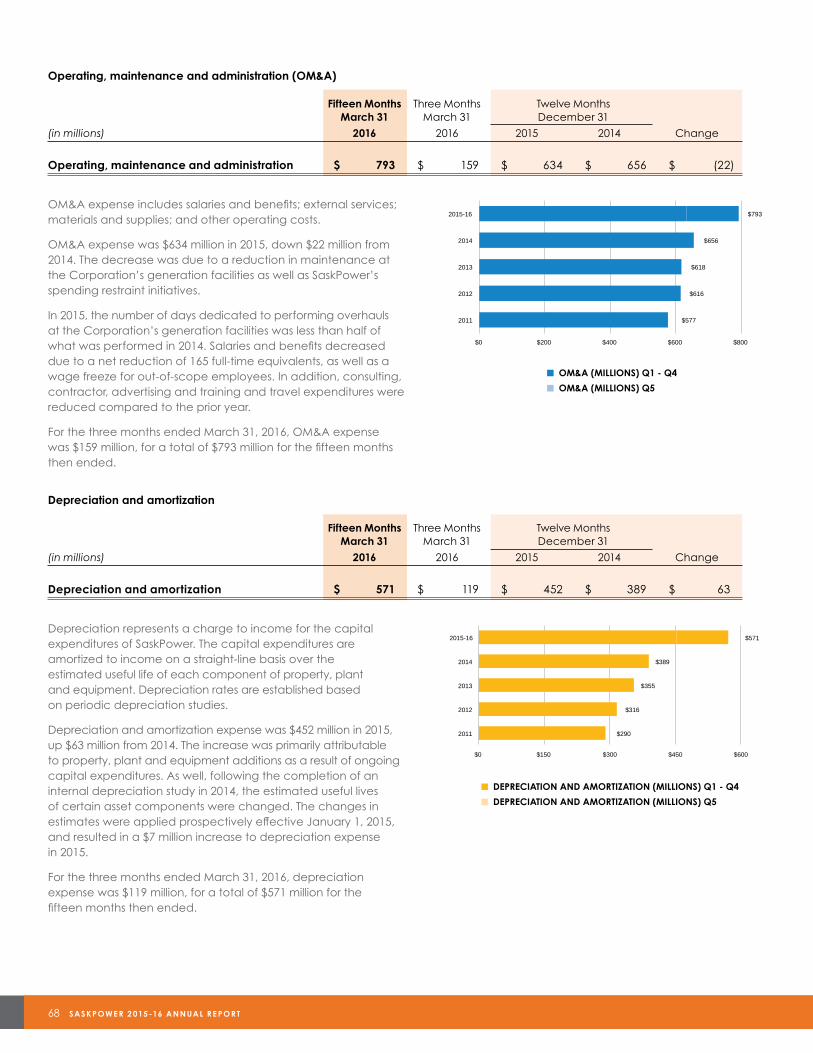
68 SASKPOWE R 2 015 -16 ANNUAL RE PORT
Operating, maintenance and administration (OM&A)
Fifteen Months Three Months Twelve Months March 31 March 31 December 31
(in millions) 2016 2016 2015 2014 Change
Operating, maintenance and administration $ 793 $ 159 $ 634 $ 656 $ (22)
OM&A expense includes salaries and benefits; external services; materials and supplies; and other operating costs.
OM&A expense was $634 million in 2015, down $22 million from 2014. The decrease was due to a reduction in maintenance at the Corporation’s generation facilities as well as SaskPower’s spending restraint initiatives.
In 2015, the number of days dedicated to performing overhauls at the Corporation’s generation facilities was less than half of what was performed in 2014. Salaries and benefits decreased due to a net reduction of 165 full-time equivalents, as well as a wage freeze for out-of-scope employees. In addition, consulting, contractor, advertising and training and travel expenditures were reduced compared to the prior year.
For the three months ended March 31, 2016, OM&A expense was $159 million, for a total of $793 million for the fifteen months then ended.
Depreciation and amortization
Fifteen Months Three Months Twelve Months March 31 March 31 December 31
(in millions) 2016 2016 2015 2014 Change
Depreciation and amortization $ 571 $ 119 $ 452 $ 389 $ 63
Depreciation represents a charge to income for the capital expenditures of SaskPower. The capital expenditures are amortized to income on a straight-line basis over the estimated useful life of each component of property, plant and equipment. Depreciation rates are established based on periodic depreciation studies.
Depreciation and amortization expense was $452 million in 2015, up $63 million from 2014. The increase was primarily attributable to property, plant and equipment additions as a result of ongoing capital expenditures. As well, following the completion of an internal depreciation study in 2014, the estimated useful lives of certain asset components were changed. The changes in estimates were applied prospectively effective January 1, 2015, and resulted in a $7 million increase to depreciation expense in 2015.
For the three months ended March 31, 2016, depreciation expense was $119 million, for a total of $571 million for the fifteen months then ended.
Operating, Maintenance and Administration (OM&A)2011 2012 2013 2014 2015-16
OM&A (millions) Q1 - Q4 577 616 618 656 634OM&A (millions) Q5 - - - - 159
$577
$616
$618
$656
$0 $200 $400 $600 $800
2011
2012
2013
2014
2015-16
OM&A (MILLIONS) Q1 - Q4 OM&A (MILLIONS) Q5
$200
$400
$600
$800
$793
Depreciation and Amortization2011 2012 2013 2014 2015-16
Depreciation and amortization (millions) Q1 - Q4 290 316 355 389 452Depreciation and amortization (millions) Q5 - - - - 119
$290
$316
$355
$389
$571
$0 $150 $300 $450 $600
2011
2012
2013
2014
2015-16
DEPRECIATION AND AMORTIZATION (MILLIONS) Q1 - Q4
DEPRECIATION AND AMORTIZATION (MILLIONS) Q5
■ OM&A (MILLIONS) Q1 - Q4
■ OM&A (MILLIONS) Q5
■ DEPRECIATION AND AMORTIZATION (MILLIONS) Q1 - Q4
■ DEPRECIATION AND AMORTIZATION (MILLIONS) Q5
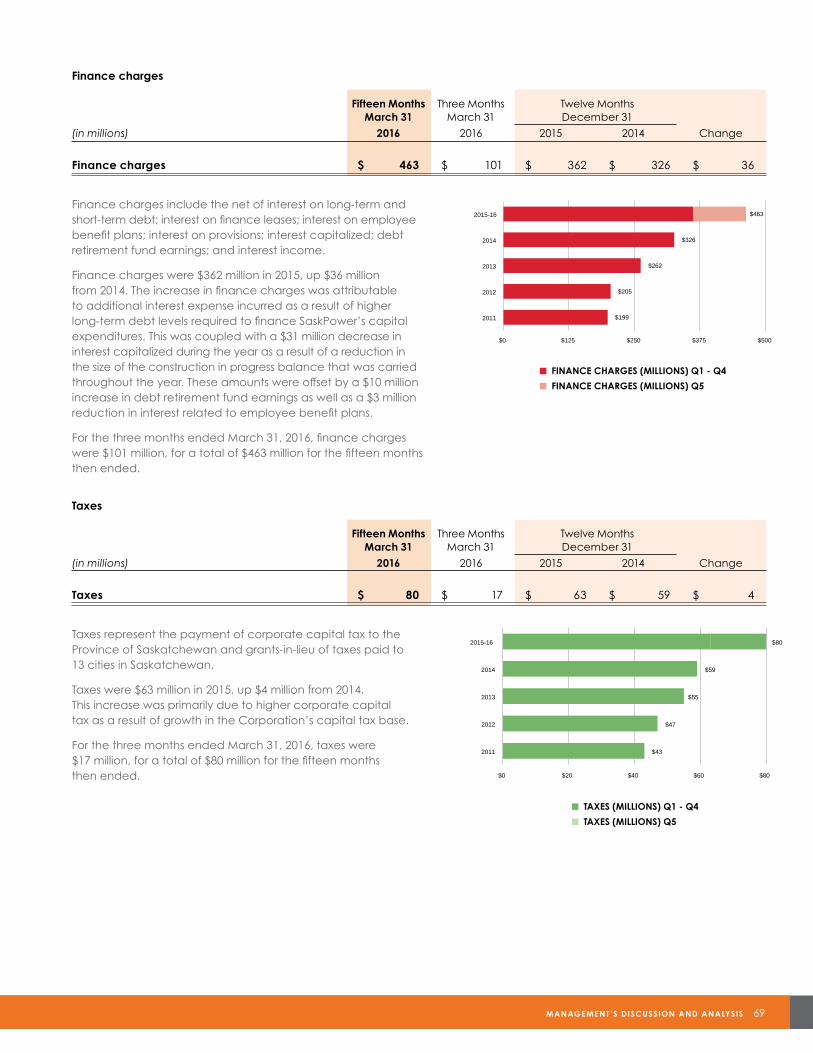
MANAGEMENT’S DISCUSSION AND ANALYSIS 69
Finance charges
Fifteen Months Three Months Twelve Months March 31 March 31 December 31
(in millions) 2016 2016 2015 2014 Change
Finance charges $ 463 $ 101 $ 362 $ 326 $ 36
Finance charges include the net of interest on long-term and short-term debt; interest on finance leases; interest on employee benefit plans; interest on provisions; interest capitalized; debt retirement fund earnings; and interest income.
Finance charges were $362 million in 2015, up $36 million from 2014. The increase in finance charges was attributable to additional interest expense incurred as a result of higher long-term debt levels required to finance SaskPower’s capital expenditures. This was coupled with a $31 million decrease in interest capitalized during the year as a result of a reduction in the size of the construction in progress balance that was carried throughout the year. These amounts were offset by a $10 million increase in debt retirement fund earnings as well as a $3 million reduction in interest related to employee benefit plans.
For the three months ended March 31, 2016, finance charges were $101 million, for a total of $463 million for the fifteen months then ended.
Taxes
Fifteen Months Three Months Twelve Months March 31 March 31 December 31
(in millions) 2016 2016 2015 2014 Change
Taxes $ 80 $ 17 $ 63 $ 59 $ 4
Taxes represent the payment of corporate capital tax to the Province of Saskatchewan and grants-in-lieu of taxes paid to 13 cities in Saskatchewan.
Taxes were $63 million in 2015, up $4 million from 2014. This increase was primarily due to higher corporate capital tax as a result of growth in the Corporation’s capital tax base.
For the three months ended March 31, 2016, taxes were $17 million, for a total of $80 million for the fifteen months then ended.
Finance Charges2011 2012 2013 2014 2015-16
Finance charges (millions) Q1 - Q4 199 205 262 326 362Finance charges (millions) Q5 0 0 0 0 101
$199
$205
$262
$326
$463
$0 $125 $250 $375 $500
2011
2012
2013
2014
2015-16
FINANCE CHARGES (MILLIONS) Q1 - Q4 FINANCE CHARGES (MILLIONS) Q5
Taxes2011 2012 2013 2014 2015-16
Taxes (millions) Q1 - Q4 43 47 55 59 63Taxes (millions) Q5 0 0 0 0 17
$43
$47
$55
$59
$80
$0 $20 $40 $60 $80
2011
2012
2013
2014
2015-16
TAXES (MILLIONS) Q1 - Q4 TAXES (MILLIONS) Q5
■ FINANCE CHARGES (MILLIONS) Q1 - Q4
■ FINANCE CHARGES (MILLIONS) Q5
■ TAXES (MILLIONS) Q1 - Q4
■ TAXES (MILLIONS) Q5
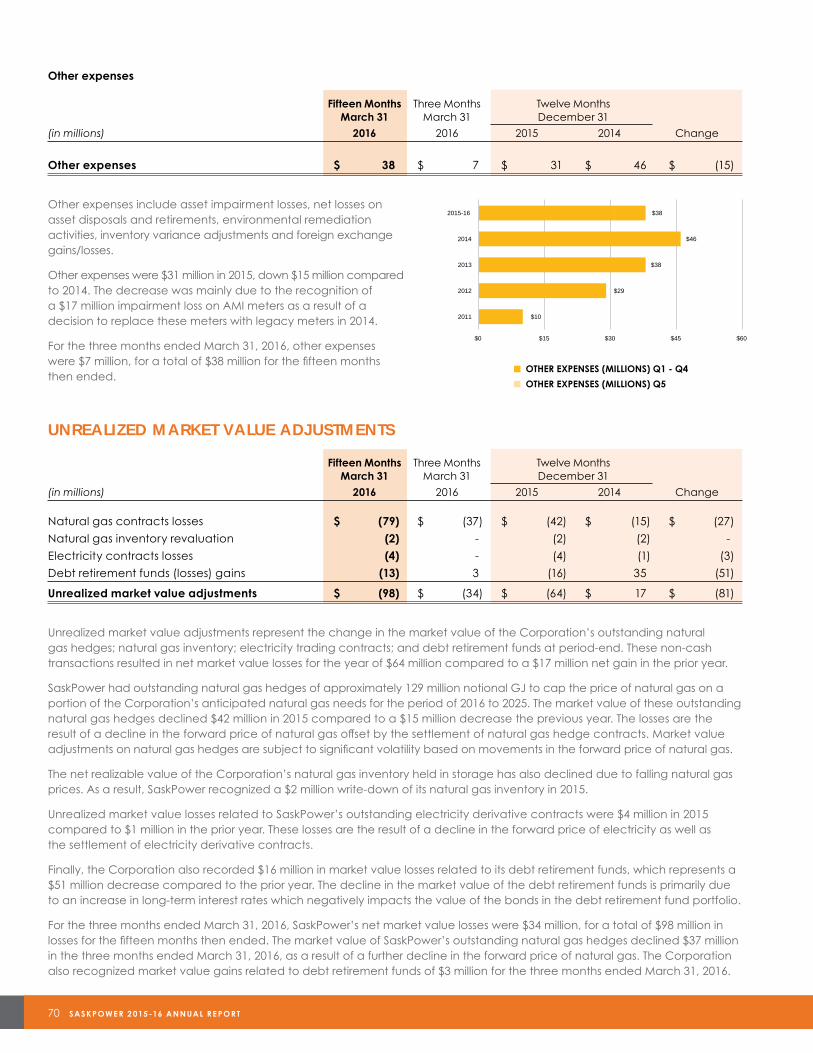
70 SASKPOWE R 2 015 -16 ANNUAL RE PORT
Other expenses
Fifteen Months Three Months Twelve Months March 31 March 31 December 31
(in millions) 2016 2016 2015 2014 Change
Other expenses $ 38 $ 7 $ 31 $ 46 $ (15)
Other expenses include asset impairment losses, net losses on asset disposals and retirements, environmental remediation activities, inventory variance adjustments and foreign exchange gains/losses.
Other expenses were $31 million in 2015, down $15 million compared to 2014. The decrease was mainly due to the recognition of a $17 million impairment loss on AMI meters as a result of a decision to replace these meters with legacy meters in 2014.
For the three months ended March 31, 2016, other expenses were $7 million, for a total of $38 million for the fifteen months then ended.
UNREALIZED MARKET VALUE ADJUSTMENTS
Fifteen Months Three Months Twelve Months March 31 March 31 December 31
(in millions) 2016 2016 2015 2014 Change
Natural gas contracts losses $ (79) $ (37) $ (42) $ (15) $ (27)
Natural gas inventory revaluation (2) - (2) (2) -
Electricity contracts losses (4) - (4) (1) (3)
Debt retirement funds (losses) gains (13) 3 (16) 35 (51)
Unrealized market value adjustments $ (98) $ (34) $ (64) $ 17 $ (81)
Unrealized market value adjustments represent the change in the market value of the Corporation’s outstanding natural gas hedges; natural gas inventory; electricity trading contracts; and debt retirement funds at period-end. These non-cash transactions resulted in net market value losses for the year of $64 million compared to a $17 million net gain in the prior year.
SaskPower had outstanding natural gas hedges of approximately 129 million notional GJ to cap the price of natural gas on a portion of the Corporation’s anticipated natural gas needs for the period of 2016 to 2025. The market value of these outstanding natural gas hedges declined $42 million in 2015 compared to a $15 million decrease the previous year. The losses are the result of a decline in the forward price of natural gas offset by the settlement of natural gas hedge contracts. Market value adjustments on natural gas hedges are subject to significant volatility based on movements in the forward price of natural gas.
The net realizable value of the Corporation’s natural gas inventory held in storage has also declined due to falling natural gas prices. As a result, SaskPower recognized a $2 million write-down of its natural gas inventory in 2015.
Unrealized market value losses related to SaskPower’s outstanding electricity derivative contracts were $4 million in 2015 compared to $1 million in the prior year. These losses are the result of a decline in the forward price of electricity as well as the settlement of electricity derivative contracts.
Finally, the Corporation also recorded $16 million in market value losses related to its debt retirement funds, which represents a $51 million decrease compared to the prior year. The decline in the market value of the debt retirement funds is primarily due to an increase in long-term interest rates which negatively impacts the value of the bonds in the debt retirement fund portfolio.
For the three months ended March 31, 2016, SaskPower’s net market value losses were $34 million, for a total of $98 million in losses for the fifteen months then ended. The market value of SaskPower’s outstanding natural gas hedges declined $37 million in the three months ended March 31, 2016, as a result of a further decline in the forward price of natural gas. The Corporation also recognized market value gains related to debt retirement funds of $3 million for the three months ended March 31, 2016.
Other expenses2011 2012 2013 2014 2015-16
Other expenses (millions) Q1 - Q4 10 29 38 46 31Other expenses (millions) Q5 0 0 0 0 7
$10
$29
$38
$46
$38
$0 $15 $30 $45 $60
2011
2012
2013
2014
2015-16
OTHER EXPENSES (MILLIONS) Q1 - Q4 OTHER EXPENSES (MILLIONS) Q5
■ OTHER EXPENSES (MILLIONS) Q1 - Q4
■ OTHER EXPENSES (MILLIONS) Q5
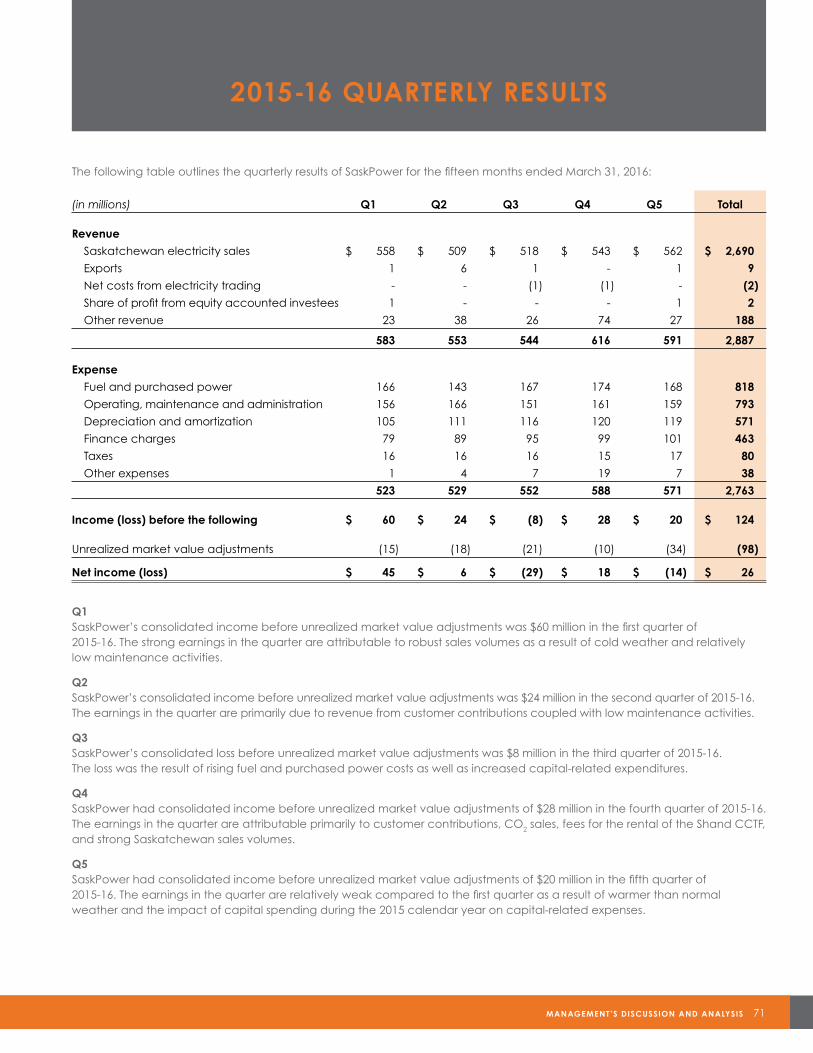
MANAGEMENT’S DISCUSSION AND ANALYSIS 71
2015-16 QUARTERLY RESULTS
The following table outlines the quarterly results of SaskPower for the fifteen months ended March 31, 2016:
(in millions) Q1 Q2 Q3 Q4 Q5 Total
Revenue
Saskatchewan electricity sales $ 558 $ 509 $ 518 $ 543 $ 562 $ 2,690
Exports 1 6 1 - 1 9
Net costs from electricity trading - - (1) (1) - (2)
Share of profit from equity accounted investees 1 - - - 1 2
Other revenue 23 38 26 74 27 188
583 553 544 616 591 2,887
Expense
Fuel and purchased power 166 143 167 174 168 818
Operating, maintenance and administration 156 166 151 161 159 793
Depreciation and amortization 105 111 116 120 119 571
Finance charges 79 89 95 99 101 463
Taxes 16 16 16 15 17 80
Other expenses 1 4 7 19 7 38
523 529 552 588 571 2,763
Income (loss) before the following $ 60 $ 24 $ (8) $ 28 $ 20 $ 124
Unrealized market value adjustments (15) (18) (21) (10) (34) (98)
Net income (loss) $ 45 $ 6 $ (29) $ 18 $ (14) $ 26
Q1SaskPower’s consolidated income before unrealized market value adjustments was $60 million in the first quarter of 2015-16. The strong earnings in the quarter are attributable to robust sales volumes as a result of cold weather and relatively low maintenance activities.
Q2 SaskPower’s consolidated income before unrealized market value adjustments was $24 million in the second quarter of 2015-16. The earnings in the quarter are primarily due to revenue from customer contributions coupled with low maintenance activities.
Q3SaskPower’s consolidated loss before unrealized market value adjustments was $8 million in the third quarter of 2015-16. The loss was the result of rising fuel and purchased power costs as well as increased capital-related expenditures.
Q4 SaskPower had consolidated income before unrealized market value adjustments of $28 million in the fourth quarter of 2015-16. The earnings in the quarter are attributable primarily to customer contributions, CO2 sales, fees for the rental of the Shand CCTF, and strong Saskatchewan sales volumes.
Q5SaskPower had consolidated income before unrealized market value adjustments of $20 million in the fifth quarter of 2015-16. The earnings in the quarter are relatively weak compared to the first quarter as a result of warmer than normal weather and the impact of capital spending during the 2015 calendar year on capital-related expenses.
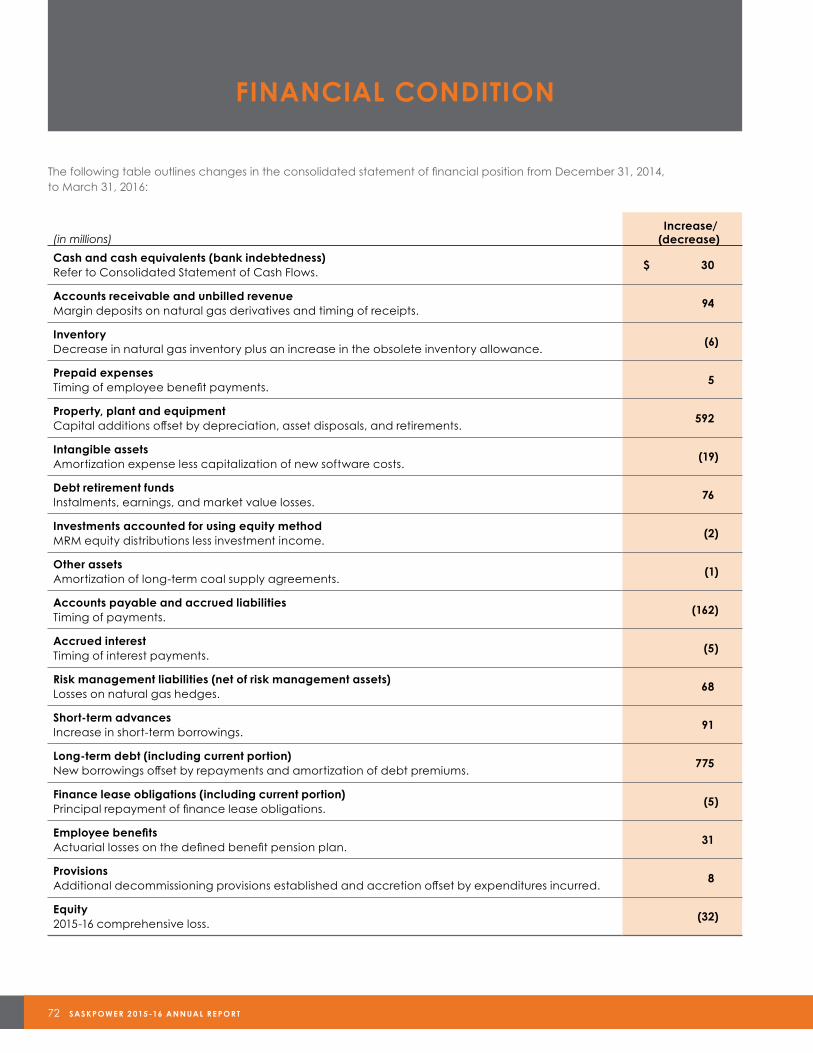
72 SASKPOWE R 2 015 -16 ANNUAL RE PORT
FINANCIAL CONDITION
The following table outlines changes in the consolidated statement of financial position from December 31, 2014, to March 31, 2016:
(in millions)Increase/
(decrease)
Cash and cash equivalents (bank indebtedness)Refer to Consolidated Statement of Cash Flows.
$ 30
Accounts receivable and unbilled revenueMargin deposits on natural gas derivatives and timing of receipts.
94
InventoryDecrease in natural gas inventory plus an increase in the obsolete inventory allowance.
(6)
Prepaid expensesTiming of employee benefit payments.
5
Property, plant and equipmentCapital additions offset by depreciation, asset disposals, and retirements.
592
Intangible assetsAmortization expense less capitalization of new software costs.
(19)
Debt retirement fundsInstalments, earnings, and market value losses.
76
Investments accounted for using equity methodMRM equity distributions less investment income.
(2)
Other assetsAmortization of long-term coal supply agreements.
(1)
Accounts payable and accrued liabilitiesTiming of payments.
(162)
Accrued interestTiming of interest payments.
(5)
Risk management liabilities (net of risk management assets)Losses on natural gas hedges.
68
Short-term advancesIncrease in short-term borrowings.
91
Long-term debt (including current portion)New borrowings offset by repayments and amortization of debt premiums.
775
Finance lease obligations (including current portion)Principal repayment of finance lease obligations.
(5)
Employee benefitsActuarial losses on the defined benefit pension plan.
31
ProvisionsAdditional decommissioning provisions established and accretion offset by expenditures incurred.
8
Equity 2015-16 comprehensive loss.
(32)
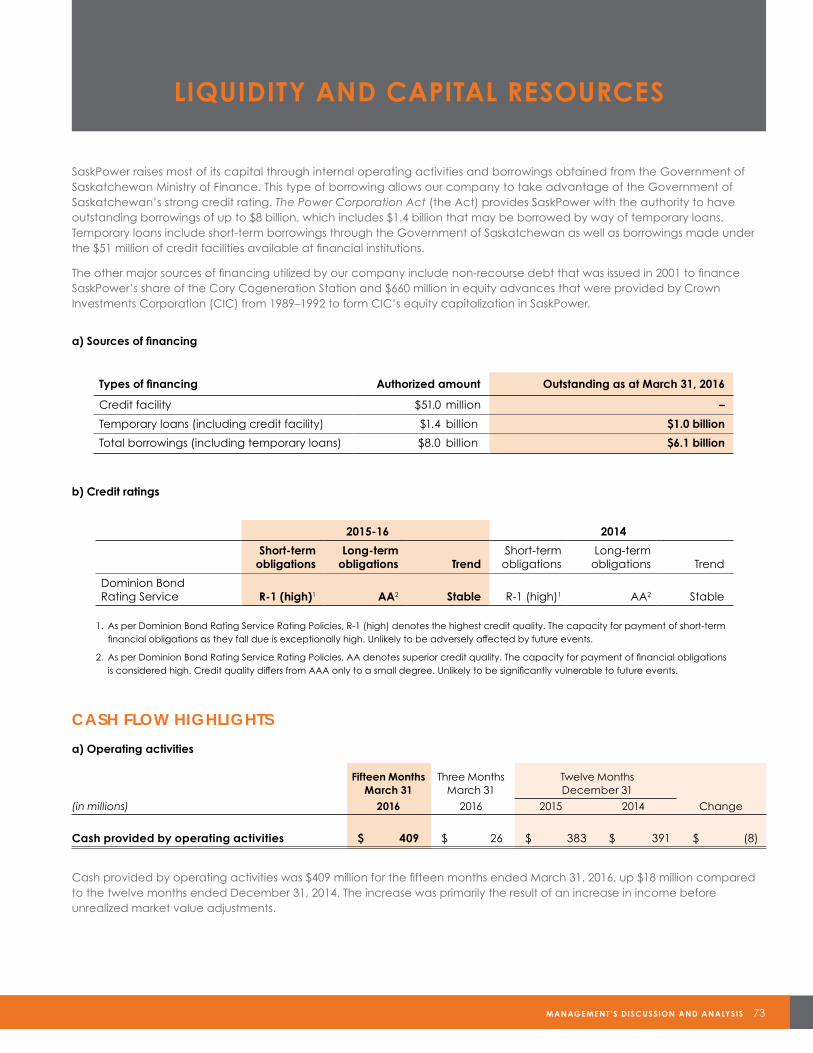
MANAGEMENT’S DISCUSSION AND ANALYSIS 73
LIQUIDITY AND CAPITAL RESOURCES
SaskPower raises most of its capital through internal operating activities and borrowings obtained from the Government of Saskatchewan Ministry of Finance. This type of borrowing allows our company to take advantage of the Government of Saskatchewan’s strong credit rating. The Power Corporation Act (the Act) provides SaskPower with the authority to have outstanding borrowings of up to $8 billion, which includes $1.4 billion that may be borrowed by way of temporary loans. Temporary loans include short-term borrowings through the Government of Saskatchewan as well as borrowings made under the $51 million of credit facilities available at financial institutions.
The other major sources of financing utilized by our company include non-recourse debt that was issued in 2001 to finance SaskPower’s share of the Cory Cogeneration Station and $660 million in equity advances that were provided by Crown Investments Corporation (CIC) from 1989–1992 to form CIC’s equity capitalization in SaskPower.
a) Sources of financing
Types of financing Authorized amount Outstanding as at March 31, 2016
Credit facility $51.0 million –
Temporary loans (including credit facility) $1.4 billion $1.0 billion
Total borrowings (including temporary loans) $8.0 billion $6.1 billion
b) Credit ratings
2015-16 2014
Short-termobligations
Long-termobligations Trend
Short-term obligations
Long-term obligations Trend
Dominion Bond Rating Service R-1 (high)1 AA2 Stable R-1 (high)1 AA2 Stable
1. As per Dominion Bond Rating Service Rating Policies, R-1 (high) denotes the highest credit quality. The capacity for payment of short-term financial obligations as they fall due is exceptionally high. Unlikely to be adversely affected by future events.
2. As per Dominion Bond Rating Service Rating Policies, AA denotes superior credit quality. The capacity for payment of financial obligations is considered high. Credit quality differs from AAA only to a small degree. Unlikely to be significantly vulnerable to future events.
CASH FLOW HIGHLIGHTS
a) Operating activities
Fifteen Months Three Months Twelve Months March 31 March 31 December 31
(in millions) 2016 2016 2015 2014 Change
Cash provided by operating activities $ 409 $ 26 $ 383 $ 391 $ (8)
Cash provided by operating activities was $409 million for the fifteen months ended March 31, 2016, up $18 million compared to the twelve months ended December 31, 2014. The increase was primarily the result of an increase in income before unrealized market value adjustments.
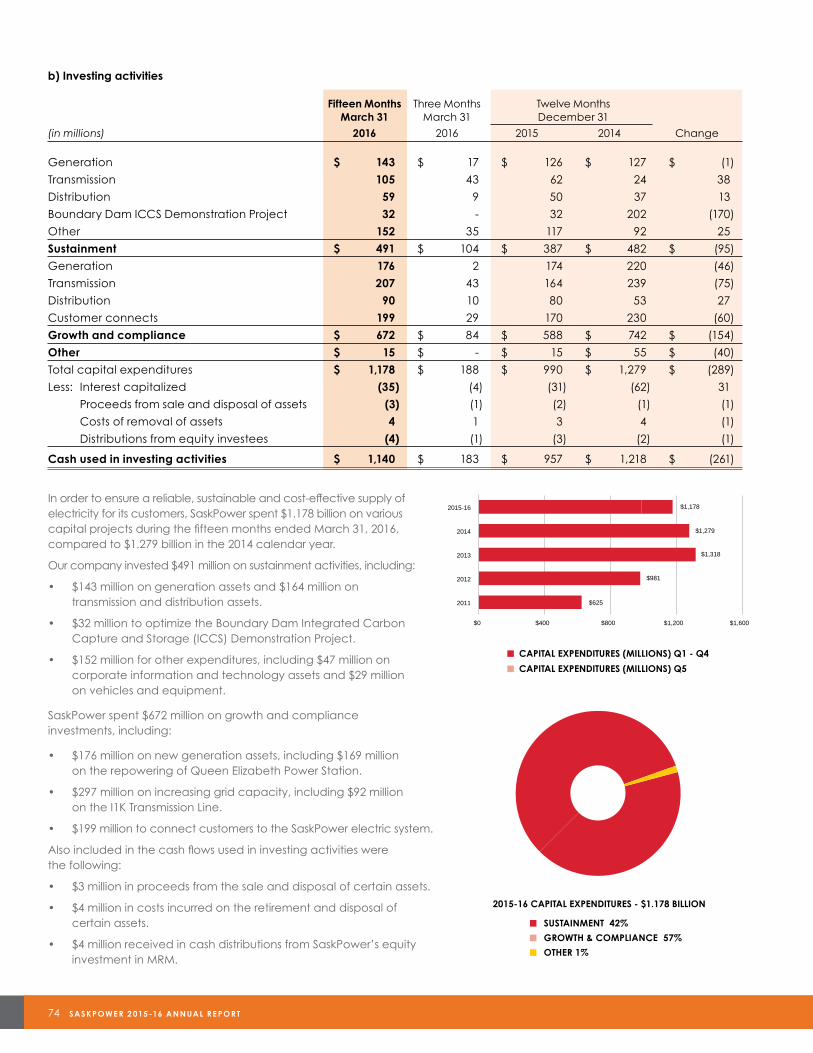
74 SASKPOWE R 2 015 -16 ANNUAL RE PORT
b) Investing activities
Fifteen Months Three Months Twelve Months March 31 March 31 December 31
(in millions) 2016 2016 2015 2014 Change
Generation $ 143 $ 17 $ 126 $ 127 $ (1)
Transmission 105 43 62 24 38
Distribution 59 9 50 37 13
Boundary Dam ICCS Demonstration Project 32 - 32 202 (170)
Other 152 35 117 92 25
Sustainment $ 491 $ 104 $ 387 $ 482 $ (95)
Generation 176 2 174 220 (46)
Transmission 207 43 164 239 (75)
Distribution 90 10 80 53 27
Customer connects 199 29 170 230 (60)
Growth and compliance $ 672 $ 84 $ 588 $ 742 $ (154)
Other $ 15 $ - $ 15 $ 55 $ (40)
Total capital expenditures $ 1,178 $ 188 $ 990 $ 1,279 $ (289)
Less: Interest capitalized (35) (4) (31) (62) 31
Proceeds from sale and disposal of assets (3) (1) (2) (1) (1)
Costs of removal of assets 4 1 3 4 (1)
Distributions from equity investees (4) (1) (3) (2) (1)
Cash used in investing activities $ 1,140 $ 183 $ 957 $ 1,218 $ (261)
In order to ensure a reliable, sustainable and cost-effective supply of electricity for its customers, SaskPower spent $1.178 billion on various capital projects during the fifteen months ended March 31, 2016, compared to $1.279 billion in the 2014 calendar year.
Our company invested $491 million on sustainment activities, including:
• $143 million on generation assets and $164 million ontransmission and distribution assets.
• $32 million to optimize the Boundary Dam Integrated CarbonCapture and Storage (ICCS) Demonstration Project.
• $152 million for other expenditures, including $47 million oncorporate information and technology assets and $29 millionon vehicles and equipment.
SaskPower spent $672 million on growth and compliance investments, including:
• $176 million on new generation assets, including $169 millionon the repowering of Queen Elizabeth Power Station.
• $297 million on increasing grid capacity, including $92 millionon the I1K Transmission Line.
• $199 million to connect customers to the SaskPower electric system.
Also included in the cash flows used in investing activities were the following:
• $3 million in proceeds from the sale and disposal of certain assets.
• $4 million in costs incurred on the retirement and disposal ofcertain assets.
• $4 million received in cash distributions from SaskPower’s equityinvestment in MRM.
Capital Expenditures2011 2012 2013 2014
Sustainment (Q1 - Q4) 409 644 794 482Growth and Compliance (Q1 - Q4) 189 310 441 742Other (Q1 - Q4) 27 27 83 55Capital Expenditures (millions) Q5 0 0 0 0Capital Expenditures (millions) Q1 - Q4 625 981 1318 1279
Reclassified vehicles & equipment and meter purchases $23 million from Other to T&D in 2012Reclassified meter purchases $3M from Other to T&D in 2011 and $15M in 2010
$0 $400 $800 $1,200
$1,178
$1,279
$1,318
$981
$625
$1,600
2011
2012
2013
2014
2015-16
CAPITAL EXPENDITURES (MILLIONS) Q1 - Q4
CAPITAL EXPENDITURES (MILLIONS) Q5 ■ CAPITAL EXPENDITURES (MILLIONS) Q1 - Q4
■ CAPITAL EXPENDITURES (MILLIONS) Q5
42%
57%
1%
2015-16 CAPITAL EXPENDITURES - $1.178 BILLION
SUSTAINMENT
GROWTH & COMPLIANCE
OTHER
2015-16 CAPITAL EXPENDITURES - $1.178 BILLION
■ SUSTAINMENT 42%
■ GROWTH & COMPLIANCE 57%
■ OTHER 1%
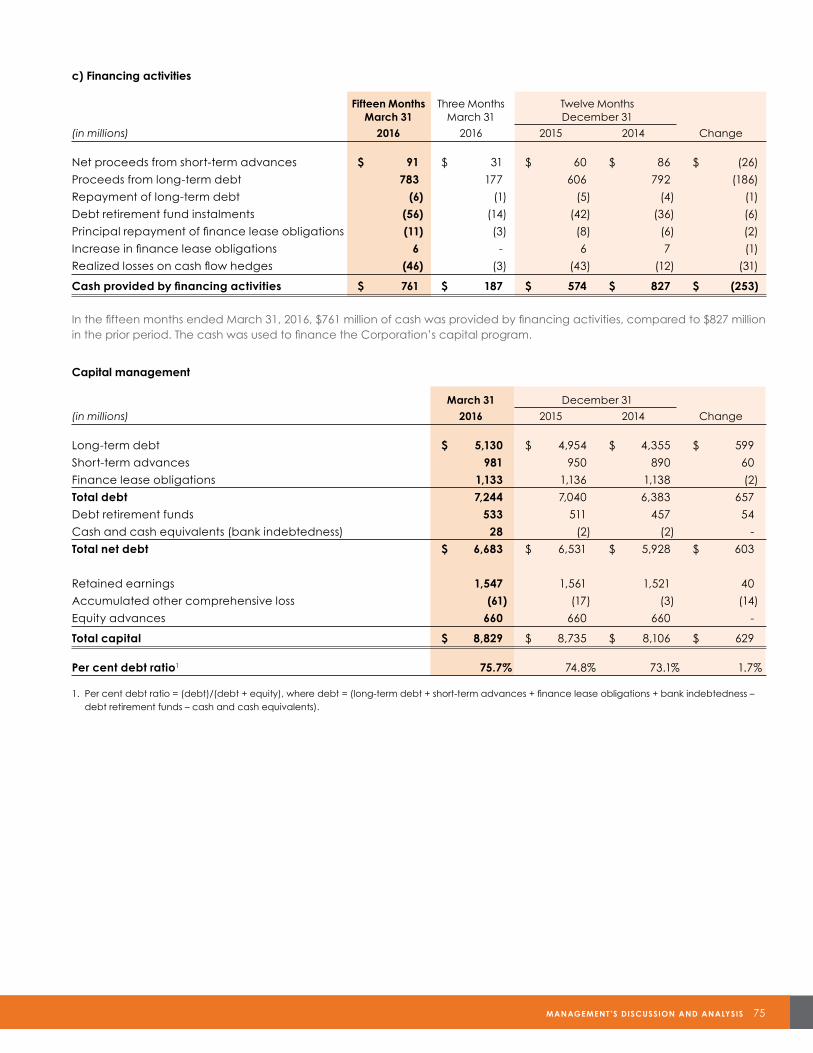
MANAGEMENT’S DISCUSSION AND ANALYSIS 75
c) Financing activities
Fifteen Months Three Months Twelve Months March 31 March 31 December 31
(in millions) 2016 2016 2015 2014 Change
Net proceeds from short-term advances $ 91 $ 31 $ 60 $ 86 $ (26)
Proceeds from long-term debt 783 177 606 792 (186)
Repayment of long-term debt (6) (1) (5) (4) (1)
Debt retirement fund instalments (56) (14) (42) (36) (6)
Principal repayment of finance lease obligations (11) (3) (8) (6) (2)
Increase in finance lease obligations 6 - 6 7 (1)
Realized losses on cash flow hedges (46) (3) (43) (12) (31)
Cash provided by financing activities $ 761 $ 187 $ 574 $ 827 $ (253)
In the fifteen months ended March 31, 2016, $761 million of cash was provided by financing activities, compared to $827 million in the prior period. The cash was used to finance the Corporation’s capital program.
Capital management
March 31 December 31
(in millions) 2016 2015 2014 Change
Long-term debt $ 5,130 $ 4,954 $ 4,355 $ 599
Short-term advances 981 950 890 60
Finance lease obligations 1,133 1,136 1,138 (2)
Total debt 7,244 7,040 6,383 657
Debt retirement funds 533 511 457 54
Cash and cash equivalents (bank indebtedness) 28 (2) (2) -
Total net debt $ 6,683 $ 6,531 $ 5,928 $ 603
Retained earnings 1,547 1,561 1,521 40
Accumulated other comprehensive loss (61) (17) (3) (14)
Equity advances 660 660 660 -
Total capital $ 8,829 $ 8,735 $ 8,106 $ 629
Per cent debt ratio1 75.7% 74.8% 73.1% 1.7%
1. Per cent debt ratio = (debt)/(debt + equity), where debt = (long-term debt + short-term advances + finance lease obligations + bank indebtedness – debt retirement funds – cash and cash equivalents).
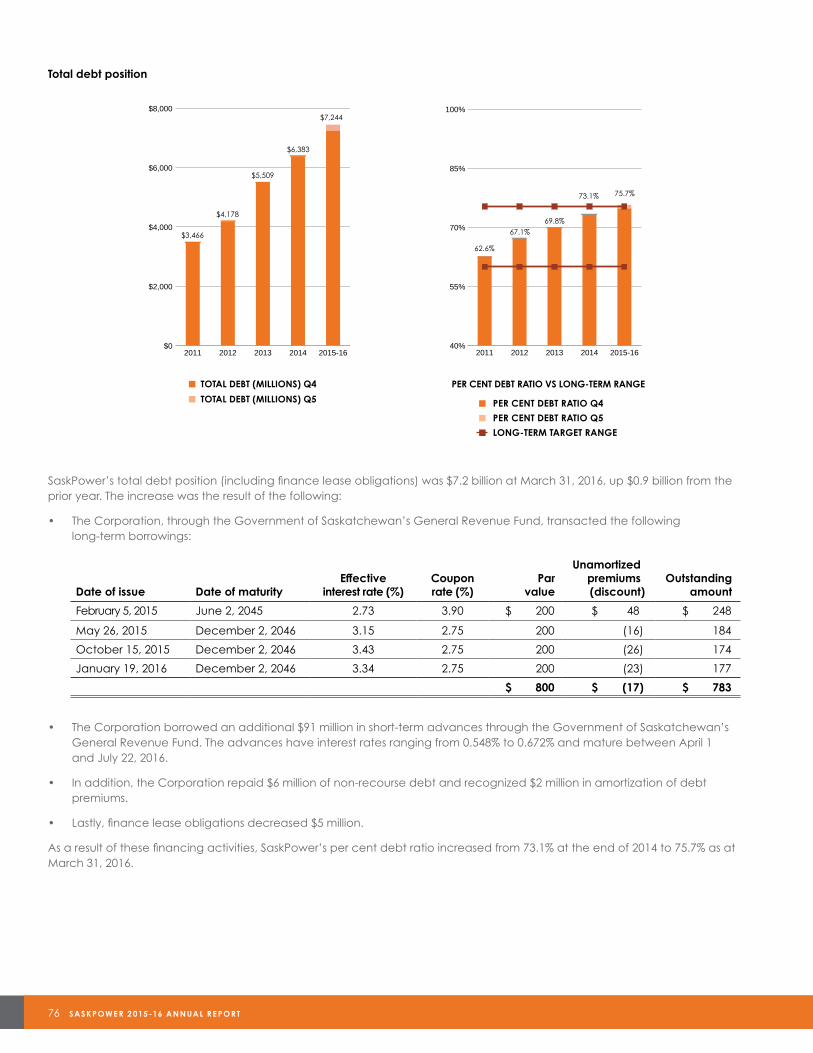
76 SASKPOWE R 2 015 -16 ANNUAL RE PORT
Total debt position
SaskPower’s total debt position (including finance lease obligations) was $7.2 billion at March 31, 2016, up $0.9 billion from the prior year. The increase was the result of the following:
• The Corporation, through the Government of Saskatchewan’s General Revenue Fund, transacted the followinglong-term borrowings:
• The Corporation borrowed an additional $91 million in short-term advances through the Government of Saskatchewan’sGeneral Revenue Fund. The advances have interest rates ranging from 0.548% to 0.672% and mature between April 1and July 22, 2016.
• In addition, the Corporation repaid $6 million of non-recourse debt and recognized $2 million in amortization of debtpremiums.
• Lastly, finance lease obligations decreased $5 million.
As a result of these financing activities, SaskPower’s per cent debt ratio increased from 73.1% at the end of 2014 to 75.7% as at March 31, 2016.
Date of issue Date of maturityEffective
interest rate (%)Coupon rate (%)
Parvalue
Unamortized premiums (discount)
Outstanding amount
February 5, 2015 June 2, 2045 2.73 3.90 $ 200 $ 48 $ 248
May 26, 2015 December 2, 2046 3.15 2.75 200 (16) 184
October 15, 2015 December 2, 2046 3.43 2.75 200 (26) 174
January 19, 2016 December 2, 2046 3.34 2.75 200 (23) 177
$ 800 $ (17) $ 783
$0
$2,000
$4,000
$6,000
$8,000
CAPITAL EXPENDITURES (Q5)
Total Debt Q1-Q4
2015-162014201320122011
TOTAL DEBT (MILLIONS) Q1 - Q4
TOTAL DEBT (MILLIONS) Q5
$3,466
$7,244
$6,383
$5,509
$4,178
40%
55%
70%
85%
100%
PER CENT DEBT RATIO (Q5)
PER CENT DEBT RATIO (Q1-Q4)
LONG-TERM TARGET RANGE
2015-162014201320122011
PER CENT DEBT RATIOVS LONG-TERM RANGE
PER CENT DEBT RATIO Q1 - Q4
PER CENT DEBT RATIO Q5
LONG-TERM TARGET RANGE
62.6%
67.1%
69.8%
73.1% 75.7%
■ TOTAL DEBT (MILLIONS) Q4
■ TOTAL DEBT (MILLIONS) Q5
PER CENT DEBT RATIO VS LONG-TERM RANGE
■PER CENT DEBT RATIO Q4
■PER CENT DEBT RATIO Q5
■LONG-TERM TARGET RANGE
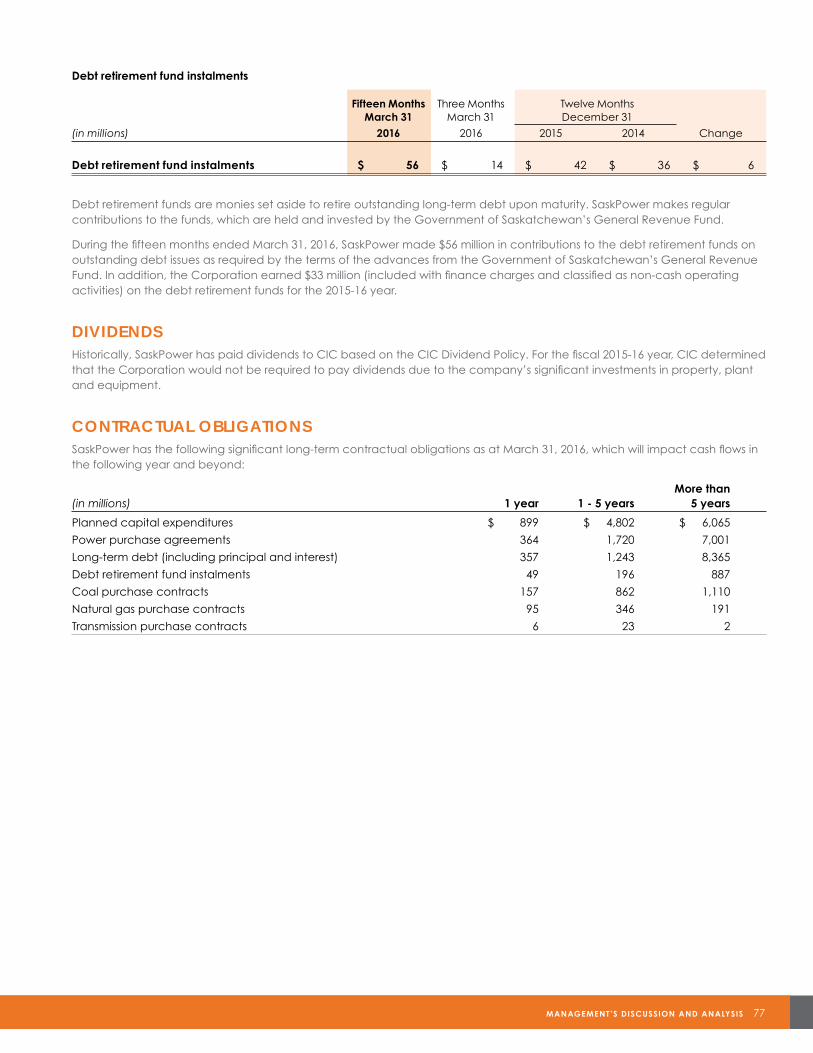
MANAGEMENT’S DISCUSSION AND ANALYSIS 77
Debt retirement fund instalments
Fifteen Months Three Months Twelve Months March 31 March 31 December 31
(in millions) 2016 2016 2015 2014 Change
Debt retirement fund instalments $ 56 $ 14 $ 42 $ 36 $ 6
Debt retirement funds are monies set aside to retire outstanding long-term debt upon maturity. SaskPower makes regular contributions to the funds, which are held and invested by the Government of Saskatchewan’s General Revenue Fund.
During the fifteen months ended March 31, 2016, SaskPower made $56 million in contributions to the debt retirement funds on outstanding debt issues as required by the terms of the advances from the Government of Saskatchewan’s General Revenue Fund. In addition, the Corporation earned $33 million (included with finance charges and classified as non-cash operating activities) on the debt retirement funds for the 2015-16 year.
DIVIDENDSHistorically, SaskPower has paid dividends to CIC based on the CIC Dividend Policy. For the fiscal 2015-16 year, CIC determined that the Corporation would not be required to pay dividends due to the company’s significant investments in property, plant and equipment.
CONTRACTUAL OBLIGATIONSSaskPower has the following significant long-term contractual obligations as at March 31, 2016, which will impact cash flows in the following year and beyond:
More than (in millions) 1 year 1 - 5 years 5 years
Planned capital expenditures $ 899 $ 4,802 $ 6,065
Power purchase agreements 364 1,720 7,001
Long-term debt (including principal and interest) 357 1,243 8,365
Debt retirement fund instalments 49 196 887
Coal purchase contracts 157 862 1,110
Natural gas purchase contracts 95 346 191
Transmission purchase contracts 6 23 2
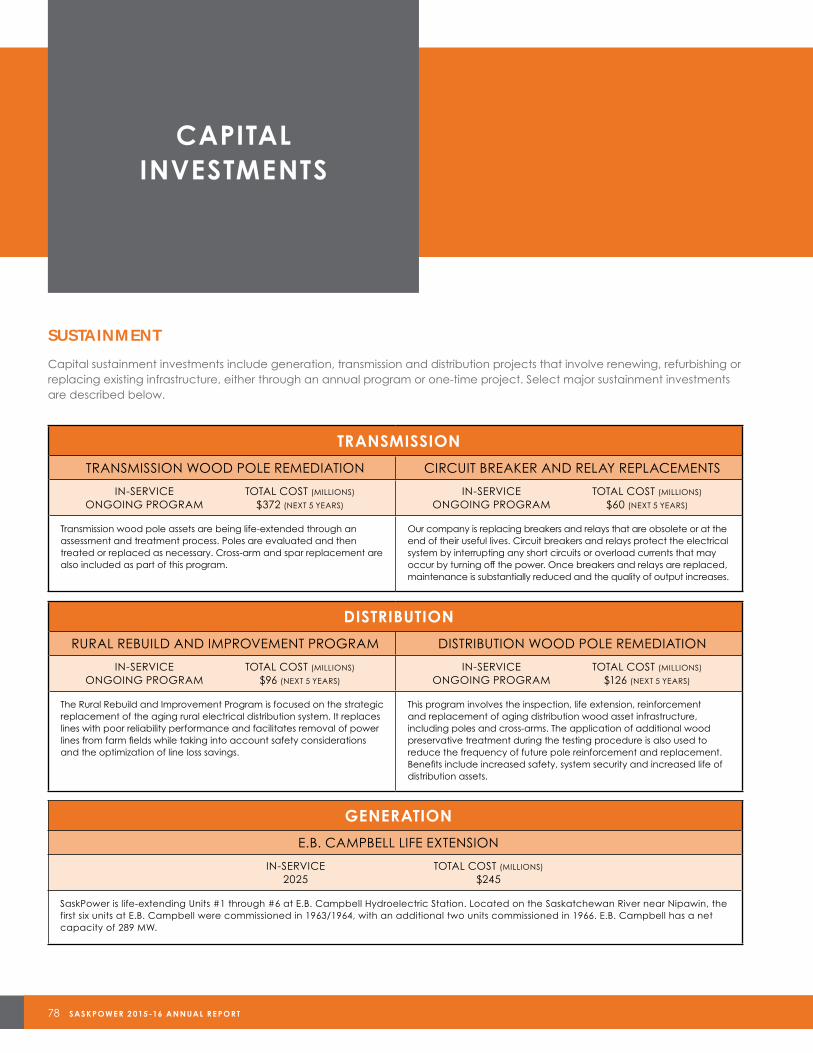
78 SASKPOWE R 2 015 -16 ANNUAL RE PORT
CAPITAL INVESTMENTS
SUSTAINMENT
Capital sustainment investments include generation, transmission and distribution projects that involve renewing, refurbishing or replacing existing infrastructure, either through an annual program or one-time project. Select major sustainment investments are described below.
TRANSMISSION
TRANSMISSION WOOD POLE REMEDIATION CIRCUIT BREAKER AND RELAY REPLACEMENTS
IN-SERVICE TOTAL COST (MILLIONS) ONGOING PROGRAM $372 (NEXT 5 YEARS)
IN-SERVICE TOTAL COST (MILLIONS) ONGOING PROGRAM $60 (NEXT 5 YEARS)
Transmission wood pole assets are being life-extended through an assessment and treatment process. Poles are evaluated and then treated or replaced as necessary. Cross-arm and spar replacement are also included as part of this program.
Our company is replacing breakers and relays that are obsolete or at the end of their useful lives. Circuit breakers and relays protect the electrical system by interrupting any short circuits or overload currents that may occur by turning off the power. Once breakers and relays are replaced, maintenance is substantially reduced and the quality of output increases.
DISTRIBUTION
RURAL REBUILD AND IMPROVEMENT PROGRAM DISTRIBUTION WOOD POLE REMEDIATION
IN-SERVICE TOTAL COST (MILLIONS) ONGOING PROGRAM $96 (NEXT 5 YEARS)
IN-SERVICE TOTAL COST (MILLIONS) ONGOING PROGRAM $126 (NEXT 5 YEARS)
The Rural Rebuild and Improvement Program is focused on the strategic replacement of the aging rural electrical distribution system. It replaces lines with poor reliability performance and facilitates removal of power lines from farm fields while taking into account safety considerations and the optimization of line loss savings.
This program involves the inspection, life extension, reinforcement and replacement of aging distribution wood asset infrastructure, including poles and cross-arms. The application of additional wood preservative treatment during the testing procedure is also used to reduce the frequency of future pole reinforcement and replacement. Benefits include increased safety, system security and increased life of distribution assets.
GENERATION
E.B. CAMPBELL LIFE EXTENSION
IN-SERVICE TOTAL COST (MILLIONS) 2025 $245
SaskPower is life-extending Units #1 through #6 at E.B. Campbell Hydroelectric Station. Located on the Saskatchewan River near Nipawin, the first six units at E.B. Campbell were commissioned in 1963/1964, with an additional two units commissioned in 1966. E.B. Campbell has a net capacity of 289 MW.
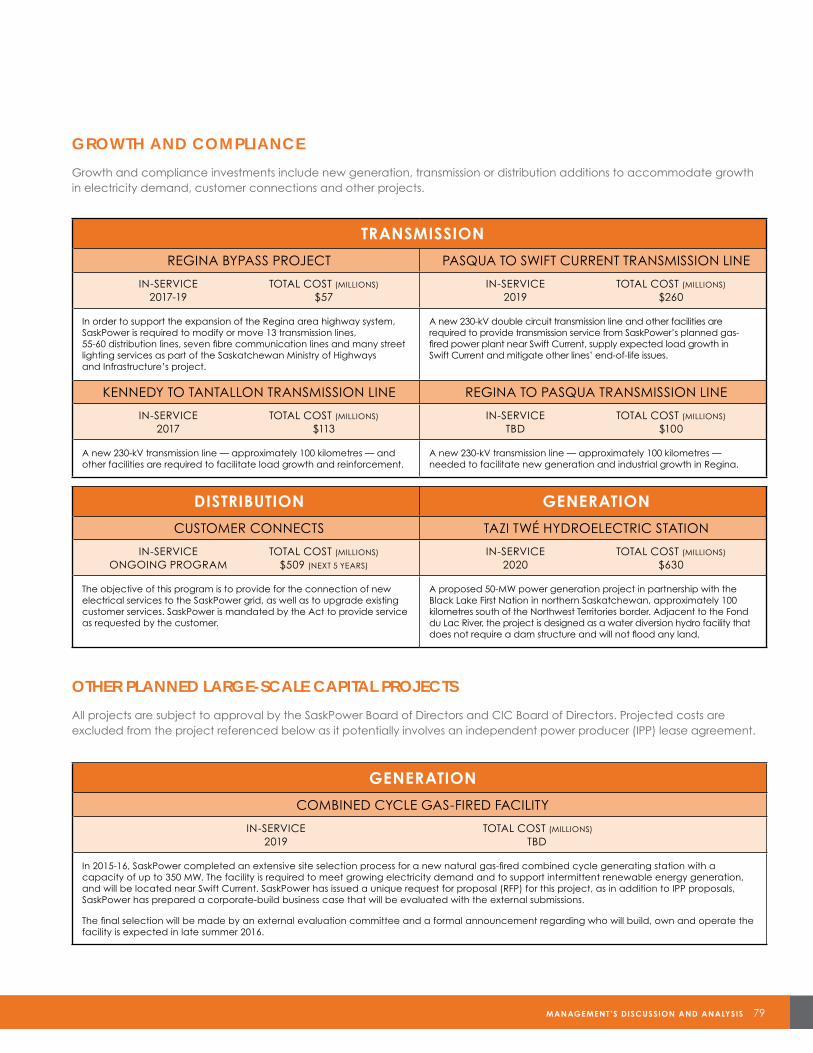
MANAGEMENT’S DISCUSSION AND ANALYSIS 79
GROWTH AND COMPLIANCE
Growth and compliance investments include new generation, transmission or distribution additions to accommodate growth in electricity demand, customer connections and other projects.
OTHER PLANNED LARGE-SCALE CAPITAL PROJECTS
All projects are subject to approval by the SaskPower Board of Directors and CIC Board of Directors. Projected costs are excluded from the project referenced below as it potentially involves an independent power producer (IPP) lease agreement.
TRANSMISSION
REGINA BYPASS PROJECT PASQUA TO SWIFT CURRENT TRANSMISSION LINE
IN-SERVICE TOTAL COST (MILLIONS) 2017-19 $57
IN-SERVICE TOTAL COST (MILLIONS) 2019 $260
In order to support the expansion of the Regina area highway system, SaskPower is required to modify or move 13 transmission lines, 55-60 distribution lines, seven fibre communication lines and many street lighting services as part of the Saskatchewan Ministry of Highways and Infrastructure’s project.
A new 230-kV double circuit transmission line and other facilities are required to provide transmission service from SaskPower’s planned gas-fired power plant near Swift Current, supply expected load growth in Swift Current and mitigate other lines’ end-of-life issues.
KENNEDY TO TANTALLON TRANSMISSION LINE REGINA TO PASQUA TRANSMISSION LINE
IN-SERVICE TOTAL COST (MILLIONS) 2017 $113
IN-SERVICE TOTAL COST (MILLIONS) TBD $100
A new 230-kV transmission line — approximately 100 kilometres — and other facilities are required to facilitate load growth and reinforcement.
A new 230-kV transmission line — approximately 100 kilometres — needed to facilitate new generation and industrial growth in Regina.
DISTRIBUTION GENERATION
CUSTOMER CONNECTS TAZI TWÉ HYDROELECTRIC STATION
IN-SERVICE TOTAL COST (MILLIONS) ONGOING PROGRAM $509 (NEXT 5 YEARS)
IN-SERVICE TOTAL COST (MILLIONS) 2020 $630
The objective of this program is to provide for the connection of new electrical services to the SaskPower grid, as well as to upgrade existing customer services. SaskPower is mandated by the Act to provide service as requested by the customer.
A proposed 50-MW power generation project in partnership with the Black Lake First Nation in northern Saskatchewan, approximately 100 kilometres south of the Northwest Territories border. Adjacent to the Fond du Lac River, the project is designed as a water diversion hydro facility that does not require a dam structure and will not flood any land.
GENERATION
COMBINED CYCLE GAS-FIRED FACILITY
IN-SERVICE TOTAL COST (MILLIONS) 2019 TBD
In 2015-16, SaskPower completed an extensive site selection process for a new natural gas-fired combined cycle generating station with a capacity of up to 350 MW. The facility is required to meet growing electricity demand and to support intermittent renewable energy generation, and will be located near Swift Current. SaskPower has issued a unique request for proposal (RFP) for this project, as in addition to IPP proposals, SaskPower has prepared a corporate-build business case that will be evaluated with the external submissions.
The final selection will be made by an external evaluation committee and a formal announcement regarding who will build, own and operate the facility is expected in late summer 2016.
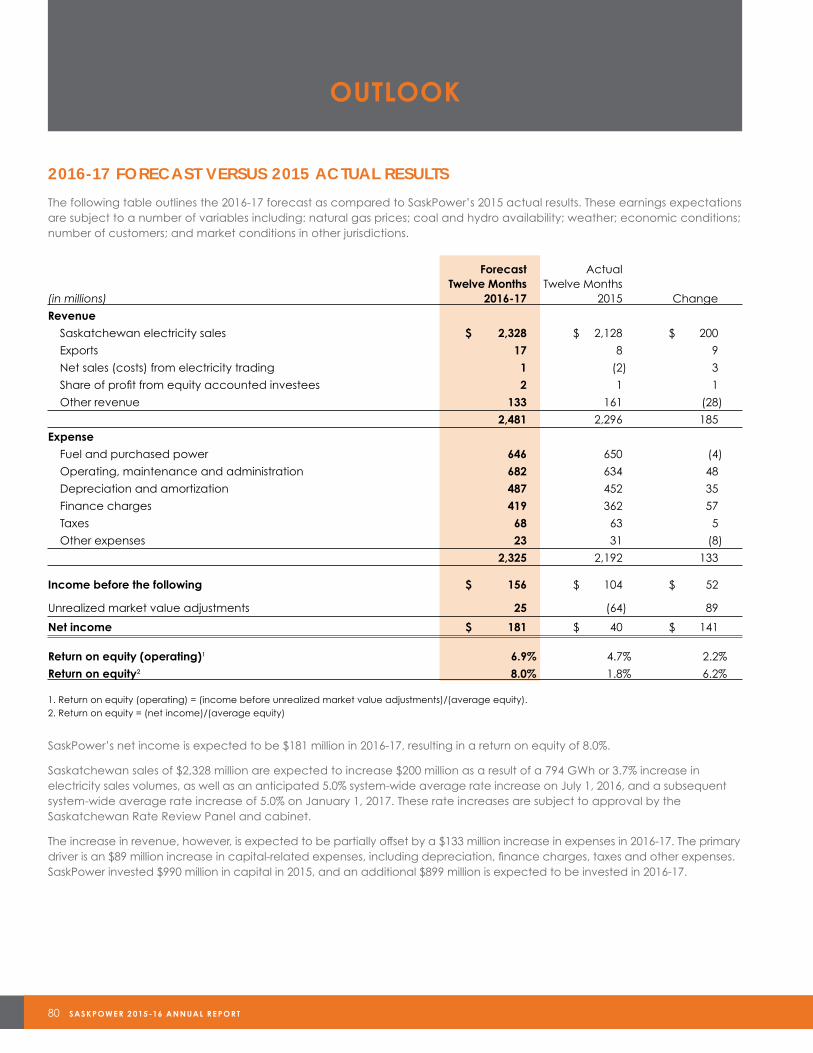
80 SASKPOWE R 2 015 -16 ANNUAL RE PORT
OUTLOOK
2016-17 FORECAST VERSUS 2015 ACTUAL RESULTS
The following table outlines the 2016-17 forecast as compared to SaskPower’s 2015 actual results. These earnings expectations are subject to a number of variables including: natural gas prices; coal and hydro availability; weather; economic conditions; number of customers; and market conditions in other jurisdictions.
Forecast ActualTwelve Months Twelve Months
(in millions) 2016-17 2015 Change
Revenue
Saskatchewan electricity sales $ 2,328 $ 2,128 $ 200
Exports 17 8 9
Net sales (costs) from electricity trading 1 (2) 3
Share of profit from equity accounted investees 2 1 1
Other revenue 133 161 (28)
2,481 2,296 185
Expense
Fuel and purchased power 646 650 (4)
Operating, maintenance and administration 682 634 48
Depreciation and amortization 487 452 35
Finance charges 419 362 57
Taxes 68 63 5
Other expenses 23 31 (8)
2,325 2,192 133
Income before the following $ 156 $ 104 $ 52
Unrealized market value adjustments 25 (64) 89
Net income $ 181 $ 40 $ 141
Return on equity (operating)1 6.9% 4.7% 2.2%
Return on equity2 8.0% 1.8% 6.2%
1. Return on equity (operating) = (income before unrealized market value adjustments)/(average equity).2. Return on equity = (net income)/(average equity)
SaskPower’s net income is expected to be $181 million in 2016-17, resulting in a return on equity of 8.0%.
Saskatchewan sales of $2,328 million are expected to increase $200 million as a result of a 794 GWh or 3.7% increase in electricity sales volumes, as well as an anticipated 5.0% system-wide average rate increase on July 1, 2016, and a subsequent system-wide average rate increase of 5.0% on January 1, 2017. These rate increases are subject to approval by the Saskatchewan Rate Review Panel and cabinet.
The increase in revenue, however, is expected to be partially offset by a $133 million increase in expenses in 2016-17. The primary driver is an $89 million increase in capital-related expenses, including depreciation, finance charges, taxes and other expenses. SaskPower invested $990 million in capital in 2015, and an additional $899 million is expected to be invested in 2016-17.
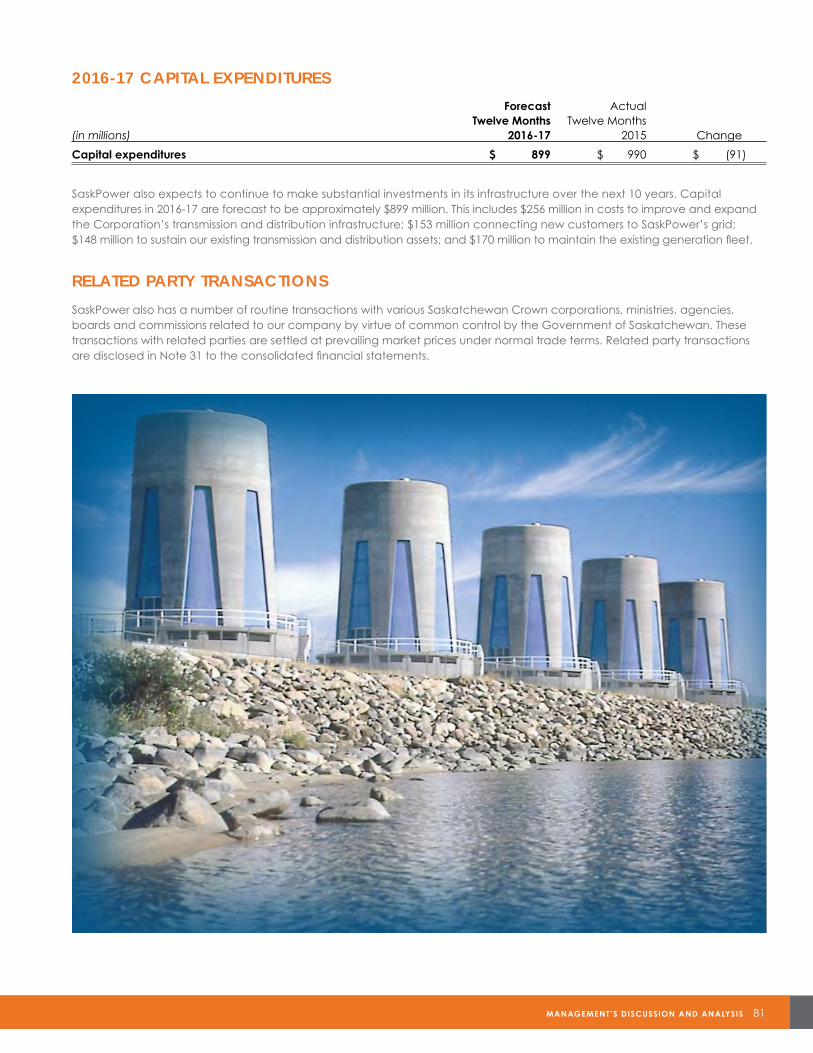
MANAGEMENT’S DISCUSSION AND ANALYSIS 81
2016-17 CAPITAL EXPENDITURES
Forecast ActualTwelve Months Twelve Months
(in millions) 2016-17 2015 Change
Capital expenditures $ 899 $ 990 $ (91)
SaskPower also expects to continue to make substantial investments in its infrastructure over the next 10 years. Capital expenditures in 2016-17 are forecast to be approximately $899 million. This includes $256 million in costs to improve and expand the Corporation’s transmission and distribution infrastructure; $153 million connecting new customers to SaskPower’s grid; $148 million to sustain our existing transmission and distribution assets; and $170 million to maintain the existing generation fleet.
RELATED PARTY TRANSACTIONS
SaskPower also has a number of routine transactions with various Saskatchewan Crown corporations, ministries, agencies, boards and commissions related to our company by virtue of common control by the Government of Saskatchewan. These transactions with related parties are settled at prevailing market prices under normal trade terms. Related party transactions are disclosed in Note 31 to the consolidated financial statements.
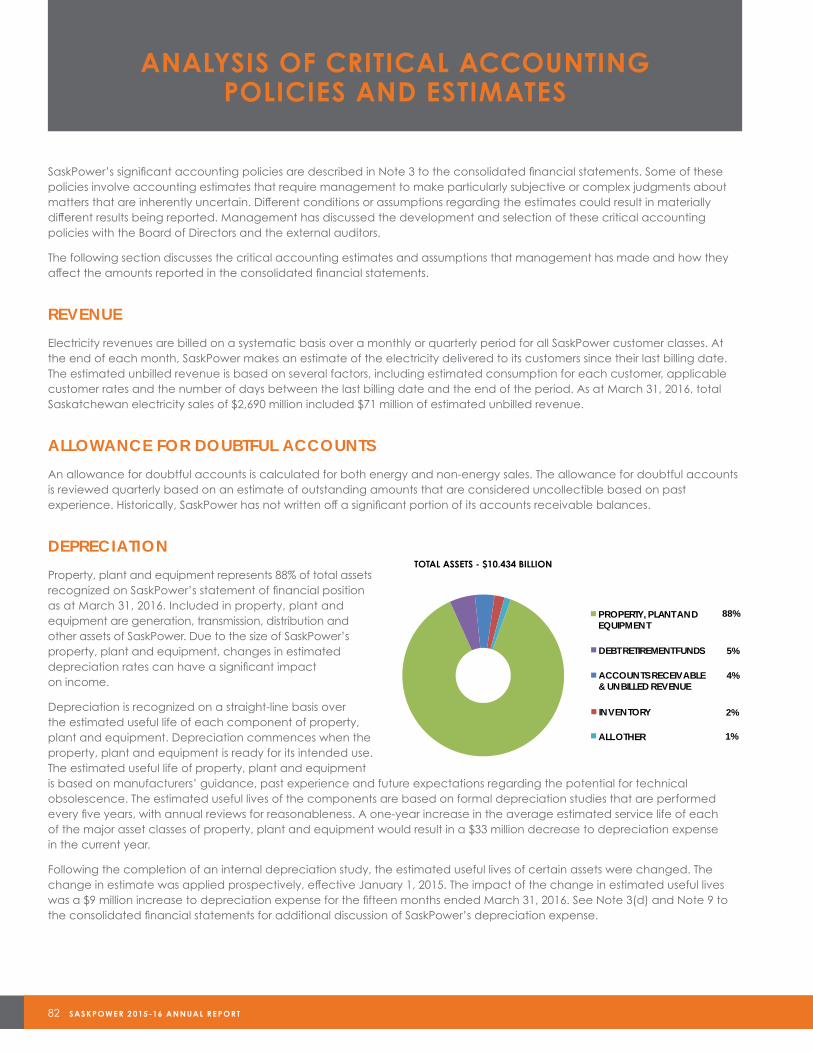
82 SASKPOWE R 2 015 -16 ANNUAL RE PORT
ANALYSIS OF CRITICAL ACCOUNTING POLICIES AND ESTIMATES
SaskPower’s significant accounting policies are described in Note 3 to the consolidated financial statements. Some of these policies involve accounting estimates that require management to make particularly subjective or complex judgments about matters that are inherently uncertain. Different conditions or assumptions regarding the estimates could result in materially different results being reported. Management has discussed the development and selection of these critical accounting policies with the Board of Directors and the external auditors.
The following section discusses the critical accounting estimates and assumptions that management has made and how they affect the amounts reported in the consolidated financial statements.
REVENUE
Electricity revenues are billed on a systematic basis over a monthly or quarterly period for all SaskPower customer classes. At the end of each month, SaskPower makes an estimate of the electricity delivered to its customers since their last billing date. The estimated unbilled revenue is based on several factors, including estimated consumption for each customer, applicable customer rates and the number of days between the last billing date and the end of the period. As at March 31, 2016, total Saskatchewan electricity sales of $2,690 million included $71 million of estimated unbilled revenue.
ALLOWANCE FOR DOUBTFUL ACCOUNTS
An allowance for doubtful accounts is calculated for both energy and non-energy sales. The allowance for doubtful accounts is reviewed quarterly based on an estimate of outstanding amounts that are considered uncollectible based on past experience. Historically, SaskPower has not written off a significant portion of its accounts receivable balances.
DEPRECIATION
Property, plant and equipment represents 88% of total assets recognized on SaskPower’s statement of financial position as at March 31, 2016. Included in property, plant and equipment are generation, transmission, distribution and other assets of SaskPower. Due to the size of SaskPower’s property, plant and equipment, changes in estimated depreciation rates can have a significant impact on income.
Depreciation is recognized on a straight-line basis over the estimated useful life of each component of property, plant and equipment. Depreciation commences when the property, plant and equipment is ready for its intended use. The estimated useful life of property, plant and equipment is based on manufacturers’ guidance, past experience and future expectations regarding the potential for technical obsolescence. The estimated useful lives of the components are based on formal depreciation studies that are performed every five years, with annual reviews for reasonableness. A one-year increase in the average estimated service life of each of the major asset classes of property, plant and equipment would result in a $33 million decrease to depreciation expense in the current year.
Following the completion of an internal depreciation study, the estimated useful lives of certain assets were changed. The change in estimate was applied prospectively, effective January 1, 2015. The impact of the change in estimated useful lives was a $9 million increase to depreciation expense for the fifteen months ended March 31, 2016. See Note 3(d) and Note 9 to the consolidated financial statements for additional discussion of SaskPower’s depreciation expense.
4%
2%
88%
5%
1%
TOTAL ASSETS - $10.434 BILLION
ACCOUNTS RECEIVABLE & UNBILLED REVENUE
INVENTORY
PROPERTY, PLANT ANDEQUIPMENT
DEBT RETIREMENT FUNDS
ALL OTHER
4%
2%
88%
5%
1%
TOTAL ASSETS - $10.434 BILLION
ACCOUNTS RECEIVABLE & UNBILLED REVENUE
INVENTORY
PROPERTY, PLANT ANDEQUIPMENT
DEBT RETIREMENT FUNDS
ALL OTHER
4%
2%
88%
5%
1%
TOTAL ASSETS - $10.434 BILLION
ACCOUNTS RECEIVABLE & UNBILLED REVENUE
INVENTORY
PROPERTY, PLANT AND EQUIPMENT
DEBT RETIREMENT FUNDS
ALL OTHER
4%
2%
88%
5%
1%
TOTAL ASSETS - $10.434 BILLION
ACCOUNTS RECEIVABLE & UNBILLED REVENUE
INVENTORY
PROPERTY, PLANT ANDEQUIPMENT
DEBT RETIREMENT FUNDS
ALL OTHER
4%
2%
88%
5%
1%
TOTAL ASSETS - $10.434 BILLION
ACCOUNTS RECEIVABLE & UNBILLED REVENUE
INVENTORY
PROPERTY, PLANT ANDEQUIPMENT
DEBT RETIREMENT FUNDS
ALL OTHER
TOTAL ASSETS - $10.434 BILLION
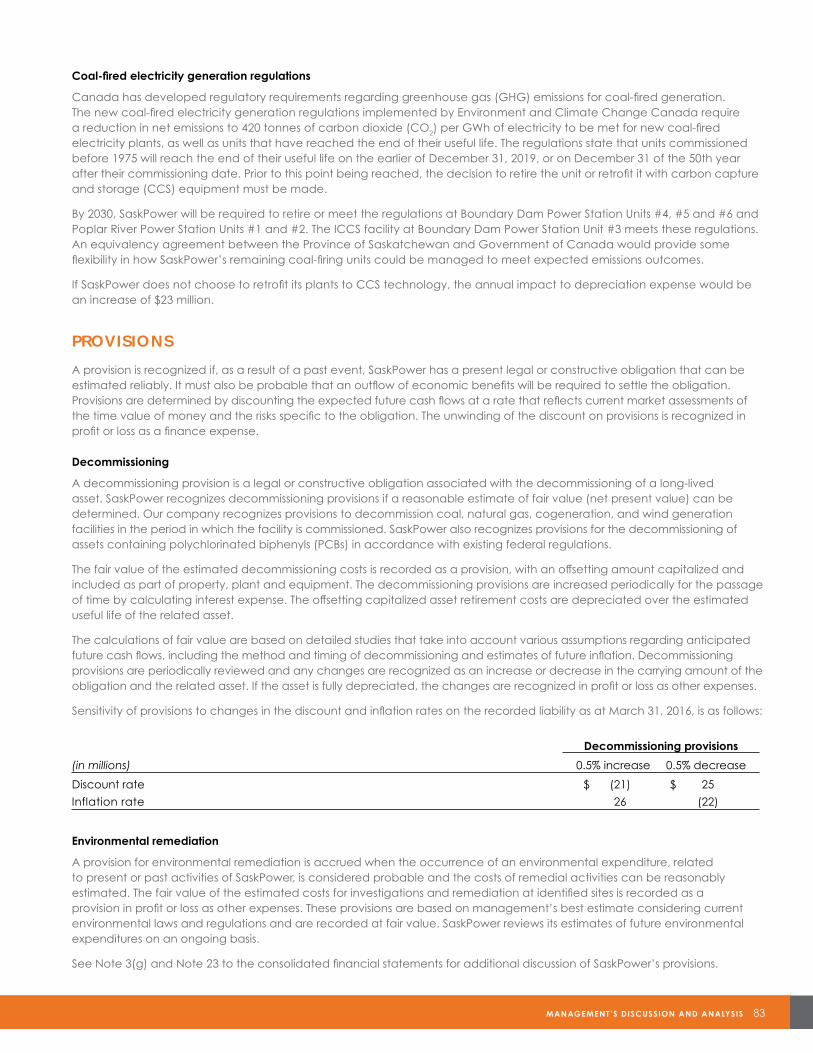
MANAGEMENT’S DISCUSSION AND ANALYSIS 83
Coal-fired electricity generation regulations
Canada has developed regulatory requirements regarding greenhouse gas (GHG) emissions for coal-fired generation. The new coal-fired electricity generation regulations implemented by Environment and Climate Change Canada require a reduction in net emissions to 420 tonnes of carbon dioxide (CO2) per GWh of electricity to be met for new coal-fired electricity plants, as well as units that have reached the end of their useful life. The regulations state that units commissioned before 1975 will reach the end of their useful life on the earlier of December 31, 2019, or on December 31 of the 50th year after their commissioning date. Prior to this point being reached, the decision to retire the unit or retrofit it with carbon capture and storage (CCS) equipment must be made.
By 2030, SaskPower will be required to retire or meet the regulations at Boundary Dam Power Station Units #4, #5 and #6 and Poplar River Power Station Units #1 and #2. The ICCS facility at Boundary Dam Power Station Unit #3 meets these regulations. An equivalency agreement between the Province of Saskatchewan and Government of Canada would provide some flexibility in how SaskPower’s remaining coal-firing units could be managed to meet expected emissions outcomes.
If SaskPower does not choose to retrofit its plants to CCS technology, the annual impact to depreciation expense would be an increase of $23 million.
PROVISIONS
A provision is recognized if, as a result of a past event, SaskPower has a present legal or constructive obligation that can be estimated reliably. It must also be probable that an outflow of economic benefits will be required to settle the obligation. Provisions are determined by discounting the expected future cash flows at a rate that reflects current market assessments of the time value of money and the risks specific to the obligation. The unwinding of the discount on provisions is recognized in profit or loss as a finance expense.
Decommissioning
A decommissioning provision is a legal or constructive obligation associated with the decommissioning of a long-lived asset. SaskPower recognizes decommissioning provisions if a reasonable estimate of fair value (net present value) can be determined. Our company recognizes provisions to decommission coal, natural gas, cogeneration, and wind generation facilities in the period in which the facility is commissioned. SaskPower also recognizes provisions for the decommissioning of assets containing polychlorinated biphenyls (PCBs) in accordance with existing federal regulations.
The fair value of the estimated decommissioning costs is recorded as a provision, with an offsetting amount capitalized and included as part of property, plant and equipment. The decommissioning provisions are increased periodically for the passage of time by calculating interest expense. The offsetting capitalized asset retirement costs are depreciated over the estimated useful life of the related asset.
The calculations of fair value are based on detailed studies that take into account various assumptions regarding anticipated future cash flows, including the method and timing of decommissioning and estimates of future inflation. Decommissioning provisions are periodically reviewed and any changes are recognized as an increase or decrease in the carrying amount of the obligation and the related asset. If the asset is fully depreciated, the changes are recognized in profit or loss as other expenses.
Sensitivity of provisions to changes in the discount and inflation rates on the recorded liability as at March 31, 2016, is as follows:
Decommissioning provisions
(in millions) 0.5% increase 0.5% decrease
Discount rate $ (21) $ 25
Inflation rate 26 (22)
Environmental remediation
A provision for environmental remediation is accrued when the occurrence of an environmental expenditure, related to present or past activities of SaskPower, is considered probable and the costs of remedial activities can be reasonably estimated. The fair value of the estimated costs for investigations and remediation at identified sites is recorded as a provision in profit or loss as other expenses. These provisions are based on management’s best estimate considering current environmental laws and regulations and are recorded at fair value. SaskPower reviews its estimates of future environmental expenditures on an ongoing basis.
See Note 3(g) and Note 23 to the consolidated financial statements for additional discussion of SaskPower’s provisions.

84 SASKPOWE R 2 015 -16 ANNUAL RE PORT
EMPLOYEE BENEFITS
As explained in Note 3(m) and Note 32 in the consolidated financial statements, SaskPower provides post-retirement benefits to employees, including those from a defined benefit pension plan (the Plan). The Plan, substantially closed to new members since 1977, provides benefits based on the average of the highest five years’ annual pensionable earnings and years of service. Pensions are increased annually at a rate equal to 70% of the increase in the Saskatchewan consumer price index (CPI).
An independent actuary calculates the funded status of the Plan at December 31 each year based on assumptions regarding discount rates, inflation rates, future pension indexing, and life expectancy. Current service costs are recognized in the statement of income as OM&A expense. Interest expense (income), which is calculated by applying the discount rate to the net accrued benefit obligation, is included in the statement of income as finance charges. The actuarial gains and losses of the Plan are recognized directly in other comprehensive income. As at March 31, 2016, the current status of the Plan recognized on the statement of financial position was an actuarial deficit of $215 million.
Actuarial gains and losses
Actuarial gains and losses on Plan assets are determined by calculating the difference between actual and expected returns of the Plan assets based upon the discount rate at the beginning of the year. Actuarial gains and losses on the accrued benefit obligation are calculated by an independent actuary based on the discount rate in effect at the end of the year. For the year ending March 31, 2016, $27 million in net actuarial losses were recognized directly in other comprehensive income relating to SaskPower’s defined benefit pension plans.
Changes in the long-term assumptions, including the discount rate, inflation rate, future indexing and life expectancy, can have a significant impact on the pension costs of SaskPower. Sensitivity of the Plan to changes in these assumptions on the accrued benefit obligation as at March 31, 2016, is as follows:
Accrued benefit obligation
(in millions) 1% increase 1% decrease
Discount rate $ (95) $ 115
Inflation rate (30) 32
Future indexing 114 (96)
Life expectancy (each member one year older/younger) (30) 32
MANAGEMENT’S DISCUSSION AND ANALYSIS 85
RECENT AND FUTURE ACCOUNTING POLICY CHANGES
There were no accounting changes effective in the fifteen months ended March 31, 2016, that impacted the consolidated financial statements of SaskPower.
The following new standards and amendments to standards and interpretations have been issued, however, are not yet effective for the year ended March 31, 2016, and have not been applied in preparing the consolidated financial statements. SaskPower is currently reviewing the new accounting standards to determine the potential impact, if any, on its consolidated financial statements. The Corporation intends to early adopt International Financial Reporting Standard (IFRS) 9, but does not have plans to early adopt any of the other new standards.
IAS 1, Presentation of Financial Statements
The International Accounting Standards Board (IASB) issued amendments to International Accounting Standard (IAS) 1, Presentation of Financial Statements, on December 18, 2014. The amendments serve to improve the effectiveness of presentation and disclosure in financial reports, with the objective of reducing immaterial note disclosures. Application of the standard is effective for annual reporting periods beginning on or after January 1, 2016. Early adoption is permitted.
IFRS 9, Financial Instruments
The final version of IFRS 9 was issued by the IASB on July 24, 2014, and will replace IAS 39, Financial Instruments: Recognition and Measurement. IFRS 9 uses a single approach to determine whether a financial asset or liability is measured at amortized cost or fair value, replacing the multiple rules in IAS 39. The basis of classification depends on the entity’s business model and the contractual cash flow characteristics of the financial asset or liability. Under IFRS 9, financial assets will generally be measured initially at fair value plus particular transaction costs, and subsequently at either amortized cost or fair value. Furthermore, an entity choosing to measure a financial liability at fair value will present the portion of any change in its fair value due to changes in the entity’s own credit risk in other comprehensive income, rather than within net income. The new model also represents significant improvements in hedge accounting that will enable entities to better reflect risk management activities in their financial statements.
The Standard supersedes all previous versions of IFRS 9 and is effective for annual reporting periods beginning on or after January 1, 2018. SaskPower intends to early adopt this standard effective April 1, 2017.
IFRS 15, Revenue from Contracts with Customers
IFRS 15 was issued by the IASB on May 28, 2014, and will replace IAS 18, Revenue, IAS 11, Construction Contracts, and a number of revenue-related interpretations. Application of the standard is mandatory for all IFRS reporters and it applies to nearly all contracts with customers: the main exceptions are leases, financial instruments and insurance contracts. IFRS 15 establishes principles that an entity shall apply to report useful information to users of financial statements about the nature, amount, timing, and uncertainty of revenue and cash flows arising from a contract with a customer. Application of the standard is mandatory for annual reporting periods beginning on or after January 1, 2018.
IFRS 16, Leases
On January 13, 2016, the IASB issued the new leases standard, IFRS 16, effective for annual reporting periods beginning on or after January 1, 2019. Early adoption is permitted provided that an entity does not adopt the leases standard before adopting the revenue guidance in IFRS 15.
IFRS 16 specifies how an IFRS reporter will recognize, measure, present and disclose leases. The standard provides a single lessee accounting model, requiring lessees to recognize assets and liabilities for all leases unless the lease term is 12 months or less or the underlying asset has a low value. Lessors continue to classify leases using a similar approach to that of the superseded standards, but with enhanced disclosure to improve information about a lessor’s risk exposure. IFRS 16 will replace IAS 17, Leases, and a number of lease-related interpretations.

86 SASKPOWE R 2 015 -16 ANNUAL RE PORT
RISK MANAGEMENT
SaskPower operates in an environment subject to a variety of risks and uncertainties that could impact the achievement of our business objectives, financial and operating performance, and public safety. SaskPower’s risk management response is delivered using a comprehensive risk management approach including policies, procedures, practices and technology designed to support effective risk management. Strategic, financial, operational, environmental, compliance and reputational risks are managed through an Enterprise Risk Management (ERM) Program that is designed to safeguard stakeholder interests, improve efficiency, and improve effectiveness. The ERM Program delivers a consistent and robust approach to risk management and assists in managing the business risks and opportunities involved in SaskPower activities.
ERM GOVERNANCE Our philosophy is that risk management is the responsibility of all employees. Specific roles and responsibilities related to risk management are outlined in our ERM Policy and Committee Charter as approved by the SaskPower Board of Directors. The ERM Policy is reviewed annually and was revised in 2015 to better clarify the roles related to project risk management, due diligence and oversight.
The Board of Directors
The Board of Directors has overall responsibility for the stewardship of the Corporation, including the establishment and maintenance of the ERM Program. The Audit & Finance Committee — as a standing committee of the Board — has risk management responsibility including:
• Assisting the Board in fulfilling its oversight responsibility relating to risk management, accounting and internal control aswell as the integrity of financial statements and the reporting process;
• Overseeing the internal audit function and the external auditors’ qualifications, terms and conditions of appointment,remuneration, independence, performance and reports;
• Reviewing the Corporation’s risk appetite and tolerances, risk profile, the annual enterprise risk register, quarterly interimrisk reporting and the appropriateness of the ERM Program; and
• Establishing policies and procedures, defining acceptable risk tolerance and receiving an annual report of SaskPower’stop risks to satisfy itself that effective risk management systems and processes are in place.
The Environment, Health & Safety Committee reviews significant environment, health and safety risks and plans to mitigate them on an annual basis or as they emerge.
ERM Committee
The President and CEO has ultimate accountability for risk management and is supported by the Executive. Together, they form the SaskPower ERM Committee and are assigned risk management oversight which includes:
• Reviewing the annual Corporate Risk Registry to scan for emerging risks, identify risk correlations, review existing risks,prioritize SaskPower’s top risks, and assign Executive responsibility for identified risks;
• Incorporating risk management into policy development, business and strategic planning and change managementprocesses; and
• Monitoring risks against established limits, goals and targets.
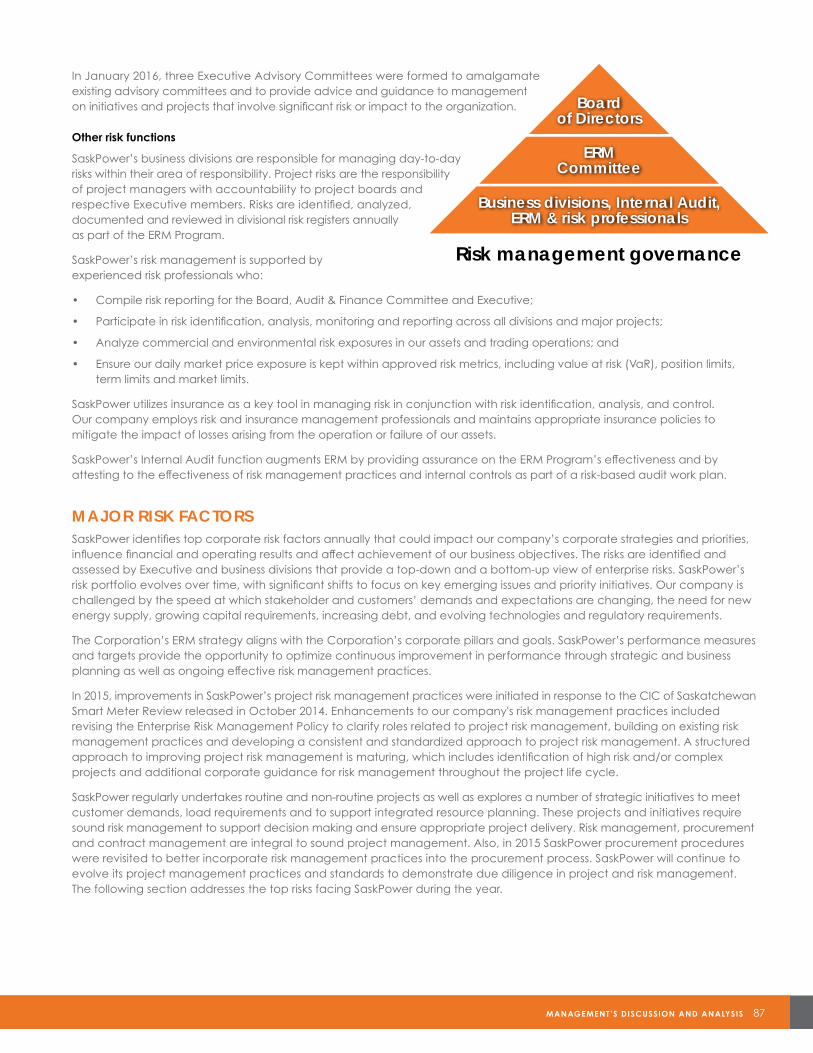
MANAGEMENT’S DISCUSSION AND ANALYSIS 87
In January 2016, three Executive Advisory Committees were formed to amalgamate existing advisory committees and to provide advice and guidance to management on initiatives and projects that involve significant risk or impact to the organization.
Other risk functions
SaskPower’s business divisions are responsible for managing day-to-day risks within their area of responsibility. Project risks are the responsibility of project managers with accountability to project boards and respective Executive members. Risks are identified, analyzed, documented and reviewed in divisional risk registers annually as part of the ERM Program.
SaskPower’s risk management is supported by experienced risk professionals who:
• Compile risk reporting for the Board, Audit & Finance Committee and Executive;
• Participate in risk identification, analysis, monitoring and reporting across all divisions and major projects;
• Analyze commercial and environmental risk exposures in our assets and trading operations; and
• Ensure our daily market price exposure is kept within approved risk metrics, including value at risk (VaR), position limits, term limits and market limits.
SaskPower utilizes insurance as a key tool in managing risk in conjunction with risk identification, analysis, and control. Our company employs risk and insurance management professionals and maintains appropriate insurance policies to mitigate the impact of losses arising from the operation or failure of our assets.
SaskPower’s Internal Audit function augments ERM by providing assurance on the ERM Program’s effectiveness and by attesting to the effectiveness of risk management practices and internal controls as part of a risk-based audit work plan.
MAJOR RISK FACTORSSaskPower identifies top corporate risk factors annually that could impact our company’s corporate strategies and priorities, influence financial and operating results and affect achievement of our business objectives. The risks are identified and assessed by Executive and business divisions that provide a top-down and a bottom-up view of enterprise risks. SaskPower’s risk portfolio evolves over time, with significant shifts to focus on key emerging issues and priority initiatives. Our company is challenged by the speed at which stakeholder and customers’ demands and expectations are changing, the need for new energy supply, growing capital requirements, increasing debt, and evolving technologies and regulatory requirements.
The Corporation’s ERM strategy aligns with the Corporation’s corporate pillars and goals. SaskPower’s performance measures and targets provide the opportunity to optimize continuous improvement in performance through strategic and business planning as well as ongoing effective risk management practices.
In 2015, improvements in SaskPower’s project risk management practices were initiated in response to the CIC of Saskatchewan Smart Meter Review released in October 2014. Enhancements to our company's risk management practices included revising the Enterprise Risk Management Policy to clarify roles related to project risk management, building on existing risk management practices and developing a consistent and standardized approach to project risk management. A structured approach to improving project risk management is maturing, which includes identification of high risk and/or complex projects and additional corporate guidance for risk management throughout the project life cycle.
SaskPower regularly undertakes routine and non-routine projects as well as explores a number of strategic initiatives to meet customer demands, load requirements and to support integrated resource planning. These projects and initiatives require sound risk management to support decision making and ensure appropriate project delivery. Risk management, procurement and contract management are integral to sound project management. Also, in 2015 SaskPower procurement procedures were revisited to better incorporate risk management practices into the procurement process. SaskPower will continue to evolve its project management practices and standards to demonstrate due diligence in project and risk management. The following section addresses the top risks facing SaskPower during the year.
Boardof Directors
ERMCommittee
Risk management governance
Business divisions, Internal Audit,ERM & risk professionals
88 SASKPOWE R 2 015 -16 ANNUAL RE PORT
Infrastructure and reliability remains a top risk at SaskPower. Significant capital spending is required to maintain system reliability, renew aging infrastructure and accommodate growing demand for electricity. SaskPower’s electricity supply infrastructure used to serve existing and new customers is compromised by age, insufficient capital investment, and growing customer demand and expectations. A large portion of SaskPower’s critical generation, transmission and distribution assets are near or at the end of their expected service life. Aging assets are increasingly expensive to maintain and operate and may be less efficient than newer technologies. Significant financial and other resources are required to monitor and properly sustain the existing asset base, replace major components to ensure optimal asset value, allow for capacity increases and perform customer connects. Performance, reliability and maximized uptime of existing generation, transmission and distribution facilities are fundamental to ensuring a safe, continuous and adequate supply of electricity.
SaskPower prioritizes its capital expenditures based on a number of criteria and objectives, including: providing a reliable energy supply to meet forecasted requirements; maintaining system reliability, security and power quality; meeting or exceeding environmental regulations and guidelines; and minimizing the cost of electricity for customers. The capital allocation methodology approaches financing based on three groupings: core sustainment spending; capital spending related to growth and compliance; and strategic and other investments.
Risks we are facing:
• Infrastructure fails, is unavailable and does not supportgrowth, economic activity or meet customer electricityexpectations;
• System reliability is underperforming due to inadequateinfrastructure and access to financing, or the effects ofsevere weather events, natural disasters and man-madeevents (including cyber and physical attacks) may:
º threaten or disrupt normal business operations;
º require significant financial and other resources to maintain reliable service; and
º impact reliability and damage customer confidence and trust; and
• Low customer density relative to grid infrastructure andgrowing trends in customer self-generation or customer-owned generation will affect SaskPower supply andinfrastructure planning and may result in stranded orabandoned assets still required to service load.
Steps we are taking:
• Long-term system planning and the preparation ofintegrated generation, transmission and distribution plans;
• Enhancement to the capital allocation process;
• Implementation of an asset management businessmodel to provide optimal and sustainable managementof assets;
• Implementation of risk- and performance-basedsustainment capital programs; enhancement of plannedmaintenance activities; and performance of systemcondition and health assessments for transmission anddistribution assets;
• Establishment of business continuity and emergencyplans to address load requirements under a variety ofscenarios; and
• Implementation of security requirements based onclassification level of new facilities for construction andrenovation projects.
1. INFRASTRUCTURE AND RELIABILITY
MANAGEMENT’S DISCUSSION AND ANALYSIS 89
SaskPower’s financial flexibility and capability is challenged by growing capital requirements, increasing debt, and unpredictable rate increases. Key financial drivers include revenues which are impacted by load growth, customer mix and approved rate increases. The cost of fuel is driven by load growth, fuel mix, market conditions and fuel costs. Depreciation and finance charges are impacted by capital expenditures, supply arrangements and the cost of borrowing.
Risks we are facing:
• Increasing capital requirements and the availability of capital;
• Rising debt levels;
• Changing economics in the utility model, including carbon pricing and low natural gas prices; and
• Impact of slow economic growth in the province resulting from low commodity prices impacting major customers.
Steps we are taking:
• Enhanced capital allocation methodology, including long-term capital expenditure plans to estimate capital and borrowing requirements;
• Short-term and long-term business planning, including scenario analysis;
• Natural gas exposure management and hedging program; and
• Operational efficiency programs, including ongoing business renewal, process improvement and measurement practices.
SaskPower interacts with a variety of stakeholders within the scope of its operations, including the Aboriginal community, customers, business partners, employees, shareholders, governments, regulatory bodies and contractors. Ineffective communication of SaskPower's needs and strategic direction impacts stakeholders and the shareholder perception and response. Positive stakeholder engagement can help SaskPower achieve its objectives and deal with adversity or significant change when it impacts the organization and its stakeholders.
Risks we are facing:
• Loss of confidence and trust from any stakeholder could affect SaskPower operations and may have a material effect on business operations, planning decisions and financial results; and
• Loss of confidence, trust and/or social licence.
Steps we are taking:
• Development, implementation and monitoring of communication strategies to meet the needs of respective stakeholders, including strategies for using and managing social media;
• Exploration of partnership opportunities through various policies, including the Aboriginal Procurement Policy; and
• Relationship strengthening through information and consultation processes.
2. FINANCIAL FLEXIBILITY AND CAPABILITY
3. REPUTATION
90 SASKPOWE R 2 015 -16 ANNUAL RE PORT
Ongoing SaskPower operations and future supply options are impacted by new and emerging environmental regulations, sustainability initiatives and uncertainties. Issues including carbon pricing, climate change mitigation, carbon reduction measures, and clean technology development contribute to the uncertainty. These uncertainties may impact the achievement of SaskPower’s business strategies, priorities and operational targets. In addition, adaption to climate change will be a significant factor for SaskPower to consider in planning future facilities.
Risks we are facing:
• Environmental regulatory changes and heightenedregulatory scrutiny may affect generation and/ortransmission operations and future supply options;
• Federal, provincial and local government regulations aresubject to change. Failure to execute and/or comply withappropriate environmental regulations, standards, workprocesses and procedures leads to adverse individual,public or corporate consequences including sanctions,fines or orders affecting operations and costs;
• Failure to meet customer expectations related tosustainable supply mix options; and
• Climate change impacts are predicted to influencewater availability.
Steps we are taking:
• SaskPower is in discussions regarding provincialGHG regulations and a federal-provincialequivalency agreement;
• SaskPower has announced a future supply plan targetof up to 50% renewables in the supply mix by 2030 andis developing an Integrated Resource Plan to deliver;
• A PCB Action Plan is in place to address complianceand regulatory requirements;
• A climate change modeling project through theCanadian Electricity Association (CEA) and climatechange modeling applications are underway; and
• SaskPower will continue to engage with theSaskatchewan Water Security Agency as it developswater use strategies, polices and regulatory instruments.
SaskPower operations and/or activities impact the safety of employees, contractors, customers and the general public. There are considerable hazards and risks associated with working on high voltage equipment, at heights, with chemicals, and around large machines that are at a high temperature or pressure. SaskPower interacts with customers, contractors and the public, who must be informed of potential safety issues.
Risks we are facing:
• Failure to execute appropriate work processes andprocedures may result in injury or death as well as leadto adverse financial consequences;
• Failure to address shortcomings that may have anadverse impact on SaskPower’s safety performance;
• Poor safety performance contributes to lowerproductivity due to injury, accident investigations,and lower employee engagement; and
• Contact with energized apparatus by the public oran employee can cause personal injury or death,localized system failure, maintenance, potentiallitigation and reputation risk.
Steps we are taking:
• An operational safety review training program has beendeveloped and rollout commenced in 2015;
• A Safety Improvement Working Group (SIWG) wasconvened in 2015 to examine SaskPower’s safetyperformance and the sufficiency of SaskPower’s safetyprogram. Corporate Safety has created an action planto implement SIWG recommendations;
• Extensive policies, procedures, directives and trainingprograms have been established to provide a safeworking environment and safe public service; and
• Programs have been designed to raise awareness andincrease knowledge for contractors and the generalpublic. Public safety campaigns contribute to theprevention of public safety incidents.
4. ENVIRONMENT
5. SAFETY
MANAGEMENT’S DISCUSSION AND ANALYSIS 91
SaskPower daily business operations rely on information and operational technologies which need to be maintained, supported, protected and secured to enable appropriate authorized access and to ensure reliability, confidentiality, integrity and availability of associated systems and information. Demand for security capabilities will increase because security threats are evolving at an exponentially rapid rate and SaskPower is diversifying and acquiring services that require security innovation, flexibility and adaptability. SaskPower is a target for copper theft and malware.
Risks we are facing:
• Evolving threats from organized crime, international extremists, intellectual property thieves, environmental militants and insider threats could potentially result in:
º disruption of system reliability, core business operations and customer services;
º loss of and/or damage to personnel, information, facilities or equipment;
º loss of stakeholder and customer confidence and trust; and
º costs of recovery and restoration; and
• Vulnerabilities in SaskPower facilities or systems may enable attack.
Steps we are taking:
• Enhancement of security analytics, vulnerability and threat management and data loss prevention through projects designed to address unauthorized access and use of unauthorized software;
• Records and information management activities regarding the appropriate handling of information including physical records and electronic records;
• Working towards compliance of security standards within North American Electric Reliability Corporation (NERC) – Critical Infrastructure Protection;
• Centralization of security services to coordinate security monitoring and response activities; and
• Development of business continuity plans as well as plans to address threats of sabotage and information theft.
SaskPower has identified the need to invest significant amounts of capital in long-term projects to ensure continuing reliability; maintain, upgrade and expand infrastructure; and meet emerging environmental requirements. SaskPower is in the process of delivering a number of significant projects related to customer connects, service delivery improvement, sustainment and refurbishment of existing infrastructure and development of new supply options. All of these are competing for human resources; financial, operating and capital resources; and Executive awareness.
Risks we are facing:
• SaskPower may fail to deliver projects or complete projects on materially different terms or timing than initially anticipated which impacts service delivery to the customer and costs to the Corporation;
• Errors in communication, planning and execution may result in poor project perceptions and impact stakeholder trust and confidence; and
• Any failure of major initiatives to transition to operations may result in damage to SaskPower’s balance sheet and reputation.
Steps we are taking:
• SaskPower established a Project Delivery Office and implemented the Transmission Transformation Initiative to improve project delivery, resulting in a centralized and standardized delivery mechanism for major transmission and generation projects;
• SaskPower is reviewing its project risk management practices and standards to identify improvements in risk management, process safety management, strategic procurement, and contract management;
• SaskPower employs professional project specialists for planning, estimating, execution, cost control and commissioning, and risk management plan development to deal with specific contingencies; and
• SaskPower is working to reduce costs and increase efficiency and effectiveness through strategic sourcing of goods and services, improvement of logistics, and improvements in the procurement operating model and processes.
6. SECURITY (CYBER AND PHYSICAL)
7. PROJECT DELIVERY
92 SASKPOWE R 2 015 -16 ANNUAL RE PORT
SaskPower faces many challenges in attracting and maintaining a safe and productive workforce and in strategically planning for workforce needs. Over the next five to 10 years, a significant number of core SaskPower employees will be eligible for retirement, contributing to a period of challenging transition. Acquiring, developing or maintaining new and critical skills may limit our ability to lead and support ongoing operations.
Risks we are facing:
• Competently skilled workforce is not available;
• Competition for talent and succession planning forcore roles;
• Loss of corporate knowledge, intellectual capacityand experience;
• Effectively integrating workforce planning into theannual business and budget planning process; and
• Unexpected impact in response to change.
Steps we are taking:
• Implementation of a Five-Year Workforce Plan to ensurecurrent and future sourcing needs are met;
• Introduction of attraction and accreditation initiatives,as well as finding qualified skill sets through the building ofstrong sourcing relationships with external organizations;
• Participation in collective bargaining agreementnegotiations with unions to minimize the potential forlabour disruption;
• Introduction of new strategies for engagement, jobevaluation, performance review measurement andrecognition approaches: and
• Electronic capture of corporate knowledge into processand procedures.
Disruption in the acquisition and supply of materials, goods and services impacts service delivery of electricity to customers and system reliability by not having goods and services available in sufficient quantities, at appropriate times, and at competitive costs to maintain and support operations. The supplier environment may be impacted by labour costs, recession, exchange rates, commodity prices or global economic shifts. The degree of impact to SaskPower may depend on the size, asset utilization, capitalization and profitability of the supplier.
Risks we are facing:
• Significant financial costs, project delivery delays,disruption in operations and reputational damagecould be experienced as a result of:
º substandard materials or services;
º uncertain market conditions affecting availability or products and/or services;
º natural disasters; and
º breakdown or bankruptcy of suppliers; and
• Poor quality work or timeliness of supply issues may resultif sufficient qualified suppliers do not bid on contracts.
Steps we are taking:
• Implementation of a contract standardization projectto increase efficiency, reduce negotiation time, ensureconsistency of approach and facilitate ease of use;
• Enhancement of the procurement operating modeland processes to address availability, reliability andcompetitive cost issues as well as supplier performanceand relationship management;
• Addressing strategic and competitive sources, broaderengagement and Aboriginal involvement, includinginternal processes and relationships, through aprocurement transformation initiative; and
• Development of an innovation registry to capture ideasfrom external suppliers and partners.
8. WORKFORCE MANAGEMENT
9. SUPPLY CHAIN
MANAGEMENT’S DISCUSSION AND ANALYSIS 93
Having sufficient fuel available when required for generation is essential to our ability to meet electricity demand and supply customers. Threats to demand, security of supply or price stability impact fuel supply, wholesale energy markets or energy supply. SaskPower’s primary fuel sources are natural gas, coal and hydro. Taken in combination, these fuel sources form the basis of SaskPower’s diversified supply portfolio. SaskPower also has agreements with IPPs to acquire additional supply. Coal contracts are negotiated to address price, security of supply and equipment, and performance items. Natural gas costs are impacted by price volatility, supply availability and market conditions.
Risks we are facing:
• A disruption in the fuel supply, wholesale energy markets or energy supply could adversely affect SaskPower operations, financial condition or its ability to meet electricity demand and service customers;
• Supply planning risk involves consideration of: the cost to install new generation; the fuel price to operate facilities; regulatory concerns around emissions; load forecast uncertainty; hydro conditions, ownership and resource availability; and
• Weather-related risks, including customer load demand, hydro energy production and wind power output.
Steps we are taking:
• Enhancement of our hedging policy and program to address security of natural gas supply, market access and price management;
• Relationship maintenance with suppliers and partners as well as networks with others to keep options available for material and fuel supply;
• Preparation of an Integrated Resource Plan defining a diversified and flexible fuel portfolio, including up to 50% renewables by 2030;
• Development of a long-term coal strategy and appointment of a committee to manage long-term coal contracts; and
• Coordination of planned outages with customers and fuel suppliers to minimize impact.
10. FUEL SUPPLY
CONTENTS
95 Report of Management
96 Management’s Report on Internal Control over Financial Reporting
97 Independent Auditor’s Report
CONSOLIDATED STATEMENTS OF
98 Income
98 Comprehensive loss
99 Financial position
100 Changes in equity
101 Cash flows
NOTES TO THE CONSOLIDATED FINANCIAL STATEMENTS
102 1 Description of business
102 2 Basis of preparation
104 3 Significant accounting policies
110 4 Prior period reclassifications
111 5 Net costs from electricity trading
111 6 Other revenue
111 7 Fuel and purchased power
112 8 Operating, maintenance and administration
112 9 Depreciation and amortization
112 10 Finance charges
113 11 Taxes
113 12 Other expenses
113 13 Unrealized market value adjustments
114 14 Inventory
115 15 Property, plant and equipment
116 16 Intangible assets
116 17 Debt retirement funds
117 18 Investments accounted for using equity method
118 19 Other assets
118 20 Short-term advances
118 21 Long-term debt
120 22 Finance lease obligations
120 23 Provisions
121 24 Equity advances
121 25 Accumulated other comprehensive loss
122 26 Financial instruments
124 27 Financial risk management
126 28 Capital management
127 29 Commitments and contingencies
127 30 Net change in non-cash working capital
128 31 Related party transactions
128 32 Employee benefits
CONSOLIDATED FINANCIAL STATEMENTS AND NOTES
FOR THE FIFTEEN MONTHS ENDED MARCH 31, 2016
94 SASKPOWE R 2 015 -16 ANNUAL RE PORT
CONSOLIDATED FINANCIAL STATEMENTS AND NOTES 95
REPORT OF MANAGEMENT
The consolidated financial statements of Saskatchewan Power Corporation (SaskPower; the Corporation) are the responsibility of management and have been prepared in accordance with International Financial Reporting Standards. The preparation of financial statements necessarily involves the use of estimates based on management’s best judgment, particularly when transactions affecting the current period cannot be finalized with certainty until future periods. In management’s opinion, the consolidated financial statements have been properly prepared within the framework of selected accounting policies summarized in the consolidated financial statements and incorporate, within reasonable limits of materiality, information available up to June 1, 2016. The financial information presented in the Management’s Discussion & Analysis (MD&A) and elsewhere in this report is consistent with that in the consolidated financial statements.
Management maintains appropriate systems of internal control which provide reasonable assurance that the Corporation’s assets are safeguarded and appropriately accounted for, that financial records are relevant, reliable, and accurate, and that transactions are executed in accordance with management’s authorization. This system includes corporate-wide policies and procedures, as well as the appropriate delegation of authority and segregation of responsibilities within the organization. An internal audit function independently evaluates the effectiveness of these controls on an ongoing basis and reports its findings to management and the Audit & Finance Committee of the Board of Directors.
The Board of Directors, through the Audit & Finance Committee, is responsible for ensuring that management fulfills its responsibility for financial reporting and internal control. The Audit & Finance Committee consists entirely of outside Directors. At regular meetings, the Committee reviews audit, internal control and financial reporting matters with management, the internal auditors and the external auditors to satisfy itself that each is properly discharging its responsibilities. The financial statements and the Independent Auditor’s Report have been reviewed by the Audit & Finance Committee and have been approved by the Board of Directors. The internal and external auditors have full and open access to the Audit & Finance Committee, with and without the presence of management.
The consolidated financial statements have been examined by Deloitte LLP, Chartered Professional Accountants, as appointed by the Lieutenant Governor in Council and approved by the Crown Investments Corporation of Saskatchewan. The external auditor’s responsibility is to express its opinion on whether the consolidated financial statements are fairly presented in accordance with International Financial Reporting Standards.
On behalf of management,
Mike Marsh
President and Chief Executive Officer
June 1, 2016
Sandeep Kalra
Vice-president and Chief Financial Officer
96 SASKPOWE R 2 015 -16 ANNUAL RE PORT
MANAGEMENT’S REPORT ON INTERNAL CONTROL OVER FINANCIAL REPORTING
I, Mike Marsh, President and Chief Executive Officer of Saskatchewan Power Corporation, and I, Sandeep Kalra, Vice-president and Chief Financial Officer of Saskatchewan Power Corporation, certify the following:
(a) That we have reviewed the consolidated financial statements included in the Annual Report of Saskatchewan PowerCorporation. Based on our knowledge, having exercised reasonable diligence, the consolidated financial statementsincluded in the Annual Report, fairly present, in all material respects the financial condition, results of operations, andcash flows, as of March 31, 2016.
(b) That based on our knowledge, having exercised reasonable diligence, the consolidated financial statements included inthe Annual Report of Saskatchewan Power Corporation do not contain any untrue statements of material fact, or omit tostate a material fact that is either required to be stated or that is necessary to make a statement not misleading in light ofthe circumstances under which it was made.
(c) That Saskatchewan Power Corporation is responsible for establishing and maintaining effective internal control overfinancial reporting, which includes safeguarding of assets and compliance with applicable legislative authorities; andSaskatchewan Power Corporation has designed internal controls over financial reporting that are appropriate to thecircumstances of Saskatchewan Power Corporation.
(d) That Saskatchewan Power Corporation conducted its assessment of the effectiveness of the Corporation’s internalcontrols over financial reporting and, based on the results of this assessment, Saskatchewan Power Corporationcan provide reasonable assurance that internal controls over financial reporting as of March 31, 2016, wereoperating effectively and no material weaknesses were found in the design or operation of the internal controlsover financial reporting.
On behalf of management,
Mike Marsh
President and Chief Executive Officer
June 1, 2016
Sandeep Kalra
Vice-president and Chief Financial Officer
CONSOLIDATED FINANCIAL STATEMENTS AND NOTES 97
INDEPENDENT AUDITOR’S REPORT
To the Members of the Legislative Assembly of Saskatchewan:
We have audited the accompanying consolidated financial statements of Saskatchewan Power Corporation, which comprise the consolidated statement of financial position as at March 31, 2016, and the consolidated statement of income, consolidated statement of comprehensive loss, consolidated statement of changes in equity and consolidated statement of cash flows for the fifteen months then ended, and a summary of significant accounting policies and other explanatory information.
Management’s Responsibility for the Financial Statements
Management is responsible for the preparation and fair presentation of these consolidated financial statements in accordance with International Financial Reporting Standards, and for such internal control as management determines is necessary to enable the preparation of consolidated financial statements that are free from material misstatement, whether due to fraud or error.
Auditor’s Responsibility
Our responsibility is to express an opinion on these consolidated financial statements based on our audit. We conducted our audit in accordance with Canadian generally accepted auditing standards. Those standards require that we comply with ethical requirements and plan and perform the audit to obtain reasonable assurance about whether the consolidated financial statements are free from material misstatement.
An audit involves performing procedures to obtain audit evidence about the amounts and disclosures in the consolidated financial statements. The procedures selected depend on the auditor’s judgment, including the assessment of the risks of material misstatement of the consolidated financial statements, whether due to fraud or error. In making those risk assessments, the auditor considers internal control relevant to the entity’s preparation and fair presentation of the consolidated financial statements in order to design audit procedures that are appropriate in the circumstances, but not for the purpose of expressing an opinion on the effectiveness of the entity’s internal control. An audit also includes evaluating the appropriateness of accounting policies used and the reasonableness of accounting estimates made by management, as well as evaluating the overall presentation of the consolidated financial statements.
We believe that the audit evidence we have obtained is sufficient and appropriate to provide a basis for our audit opinion.
Opinion
In our opinion, the consolidated financial statements present fairly, in all material respects, the financial position of Saskatchewan Power Corporation as at March 31, 2016, and its financial performance and its cash flows for the fifteen months then ended in accordance with International Financial Reporting Standards.
Chartered Professional Accountants, Chartered AccountantsLicensed Professional AccountantsJune 1, 2016
Regina, Saskatchewan
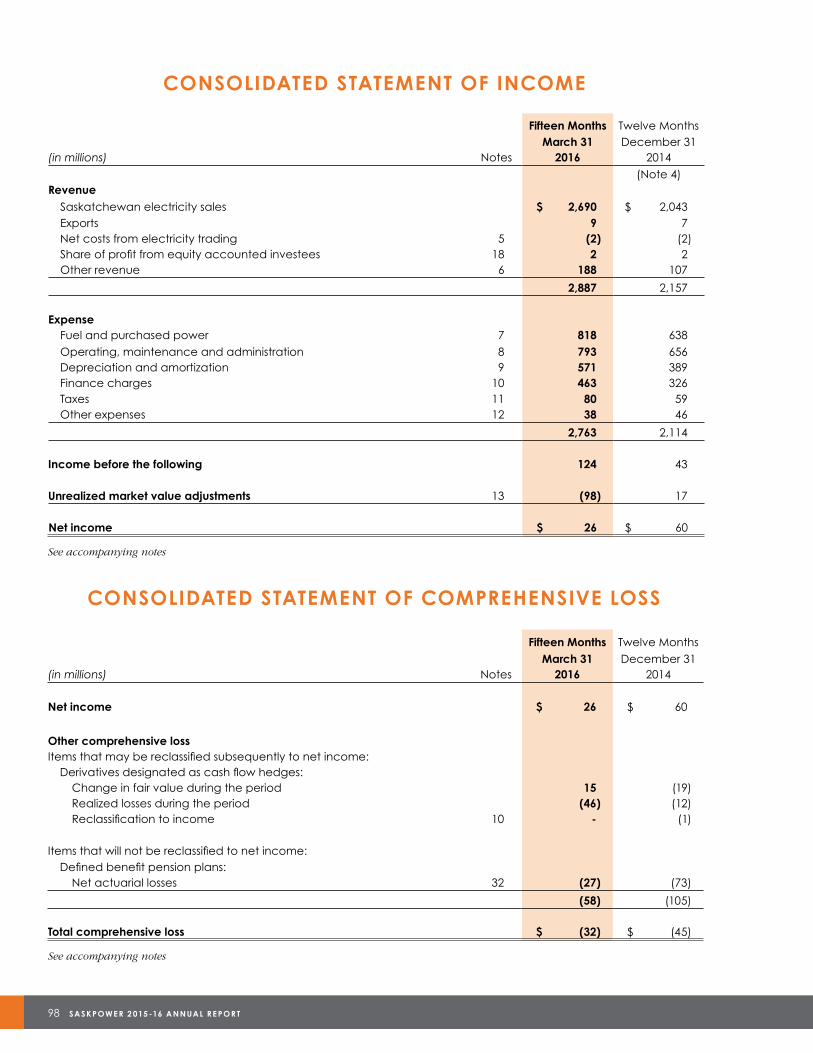
98 SASKPOWE R 2 015 -16 ANNUAL RE PORT
CONSOLIDATED STATEMENT OF INCOME
Fifteen Months Twelve MonthsMarch 31 December 31
(in millions) Notes 2016 2014 (Note 4)
RevenueSaskatchewan electricity sales $ 2,690 $ 2,043
Exports 9 7 Net costs from electricity trading 5 (2) (2)Share of profit from equity accounted investees 18 2 2 Other revenue 6 188 107
2,887 2,157
ExpenseFuel and purchased power 7 818 638 Operating, maintenance and administration 8 793 656 Depreciation and amortization 9 571 389 Finance charges 10 463 326
Taxes 11 80 59 Other expenses 12 38 46
2,763 2,114
Income before the following 124 43
Unrealized market value adjustments 13 (98) 17
Net income $ 26 $ 60
See accompanying notes
CONSOLIDATED STATEMENT OF COMPREHENSIVE LOSS
Fifteen Months Twelve MonthsMarch 31 December 31
(in millions) Notes 2016 2014
Net income $ 26 $ 60
Other comprehensive lossItems that may be reclassified subsequently to net income:
Derivatives designated as cash flow hedges: Change in fair value during the period 15 (19) Realized losses during the period (46) (12) Reclassification to income 10 - (1)
Items that will not be reclassified to net income:Defined benefit pension plans:
Net actuarial losses 32 (27) (73)
(58) (105)
Total comprehensive loss $ (32) $ (45)
See accompanying notes
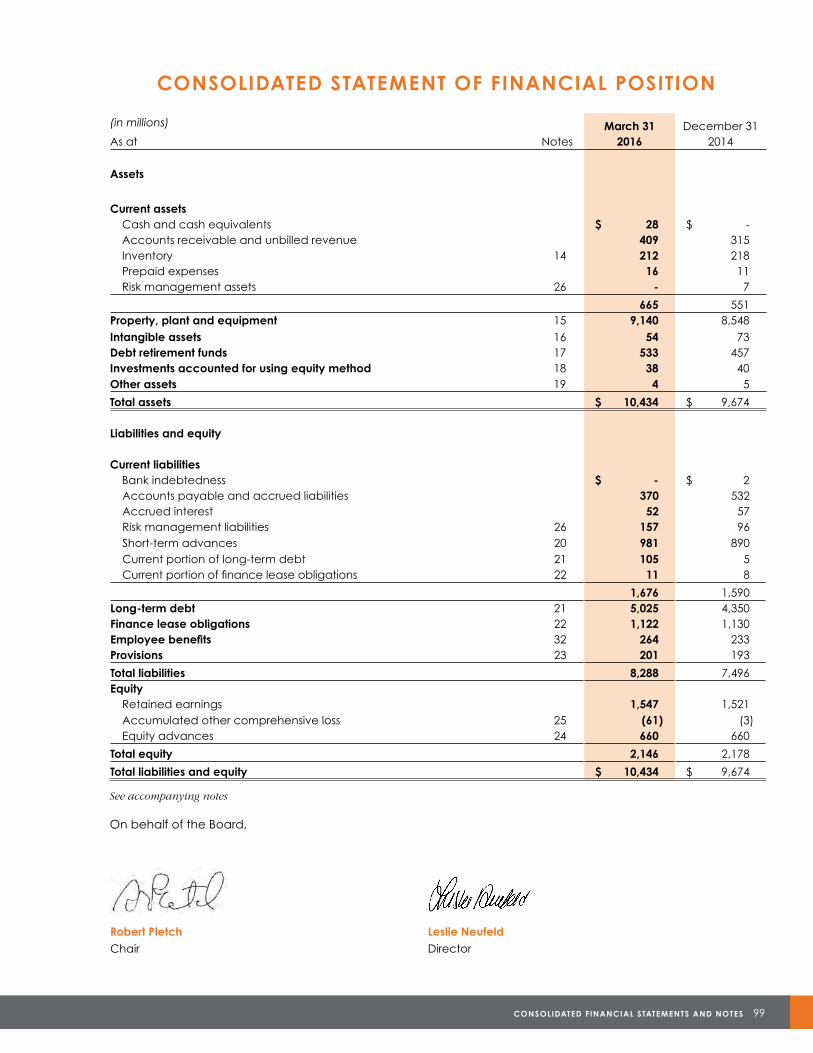
CONSOLIDATED FINANCIAL STATEMENTS AND NOTES 99
Leslie Neufeld Director
Robert Pletch Chair
CONSOLIDATED STATEMENT OF FINANCIAL POSITION
(in millions) March 31 December 31As at Notes 2016 2014
Assets
Current assets Cash and cash equivalents $ 28 $ - Accounts receivable and unbilled revenue 409 315 Inventory 14 212 218 Prepaid expenses 16 11 Risk management assets 26 - 7
665 551 Property, plant and equipment 15 9,140 8,548 Intangible assets 16 54 73 Debt retirement funds 17 533 457 Investments accounted for using equity method 18 38 40 Other assets 19 4 5
Total assets $ 10,434 $ 9,674
Liabilities and equity
Current liabilities Bank indebtedness $ - $ 2 Accounts payable and accrued liabilities 370 532 Accrued interest 52 57 Risk management liabilities 26 157 96 Short-term advances 20 981 890 Current portion of long-term debt 21 105 5 Current portion of finance lease obligations 22 11 8
1,676 1,590 Long-term debt 21 5,025 4,350 Finance lease obligations 22 1,122 1,130 Employee benefits 32 264 233 Provisions 23 201 193
Total liabilities 8,288 7,496 Equity Retained earnings 1,547 1,521 Accumulated other comprehensive loss 25 (61) (3) Equity advances 24 660 660
Total equity 2,146 2,178
Total liabilities and equity $ 10,434 $ 9,674
See accompanying notes
On behalf of the Board,
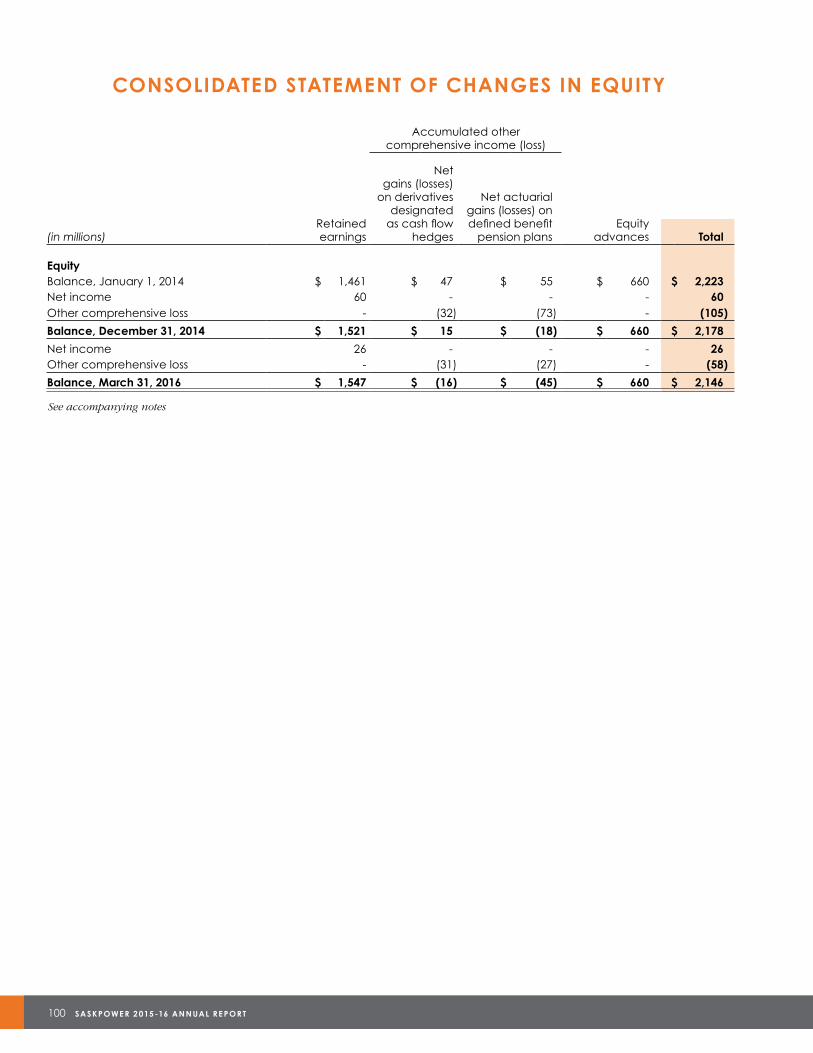
100 SASKPOWE R 2 015 -16 ANNUAL RE PORT
CONSOLIDATED STATEMENT OF CHANGES IN EQUITY
Accumulated other comprehensive income (loss)
(in millions)Retained earnings
Netgains (losses)
on derivatives designated
as cash flowhedges
Net actuarialgains (losses) ondefined benefit
pension plansEquity
advances Total
EquityBalance, January 1, 2014 $ 1,461 $ 47 $ 55 $ 660 $ 2,223 Net income 60 - - - 60 Other comprehensive loss - (32) (73) - (105)
Balance, December 31, 2014 $ 1,521 $ 15 $ (18) $ 660 $ 2,178
Net income 26 - - - 26 Other comprehensive loss - (31) (27) - (58)
Balance, March 31, 2016 $ 1,547 $ (16) $ (45) $ 660 $ 2,146
See accompanying notes
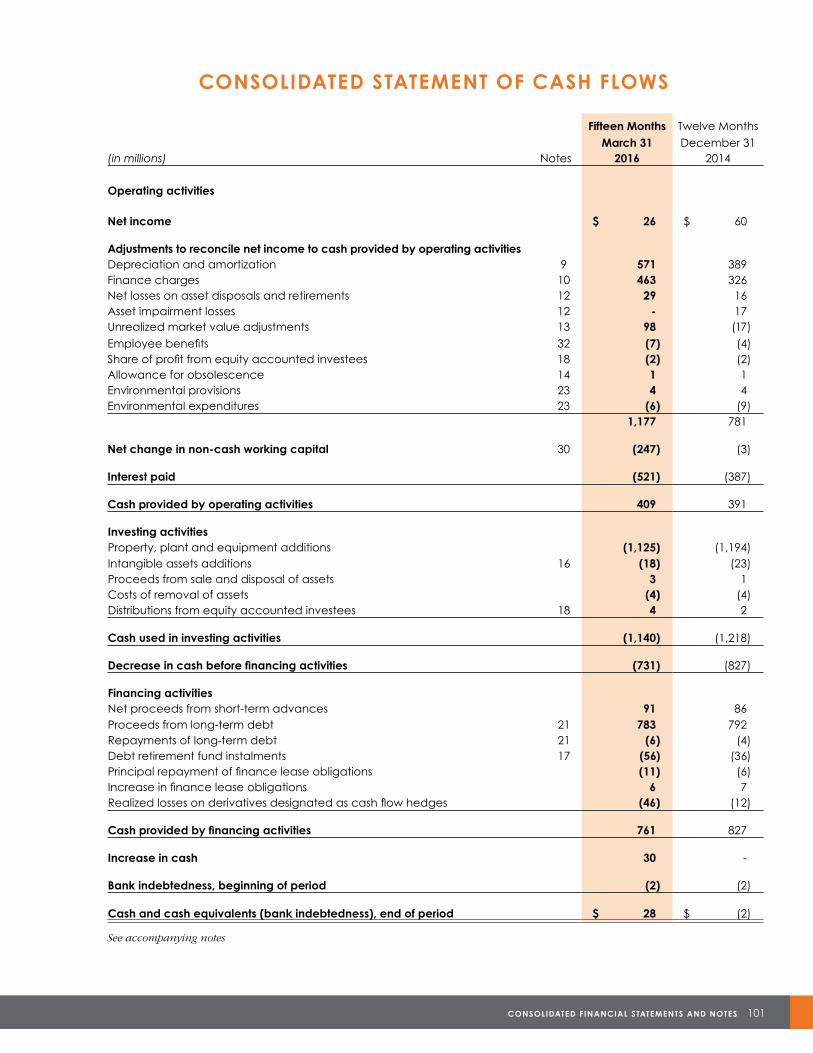
CONSOLIDATED FINANCIAL STATEMENTS AND NOTES 101
CONSOLIDATED STATEMENT OF CASH FLOWS
Fifteen Months Twelve MonthsMarch 31 December 31
(in millions) Notes 2016 2014
Operating activities
Net income $ 26 $ 60
Adjustments to reconcile net income to cash provided by operating activitiesDepreciation and amortization 9 571 389 Finance charges 10 463 326 Net losses on asset disposals and retirements 12 29 16 Asset impairment losses 12 - 17 Unrealized market value adjustments 13 98 (17)Employee benefits 32 (7) (4)Share of profit from equity accounted investees 18 (2) (2)Allowance for obsolescence 14 1 1 Environmental provisions 23 4 4 Environmental expenditures 23 (6) (9)
1,177 781
Net change in non-cash working capital 30 (247) (3)
Interest paid (521) (387)
Cash provided by operating activities 409 391
Investing activitiesProperty, plant and equipment additions (1,125) (1,194)Intangible assets additions 16 (18) (23)Proceeds from sale and disposal of assets 3 1 Costs of removal of assets (4) (4)Distributions from equity accounted investees 18 4 2
Cash used in investing activities (1,140) (1,218)
Decrease in cash before financing activities (731) (827)
Financing activitiesNet proceeds from short-term advances 91 86 Proceeds from long-term debt 21 783 792 Repayments of long-term debt 21 (6) (4)Debt retirement fund instalments 17 (56) (36)Principal repayment of finance lease obligations (11) (6)Increase in finance lease obligations 6 7 Realized losses on derivatives designated as cash flow hedges (46) (12)
Cash provided by financing activities 761 827
Increase in cash 30 -
Bank indebtedness, beginning of period (2) (2)
Cash and cash equivalents (bank indebtedness), end of period $ 28 $ (2)
See accompanying notes

102 SASKPOWE R 2 015 -16 ANNUAL RE PORT
NOTES TO THE CONSOLIDATED FINANCIAL STATEMENTS
1. DESCRIPTION OF BUSINESSSaskatchewan Power Corporation (SaskPower; the Corporation), a provincially-owned Crown corporation, generates,purchases, transmits, distributes and sells electricity and related products and services. Founded as the Saskatchewan PowerCommission in 1929, SaskPower was set up in 1949 and operates primarily under the mandate and authority of The PowerCorporation Act (the Act). SaskPower’s head office is located at 2025 Victoria Avenue in Regina, Saskatchewan,Canada, S4P 0S1.
By virtue of The Crown Corporations Act, 1993, SaskPower has been designated a subsidiary of Crown InvestmentsCorporation of Saskatchewan (CIC), a provincial Crown corporation. Accordingly, the financial results of the Corporationare included in the consolidated financial statements of CIC. As a provincial Crown corporation, the Corporation is notsubject to federal and provincial income taxes.
2. BASIS OF PREPARATION(a) Statement of compliance
These consolidated financial statements have been prepared in accordance with International FinancialReporting Standards (IFRS). The consolidated financial statements were authorized for issue by the Board ofDirectors on June 1, 2016.
(b) Change of year-end
The Corporation has been directed by the provincial government to change its fiscal year-end to March 31 tocoincide with that of the Province of Saskatchewan. Information included in the consolidated financial statementsreflects the first complete fiscal period consisting of the fifteen months ending March 31, 2016, as compared to thetwelve month period ending December 31, 2014, and as a result the two periods are not entirely comparable.
(c) Basis of measurement
The consolidated financial statements have been prepared on the historical cost basis except for the followingmaterial items in the consolidated statement of financial position:
• Inventory at lower of cost and net realizable value defined in Note 3(b).• Financial instruments that are accounted for according to the financial instrument categories defined in Note 3(l).• Provisions discounted at expected future cash flows defined in Note 3(g).• Employee benefit plans recognized at the fair value of plan assets less the present value of the accrued
benefit obligations defined in Note 3(m).
(d) Functional and presentation currency
These consolidated financial statements are presented in Canadian dollars, which is the Corporation’s functionalcurrency. All financial information presented in Canadian dollars has been rounded to the nearest million.
(e) Use of estimates and judgments
The preparation of the consolidated financial statements in conformity with IFRS requires management to makejudgments, estimates and assumptions that affect the application of accounting policies and reported amountsof assets, liabilities, income and expenses. Actual results may differ from these estimates.
Estimates and underlying assumptions are reviewed on an ongoing basis. Revisions to accounting estimates arerecognized in the period in which the estimates are revised and in any future periods affected.
Significant areas requiring the use of management estimates and judgments are further described in the followingsummary of significant accounting policies and related notes:
(i) Electricity sales Estimation and judgment are used to determine the amount of electricity deliveries not yet billed at period-end. Unbilled revenue is estimated by calculating the daily average revenue for each customer based on thecustomer’s past consumption history multiplied by the number of days between the last billing date and the endof the period [Note 3(h)].
CONSOLIDATED FINANCIAL STATEMENTS AND NOTES 103
(ii) Customer contributions Customer contributions are funds received from certain customers towards the costs of service extensions. In
determining when to recognize revenue related to customer contributions, management is required to make judgments in regards to when the related property, plant and equipment is available for use and performance obligations are complete [Notes: 3(h) and 6].
(iii) Receivables Management’s best estimate is required to determine the amount of receivables that will be uncollectible
in a given period. The allowance for doubtful accounts for electricity sales is based on a percentage of accounts outstanding.
(iv) Inventories Estimation and judgment are used to determine the appropriate measure of net realizable value, as well as the
allowance for inventory obsolescence. Management’s best estimate is required to determine the amount of inventories to be written off in a given period [Notes: 3(b) and 14].
(v) Property, plant and equipment Estimation and judgment are involved in determining the useful lives, related depreciation and accumulated
depreciation of property, plant and equipment. Estimated useful lives are determined based upon manufacturer’s guidance on asset life, SaskPower’s past experience with similar assets, industry averages, as well as expectations about future events that could impact the life of the asset. Estimated useful lives are reviewed annually to ensure their reasonableness [Notes: 3(c), 3(d), 9 and 15].
Canada has developed regulatory obligations regarding greenhouse gas emissions for coal-fired generation. However, the impact of the regulations on the timing of the retirement of SaskPower’s coal facilities is not yet known. Judgment has been used to determine the estimated useful lives and related depreciation for these assets.
(vi) Provisions Estimation and judgment are involved in determining the carrying amounts of decommissioning and
environmental remediation provisions. The provisions are recorded at the fair value based on the Corporation’s best estimate of the future cash expenditures required to settle the obligations, taking into account current environmental regulations. The underlying estimates of future cash flows are required to be made over a long period of time, given the fact that most provisions will not be settled for a number of years [Notes: 3(g) and 23].
(vii) Leases In identifying whether the Corporation’s power purchase agreements (PPAs) are leases, management must use
judgment in assessing whether the fulfillment of the arrangement is dependent on the use of a specific asset and the arrangement conveys the right to use the asset [Notes: 3(k) and 22].
(viii) Financial instruments Determining the fair value of financial instruments and derivatives can require significant estimation regarding
components such as future price, volatility and liquidity. Fair values can fluctuate significantly depending on current market conditions. These estimates of fair value may not accurately reflect the amounts that could be realized or settled [Notes: 3(l) and 26].
(ix) Employee benefits Employee benefit plans expense and obligations are calculated by an independent actuary based on
underlying actuarial assumptions, including discount rates, inflation rates, future pension indexing and life expectancy. These assumptions are determined by management and reviewed annually by the actuary. The calculations are complex, and a change in the estimate of any of the assumptions could have a material effect on the employee benefit plans expense or obligation [Notes: 3(m) and 32].
(f) New standards and interpretations not yet adopted
A number of new standards, and amendments to standards and interpretations, are not yet effective for the fifteen months ended March 31, 2016, and have not been applied in preparing these consolidated financial statements.
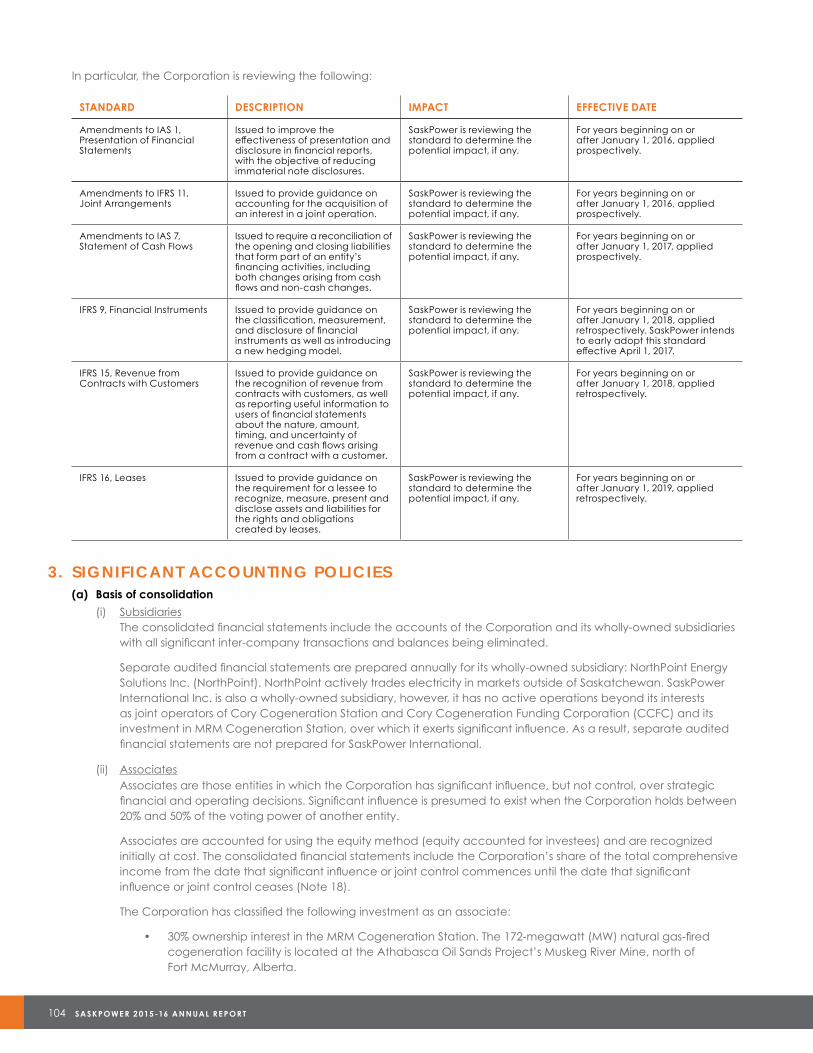
104 SASKPOWE R 2 015 -16 ANNUAL RE PORT
In particular, the Corporation is reviewing the following:
3. SIGNIFICANT ACCOUNTING POLICIES(a) Basis of consolidation
( i) Subsidiaries The consolidated financial statements include the accounts of the Corporation and its wholly-owned subsidiarieswith all significant inter-company transactions and balances being eliminated.
Separate audited financial statements are prepared annually for its wholly-owned subsidiary: NorthPoint EnergySolutions Inc. (NorthPoint). NorthPoint actively trades electricity in markets outside of Saskatchewan. SaskPowerInternational Inc. is also a wholly-owned subsidiary, however, it has no active operations beyond its interestsas joint operators of Cory Cogeneration Station and Cory Cogeneration Funding Corporation (CCFC) and itsinvestment in MRM Cogeneration Station, over which it exerts significant influence. As a result, separate auditedfinancial statements are not prepared for SaskPower International.
( ii) Associates Associates are those entities in which the Corporation has significant influence, but not control, over strategicfinancial and operating decisions. Significant influence is presumed to exist when the Corporation holds between20% and 50% of the voting power of another entity.
Associates are accounted for using the equity method (equity accounted for investees) and are recognizedinitially at cost. The consolidated financial statements include the Corporation’s share of the total comprehensiveincome from the date that significant influence or joint control commences until the date that significantinfluence or joint control ceases (Note 18).
The Corporation has classified the following investment as an associate:
• 30% ownership interest in the MRM Cogeneration Station. The 172-megawatt (MW) natural gas-firedcogeneration facility is located at the Athabasca Oil Sands Project’s Muskeg River Mine, north ofFort McMurray, Alberta.
STANDARD DESCRIPTION IMPACT EFFECTIVE DATE
Amendments to IAS 1, Presentation of Financial Statements
Issued to improve the effectiveness of presentation and disclosure in financial reports, with the objective of reducing immaterial note disclosures.
SaskPower is reviewing the standard to determine the potential impact, if any.
For years beginning on or after January 1, 2016, applied prospectively.
Amendments to IFRS 11, Joint Arrangements
Issued to provide guidance on accounting for the acquisition of an interest in a joint operation.
SaskPower is reviewing the standard to determine the potential impact, if any.
For years beginning on or after January 1, 2016, applied prospectively.
Amendments to IAS 7, Statement of Cash Flows
Issued to require a reconciliation of the opening and closing liabilities that form part of an entity’s financing activities, including both changes arising from cash flows and non-cash changes.
SaskPower is reviewing the standard to determine the potential impact, if any.
For years beginning on or after January 1, 2017, applied prospectively.
IFRS 9, Financial Instruments Issued to provide guidance on the classification, measurement, and disclosure of financial instruments as well as introducing a new hedging model.
SaskPower is reviewing the standard to determine the potential impact, if any.
For years beginning on or after January 1, 2018, applied retrospectively. SaskPower intends to early adopt this standard effective April 1, 2017.
IFRS 15, Revenue from Contracts with Customers
Issued to provide guidance on the recognition of revenue from contracts with customers, as well as reporting useful information to users of financial statements about the nature, amount, timing, and uncertainty of revenue and cash flows arising from a contract with a customer.
SaskPower is reviewing the standard to determine the potential impact, if any.
For years beginning on or after January 1, 2018, applied retrospectively.
IFRS 16, Leases Issued to provide guidance on the requirement for a lessee to recognize, measure, present and disclose assets and liabilities for the rights and obligations created by leases.
SaskPower is reviewing the standard to determine the potential impact, if any.
For years beginning on or after January 1, 2019, applied retrospectively.
CONSOLIDATED FINANCIAL STATEMENTS AND NOTES 105
(iii) Joint operations Joint operations are those entities over whose activities the Corporation has joint control, established bycontractual agreement and requiring unanimous consent for strategic financial and operating decisions.They also provide the Corporation with rights to the assets and liabilities related to the arrangement.
The Corporation has classified the following arrangements as joint operations:
• 50% ownership interest in an unincorporated joint venture with ATCO Power Canada Ltd. The jointventure owns and operates a 228-MW natural gas-fired cogeneration plant (Cory Cogeneration Station)near Saskatoon, Saskatchewan. The electricity generated by the facility is sold to SaskPower under theterms of a 25-year PPA.
• 50% ownership interest in CCFC. CCFC is a special purpose company established by the Corporationand ATCO Power Canada Ltd. (the Owners) to borrow long-term, non-recourse debt to finance theCory Cogeneration Station. CCFC acts as agents for the Owners by receiving revenues, disbursing costs(including debt service) and distributing proceeds to the Owners.
• 50% ownership interest in BHP Billiton SaskPower Carbon Capture and Storage (CCS) Knowledge CentreInc. This not-for-profit corporation was established on February 26, 2016, to advance the understandingand use of CCS as a means of managing greenhouse gas emissions and to further research projectsrelated thereto as agreed upon by its members from time to time.
The consolidated financial statements include the Corporation’s proportionate share of the joint operation assets, liabilities, revenue and expenses.
(b) Inventory
Maintenance materials, supplies, natural gas, coal and other fuel inventory are recorded at the lower of weightedaverage cost and net realizable value. Net realizable value represents the estimated selling price for inventories lessall estimated costs necessary to make the sale. Replacement cost is used as management’s best estimate of the netrealizable value for maintenance materials, supplies, coal and other fuel inventory. Net realizable value for naturalgas inventory is determined using the near-month AECO C natural gas market prices as appropriate. Inventories arewritten down to net realizable value on an item by item basis.
In establishing the appropriate provision for inventory obsolescence, management estimates the likelihood thatinventory on hand will become obsolete due to changes in technology. Maintenance materials and supplies arecharged to inventory when purchased and expensed or capitalized when used. Natural gas, coal and other fuelinventory are charged to inventory when purchased and expensed as consumed or sold (Note 14).
(c) Property, plant and equipment
Property, plant and equipment is recorded at cost or deemed cost less accumulated depreciation and accumulatedimpairment losses. Cost includes expenditures that are directly attributable to the acquisition of the asset. The cost ofself-constructed assets includes the cost of materials, services and direct labour. Borrowing costs associated with majorcapital and development projects that are six months or longer in duration are capitalized during the constructionperiod at the weighted average cost of borrowings. Assets under construction are recorded as in progress until theyare operational and available for use, at which time they are transferred to property, plant and equipment.
Costs are capitalized provided there is reasonable certainty they will provide benefits into the future. Significantrenewals and enhancements to existing assets are capitalized only if the useful life of the asset is increased; physicaloutput, service capacity or quality is improved above original design standards; or operating costs are reduced bya substantial and quantifiable amount that can be reliably measured. The costs of day-to-day servicing of property,plant and equipment are expensed as incurred (Note 15).
When property, plant and equipment are disposed of or retired, the related costs less accumulated depreciation arede-recognized. The gain or loss arising on the disposal or retirement of an item of property, plant and equipment isdetermined as the difference between the sales proceeds less costs of removal and the carrying amount of the asset.The gain or loss on asset disposals and retirements is recognized in profit or loss as other expenses (Note 12).
Assets held under finance leases are initially recognized at the lower of their fair value at the inception of the lease orthe present value of the minimum lease payments. The corresponding liability is recorded as a finance lease obligation(Note 22).
106 SASKPOWE R 2 015 -16 ANNUAL RE PORT
(d) Depreciation
Depreciation is recognized on a straight-line basis over the estimated useful life of each component of property, plantand equipment. Depreciation commences when the property, plant and equipment is ready for its intended use.Land is not depreciated.
The estimated useful life of property, plant and equipment is based on manufacturer’s guidance, past experienceand future expectations regarding the potential for technical obsolescence. Their estimated useful lives are reviewedannually and any changes are applied prospectively.
Following the completion of an internal depreciation study, the estimated useful lives of certain assets were changed.The change in estimate was applied prospectively, effective January 1, 2015, and resulted in approximately a$9 million increase to depreciation expense for the fifteen months ended March 31, 2016.
The estimated useful lives of the major classes of property, plant and equipment are:
Asset class Estimated useful lives (years)
Generation 5 – 100Transmission 3 – 55Distribution 3 – 40Other 4 – 60
A one-year increase in the estimated useful life of each of the major classes of property, plant and equipment would result in a $33 million decrease to depreciation expense annually.
Assets held under finance leases are depreciated over their expected useful economic lives on the same basis as for owned assets, or where shorter, the lease term (Note 9).
(e) Intangible assets
The Corporation’s only identifiable intangible asset is software. Software is recorded at cost less accumulatedamortization and accumulated impairment losses. Software costs include the cost of externally purchased softwarepackages and for internally developed programs, related external and direct labour costs. Maintenance of existingsoftware programs is expensed as incurred (Note 16).
Amortization is calculated on a straight-line basis over five years — the estimated useful life of the Corporation’ssoftware programs. The estimated useful life of intangible assets is reviewed annually and any changes are appliedprospectively (Note 9).
(f) Impairment of assets
At each reporting date, the Corporation evaluates its property, plant and equipment and intangible assets forimpairment whenever events or changes in circumstances indicate that the carrying amount of such assets maynot be fully recoverable. Factors which could indicate an impairment exists include significant changes in theCorporation’s strategy or underperformance of assets relative to projected future operating results. An impairment isrecognized when the carrying amount of an asset or cash generating unit (CGU) exceeds the recoverable amount.The recoverable amount is the higher of the fair value less costs to sell and the present value of the future cash flowsto be derived from a CGU. At the reporting date, the Corporation determined that there was no impairment of valueto its long-lived assets and therefore no write-down was required.
Impairment losses previously recognized for an asset are assessed at each reporting date for any indications thatthe loss has decreased or no longer exists. An impairment loss is reversed if there has been a change in the estimatesused to determine the recoverable amount. In no case shall the revised carrying amount exceed the original carryingamount, after depreciation or amortization, that would have been determined if no impairment loss had beenrecognized. An impairment loss or reversal of an impairment loss is recognized in other expenses (Note 12).
(g) Provisions
A provision is recognized if, as a result of a past event, the Corporation has a present legal or constructive obligationthat can be estimated reliably, and it is probable that an outflow of economic benefits will be required to settle theobligation, the timing or amount of which is uncertain. Provisions are determined by discounting the expected futurecash flows at a rate that reflects current market assessments of the time value of money and the risks specific to theobligation. For SaskPower, that rate is considered to be equal to the yield on Government of Saskatchewan bonds
CONSOLIDATED FINANCIAL STATEMENTS AND NOTES 107
that match the timing of the expected cash flows. The unwinding of the discount on provisions is recognized in profit or loss as a finance expense.
When some or all of the economic benefits required to settle a provision are expected to be recovered from a third party, the receivable is recognized as an asset if it is virtually certain that reimbursement will be received and the amount of the receivable can be measured reliably.
(i) Decommissioning A decommissioning provision is a legal or constructive obligation associated with the decommissioning of
a long-lived asset. The Corporation recognizes decommissioning provisions in the period they are incurred if a reasonable estimate of fair value (net present value) can be determined. The Corporation recognizes provisions to decommission coal, natural gas, cogeneration and wind generation facilities in the period in which the facility is commissioned. SaskPower also recognizes provisions for the decommissioning of assets containing polychlorinated biphenyls (PCBs) in accordance with existing federal regulations.
The fair value of the estimated decommissioning costs is recorded as a provision with an offsetting amount capitalized and included as part of property, plant and equipment. The decommissioning provisions are increased periodically for the passage of time by calculating interest expense. The offsetting capitalized asset retirement costs are depreciated over the estimated useful life of the related asset.
The calculations of fair value are based on detailed studies that take into account various assumptions regarding the anticipated future cash flows including the method and timing of decommissioning and estimates of future inflation. Decommissioning provisions are periodically reviewed and any changes in the estimated timing and amount of future cash flows, as well as changes in the discount rate, are recognized as an increase or decrease in the carrying amount of the obligation and the related asset. If the asset value is fully depreciated, the changes are recognized in profit or loss as other expenses (Notes: 12 and 23).
(ii) Environmental remediation A provision for environmental remediation is accrued when the occurrence of an environmental expenditure,
related to present or past activities of the Corporation, is considered probable and the costs of remedial activities can be reasonably estimated. The fair value of the estimated costs for investigations and remediation at identified sites is recorded as a provision in profit or loss as other expenses. These provisions are based on management’s best estimate considering current environmental laws and regulations and are recorded at fair value. The Corporation reviews its estimates of future environmental expenditures on an ongoing basis. Changes in the estimated timing and amount of future cash flows are recognized in profit or loss as other expenses (Notes: 12 and 23).
(h) Revenue recognition
Revenue represents amounts receivable for goods and services provided in the normal course of business. Revenue is recognized when it is probable that future economic benefits will flow to the Corporation and these benefits can be measured reliably.
(i) Electricity Electricity pricing in Saskatchewan is subject to review by the Saskatchewan Rate Review Panel with final
approval by provincial cabinet. Saskatchewan electricity sales and exports are recognized upon delivery to the customer and include an estimate of electricity deliveries not yet billed at period-end. The estimated unbilled revenue is based on several factors, including estimated consumption by customer, applicable customer rates and the number of days between the last billing date and the end of the period.
Electricity trading revenues are reported on a net basis upon delivery of electricity to the customers and receipt of electricity purchased from external parties. Electricity trading contracts are recorded at fair value (Notes: 5 and 26).
(ii) Customer contributions Customer contributions are funds received from certain customers toward the costs of service extensions. These
contributions are generally recognized immediately in profit or loss as other revenue when the related property, plant and equipment is available for use and the Corporation’s performance obligations are completed (Note 6).
(iii) Other Wind power incentives received from the Government of Canada for electricity generated from the Centennial
and Cypress Wind Power Facilities are recognized as other revenue upon delivery of the electricity into the SaskPower grid. Other revenue also includes gas and electrical inspections, fly ash and carbon dioxide (CO2) sales which are recorded upon delivery of the related good or service (Note 6).
108 SASKPOWE R 2 015 -16 ANNUAL RE PORT
(i) Finance charges
Finance expense is comprised of interest expense on short-term and long-term borrowings, interest on provisions,interest on employee benefit plans and finance costs related to leased assets. Interest expense is recognized inprofit or loss, using the effective interest method. Borrowing costs that are directly attributable to the acquisition,construction or production of a qualifying asset form part of the cost of that asset. All other borrowing costs arerecognized as a finance expense as the costs accrue (Note 10).
Finance income is comprised of earnings on debt retirement funds. Finance income is recognized in profit or lossas earned (Note 10).
(j) Foreign currency translation
Monetary assets and liabilities denominated in a foreign currency are translated to Canadian dollars using the rateof exchange in effect at the reporting date. Revenues and expenses are translated at the rate prevailing at thetransaction date. Foreign currency translation gains and losses are included in other expenses in the period in whichthey arise (Note 12).
(k) Leases
Leases are classified as finance leases whenever the terms of the lease transfer substantially all the risk and rewardsof ownership to the lessee. The Corporation has assessed its arrangements to determine whether they contain alease. Certain take-or-pay PPAs, which in management’s judgment give SaskPower the exclusive right to use specificproduction assets, meet the definition of a lease. These arrangements have been classified as finance leases.
Assets held under finance leases are initially recognized at the lower of their fair value at the inception of the leaseor the present value of the minimum lease payments. The corresponding liability is recorded as a finance leaseobligation. Each lease payment is allocated between the liability and interest so as to achieve a constant rate onthe finance balance outstanding. The interest component is included in finance expense.
Assets held under finance leases are depreciated over their expected useful economic lives on the same basis as forowned assets, or where shorter, the lease term.
All other transactions in which SaskPower is the lessee are classified as operating leases. Payments made underoperating leases are expensed over the term of the lease (Notes: 15 and 22).
(l) Financial instruments
(i) Classification and measurement SaskPower classifies its financial instruments into one of the following categories: financial instruments at fair valuethrough profit or loss; loans and receivables; and other liabilities (Note 26). All financial instruments are measuredat fair value on initial recognition and recorded on the consolidated statement of financial position. Financialassets and liabilities are offset and the net amount reported on the statement of financial position when thereis a legally enforceable right to offset the recognized amounts and there is an intention to settle on a net basis,or realize the asset and settle the liability simultaneously. Transaction costs that are directly attributable to theacquisition or issue of financial assets and financial liabilities (other than financial assets and financial liabilitiesat fair value through profit or loss) are added to or deducted from the fair value of the financial assets orfinancial liabilities, as appropriate, on initial recognition. Transaction costs directly attributable to the acquisitionof financial instruments classified as fair value through profit or loss are expensed as incurred. Measurement insubsequent periods depends on the classification of the financial instrument.
Financial instruments classified as fair value through profit or loss are subsequently measured at fair value,with changes in fair value recognized in the consolidated statement of income in unrealized market valueadjustments. Financial instruments classified as loans and receivables and other liabilities are subsequentlymeasured at amortized cost using the effective interest method, less any impairment.
Derivative financial instruments, including natural gas and electricity contracts, are recognized as a financialasset or a financial liability on the trade date. All derivative financial instruments are classified as fair value throughprofit or loss and recorded at fair value on the consolidated statement of financial position as risk managementassets and liabilities. Subsequent changes in fair value of these derivative financial instruments, with the exceptionof the effective portion of derivatives designated as cash flow hedges, are recognized in the consolidatedstatement of income in unrealized market value adjustments.
The terms and conditions of certain derivative financial instrument contracts require SaskPower to providecollateral when the fair value of the obligation pursuant to these contracts is in excess of exposure limits granted.
CONSOLIDATED FINANCIAL STATEMENTS AND NOTES 109
When posted, these collateral amounts are recognized as margin deposits on derivative financial instruments and are included with accounts receivable on the statement of financial position.
Certain commodity contracts for the physical purchase of natural gas qualify as own-use contracts. SaskPower entered into these contracts for the purpose of physical receipt of the natural gas in accordance with its own expected usage requirements for the generation of electricity. As such, these non-financial derivative contracts are not recorded at fair value on the consolidated statement of financial position; rather, the contracts are accounted for as a purchase at the time of delivery.
(ii) Hedges In order to qualify for hedge accounting, the Corporation designates derivatives as hedges through formal
documentation of all relationships between hedging instruments and hedged items, as well as the risk management objective and strategy for undertaking the hedge transaction. This process includes linking derivatives to specific assets and liabilities or to specific firm commitments or forecast transactions. The Corporation formally assesses both at the hedge’s inception and on an ongoing basis, whether the derivatives used are highly effective in offsetting changes in cash flows of the hedged item and the timing of the cash flows is similar.
The Corporation enters into bond forward agreements to hedge exposures to anticipated changes in interest rates on forecasted issuances of debt (Note 26). The Corporation chooses to designate these contracts as cash flow hedges. As such, the effective portion of the changes in fair value related to the derivative financial instruments are recognized in other comprehensive income, with the fair value being recognized as risk management assets and liabilities on the consolidated statement of financial position. Ineffective portions of hedges are recorded in profit or loss immediately. When the derivatives expire upon the issuance of debt, the resulting gain or loss recorded in accumulated other comprehensive income (loss) is amortized to profit or loss over the term of the debt. If no debt is issued, the gain or loss is recognized in profit or loss immediately.
(iii) Embedded derivatives As at March 31, 2016, the Corporation does not have any outstanding contracts or financial instruments with
embedded derivatives that are required to be valued separately.
(iv) Fair value Fair value is the price that would be received to sell an asset or paid to transfer a liability in an orderly transaction
between market participants in the principal or most advantageous market at the measurement date. SaskPower’s own credit risk and the credit risk of the counterparty have been taken into account in determining the fair value of financial assets and liabilities, including derivative instruments. The Corporation has classified the fair value of its financial instruments as level 1, 2, or 3 (Note 26) as defined below:
Level 1 – Fair values are determined using inputs that are quoted prices (unadjusted) in active markets for identical assets or liabilities to which the Corporation has immediate access.
Level 2 – Fair values are determined using inputs other than quoted prices included in level 1 that are observable for the asset or liability, either directly or indirectly. The debt retirement funds are valued by the Government of Saskatchewan Ministry of Finance using information provided by investment dealers. To the extent possible, valuations reflect indicative secondary pricing for these securities. In all other circumstances, valuations are determined with reference to similar actively traded instruments. The fair value of long-term debt is determined by the present value of future cash flows, discounted at the market rate of interest for the same or similar debt instruments.
Natural gas fixed price swap contract values are calculated using internal discounted cash flow models that rely on forward AECO C natural gas pricing provided by independent reference dealers. The contracted cash flows are discounted using observable yield curves.
Electricity contract fair values are determined using independent pricing information from external market providers.
Bond forward agreement fair values are determined using internal discounted cash flow models that rely on forward Government of Canada bond yields provided by independent reference dealers. The contracted cash flows are discounted using observable yield curves.
Level 3 – Fair values are determined based on inputs for the asset or liability that are not based on observable market data. The finance lease obligations are valued using internal cash flow models based on contracted pricing in the Corporation’s PPAs. The contracted cash flows are discounted using the Government of Saskatchewan bond yields adjusted for a negotiated risk premium.
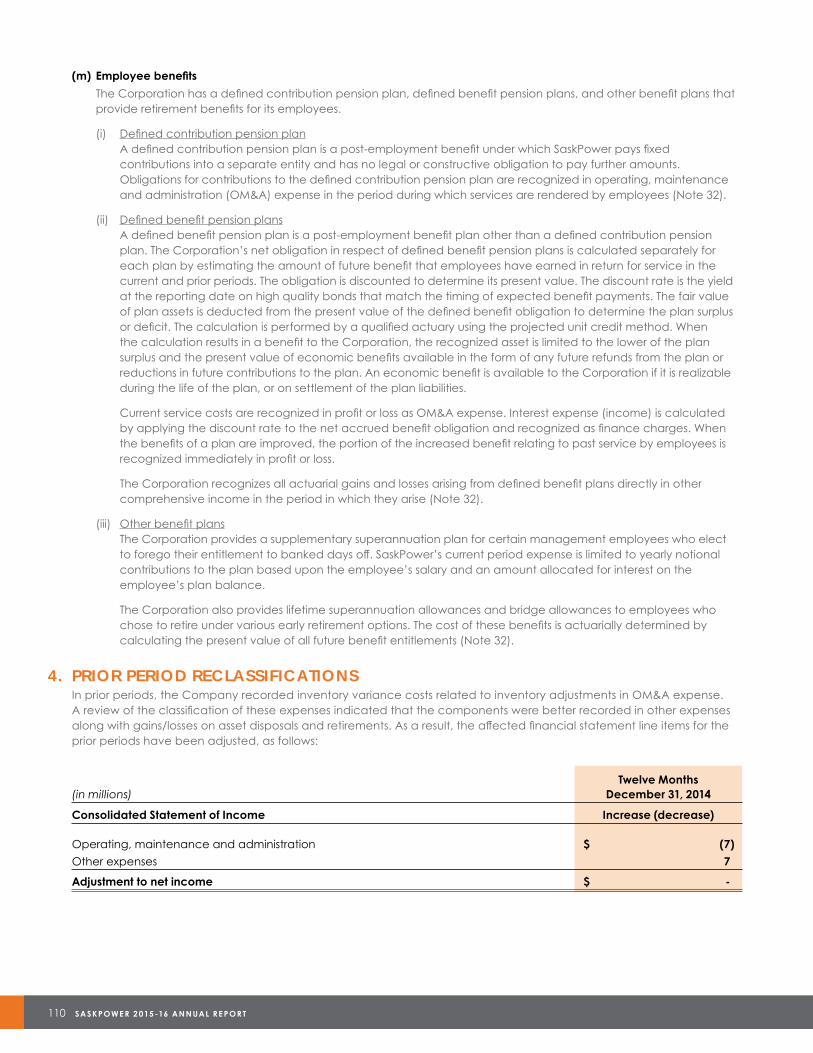
110 SASKPOWE R 2 015 -16 ANNUAL RE PORT
(m) Employee benefits
The Corporation has a defined contribution pension plan, defined benefit pension plans, and other benefit plans thatprovide retirement benefits for its employees.
(i) Defined contribution pension plan A defined contribution pension plan is a post-employment benefit under which SaskPower pays fixedcontributions into a separate entity and has no legal or constructive obligation to pay further amounts.Obligations for contributions to the defined contribution pension plan are recognized in operating, maintenanceand administration (OM&A) expense in the period during which services are rendered by employees (Note 32).
(ii) Defined benefit pension plans A defined benefit pension plan is a post-employment benefit plan other than a defined contribution pensionplan. The Corporation’s net obligation in respect of defined benefit pension plans is calculated separately foreach plan by estimating the amount of future benefit that employees have earned in return for service in thecurrent and prior periods. The obligation is discounted to determine its present value. The discount rate is the yieldat the reporting date on high quality bonds that match the timing of expected benefit payments. The fair valueof plan assets is deducted from the present value of the defined benefit obligation to determine the plan surplusor deficit. The calculation is performed by a qualified actuary using the projected unit credit method. Whenthe calculation results in a benefit to the Corporation, the recognized asset is limited to the lower of the plansurplus and the present value of economic benefits available in the form of any future refunds from the plan orreductions in future contributions to the plan. An economic benefit is available to the Corporation if it is realizableduring the life of the plan, or on settlement of the plan liabilities.
Current service costs are recognized in profit or loss as OM&A expense. Interest expense (income) is calculatedby applying the discount rate to the net accrued benefit obligation and recognized as finance charges. Whenthe benefits of a plan are improved, the portion of the increased benefit relating to past service by employees isrecognized immediately in profit or loss.
The Corporation recognizes all actuarial gains and losses arising from defined benefit plans directly in othercomprehensive income in the period in which they arise (Note 32).
(iii) Other benefit plans The Corporation provides a supplementary superannuation plan for certain management employees who electto forego their entitlement to banked days off. SaskPower’s current period expense is limited to yearly notionalcontributions to the plan based upon the employee’s salary and an amount allocated for interest on theemployee’s plan balance.
The Corporation also provides lifetime superannuation allowances and bridge allowances to employees whochose to retire under various early retirement options. The cost of these benefits is actuarially determined bycalculating the present value of all future benefit entitlements (Note 32).
4. PRIOR PERIOD RECLASSIFICATIONSIn prior periods, the Company recorded inventory variance costs related to inventory adjustments in OM&A expense.A review of the classification of these expenses indicated that the components were better recorded in other expensesalong with gains/losses on asset disposals and retirements. As a result, the affected financial statement line items for theprior periods have been adjusted, as follows:
Twelve Months (in millions) December 31, 2014
Consolidated Statement of Income Increase (decrease)
Operating, maintenance and administration $ (7)
Other expenses 7
Adjustment to net income $ -
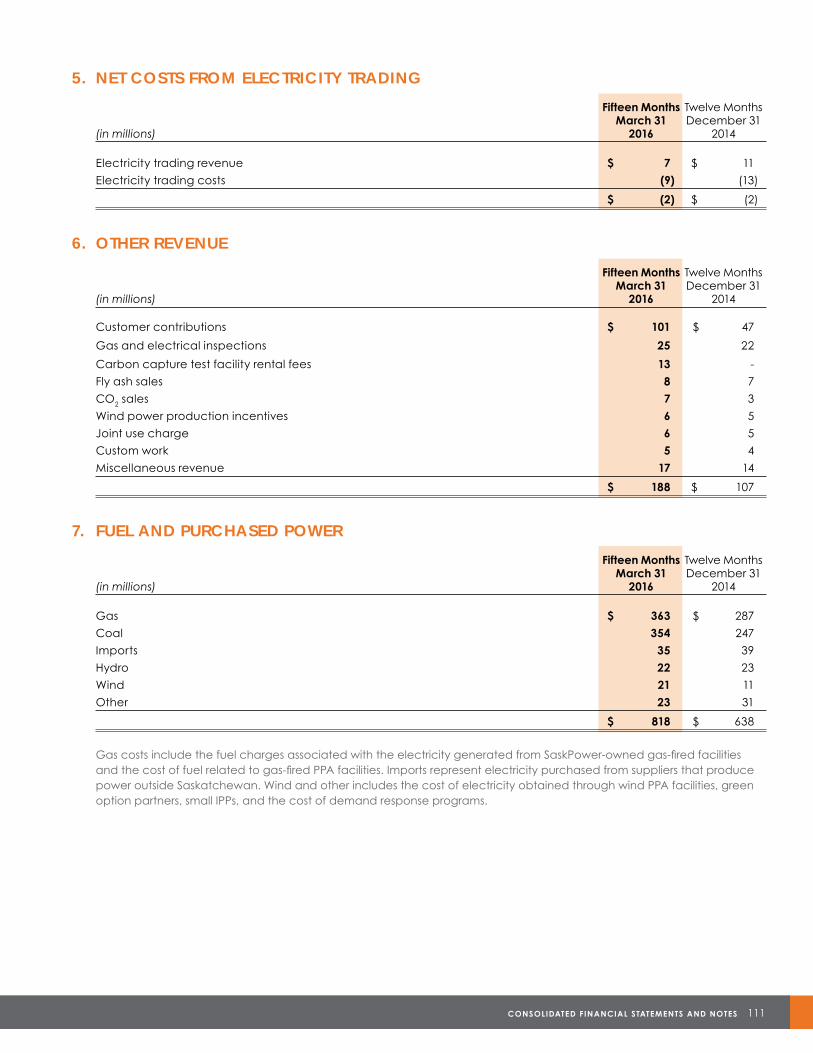
CONSOLIDATED FINANCIAL STATEMENTS AND NOTES 111
5. NET COSTS FROM ELECTRICITY TRADING
Fifteen Months Twelve MonthsMarch 31 December 31
(in millions) 2016 2014
Electricity trading revenue $ 7 $ 11
Electricity trading costs (9) (13)
$ (2) $ (2)
6. OTHER REVENUE
Fifteen Months Twelve MonthsMarch 31 December 31
(in millions) 2016 2014
Customer contributions $ 101 $ 47
Gas and electrical inspections 25 22
Carbon capture test facility rental fees 13 -
Fly ash sales 8 7
CO2 sales 7 3
Wind power production incentives 6 5
Joint use charge 6 5
Custom work 5 4
Miscellaneous revenue 17 14
$ 188 $ 107
7. FUEL AND PURCHASED POWER
Fifteen Months Twelve MonthsMarch 31 December 31
(in millions) 2016 2014
Gas $ 363 $ 287
Coal 354 247
Imports 35 39
Hydro 22 23
Wind 21 11
Other 23 31
$ 818 $ 638
Gas costs include the fuel charges associated with the electricity generated from SaskPower-owned gas-fired facilities and the cost of fuel related to gas-fired PPA facilities. Imports represent electricity purchased from suppliers that produce power outside Saskatchewan. Wind and other includes the cost of electricity obtained through wind PPA facilities, green option partners, small IPPs, and the cost of demand response programs.
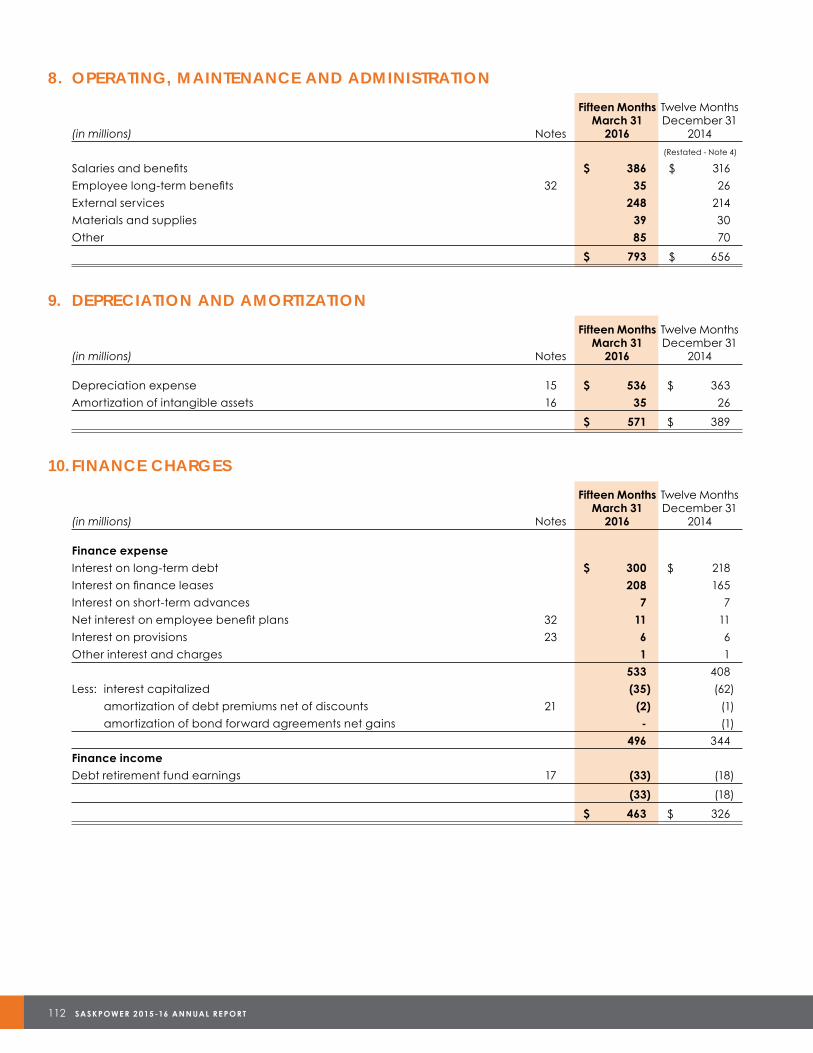
112 SASKPOWE R 2 015 -16 ANNUAL RE PORT
8. OPERATING, MAINTENANCE AND ADMINISTRATION
Fifteen Months Twelve MonthsMarch 31 December 31
(in millions) Notes 2016 2014
(Restated - Note 4)
Salaries and benefits $ 386 $ 316
Employee long-term benefits 32 35 26
External services 248 214
Materials and supplies 39 30
Other 85 70
$ 793 $ 656
9. DEPRECIATION AND AMORTIZATION
Fifteen Months Twelve MonthsMarch 31 December 31
(in millions) Notes 2016 2014
Depreciation expense 15 $ 536 $ 363
Amortization of intangible assets 16 35 26
$ 571 $ 389
10. FINANCE CHARGES
Fifteen Months Twelve MonthsMarch 31 December 31
(in millions) Notes 2016 2014
Finance expense
Interest on long-term debt $ 300 $ 218
Interest on finance leases 208 165
Interest on short-term advances 7 7
Net interest on employee benefit plans 32 11 11
Interest on provisions 23 6 6
Other interest and charges 1 1
533 408
Less: interest capitalized (35) (62)
amortization of debt premiums net of discounts 21 (2) (1)
amortization of bond forward agreements net gains - (1)
496 344
Finance income
Debt retirement fund earnings 17 (33) (18)
(33) (18)
$ 463 $ 326
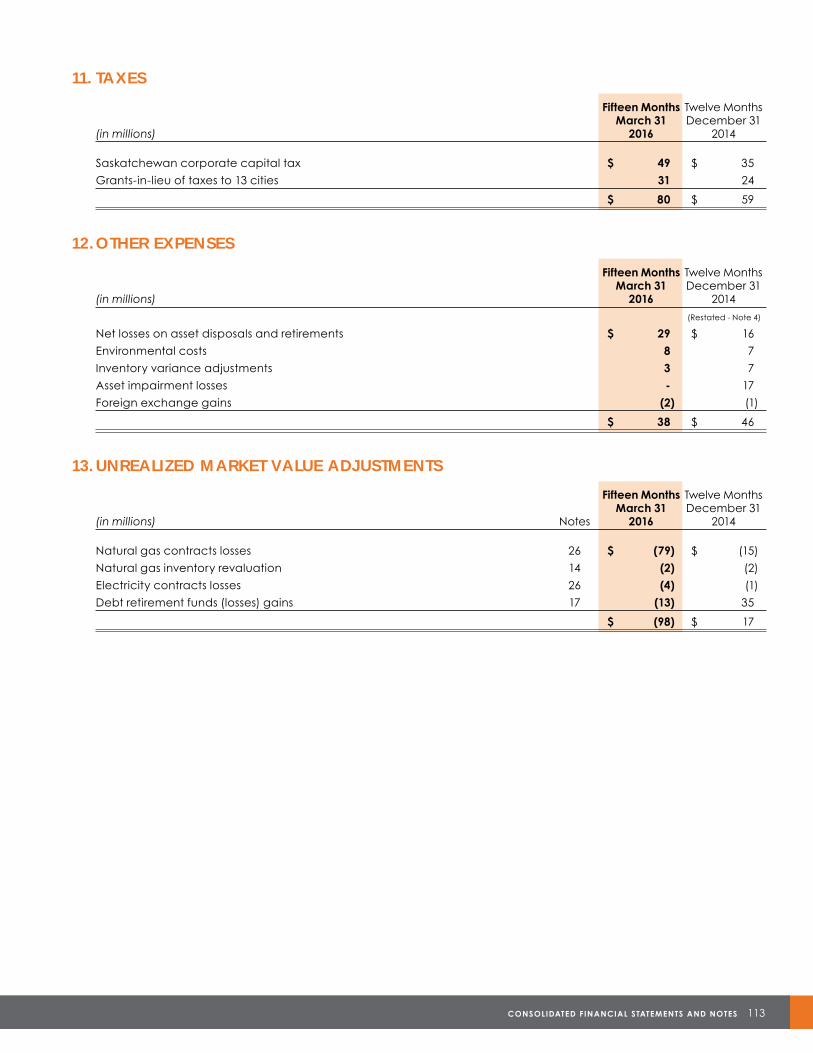
CONSOLIDATED FINANCIAL STATEMENTS AND NOTES 113
11. TAXES
Fifteen Months Twelve Months March 31 December 31(in millions) 2016 2014
Saskatchewan corporate capital tax $ 49 $ 35
Grants-in-lieu of taxes to 13 cities 31 24
$ 80 $ 59
12. OTHER EXPENSES
Fifteen Months Twelve Months March 31 December 31(in millions) 2016 2014
(Restated - Note 4)
Net losses on asset disposals and retirements $ 29 $ 16
Environmental costs 8 7
Inventory variance adjustments 3 7
Asset impairment losses - 17
Foreign exchange gains (2) (1)
$ 38 $ 46
13. UNREALIZED MARKET VALUE ADJUSTMENTS
Fifteen Months Twelve Months March 31 December 31(in millions) Notes 2016 2014
Natural gas contracts losses 26 $ (79) $ (15)
Natural gas inventory revaluation 14 (2) (2)
Electricity contracts losses 26 (4) (1)
Debt retirement funds (losses) gains 17 (13) 35
$ (98) $ 17
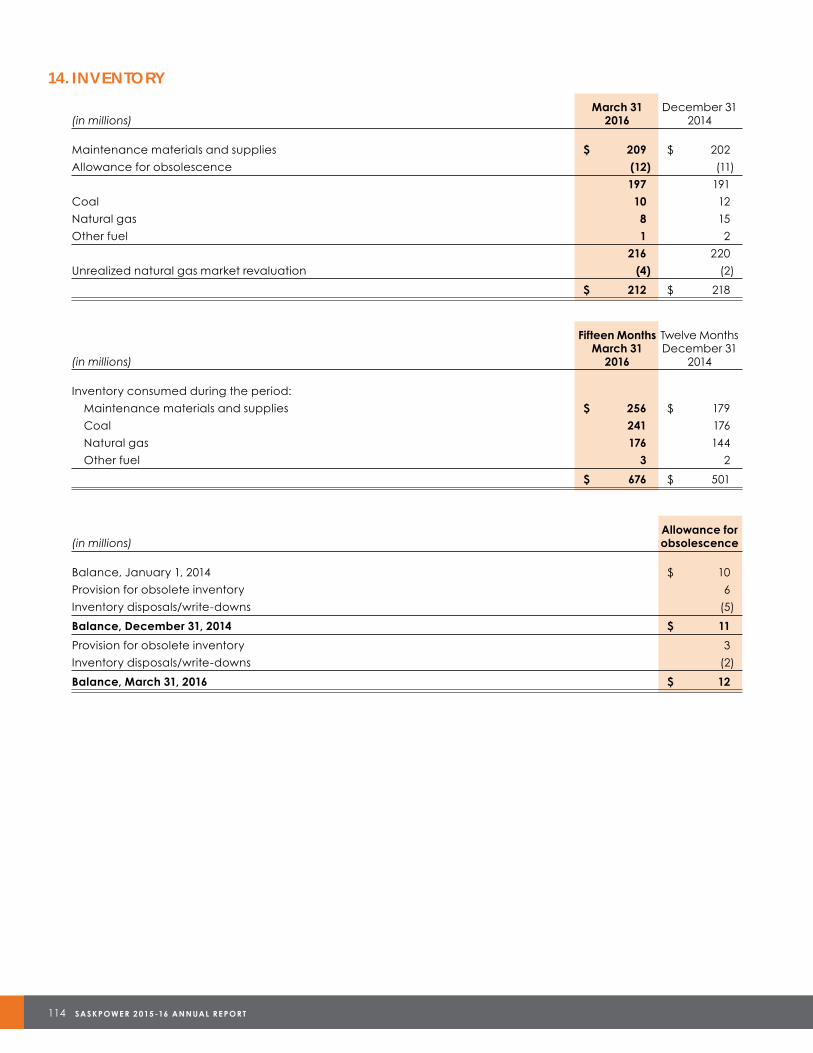
114 SASKPOWE R 2 015 -16 ANNUAL RE PORT
14. INVENTORY
March 31 December 31(in millions) 2016 2014
Maintenance materials and supplies $ 209 $ 202
Allowance for obsolescence (12) (11)
197 191
Coal 10 12
Natural gas 8 15
Other fuel 1 2
216 220
Unrealized natural gas market revaluation (4) (2)
$ 212 $ 218
Fifteen Months Twelve MonthsMarch 31 December 31
(in millions) 2016 2014
Inventory consumed during the period:
Maintenance materials and supplies $ 256 $ 179
Coal 241 176
Natural gas 176 144
Other fuel 3 2
$ 676 $ 501
Allowance for(in millions) obsolescence
Balance, January 1, 2014 $ 10
Provision for obsolete inventory 6
Inventory disposals/write-downs (5)
Balance, December 31, 2014 $ 11
Provision for obsolete inventory 3
Inventory disposals/write-downs (2)
Balance, March 31, 2016 $ 12
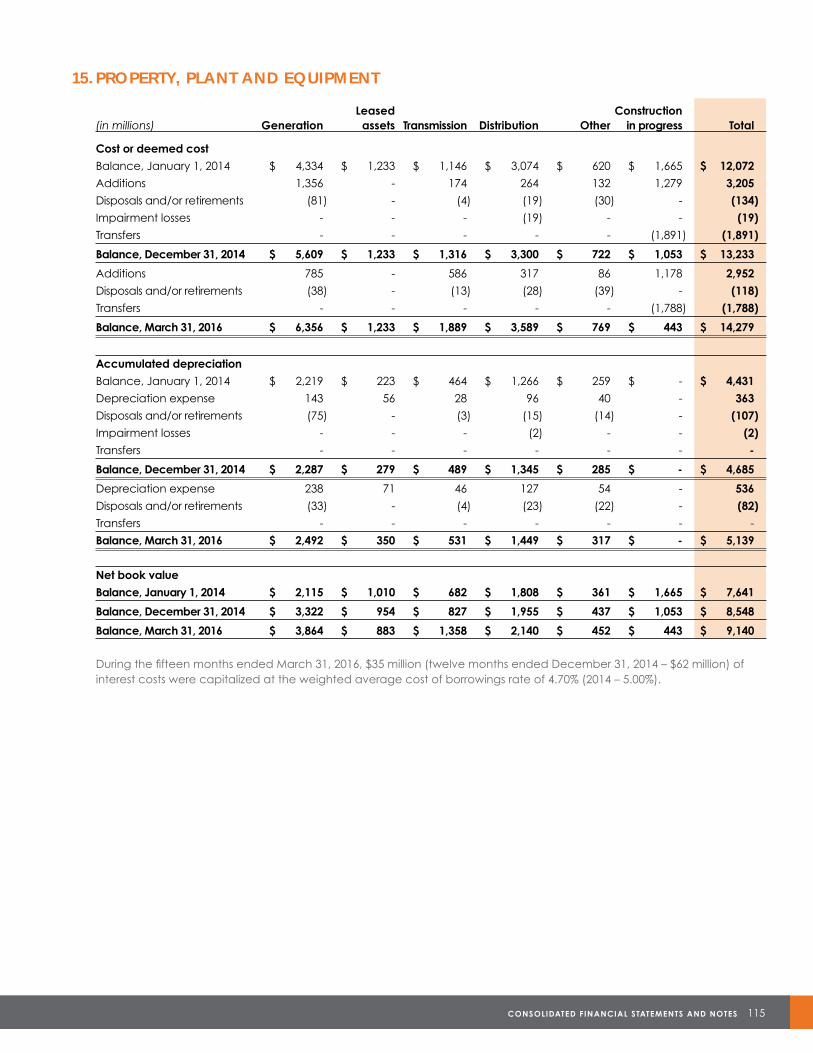
CONSOLIDATED FINANCIAL STATEMENTS AND NOTES 115
15. PROPERTY, PLANT AND EQUIPMENT
Leased Construction (in millions) Generation assets Transmission Distribution Other in progress Total
Cost or deemed cost
Balance, January 1, 2014 $ 4,334 $ 1,233 $ 1,146 $ 3,074 $ 620 $ 1,665 $ 12,072
Additions 1,356 - 174 264 132 1,279 3,205
Disposals and/or retirements (81) - (4) (19) (30) - (134)
Impairment losses - - - (19) - - (19)
Transfers - - - - - (1,891) (1,891)
Balance, December 31, 2014 $ 5,609 $ 1,233 $ 1,316 $ 3,300 $ 722 $ 1,053 $ 13,233
Additions 785 - 586 317 86 1,178 2,952
Disposals and/or retirements (38) - (13) (28) (39) - (118)
Transfers - - - - - (1,788) (1,788)
Balance, March 31, 2016 $ 6,356 $ 1,233 $ 1,889 $ 3,589 $ 769 $ 443 $ 14,279
Accumulated depreciation
Balance, January 1, 2014 $ 2,219 $ 223 $ 464 $ 1,266 $ 259 $ - $ 4,431
Depreciation expense 143 56 28 96 40 - 363
Disposals and/or retirements (75) - (3) (15) (14) - (107)
Impairment losses - - - (2) - - (2)
Transfers - - - - - - -
Balance, December 31, 2014 $ 2,287 $ 279 $ 489 $ 1,345 $ 285 $ - $ 4,685
Depreciation expense 238 71 46 127 54 - 536
Disposals and/or retirements (33) - (4) (23) (22) - (82)
Transfers - - - - - - -
Balance, March 31, 2016 $ 2,492 $ 350 $ 531 $ 1,449 $ 317 $ - $ 5,139
Net book value
Balance, January 1, 2014 $ 2,115 $ 1,010 $ 682 $ 1,808 $ 361 $ 1,665 $ 7,641
Balance, December 31, 2014 $ 3,322 $ 954 $ 827 $ 1,955 $ 437 $ 1,053 $ 8,548
Balance, March 31, 2016 $ 3,864 $ 883 $ 1,358 $ 2,140 $ 452 $ 443 $ 9,140
During the fifteen months ended March 31, 2016, $35 million (twelve months ended December 31, 2014 – $62 million) of interest costs were capitalized at the weighted average cost of borrowings rate of 4.70% (2014 – 5.00%).
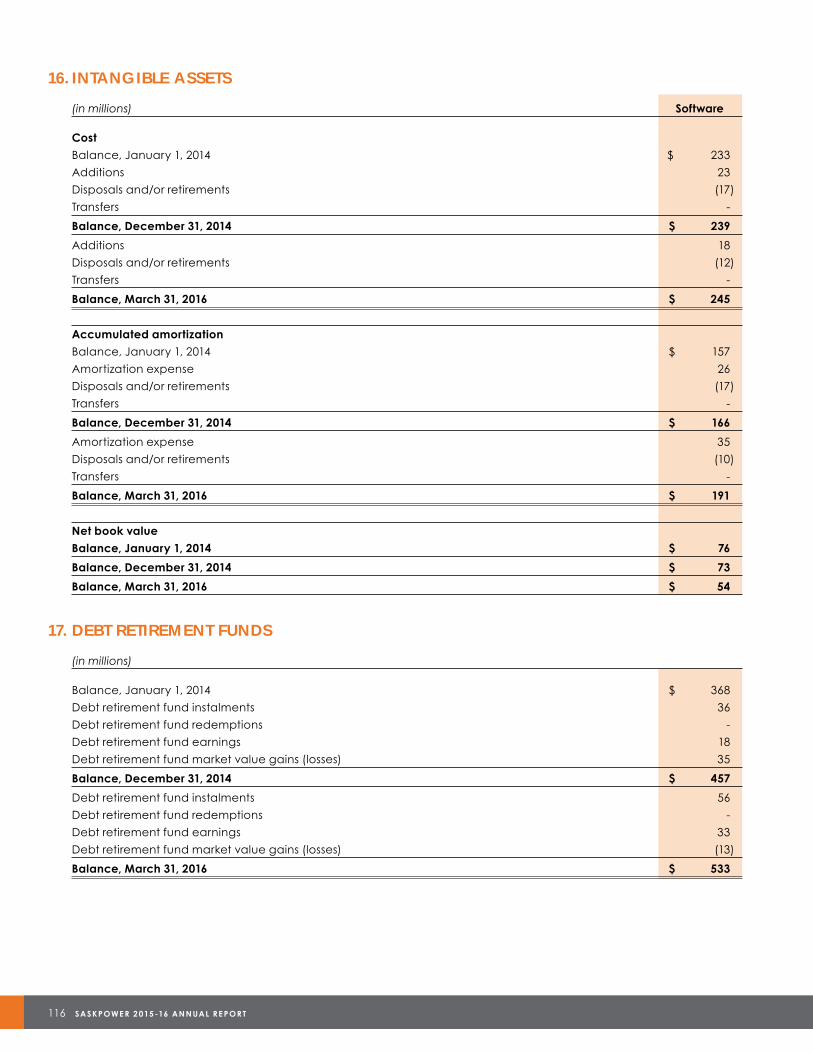
116 SASKPOWE R 2 015 -16 ANNUAL RE PORT
16. INTANGIBLE ASSETS
(in millions) Software
Cost
Balance, January 1, 2014 $ 233
Additions 23
Disposals and/or retirements (17)
Transfers -
Balance, December 31, 2014 $ 239
Additions 18
Disposals and/or retirements (12)
Transfers -
Balance, March 31, 2016 $ 245
Accumulated amortization
Balance, January 1, 2014 $ 157
Amortization expense 26
Disposals and/or retirements (17)
Transfers -
Balance, December 31, 2014 $ 166
Amortization expense 35
Disposals and/or retirements (10)
Transfers -
Balance, March 31, 2016 $ 191
Net book value
Balance, January 1, 2014 $ 76
Balance, December 31, 2014 $ 73
Balance, March 31, 2016 $ 54
17. DEBT RETIREMENT FUNDS
(in millions)
Balance, January 1, 2014 $ 368
Debt retirement fund instalments 36
Debt retirement fund redemptions -
Debt retirement fund earnings 18
Debt retirement fund market value gains (losses) 35
Balance, December 31, 2014 $ 457
Debt retirement fund instalments 56
Debt retirement fund redemptions -
Debt retirement fund earnings 33
Debt retirement fund market value gains (losses) (13)
Balance, March 31, 2016 $ 533
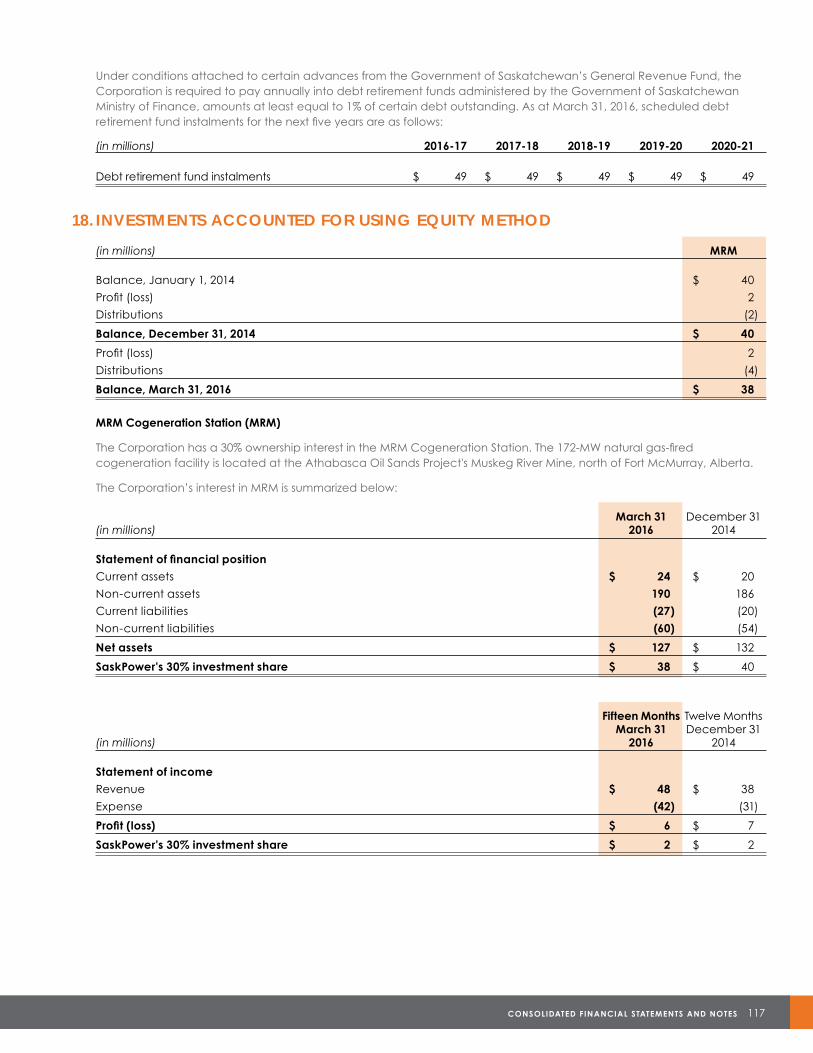
CONSOLIDATED FINANCIAL STATEMENTS AND NOTES 117
Under conditions attached to certain advances from the Government of Saskatchewan’s General Revenue Fund, the Corporation is required to pay annually into debt retirement funds administered by the Government of Saskatchewan Ministry of Finance, amounts at least equal to 1% of certain debt outstanding. As at March 31, 2016, scheduled debt retirement fund instalments for the next five years are as follows:
(in millions) 2016-17 2017-18 2018-19 2019-20 2020-21
Debt retirement fund instalments $ 49 $ 49 $ 49 $ 49 $ 49
18. INVESTMENTS ACCOUNTED FOR USING EQUITY METHOD
(in millions) MRM
Balance, January 1, 2014 $ 40
Profit (loss) 2
Distributions (2)
Balance, December 31, 2014 $ 40
Profit (loss) 2
Distributions (4)
Balance, March 31, 2016 $ 38
MRM Cogeneration Station (MRM)
The Corporation has a 30% ownership interest in the MRM Cogeneration Station. The 172-MW natural gas-fired cogeneration facility is located at the Athabasca Oil Sands Project's Muskeg River Mine, north of Fort McMurray, Alberta.
The Corporation’s interest in MRM is summarized below:
March 31 December 31(in millions) 2016 2014
Statement of financial position
Current assets $ 24 $ 20
Non-current assets 190 186
Current liabilities (27) (20)
Non-current liabilities (60) (54)
Net assets $ 127 $ 132
SaskPower's 30% investment share $ 38 $ 40
Fifteen Months Twelve Months March 31 December 31(in millions) 2016 2014
Statement of income
Revenue $ 48 $ 38
Expense (42) (31)
Profit (loss) $ 6 $ 7
SaskPower's 30% investment share $ 2 $ 2
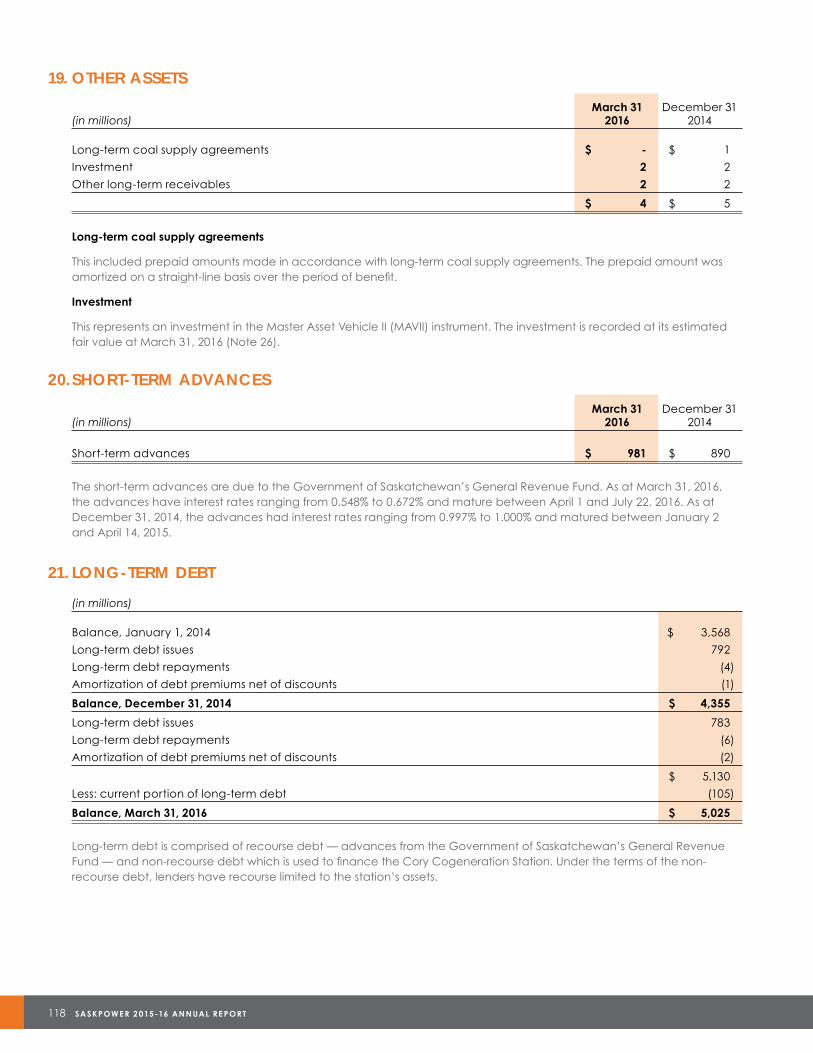
118 SASKPOWE R 2 015 -16 ANNUAL RE PORT
19. OTHER ASSETS
March 31 December 31(in millions) 2016 2014
Long-term coal supply agreements $ - $ 1
Investment 2 2
Other long-term receivables 2 2
$ 4 $ 5
Long-term coal supply agreements
This included prepaid amounts made in accordance with long-term coal supply agreements. The prepaid amount was amortized on a straight-line basis over the period of benefit.
Investment
This represents an investment in the Master Asset Vehicle II (MAVII) instrument. The investment is recorded at its estimated fair value at March 31, 2016 (Note 26).
20. SHORT-TERM ADVANCES
March 31 December 31(in millions) 2016 2014
Short-term advances $ 981 $ 890
The short-term advances are due to the Government of Saskatchewan’s General Revenue Fund. As at March 31, 2016, the advances have interest rates ranging from 0.548% to 0.672% and mature between April 1 and July 22, 2016. As at December 31, 2014, the advances had interest rates ranging from 0.997% to 1.000% and matured between January 2 and April 14, 2015.
21. LONG-TERM DEBT
(in millions)
Balance, January 1, 2014 $ 3,568
Long-term debt issues 792
Long-term debt repayments (4)
Amortization of debt premiums net of discounts (1)
Balance, December 31, 2014 $ 4,355
Long-term debt issues 783
Long-term debt repayments (6)
Amortization of debt premiums net of discounts (2)
$ 5,130
Less: current portion of long-term debt (105)
Balance, March 31, 2016 $ 5,025
Long-term debt is comprised of recourse debt — advances from the Government of Saskatchewan’s General Revenue Fund — and non-recourse debt which is used to finance the Cory Cogeneration Station. Under the terms of the non-recourse debt, lenders have recourse limited to the station’s assets.
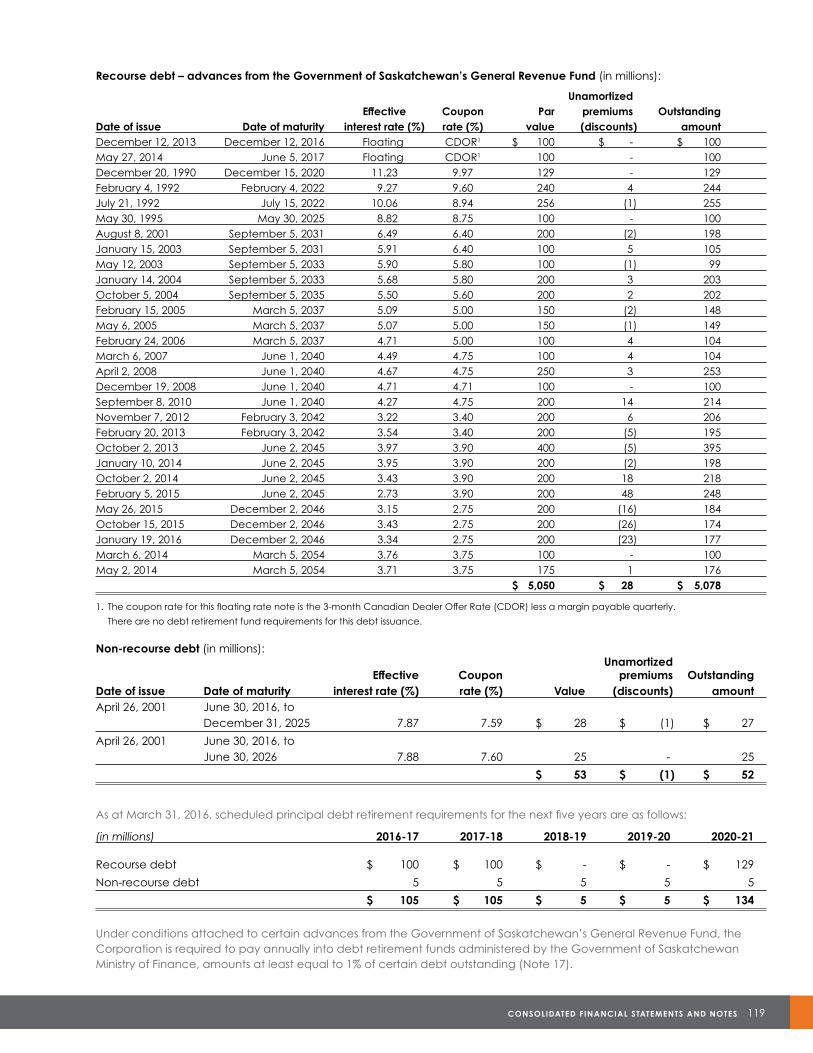
CONSOLIDATED FINANCIAL STATEMENTS AND NOTES 119
Recourse debt – advances from the Government of Saskatchewan’s General Revenue Fund (in millions):
Unamortized Effective Coupon Par premiums Outstanding
Date of issue Date of maturity interest rate (%) rate (%) value (discounts) amountDecember 12, 2013 December 12, 2016 Floating CDOR1 $ 100 $ - $ 100 May 27, 2014 June 5, 2017 Floating CDOR1 100 - 100December 20, 1990 December 15, 2020 11.23 9.97 129 - 129February 4, 1992 February 4, 2022 9.27 9.60 240 4 244 July 21, 1992 July 15, 2022 10.06 8.94 256 (1) 255May 30, 1995 May 30, 2025 8.82 8.75 100 - 100August 8, 2001 September 5, 2031 6.49 6.40 200 (2) 198January 15, 2003 September 5, 2031 5.91 6.40 100 5 105 May 12, 2003 September 5, 2033 5.90 5.80 100 (1) 99January 14, 2004 September 5, 2033 5.68 5.80 200 3 203 October 5, 2004 September 5, 2035 5.50 5.60 200 2 202 February 15, 2005 March 5, 2037 5.09 5.00 150 (2) 148May 6, 2005 March 5, 2037 5.07 5.00 150 (1) 149February 24, 2006 March 5, 2037 4.71 5.00 100 4 104 March 6, 2007 June 1, 2040 4.49 4.75 100 4 104 April 2, 2008 June 1, 2040 4.67 4.75 250 3 253 December 19, 2008 June 1, 2040 4.71 4.71 100 - 100September 8, 2010 June 1, 2040 4.27 4.75 200 14 214 November 7, 2012 February 3, 2042 3.22 3.40 200 6 206 February 20, 2013 February 3, 2042 3.54 3.40 200 (5) 195October 2, 2013 June 2, 2045 3.97 3.90 400 (5) 395January 10, 2014 June 2, 2045 3.95 3.90 200 (2) 198October 2, 2014 June 2, 2045 3.43 3.90 200 18 218 February 5, 2015 June 2, 2045 2.73 3.90 200 48 248 May 26, 2015 December 2, 2046 3.15 2.75 200 (16) 184October 15, 2015 December 2, 2046 3.43 2.75 200 (26) 174January 19, 2016 December 2, 2046 3.34 2.75 200 (23) 177March 6, 2014 March 5, 2054 3.76 3.75 100 - 100May 2, 2014 March 5, 2054 3.71 3.75 175 1 176
$ 5,050 $ 28 $ 5,078
1. The coupon rate for this floating rate note is the 3-month Canadian Dealer Offer Rate (CDOR) less a margin payable quarterly.
There are no debt retirement fund requirements for this debt issuance.
Non-recourse debt (in millions): Unamortized
Effective Coupon premiums Outstanding Date of issue Date of maturity interest rate (%) rate (%) Value (discounts) amountApril 26, 2001 June 30, 2016, to
December 31, 2025 7.87 7.59 $ 28 $ (1) $ 27
April 26, 2001 June 30, 2016, to June 30, 2026 7.88 7.60 25 - 25
$ 53 $ (1) $ 52
As at March 31, 2016, scheduled principal debt retirement requirements for the next five years are as follows:
(in millions) 2016-17 2017-18 2018-19 2019-20 2020-21
Recourse debt $ 100 $ 100 $ - $ - $ 129
Non-recourse debt 5 5 5 5 5
$ 105 $ 105 $ 5 $ 5 $ 134
Under conditions attached to certain advances from the Government of Saskatchewan’s General Revenue Fund, the Corporation is required to pay annually into debt retirement funds administered by the Government of Saskatchewan Ministry of Finance, amounts at least equal to 1% of certain debt outstanding (Note 17).
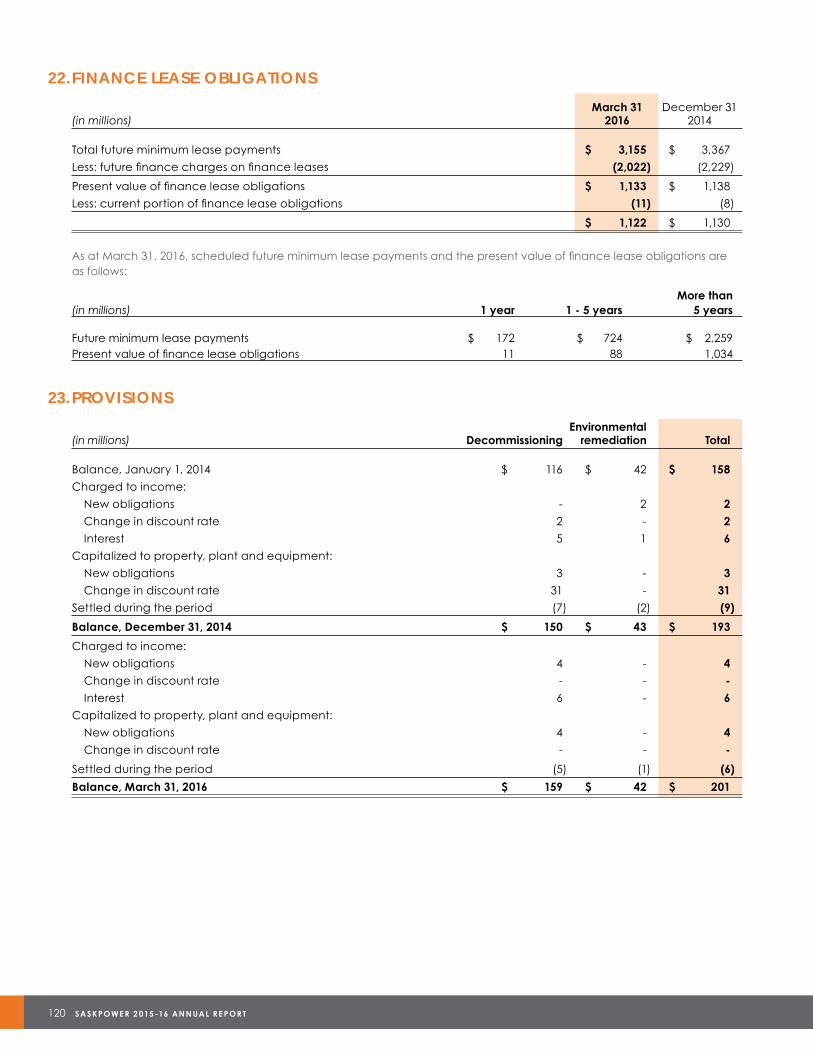
120 SASKPOWE R 2 015 -16 ANNUAL RE PORT
22. FINANCE LEASE OBLIGATIONS
March 31 December 31(in millions) 2016 2014
Total future minimum lease payments $ 3,155 $ 3,367
Less: future finance charges on finance leases (2,022) (2,229)
Present value of finance lease obligations $ 1,133 $ 1,138
Less: current portion of finance lease obligations (11) (8)
$ 1,122 $ 1,130
As at March 31, 2016, scheduled future minimum lease payments and the present value of finance lease obligations are as follows:
More than (in millions) 1 year 1 - 5 years 5 years
Future minimum lease payments $ 172 $ 724 $ 2,259Present value of finance lease obligations 11 88 1,034
23. PROVISIONS
Environmental(in millions) Decommissioning remediation Total
Balance, January 1, 2014 $ 116 $ 42 $ 158
Charged to income:
New obligations - 2 2
Change in discount rate 2 - 2
Interest 5 1 6
Capitalized to property, plant and equipment:
New obligations 3 - 3
Change in discount rate 31 - 31
Settled during the period (7) (2) (9)
Balance, December 31, 2014 $ 150 $ 43 $ 193
Charged to income:
New obligations 4 - 4
Change in discount rate - - -
Interest 6 - 6
Capitalized to property, plant and equipment:
New obligations 4 - 4
Change in discount rate - - -
Settled during the period (5) (1) (6)
Balance, March 31, 2016 $ 159 $ 42 $ 201
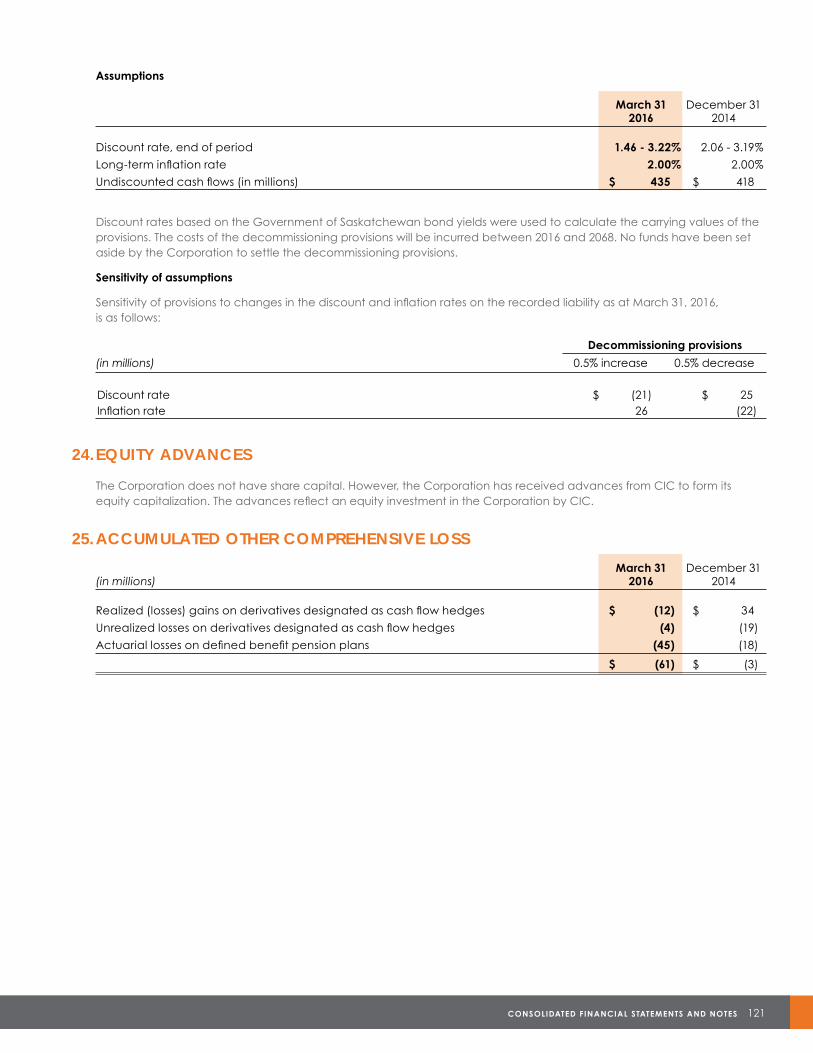
CONSOLIDATED FINANCIAL STATEMENTS AND NOTES 121
Assumptions
March 31 December 31 2016 2014
Discount rate, end of period 1.46 - 3.22% 2.06 - 3.19%
Long-term inflation rate 2.00% 2.00%
Undiscounted cash flows (in millions) $ 435 $ 418
Discount rates based on the Government of Saskatchewan bond yields were used to calculate the carrying values of the provisions. The costs of the decommissioning provisions will be incurred between 2016 and 2068. No funds have been set aside by the Corporation to settle the decommissioning provisions.
Sensitivity of assumptions
Sensitivity of provisions to changes in the discount and inflation rates on the recorded liability as at March 31, 2016, is as follows:
Decommissioning provisions
(in millions) 0.5% increase 0.5% decrease
Discount rate $ (21) $ 25Inflation rate 26 (22)
24. EQUITY ADVANCES
The Corporation does not have share capital. However, the Corporation has received advances from CIC to form its equity capitalization. The advances reflect an equity investment in the Corporation by CIC.
25. ACCUMULATED OTHER COMPREHENSIVE LOSS
March 31 December 31(in millions) 2016 2014
Realized (losses) gains on derivatives designated as cash flow hedges $ (12) $ 34
Unrealized losses on derivatives designated as cash flow hedges (4) (19)
Actuarial losses on defined benefit pension plans (45) (18)
$ (61) $ (3)
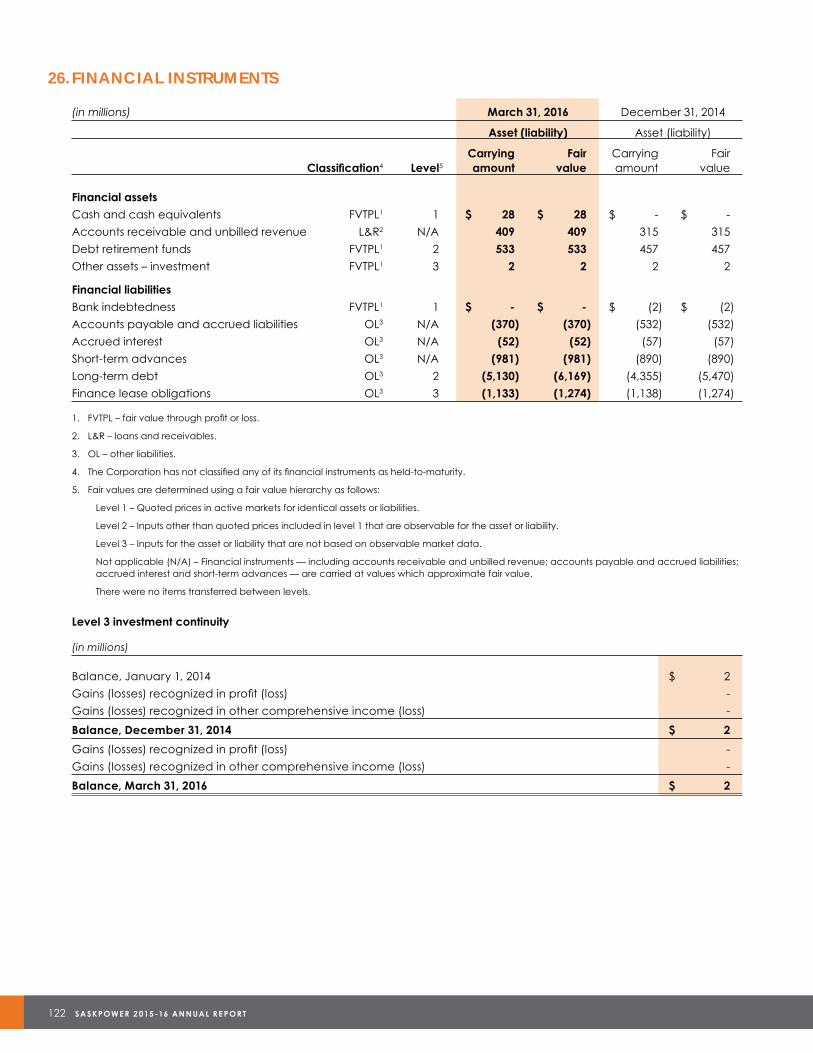
122 SASKPOWE R 2 015 -16 ANNUAL RE PORT
26. FINANCIAL INSTRUMENTS
(in millions) March 31, 2016 December 31, 2014
Asset (liability) Asset (liability)
Carrying Fair Carrying Fair Classification4 Level5 amount value amount value
Financial assets
Cash and cash equivalents FVTPL1 1 $ 28 $ 28 $ - $ -
Accounts receivable and unbilled revenue L&R2 N/A 409 409 315 315
Debt retirement funds FVTPL1 2 533 533 457 457
Other assets – investment FVTPL1 3 2 2 2 2
Financial liabilities
Bank indebtedness FVTPL1 1 $ - $ - $ (2) $ (2)
Accounts payable and accrued liabilities OL3 N/A (370) (370) (532) (532)
Accrued interest OL3 N/A (52) (52) (57) (57)
Short-term advances OL3 N/A (981) (981) (890) (890)
Long-term debt OL3 2 (5,130) (6,169) (4,355) (5,470)
Finance lease obligations OL3 3 (1,133) (1,274) (1,138) (1,274)
1. FVTPL – fair value through profit or loss.
2. L&R – loans and receivables.
3. OL – other liabilities.
4. The Corporation has not classified any of its financial instruments as held-to-maturity.
5. Fair values are determined using a fair value hierarchy as follows:
Level 1 – Quoted prices in active markets for identical assets or liabilities.
Level 2 – Inputs other than quoted prices included in level 1 that are observable for the asset or liability.
Level 3 – Inputs for the asset or liability that are not based on observable market data.
Not applicable (N/A) – Financial instruments — including accounts receivable and unbilled revenue; accounts payable and accrued liabilities; accrued interest and short-term advances — are carried at values which approximate fair value.
There were no items transferred between levels.
Level 3 investment continuity
(in millions)
Balance, January 1, 2014 $ 2
Gains (losses) recognized in profit (loss) -
Gains (losses) recognized in other comprehensive income (loss) -
Balance, December 31, 2014 $ 2
Gains (losses) recognized in profit (loss) -
Gains (losses) recognized in other comprehensive income (loss) -
Balance, March 31, 2016 $ 2
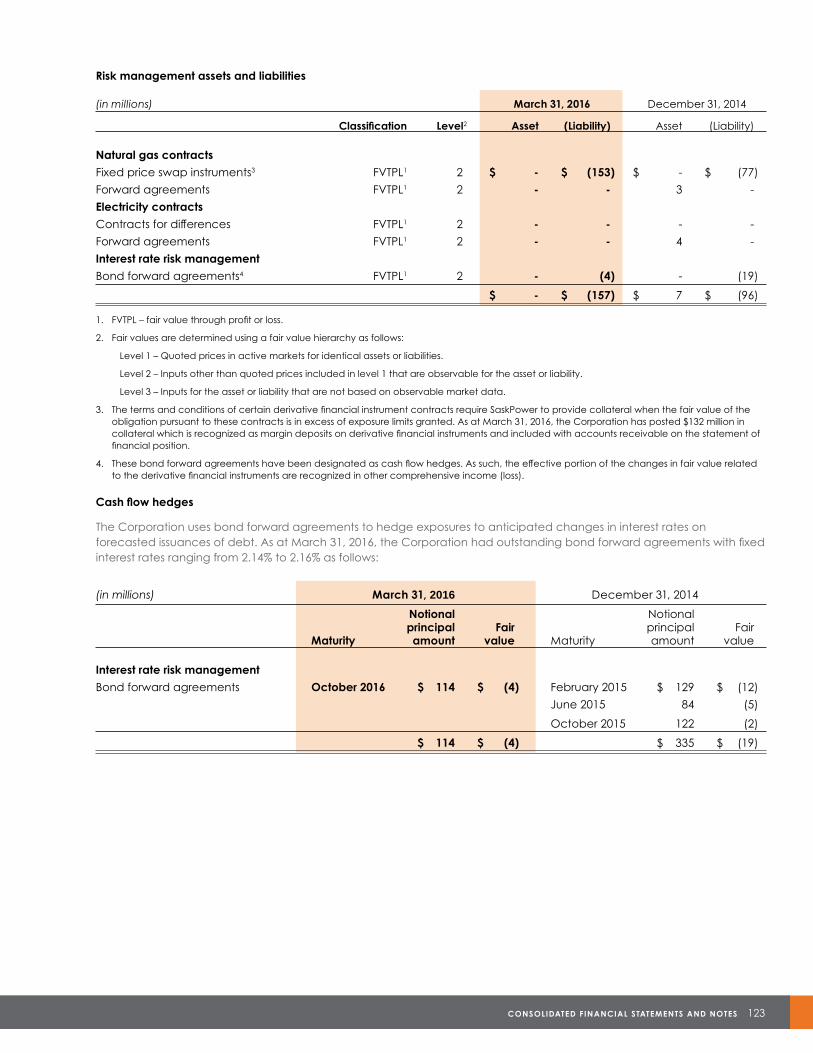
CONSOLIDATED FINANCIAL STATEMENTS AND NOTES 123
Risk management assets and liabilities
(in millions) March 31, 2016 December 31, 2014
Classification Level2 Asset (Liability) Asset (Liability)
Natural gas contracts
Fixed price swap instruments3 FVTPL1 2 $ - $ (153) $ - $ (77)
Forward agreements FVTPL1 2 - - 3 -
Electricity contracts
Contracts for differences FVTPL1 2 - - - -
Forward agreements FVTPL1 2 - - 4 -
Interest rate risk management
Bond forward agreements4 FVTPL1 2 - (4) - (19)
$ - $ (157) $ 7 $ (96)
1. FVTPL – fair value through profit or loss.
2. Fair values are determined using a fair value hierarchy as follows:
Level 1 – Quoted prices in active markets for identical assets or liabilities.
Level 2 – Inputs other than quoted prices included in level 1 that are observable for the asset or liability.
Level 3 – Inputs for the asset or liability that are not based on observable market data.
3. The terms and conditions of certain derivative financial instrument contracts require SaskPower to provide collateral when the fair value of the obligation pursuant to these contracts is in excess of exposure limits granted. As at March 31, 2016, the Corporation has posted $132 million in collateral which is recognized as margin deposits on derivative financial instruments and included with accounts receivable on the statement of financial position.
4. These bond forward agreements have been designated as cash flow hedges. As such, the effective portion of the changes in fair value related to the derivative financial instruments are recognized in other comprehensive income (loss).
Cash flow hedges
The Corporation uses bond forward agreements to hedge exposures to anticipated changes in interest rates on forecasted issuances of debt. As at March 31, 2016, the Corporation had outstanding bond forward agreements with fixed interest rates ranging from 2.14% to 2.16% as follows:
(in millions) March 31, 2016 December 31, 2014
Notional Notional principal Fair principal Fair Maturity amount value Maturity amount value
Interest rate risk management
Bond forward agreements October 2016 $ 114 $ (4) February 2015 $ 129 $ (12)
June 2015 84 (5)
October 2015 122 (2)
$ 114 $ (4) $ 335 $ (19)
124 SASKPOWE R 2 015 -16 ANNUAL RE PORT
27. FINANCIAL RISK MANAGEMENT
Market risk
By virtue of its operations, the Corporation is exposed to changes in commodity prices, interest rates and foreignexchange rates. SaskPower may utilize derivative financial instruments to manage these exposures. The Corporationmitigates risk associated with derivative financial instruments through Board-approved policies, limits on use and amountof exposure, internal monitoring and compliance reporting to senior management and the Board.
(a) Commodity prices
Natural gas contracts The Corporation is exposed to natural gas price risk through natural gas purchased for its natural gas-fired powerplants and through certain PPAs that have a cost component based on the market price of natural gas. As atMarch 31, 2016, the Corporation had entered into financial and physical natural gas contracts to price manageapproximately 74% of its budgeted natural gas purchases for 2016-17, 65% for 2017-18, 56% for 2018-19, 50% for2019-20, 29% for 2020-21, 26% for 2021-22, 20% for 2022-23, 14% for 2023-24, 9% for 2024-25, and 3% for 2025-26.
Based on the Corporation's March 31, 2016, closing positions on its financial natural gas hedges, a one dollar pergigajoule (GJ) increase in the price of natural gas would have resulted in a $114 million improvement in the unrealizedmarket value adjustments recognized in profit or loss for the period. This sensitivity analysis does not represent theunderlying exposure to changes in the price of natural gas on the remaining forecasted natural gas purchases whichare unhedged as at March 31, 2016.
Electricity trading contracts The Corporation is also exposed to electricity price risk on its electricity trading activities. Electricity trading risks aremanaged through limits on the size and duration of transactions and open positions, including Value at Risk (VaR)limits. VaR is a commonly used metric employed to track and manage the market risk associated with tradingpositions. A VaR measure gives, for a specific confidence level, an estimated potential loss that could be incurred overa specified period of time. VaR is used to determine the potential change in value of the proprietary trading portfolio,over a 10-day period within a 95% confidence level, resulting from normal market fluctuations. VaR is estimated usingthe historical variance/covariance approach.
VaR has certain inherent limitations. The use of historical information in the estimate assumes that price movements inthe past will be indicative of future market risk. As such, it may be only meaningful under normal market conditions.Extreme market events are not addressed by this risk measure. In addition, the use of a 10-day measurement periodimplies that positions can be unwound or hedged within that period. However, this may not be possible if the marketbecomes illiquid. SaskPower recognizes the limitations of VaR and actively uses other controls, including restrictionson authorized instruments, volumetric and term limits, stress-testing of individual portfolios and of the total proprietarytrading portfolio and management review. As at March 31, 2016, the VaR associated with electricity trading activitieswas nil.
(b) Interest rates
Short- and long-term borrowings The Corporation is exposed to interest rate risk on the Corporation’s short-term variable interest rate debt.As at March 31, 2016, SaskPower had $981 million in short-term advances as well as $200 million of floating rate long-term debt outstanding. The Corporation is also exposed to interest rate risk arising from fluctuations in interest rateson future short-term and long-term borrowings. Interest rate risk on these expected future borrowings is managed byhaving an appropriate mix of fixed and floating rate debt. The expected borrowings in fiscal 2017 are $500 million, ofwhich $100 million is short-term. The Corporation has entered into bond forward agreements of $114 million to hedgeexposures to anticipated changes in interest rates on forecasted issuances of long-term debt in 2016-17.
The Corporation expects to have an average balance of $1.1 billion in short-term advances outstanding throughoutfiscal 2017. If interest rates were to increase by 100 basis points, this would result in approximately an $11 millionincrease in finance charges related to this short-term variable interest rate debt.
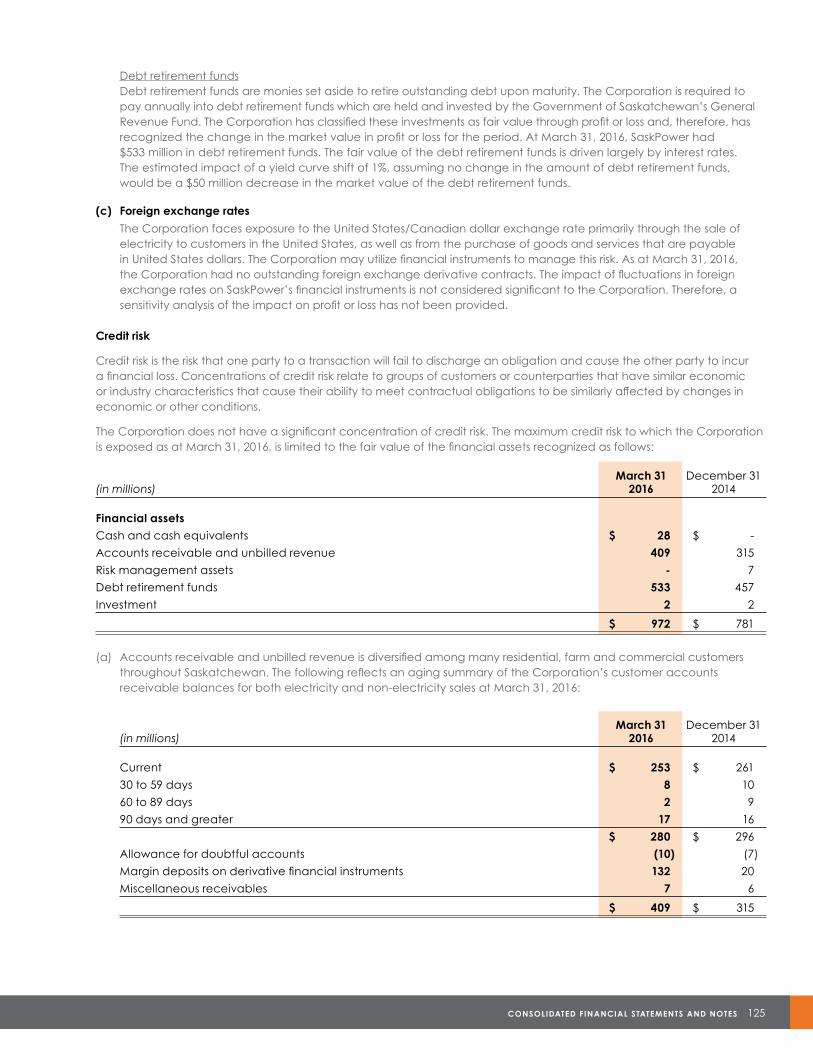
CONSOLIDATED FINANCIAL STATEMENTS AND NOTES 125
Debt retirement funds Debt retirement funds are monies set aside to retire outstanding debt upon maturity. The Corporation is required to pay annually into debt retirement funds which are held and invested by the Government of Saskatchewan’s General Revenue Fund. The Corporation has classified these investments as fair value through profit or loss and, therefore, has recognized the change in the market value in profit or loss for the period. At March 31, 2016, SaskPower had $533 million in debt retirement funds. The fair value of the debt retirement funds is driven largely by interest rates. The estimated impact of a yield curve shift of 1%, assuming no change in the amount of debt retirement funds, would be a $50 million decrease in the market value of the debt retirement funds.
(c) Foreign exchange rates
The Corporation faces exposure to the United States/Canadian dollar exchange rate primarily through the sale ofelectricity to customers in the United States, as well as from the purchase of goods and services that are payablein United States dollars. The Corporation may utilize financial instruments to manage this risk. As at March 31, 2016,the Corporation had no outstanding foreign exchange derivative contracts. The impact of fluctuations in foreignexchange rates on SaskPower’s financial instruments is not considered significant to the Corporation. Therefore, asensitivity analysis of the impact on profit or loss has not been provided.
Credit risk
Credit risk is the risk that one party to a transaction will fail to discharge an obligation and cause the other party to incur a financial loss. Concentrations of credit risk relate to groups of customers or counterparties that have similar economic or industry characteristics that cause their ability to meet contractual obligations to be similarly affected by changes in economic or other conditions.
The Corporation does not have a significant concentration of credit risk. The maximum credit risk to which the Corporation is exposed as at March 31, 2016, is limited to the fair value of the financial assets recognized as follows:
March 31 December 31(in millions) 2016 2014
Financial assets
Cash and cash equivalents $ 28 $ -
Accounts receivable and unbilled revenue 409 315
Risk management assets - 7
Debt retirement funds 533 457
Investment 2 2
$ 972 $ 781
(a) Accounts receivable and unbilled revenue is diversified among many residential, farm and commercial customersthroughout Saskatchewan. The following reflects an aging summary of the Corporation’s customer accountsreceivable balances for both electricity and non-electricity sales at March 31, 2016:
March 31 December 31(in millions) 2016 2014
Current $ 253 $ 261
30 to 59 days 8 10
60 to 89 days 2 9
90 days and greater 17 16
$ 280 $ 296
Allowance for doubtful accounts (10) (7)
Margin deposits on derivative financial instruments 132 20
Miscellaneous receivables 7 6
$ 409 $ 315
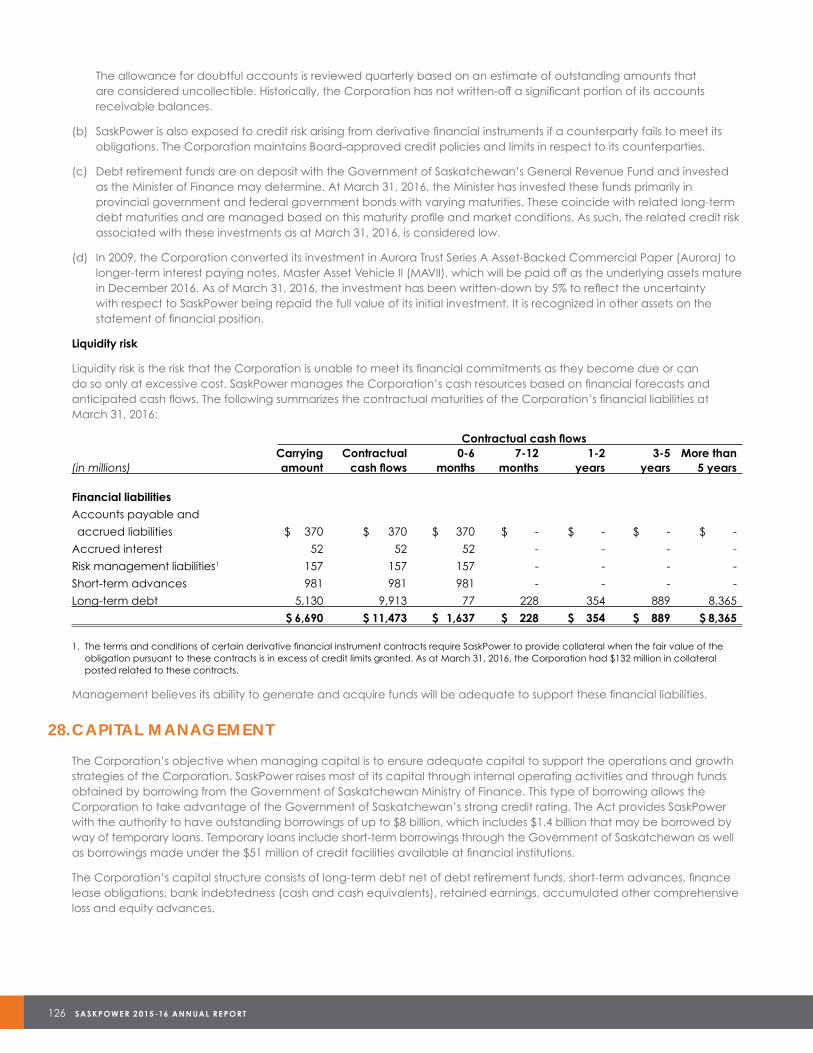
126 SASKPOWE R 2 015 -16 ANNUAL RE PORT
The allowance for doubtful accounts is reviewed quarterly based on an estimate of outstanding amounts that are considered uncollectible. Historically, the Corporation has not written-off a significant portion of its accounts receivable balances.
(b) SaskPower is also exposed to credit risk arising from derivative financial instruments if a counterparty fails to meet itsobligations. The Corporation maintains Board-approved credit policies and limits in respect to its counterparties.
(c) Debt retirement funds are on deposit with the Government of Saskatchewan’s General Revenue Fund and investedas the Minister of Finance may determine. At March 31, 2016, the Minister has invested these funds primarily inprovincial government and federal government bonds with varying maturities. These coincide with related long-termdebt maturities and are managed based on this maturity profile and market conditions. As such, the related credit riskassociated with these investments as at March 31, 2016, is considered low.
(d) In 2009, the Corporation converted its investment in Aurora Trust Series A Asset-Backed Commercial Paper (Aurora) tolonger-term interest paying notes, Master Asset Vehicle II (MAVII), which will be paid off as the underlying assets maturein December 2016. As of March 31, 2016, the investment has been written-down by 5% to reflect the uncertaintywith respect to SaskPower being repaid the full value of its initial investment. It is recognized in other assets on thestatement of financial position.
Liquidity risk
Liquidity risk is the risk that the Corporation is unable to meet its financial commitments as they become due or can do so only at excessive cost. SaskPower manages the Corporation’s cash resources based on financial forecasts and anticipated cash flows. The following summarizes the contractual maturities of the Corporation’s financial liabilities at March 31, 2016:
ContractualcashflowsCarrying Contractual 0-6 7-12 1-2 3-5 More than
(in millions) amount cash flows months months years years 5 years
Financial liabilities
Accounts payable and
accrued liabilities $ 370 $ 370 $ 370 $ - $ - $ - $ -
Accrued interest 52 52 52 - - - -
Risk management liabilities1 157 157 157 - - - -
Short-term advances 981 981 981 - - - -
Long-term debt 5,130 9,913 77 228 354 889 8,365
$ 6,690 $ 11,473 $ 1,637 $ 228 $ 354 $ 889 $ 8,365
1. The terms and conditions of certain derivative financial instrument contracts require SaskPower to provide collateral when the fair value of the obligation pursuant to these contracts is in excess of credit limits granted. As at March 31, 2016, the Corporation had $132 million in collateral posted related to these contracts.
Management believes its ability to generate and acquire funds will be adequate to support these financial liabilities.
28. CAPITAL MANAGEMENT
The Corporation’s objective when managing capital is to ensure adequate capital to support the operations and growthstrategies of the Corporation. SaskPower raises most of its capital through internal operating activities and through fundsobtained by borrowing from the Government of Saskatchewan Ministry of Finance. This type of borrowing allows theCorporation to take advantage of the Government of Saskatchewan’s strong credit rating. The Act provides SaskPowerwith the authority to have outstanding borrowings of up to $8 billion, which includes $1.4 billion that may be borrowed byway of temporary loans. Temporary loans include short-term borrowings through the Government of Saskatchewan as wellas borrowings made under the $51 million of credit facilities available at financial institutions.
The Corporation’s capital structure consists of long-term debt net of debt retirement funds, short-term advances, financelease obligations, bank indebtedness (cash and cash equivalents), retained earnings, accumulated other comprehensiveloss and equity advances.
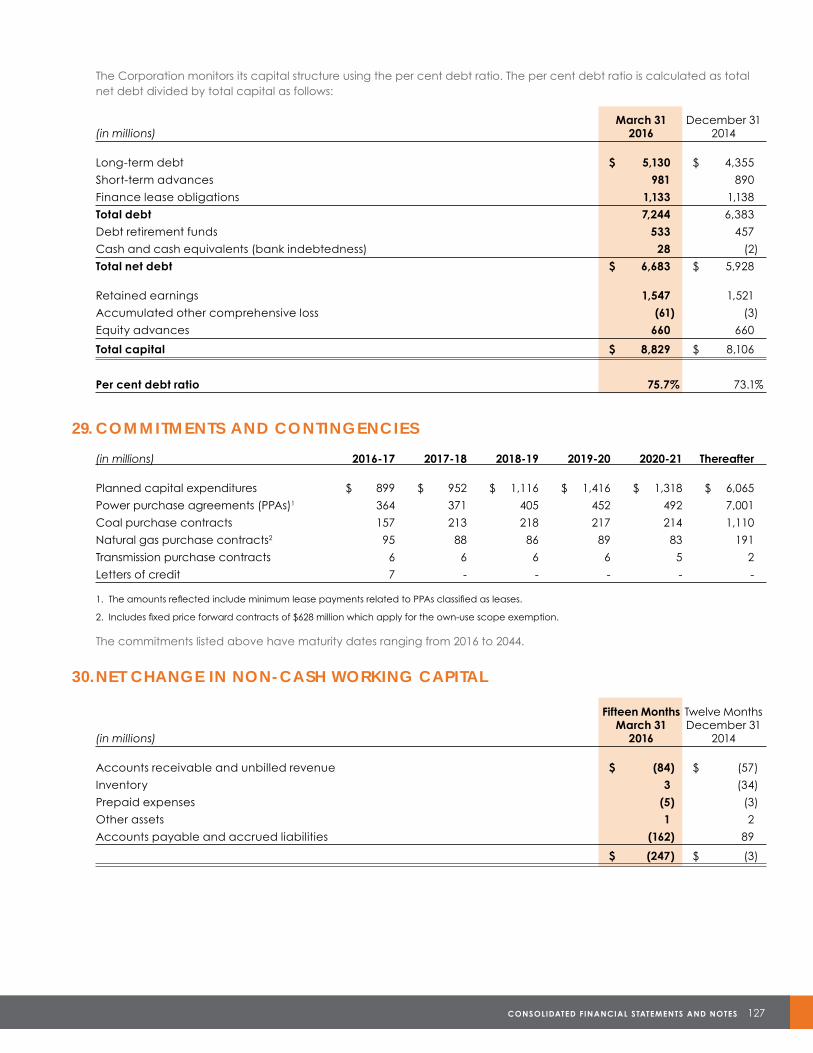
CONSOLIDATED FINANCIAL STATEMENTS AND NOTES 127
The Corporation monitors its capital structure using the per cent debt ratio. The per cent debt ratio is calculated as total net debt divided by total capital as follows:
March 31 December 31(in millions) 2016 2014
Long-term debt $ 5,130 $ 4,355
Short-term advances 981 890
Finance lease obligations 1,133 1,138
Total debt 7,244 6,383
Debt retirement funds 533 457
Cash and cash equivalents (bank indebtedness) 28 (2)
Total net debt $ 6,683 $ 5,928
Retained earnings 1,547 1,521
Accumulated other comprehensive loss (61) (3)
Equity advances 660 660
Total capital $ 8,829 $ 8,106
Per cent debt ratio 75.7% 73.1%
29. COMMITMENTS AND CONTINGENCIES
(in millions) 2016-17 2017-18 2018-19 2019-20 2020-21 Thereafter
Planned capital expenditures $ 899 $ 952 $ 1,116 $ 1,416 $ 1,318 $ 6,065
Power purchase agreements (PPAs)1 364 371 405 452 492 7,001
Coal purchase contracts 157 213 218 217 214 1,110
Natural gas purchase contracts2 95 88 86 89 83 191
Transmission purchase contracts 6 6 6 6 5 2
Letters of credit 7 - - - - -
1. The amounts reflected include minimum lease payments related to PPAs classified as leases.
2. Includes fixed price forward contracts of $628 million which apply for the own-use scope exemption.
The commitments listed above have maturity dates ranging from 2016 to 2044.
30. NET CHANGE IN NON-CASH WORKING CAPITAL
Fifteen Months Twelve MonthsMarch 31 December 31
(in millions) 2016 2014
Accounts receivable and unbilled revenue $ (84) $ (57)
Inventory 3 (34)
Prepaid expenses (5) (3)
Other assets 1 2
Accounts payable and accrued liabilities (162) 89
$ (247) $ (3)
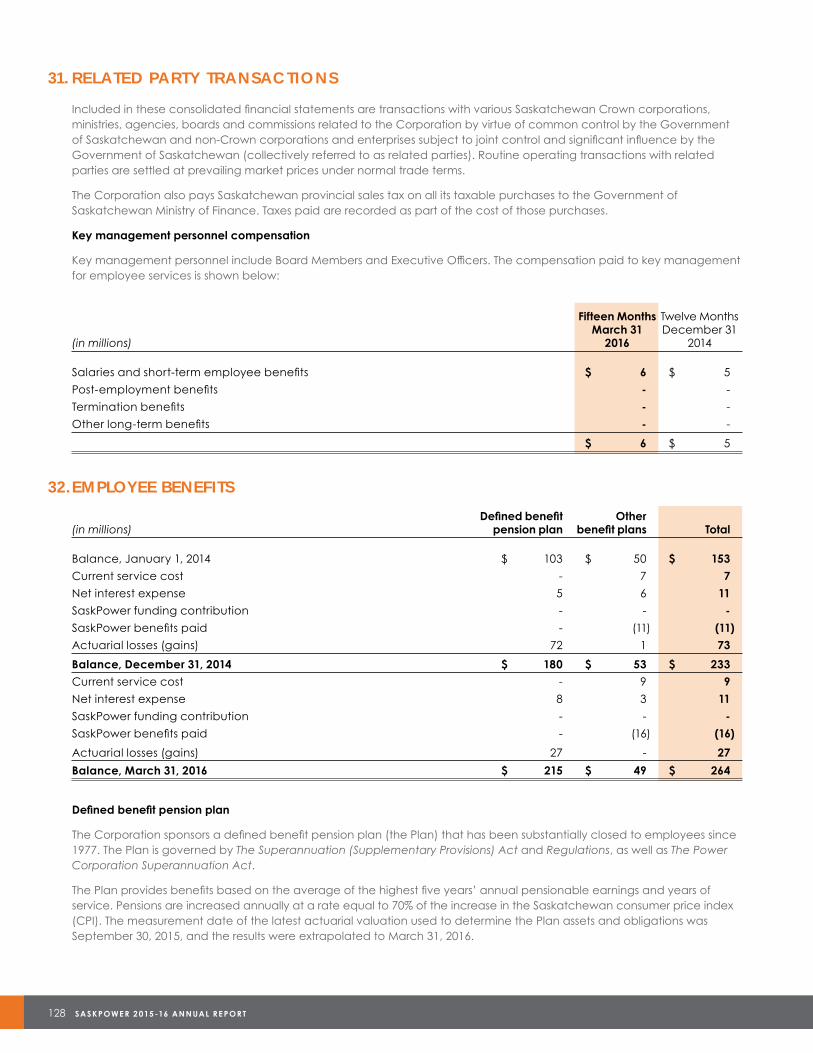
128 SASKPOWE R 2 015 -16 ANNUAL RE PORT
31. RELATED PARTY TRANSACTIONS
Included in these consolidated financial statements are transactions with various Saskatchewan Crown corporations,ministries, agencies, boards and commissions related to the Corporation by virtue of common control by the Governmentof Saskatchewan and non-Crown corporations and enterprises subject to joint control and significant influence by theGovernment of Saskatchewan (collectively referred to as related parties). Routine operating transactions with relatedparties are settled at prevailing market prices under normal trade terms.
The Corporation also pays Saskatchewan provincial sales tax on all its taxable purchases to the Government ofSaskatchewan Ministry of Finance. Taxes paid are recorded as part of the cost of those purchases.
Key management personnel compensation
Key management personnel include Board Members and Executive Officers. The compensation paid to key managementfor employee services is shown below:
Fifteen Months Twelve MonthsMarch 31 December 31
(in millions) 2016 2014
Salaries and short-term employee benefits $ 6 $ 5
Post-employment benefits - -
Termination benefits - -
Other long-term benefits - -
$ 6 $ 5
32. EMPLOYEE BENEFITS
Defined benefit Other(in millions) pension plan benefit plans Total
Balance, January 1, 2014 $ 103 $ 50 $ 153
Current service cost - 7 7
Net interest expense 5 6 11
SaskPower funding contribution - - -
SaskPower benefits paid - (11) (11)
Actuarial losses (gains) 72 1 73
Balance, December 31, 2014 $ 180 $ 53 $ 233
Current service cost - 9 9
Net interest expense 8 3 11
SaskPower funding contribution - - -
SaskPower benefits paid - (16) (16)
Actuarial losses (gains) 27 - 27
Balance, March 31, 2016 $ 215 $ 49 $ 264
Defined benefit pension plan
The Corporation sponsors a defined benefit pension plan (the Plan) that has been substantially closed to employees since 1977. The Plan is governed by The Superannuation (Supplementary Provisions) Act and Regulations, as well as The Power Corporation Superannuation Act.
The Plan provides benefits based on the average of the highest five years’ annual pensionable earnings and years of service. Pensions are increased annually at a rate equal to 70% of the increase in the Saskatchewan consumer price index (CPI). The measurement date of the latest actuarial valuation used to determine the Plan assets and obligations was September 30, 2015, and the results were extrapolated to March 31, 2016.
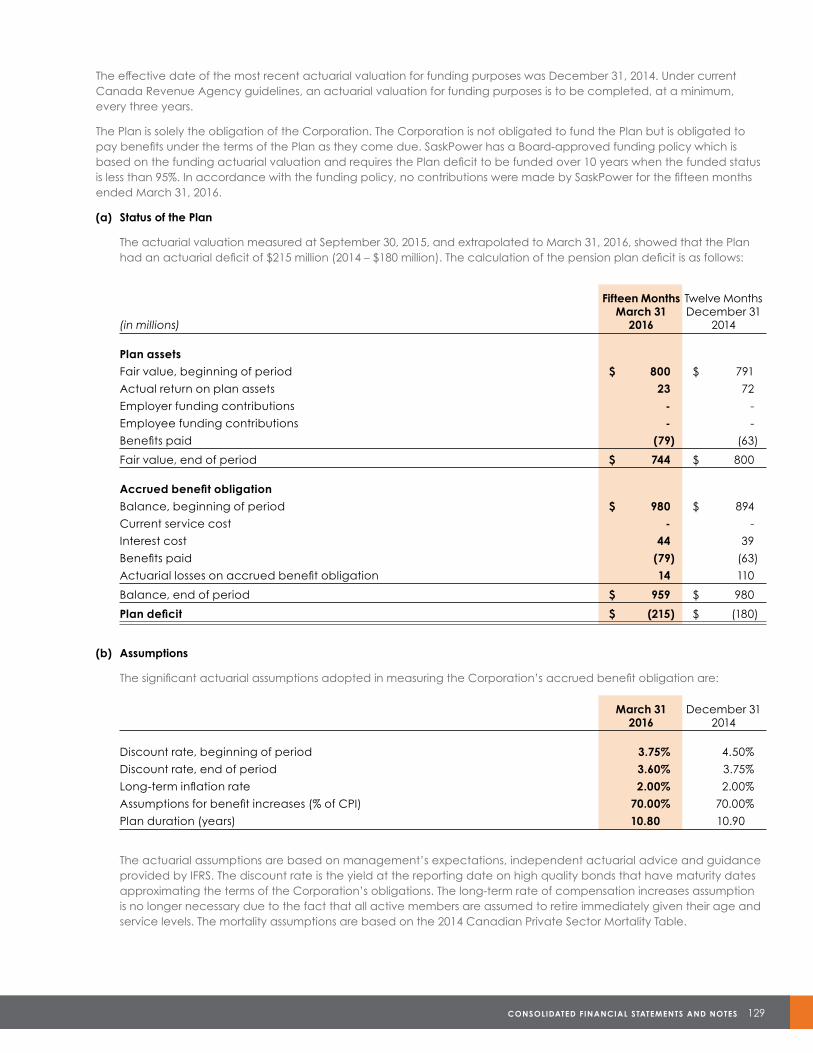
CONSOLIDATED FINANCIAL STATEMENTS AND NOTES 129
The effective date of the most recent actuarial valuation for funding purposes was December 31, 2014. Under current Canada Revenue Agency guidelines, an actuarial valuation for funding purposes is to be completed, at a minimum, every three years.
The Plan is solely the obligation of the Corporation. The Corporation is not obligated to fund the Plan but is obligated to pay benefits under the terms of the Plan as they come due. SaskPower has a Board-approved funding policy which is based on the funding actuarial valuation and requires the Plan deficit to be funded over 10 years when the funded status is less than 95%. In accordance with the funding policy, no contributions were made by SaskPower for the fifteen months ended March 31, 2016.
(a) Status of the Plan
The actuarial valuation measured at September 30, 2015, and extrapolated to March 31, 2016, showed that the Plan had an actuarial deficit of $215 million (2014 – $180 million). The calculation of the pension plan deficit is as follows:
Fifteen Months Twelve Months March 31 December 31
(in millions) 2016 2014
Plan assets
Fair value, beginning of period $ 800 $ 791
Actual return on plan assets 23 72
Employer funding contributions - -
Employee funding contributions - -
Benefits paid (79) (63)
Fair value, end of period $ 744 $ 800
Accrued benefit obligation
Balance, beginning of period $ 980 $ 894
Current service cost - -
Interest cost 44 39
Benefits paid (79) (63)
Actuarial losses on accrued benefit obligation 14 110
Balance, end of period $ 959 $ 980
Plan deficit $ (215) $ (180)
(b) Assumptions
The significant actuarial assumptions adopted in measuring the Corporation’s accrued benefit obligation are:
March 31 December 31 2016 2014
Discount rate, beginning of period 3.75% 4.50%
Discount rate, end of period 3.60% 3.75%
Long-term inflation rate 2.00% 2.00%
Assumptions for benefit increases (% of CPI) 70.00% 70.00%
Plan duration (years) 10.80 10.90
The actuarial assumptions are based on management’s expectations, independent actuarial advice and guidance provided by IFRS. The discount rate is the yield at the reporting date on high quality bonds that have maturity dates approximating the terms of the Corporation’s obligations. The long-term rate of compensation increases assumption is no longer necessary due to the fact that all active members are assumed to retire immediately given their age and service levels. The mortality assumptions are based on the 2014 Canadian Private Sector Mortality Table.
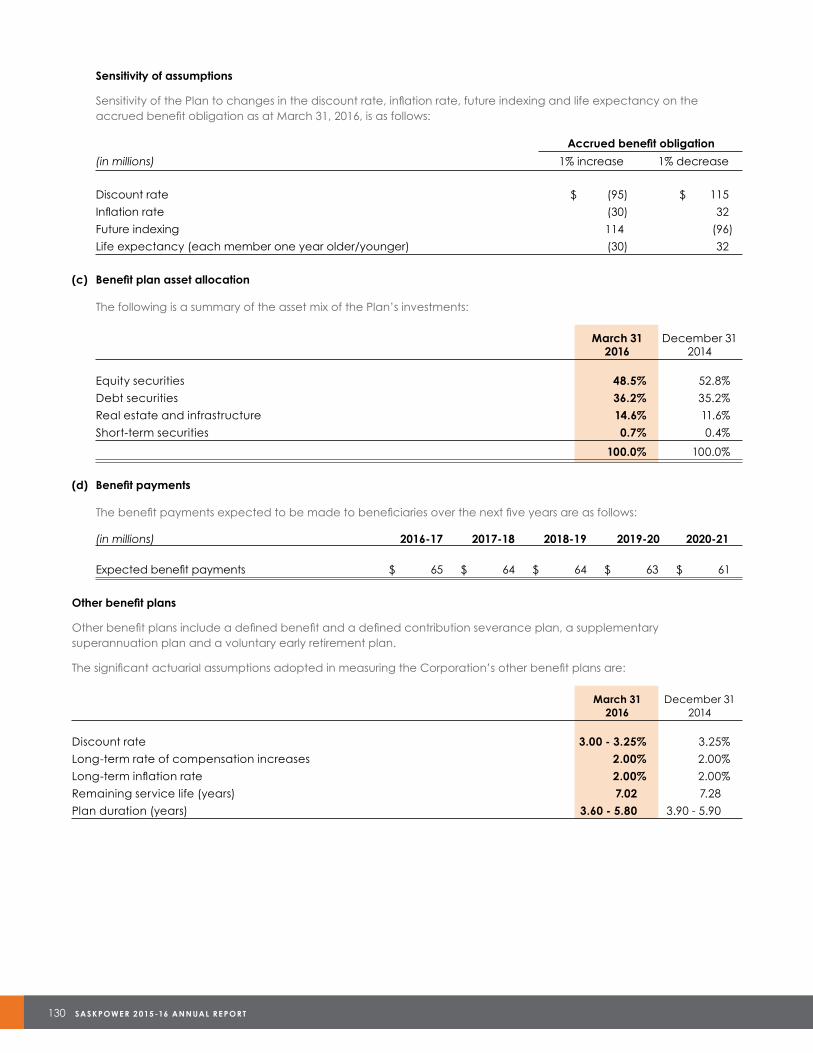
130 SASKPOWE R 2 015 -16 ANNUAL RE PORT
Sensitivity of assumptions
Sensitivity of the Plan to changes in the discount rate, inflation rate, future indexing and life expectancy on the accrued benefit obligation as at March 31, 2016, is as follows:
Accrued benefit obligation
(in millions) 1% increase 1% decrease
Discount rate $ (95) $ 115
Inflation rate (30) 32
Future indexing 114 (96)
Life expectancy (each member one year older/younger) (30) 32
(c) Benefit plan asset allocation
The following is a summary of the asset mix of the Plan’s investments:
March 31 December 312016 2014
Equity securities 48.5% 52.8%
Debt securities 36.2% 35.2%
Real estate and infrastructure 14.6% 11.6%
Short-term securities 0.7% 0.4%
100.0% 100.0%
(d) Benefit payments
The benefit payments expected to be made to beneficiaries over the next five years are as follows:
(in millions) 2016-17 2017-18 2018-19 2019-20 2020-21
Expected benefit payments $ 65 $ 64 $ 64 $ 63 $ 61
Other benefit plans
Other benefit plans include a defined benefit and a defined contribution severance plan, a supplementary superannuation plan and a voluntary early retirement plan.
The significant actuarial assumptions adopted in measuring the Corporation’s other benefit plans are:
March 31 December 312016 2014
Discount rate 3.00 - 3.25% 3.25%
Long-term rate of compensation increases 2.00% 2.00%
Long-term inflation rate 2.00% 2.00%
Remaining service life (years) 7.02 7.28
Plan duration (years) 3.60 - 5.80 3.90 - 5.90
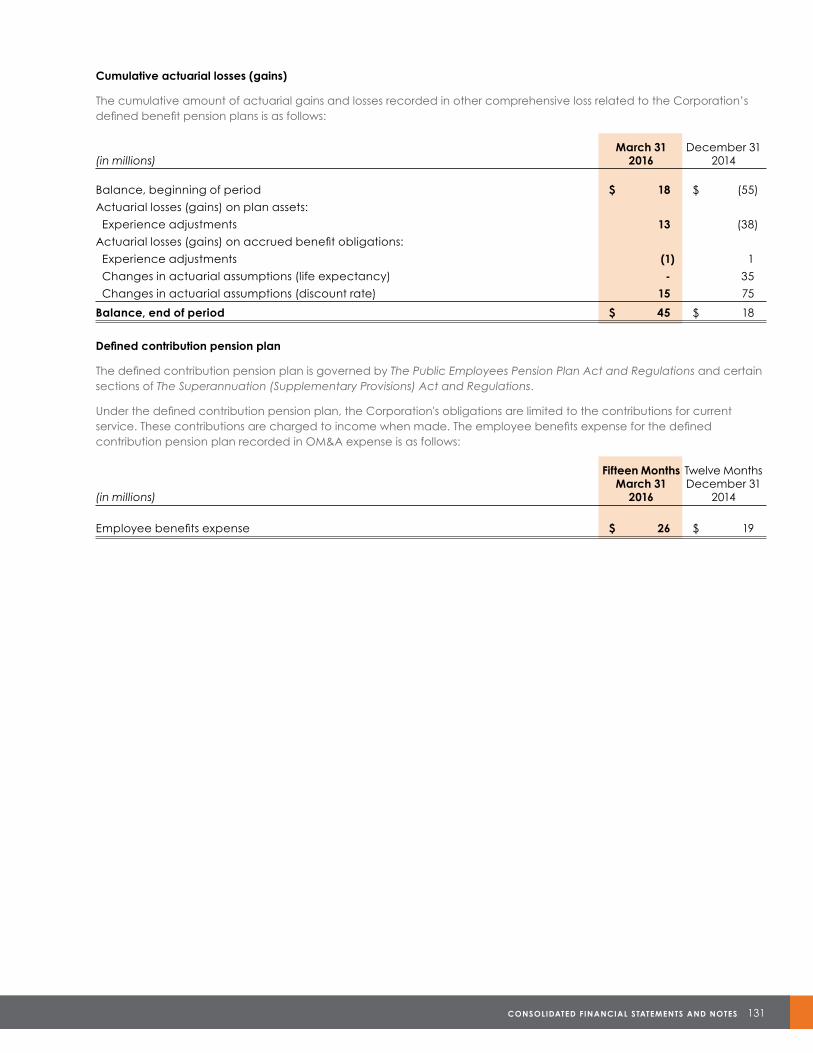
CONSOLIDATED FINANCIAL STATEMENTS AND NOTES 131
Cumulative actuarial losses (gains)
The cumulative amount of actuarial gains and losses recorded in other comprehensive loss related to the Corporation’s defined benefit pension plans is as follows:
March 31 December 31(in millions) 2016 2014
Balance, beginning of period $ 18 $ (55)
Actuarial losses (gains) on plan assets:
Experience adjustments 13 (38)
Actuarial losses (gains) on accrued benefit obligations:
Experience adjustments (1) 1
Changes in actuarial assumptions (life expectancy) - 35
Changes in actuarial assumptions (discount rate) 15 75
Balance, end of period $ 45 $ 18
Defined contribution pension plan
The defined contribution pension plan is governed by The Public Employees Pension Plan Act and Regulations and certain sections of The Superannuation (Supplementary Provisions) Act and Regulations.
Under the defined contribution pension plan, the Corporation's obligations are limited to the contributions for current service. These contributions are charged to income when made. The employee benefits expense for the defined contribution pension plan recorded in OM&A expense is as follows:
Fifteen Months Twelve Months March 31 December 31(in millions) 2016 2014
Employee benefits expense $ 26 $ 19
132 SASKPOWE R 2 015 -16 ANNUAL RE PORT
CORPORATE GOVERNANCE
Accountability is a principal component of SaskPower’s corporate values and is essential in our relationship with our customers, stakeholders and shareholder. In order to ensure the continuing presence of a sound corporate governance structure, our company remains committed to ongoing evaluation. Our aim is to strengthen transparency while executing a comprehensive program of reporting.
COMPANY STRUCTURE
SaskPower is governed by The Power Corporation Act (the Act). It is subject to the provisions of The Crown Corporations Act, 1993, which gives the Crown Investments Corporation (CIC) of Saskatchewan, the holding company for Saskatchewan’s commercial Crown corporations, broad authority to set the direction of SaskPower. In practice, directives are normally in the following forms: CIC Crown subsidiary policies applying to all CIC Crowns; CIC Board resolutions and directives; and CIC management directives.
As the shareholder of SaskPower, CIC provides oversight of our company’s operations. Communication is implemented through written policies and directives issued by CIC’s management or its Board of Directors, as well as verbally through discussions with SaskPower leaders. Our company reports to CIC on a regular basis on matters such as Corporate Balanced Scorecard results, financial statements and forecasts, capital expenditures and debt obligations. SaskPower also provides ad hoc reports to CIC upon request.
Where required by legislation or policy directive, our company submits performance management and investment decisions for review and approval by CIC and provincial cabinet. Through its Chair, who is an outside Director, the SaskPower Board of Directors is accountable to the Minister Responsible for Saskatchewan Power Corporation. The Minister functions as a link between SaskPower and cabinet, as well as the provincial legislature.
The Legislative Assembly of Saskatchewan appoints members to the Standing Committee on Crown and Central Agencies at the beginning of each legislative session. This committee holds public hearings and is empowered to review the annual reports, financial statements and operations of Crown corporations and related agencies. The Minister Responsible for Saskatchewan Power Corporation and our company’s senior executives are called before the committee to answer questions about the year under review and issues of topical concern.
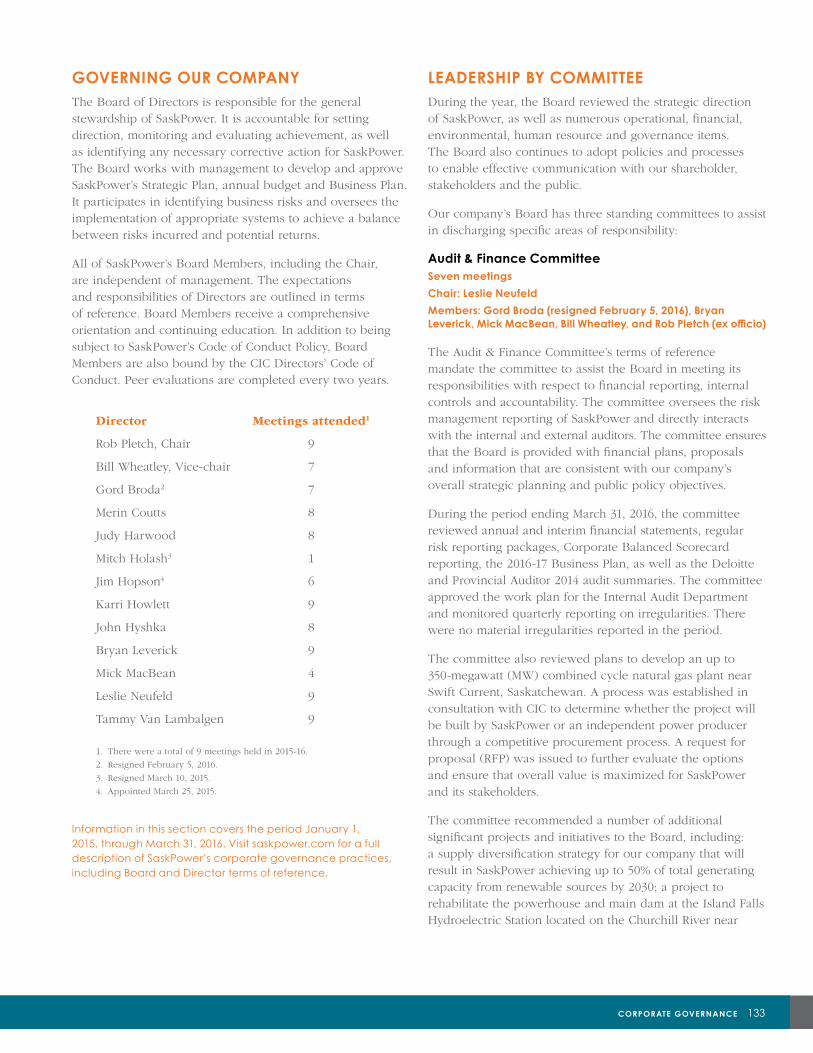
CORPORATE GOVERNANCE 133
GOVERNING OUR COMPANYThe Board of Directors is responsible for the general stewardship of SaskPower. It is accountable for setting direction, monitoring and evaluating achievement, as well as identifying any necessary corrective action for SaskPower. The Board works with management to develop and approve SaskPower’s Strategic Plan, annual budget and Business Plan. It participates in identifying business risks and oversees the implementation of appropriate systems to achieve a balance between risks incurred and potential returns.
All of SaskPower’s Board Members, including the Chair, are independent of management. The expectations and responsibilities of Directors are outlined in terms of reference. Board Members receive a comprehensive orientation and continuing education. In addition to being subject to SaskPower’s Code of Conduct Policy, Board Members are also bound by the CIC Directors’ Code of Conduct. Peer evaluations are completed every two years.
Director Meetings attended1
Rob Pletch, Chair 9
Bill Wheatley, Vice-chair 7
Gord Broda2 7
Merin Coutts 8
Judy Harwood 8
Mitch Holash3 1
Jim Hopson4 6
Karri Howlett 9
John Hyshka 8
Bryan Leverick 9
Mick MacBean 4
Leslie Neufeld 9
Tammy Van Lambalgen 9
1. There were a total of 9 meetings held in 2015-16.
2. Resigned February 5, 2016.
3. Resigned March 10, 2015.
4. Appointed March 25, 2015.
Information in this section covers the period January 1, 2015, through March 31, 2016. Visit saskpower.com for a full description of SaskPower’s corporate governance practices, including Board and Director terms of reference.
LEADERSHIP BY COMMITTEEDuring the year, the Board reviewed the strategic direction of SaskPower, as well as numerous operational, financial, environmental, human resource and governance items. The Board also continues to adopt policies and processes to enable effective communication with our shareholder, stakeholders and the public.
Our company’s Board has three standing committees to assist in discharging specific areas of responsibility:
Audit & Finance CommitteeSeven meetings
Chair: Leslie Neufeld
Members: Gord Broda (resigned February 5, 2016), Bryan Leverick, Mick MacBean, Bill Wheatley, and Rob Pletch (ex officio)
The Audit & Finance Committee’s terms of reference mandate the committee to assist the Board in meeting its responsibilities with respect to financial reporting, internal controls and accountability. The committee oversees the risk management reporting of SaskPower and directly interacts with the internal and external auditors. The committee ensures that the Board is provided with financial plans, proposals and information that are consistent with our company’s overall strategic planning and public policy objectives.
During the period ending March 31, 2016, the committee reviewed annual and interim financial statements, regular risk reporting packages, Corporate Balanced Scorecard reporting, the 2016-17 Business Plan, as well as the Deloitte and Provincial Auditor 2014 audit summaries. The committee approved the work plan for the Internal Audit Department and monitored quarterly reporting on irregularities. There were no material irregularities reported in the period.
The committee also reviewed plans to develop an up to 350-megawatt (MW) combined cycle natural gas plant nearSwift Current, Saskatchewan. A process was established inconsultation with CIC to determine whether the project willbe built by SaskPower or an independent power producerthrough a competitive procurement process. A request forproposal (RFP) was issued to further evaluate the optionsand ensure that overall value is maximized for SaskPowerand its stakeholders.
The committee recommended a number of additional significant projects and initiatives to the Board, including: a supply diversification strategy for our company that will result in SaskPower achieving up to 50% of total generating capacity from renewable sources by 2030; a project to rehabilitate the powerhouse and main dam at the Island Falls Hydroelectric Station located on the Churchill River near
CORPORATE GOVERNANCE 133
134 SASKPOWE R 2 015 -16 ANNUAL RE PORT
the community of Sandy Bay; an agreement with Manitoba Hydro to purchase 100 MW of power for a term of 20 years commencing in 2020 and a project to construct the necessary transmission facilities; a new 14-year coal supply agreement for the Poplar River Power Station; and a commitment to set aside a number of solar and flare gas projects to be developed by First Nations Power Authority and its members.
The committee also reviewed SaskPower’s significant corporate risks and mitigation plans to address them, monitored the company’s financial performance, and held regular in camera discussions with SaskPower’s Director, Internal Audit.
Environment, Health & Safety CommitteeFive meetings
Chair: Karri Howlett
Members: Judy Harwood, Mitch Holash (resigned March 10, 2015), John Hyshka, Jim Hopson (appointed June 4, 2015) and Rob Pletch (ex officio)
The Environment, Health & Safety Committee is charged with ensuring that our company proactively addresses safety, health and environmental issues and is in compliance with regulatory and statutory requirements. In addition, the committee reviews the findings of the internal and external audits of the company’s environmental and safety management systems, as well as environmental, health and safety facilities. It also monitors the implementation of audit recommendations.
In the period ended March 31, 2016, the committee approved a five-year environmental strategy for SaskPower to align the company with evolving stakeholder and regulator expectations on environmental performance. The committee also continued to monitor environmental key performance indicators; review progress on regulatory developments for greenhouse gas (GHG) emissions and other air pollutants; receive reports on SaskPower’s compliance with environmental legislative, regulatory and corporate standards; and review the results of internal and external audits of SaskPower’s environmental and safety management systems.
The committee reviewed the findings of an external audit of SaskPower’s Vegetation Management Program and monitored the progress of SaskPower’s Polychlorinated Biphenyl (PCB) Action Plan to address risks associated with PCBs and significantly reduce their presence in SaskPower’s system.
Management presented the committee with its corporate strategic plan for safety and provided regular updates on corporate safety performance. The committee also received an audit report on the status of SaskPower’s dams, which is provided annually pursuant to SaskPower’s Dam Safety Program.
Governance/Human Resources Committee
11 meetings
Chair: Mitch Holash (resigned March 10, 2015), Bryan Leverick (Acting Chair - March 11, 2015 to June 4, 2015) and Tammy Van Lambalgen (appointed June 4, 2015)
Members: Merin Coutts, Judy Harwood (to June 4, 2015), Karri Howlett, Bryan Leverick and Rob Pletch (ex officio)
The Governance/Human Resources Committee is responsible for the development, review and effectiveness of SaskPower’s corporate governance practices. The committee’s governance-related duties include serving as ethics advisor for the Board, monitoring and evaluating overall Board performance on a biannual basis, providing guidance on governance issues to Directors, and recommending governance issues for discussion by the full Board. The Governance/Human Resources Committee is also charged with overseeing SaskPower’s human resources strategies, programs and practices.
In the period ended March 31, 2016, the committee approved revisions to SaskPower’s Governance Manual and Signing Authority Policy to ensure that our company’s governance policies support effective decision-making. The committee also approved changes to SaskPower’s Community Partnerships and Investment Policy to clarify eligibility criteria and ensure consistent application of the policy within the company.
The committee received reports on the company’s activities in a number of areas, including: an annual report on the activities of the Saskatchewan Electric Reliability Authority, a committee within SaskPower that is charged with the authority to adopt and enforce electric reliability standards in Saskatchewan under the Act; and the performance of SaskPower’s gas and electrical inspections branch.
The committee’s human resources activities included: oversight of the administration of SaskPower's Short-Term Incentive Plan; a review of SaskPower’s benefit plans; approval of an Executive Diversity Strategy; a review of a five-year Workforce Plan; and consideration of SaskPower’s succession planning framework. The committee also reviewed the performance of the President & CEO for 2015 and established performance objectives for the President & CEO for 2016.
CORPORATE GOVERNANCE 135
ASSESSING OUR GOVERNANCE PERFORMANCEOur company is committed to regularly revisiting key elements of SaskPower’s decision-making processes to ensure we continue to meet best practice standards. As a Crown corporation, SaskPower is not required to comply with Canadian Securities Administrators (CSA) Governance Guidelines. However, we use these guidelines to benchmark our governance practices.
Our company’s practices are substantially consistent with CSA standards, as set out in the following scorecard:
CSA national policy 58-201Part 3 — Corporate Governance Guidelines SaskPower’s corporate governance practices Consistent with
CSA guidelines?
Composition of the Board
3.1 The Board should have a majority of independent Directors.
As of March 31, 2016, the Board was comprised of 11 independent Directors.
Yes
3.2 The Chair of the Board should be an independent Director. Where this is not appropriate, an independent Director should be appointed to act as “Lead Director.” However, either an independent Chair or an independent Lead Director should act as the effective leader of the Board and ensure that the Board’s agenda will enable it to successfully carry out its duties.
The Chair of the Board is an independent Director.
Yes
Meetings of independent Directors
3.3 The independent Directors should hold regularly scheduled meetings at which non-independent Directors and members of management are not in attendance.
All members are independent. The Board typically has two in camera sessions without management at every meeting.
Yes
Board mandate
3.4 The Board should adopt a written mandate in which it explicitly acknowledges responsibility for the stewardship of the issuer, including responsibility for:
The Board has a written mandate in its terms of reference, where it explicitly acknowledges that the Board of Directors functions as a steward of the company.
Yes
(a) to the extent feasible, satisfying itself as to the integrity of the Chief Executive Officer (the CEO) and other executive officers and that the CEO and other executive officers create a culture of integrity throughout the organization;
The terms of reference for a Director state that Directors shall require “of themselves and corporate employees high standards of ethical behaviour…” The President and CEO m andate also places accountability on that position for ensuring activities and practices of the company are ethical and compliant with the law.
Yes
(b) adopting a strategic planning process and approving, on at least an annual basis, a strategic plan which takes into account, among other things, the opportunities and risks of the business;
The Board, working with the executive, provides strategic direction to SaskPower. Formally, this is accomplished with the annual approval of the Strategic Plan. Yes
(c) the identification of the principal risks of the issuer’s business, and ensuring the implementation of appropriate systems to manage these risks;
The Board identifies principal risks to the company on an annual basis. Either directly or through the Audit & Finance Committee, the Board monitors the company’s risk management programs. It also oversees the implementation of risk management systems. The Audit & Finance Committee meets regularly to review reports and discuss significant risk concerns with both the internal and external auditors.
Yes
(d) succession planning (including appointing, training and monitoring senior management);
The Board terms of reference state that the Board is responsible for succession planning.
Yes
(e) adopting a communication policy for the issuer;
Pursuant to the Board terms of reference, the Board adopts policies and processes to enable effective communication with CIC, stakeholders and the public.
Yes
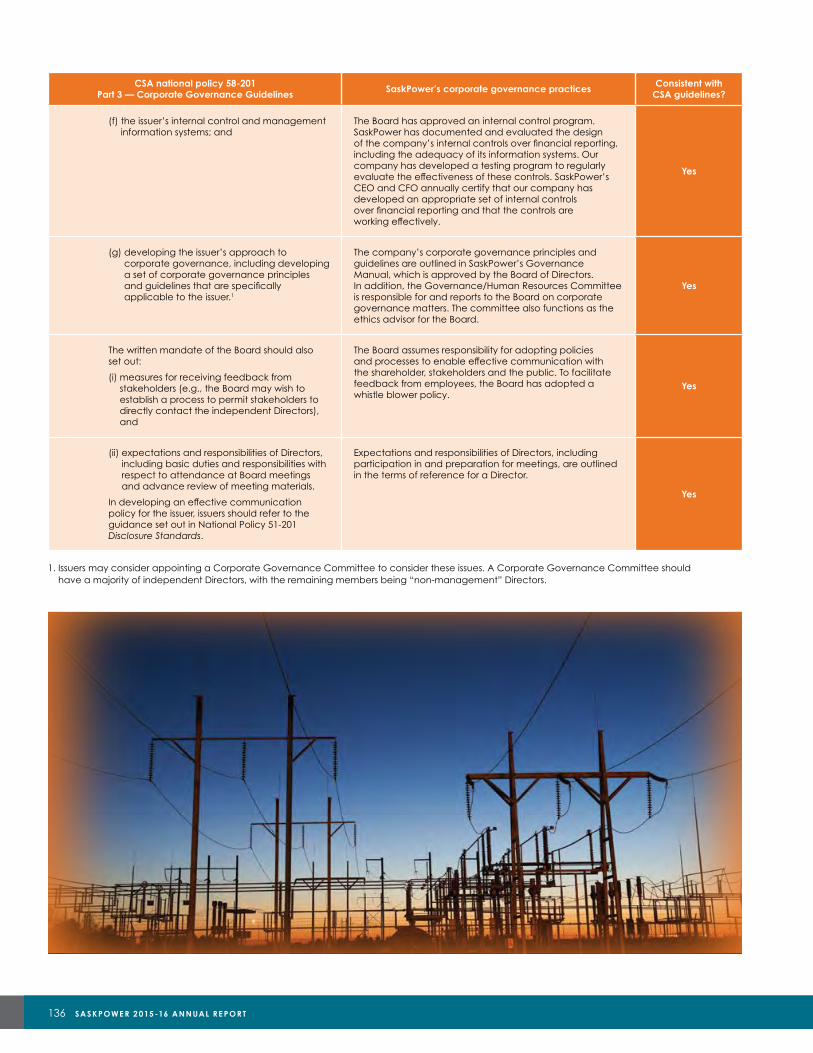
136 SASKPOWE R 2 015 -16 ANNUAL RE PORT
CSA national policy 58-201Part 3 — Corporate Governance Guidelines SaskPower’s corporate governance practices Consistent with
CSA guidelines?
(f) the issuer’s internal control and management information systems; and
The Board has approved an internal control program. SaskPower has documented and evaluated the design of the company’s internal controls over financial reporting, including the adequacy of its information systems. Our company has developed a testing program to regularly evaluate the effectiveness of these controls. SaskPower’s CEO and CFO annually certify that our company has developed an appropriate set of internal controls over financial reporting and that the controls are working effectively.
Yes
(g) developing the issuer’s approach to corporate governance, including developing a set of corporate governance principles and guidelines that are specifically applicable to the issuer.1
The company’s corporate governance principles and guidelines are outlined in SaskPower’s Governance Manual, which is approved by the Board of Directors. In addition, the Governance/Human Resources Committee is responsible for and reports to the Board on corporate governance matters. The committee also functions as the ethics advisor for the Board.
Yes
The written mandate of the Board should also set out:
(i) measures for receiving feedback from stakeholders (e.g., the Board may wish to establish a process to permit stakeholders to directly contact the independent Directors), and
The Board assumes responsibility for adopting policies and processes to enable effective communication with the shareholder, stakeholders and the public. To facilitate feedback from employees, the Board has adopted a whistle blower policy.
Yes
(ii) expectations and responsibilities of Directors, including basic duties and responsibilities with respect to attendance at Board meetings and advance review of meeting materials.
In developing an effective communication policy for the issuer, issuers should refer to the guidance set out in National Policy 51-201 Disclosure Standards.
Expectations and responsibilities of Directors, including participation in and preparation for meetings, are outlined in the terms of reference for a Director.
Yes
1. Issuers may consider appointing a Corporate Governance Committee to consider these issues. A Corporate Governance Committee should have a majority of independent Directors, with the remaining members being “non-management” Directors.
CORPORATE GOVERNANCE 137
CSA national policy 58-201Part 3 — Corporate Governance Guidelines SaskPower’s corporate governance practices Consistent with
CSA guidelines?
Position descriptions
3.5 The Board should develop clear position descriptions for the Chair of the Board and the Chair of each Board Committee. In addition, the Board, together with the CEO, should develop a clear position description for the CEO, which includes delineating management’s responsibilities. The Board should also develop or approve the corporate goals and objectives that the CEO is responsible for meeting.
The Governance/Human Resources Committee annually reviews the terms of reference for the Board Chair as well as Committee Chairs. These are approved by the Board. The Board has also adopted a President and CEO mandate.
Yes
Orientation and continuing education
3.6 The Board should ensure that all new Directors receive a comprehensive orientation. All new Directors should fully understand the role of the Board and its Committees, as well as the contribution individual Directors are expected to make (including, in particular, the commitment of time and resources that the issuer expects from its Directors). All new Directors should also understand the nature and operation of the issuer’s business.
The Governance/Human Resources Committee terms of reference state that it shall recommend a Director orientation and continuing education policy. New Directors receive a comprehensive orientation to corporate issues and processes. Comprehensive briefing materials are also provided to new members covering key aspects of our company’s business. The expectations of individual Directors are set out in the terms of reference for a Director approved by the Board. These expectations include attendance at meetings, participation in Board and committee work, and advance preparation for each meeting.
Yes
3.7 The Board should provide continuing education opportunities for all Directors, so that individuals may maintain or enhance their skills and abilities as Directors, as well as to ensure their knowledge and understanding of the issuer’s business remains current.
SaskPower Board Members receive governance training from CIC and are offered the opportunity to attend The Director’s College. Sponsored by CIC, this modular program focuses on the highest calibre governance practices, including technical and behavioural aspects of board governance. Directors who complete all five modules of the program are eligible to write a final examination and receive certification as a chartered corporate Director. In addition, our company provides opportunities to participate in site visits and tours. The Board also receives presentations from outside experts and industry-specific briefings as a backdrop for policy and investment decisions.
Yes
Code of Business Conduct and Ethics
3.8 The Board should adopt a written Code of Business Conduct and Ethics (a Code). The Code should be applicable to Directors, officers and employees of the issuer. The Code should constitute written standards that are reasonably designed to promote integrity and to deter wrongdoing. In particular, it should address the following issues:
SaskPower has a written Code of Conduct Policy applicable to Directors, officers and employees. It is intended to provide both general and specific guidelines to protect and guide SaskPower personnel faced with ethical, moral and legal dilemmas during the course of their employment or in carrying out their duties. The Board has the responsibility to review and revise the Code, as required. The Board has further strengthened this directive by adopting a whistle blower policy and implementing an anonymous reporting process to help deter wrongdoing. Quarterly irregularity reporting has been implemented to keep the Board informed of compliance issues.
Yes
(a) conflicts of interest, including transactions and agreements in respect of which a Director or Executive Officer has a material interest;
The Code addresses conflicts of interest. Board Members complete and file annual conflict of interest declarations with the office of the General Counsel as well as declare any conflicts on the spot as they may arise in a meeting setting. Board Members are also bound by the CIC Directors’ Code of Conduct.
Yes
(b) protection and proper use of assets and opportunities;
Property and inventions are covered in the Code as well as the appropriate use of business assets.
Yes
(c) confidentiality of corporate information; Confidentiality is covered in the Code, including SaskPower information that contains third party information and personal information about personnel and customers.
Yes
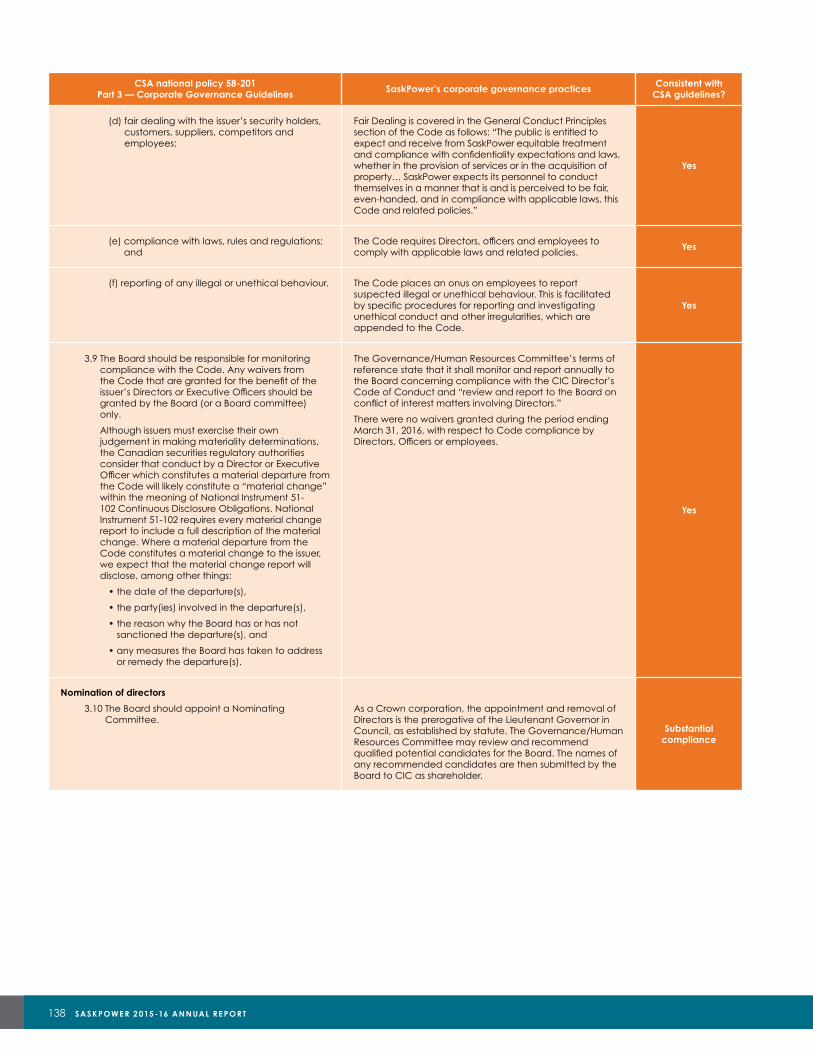
138 SASKPOWE R 2 015 -16 ANNUAL RE PORT
CSA national policy 58-201Part 3 — Corporate Governance Guidelines SaskPower’s corporate governance practices Consistent with
CSA guidelines?
(d) fair dealing with the issuer’s security holders, customers, suppliers, competitors and employees;
Fair Dealing is covered in the General Conduct Principles section of the Code as follows: “The public is entitled to expect and receive from SaskPower equitable treatment and compliance with confidentiality expectations and laws, whether in the provision of services or in the acquisition of property… SaskPower expects its personnel to conduct themselves in a manner that is and is perceived to be fair, even-handed, and in compliance with applicable laws, this Code and related policies.”
Yes
(e) compliance with laws, rules and regulations; and
The Code requires Directors, officers and employees to comply with applicable laws and related policies.
Yes
(f) reporting of any illegal or unethical behaviour. The Code places an onus on employees to report suspected illegal or unethical behaviour. This is facilitated by specific procedures for reporting and investigating unethical conduct and other irregularities, which are appended to the Code.
Yes
3.9 The Board should be responsible for monitoring compliance with the Code. Any waivers from the Code that are granted for the benefit of the issuer’s Directors or Executive Officers should be granted by the Board (or a Board committee) only.
Although issuers must exercise their own judgement in making materiality determinations, the Canadian securities regulatory authorities consider that conduct by a Director or Executive Officer which constitutes a material departure from the Code will likely constitute a “material change” within the meaning of National Instrument 51-102 Continuous Disclosure Obligations. National Instrument 51-102 requires every material change report to include a full description of the material change. Where a material departure from the Code constitutes a material change to the issuer, we expect that the material change report will disclose, among other things:
• the date of the departure(s),
• the party(ies) involved in the departure(s),
• the reason why the Board has or has not sanctioned the departure(s), and
• any measures the Board has taken to address or remedy the departure(s).
The Governance/Human Resources Committee’s terms of reference state that it shall monitor and report annually to the Board concerning compliance with the CIC Director’s Code of Conduct and “review and report to the Board on conflict of interest matters involving Directors.”
There were no waivers granted during the period ending March 31, 2016, with respect to Code compliance by Directors, Officers or employees.
Yes
Nomination of directors
3.10 The Board should appoint a Nominating Committee.
As a Crown corporation, the appointment and removal of Directors is the prerogative of the Lieutenant Governor in Council, as established by statute. The Governance/Human Resources Committee may review and recommend qualified potential candidates for the Board. The names of any recommended candidates are then submitted by the Board to CIC as shareholder.
Substantial compliance
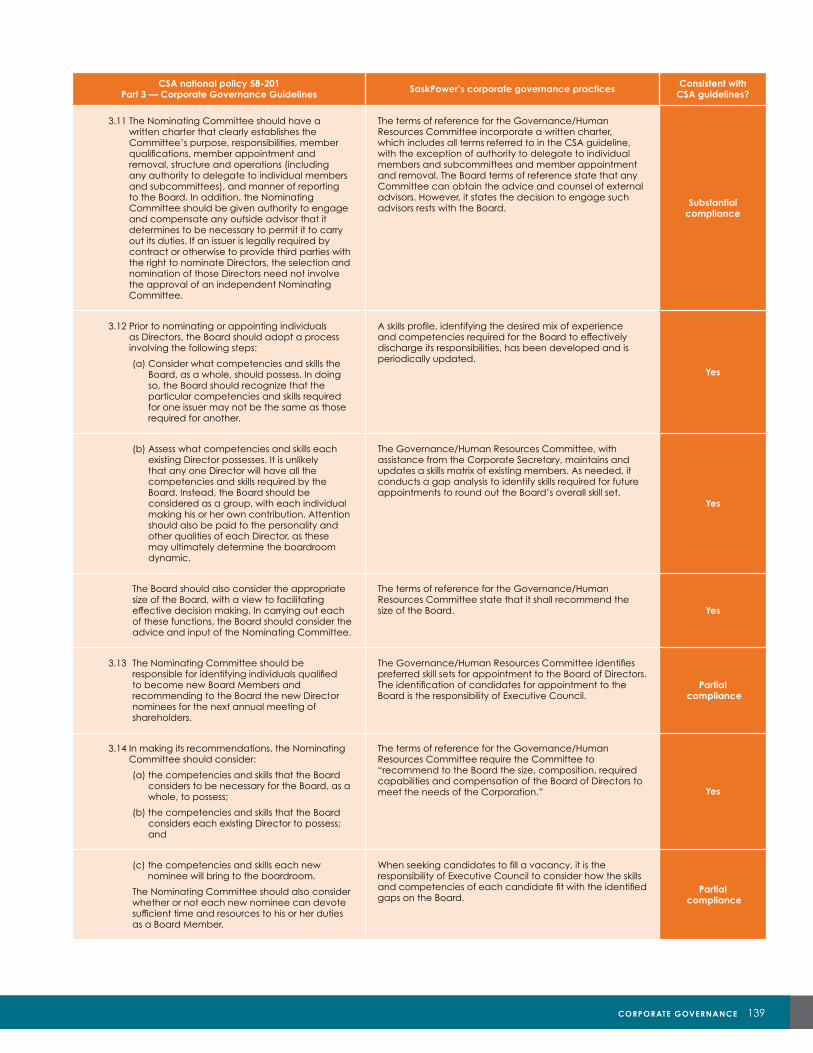
CORPORATE GOVERNANCE 139
CSA national policy 58-201Part 3 — Corporate Governance Guidelines SaskPower’s corporate governance practices Consistent with
CSA guidelines?
3.11 The Nominating Committee should have a written charter that clearly establishes the Committee’s purpose, responsibilities, member qualifications, member appointment and removal, structure and operations (including any authority to delegate to individual members and subcommittees), and manner of reporting to the Board. In addition, the Nominating Committee should be given authority to engage and compensate any outside advisor that it determines to be necessary to permit it to carry out its duties. If an issuer is legally required by contract or otherwise to provide third parties with the right to nominate Directors, the selection and nomination of those Directors need not involve the approval of an independent Nominating Committee.
The terms of reference for the Governance/Human Resources Committee incorporate a written charter, which includes all terms referred to in the CSA guideline, with the exception of authority to delegate to individual members and subcommittees and member appointment and removal. The Board terms of reference state that any Committee can obtain the advice and counsel of external advisors. However, it states the decision to engage such advisors rests with the Board. Substantial
compliance
3.12 Prior to nominating or appointing individuals as Directors, the Board should adopt a process involving the following steps:
(a) Consider what competencies and skills the Board, as a whole, should possess. In doing so, the Board should recognize that the particular competencies and skills required for one issuer may not be the same as those required for another.
A skills profile, identifying the desired mix of experience and competencies required for the Board to effectively discharge its responsibilities, has been developed and is periodically updated.
Yes
(b) Assess what competencies and skills each existing Director possesses. It is unlikely that any one Director will have all the competencies and skills required by the Board. Instead, the Board should be considered as a group, with each individual making his or her own contribution. Attention should also be paid to the personality and other qualities of each Director, as these may ultimately determine the boardroom dynamic.
The Governance/Human Resources Committee, with assistance from the Corporate Secretary, maintains and updates a skills matrix of existing members. As needed, it conducts a gap analysis to identify skills required for future appointments to round out the Board’s overall skill set.
Yes
The Board should also consider the appropriate size of the Board, with a view to facilitating effective decision making. In carrying out each of these functions, the Board should consider the advice and input of the Nominating Committee.
The terms of reference for the Governance/Human Resources Committee state that it shall recommend the size of the Board. Yes
3.13 The Nominating Committee should be responsible for identifying individuals qualified to become new Board Members and recommending to the Board the new Director nominees for the next annual meeting of shareholders.
The Governance/Human Resources Committee identifies preferred skill sets for appointment to the Board of Directors. The identification of candidates for appointment to the Board is the responsibility of Executive Council.
Partial compliance
3.14 In making its recommendations, the Nominating Committee should consider:
(a) the competencies and skills that the Board considers to be necessary for the Board, as a whole, to possess;
(b) the competencies and skills that the Board considers each existing Director to possess; and
The terms of reference for the Governance/Human Resources Committee require the Committee to “recommend to the Board the size, composition, required capabilities and compensation of the Board of Directors to meet the needs of the Corporation.” Yes
(c) the competencies and skills each new nominee will bring to the boardroom.
The Nominating Committee should also consider whether or not each new nominee can devote sufficient time and resources to his or her duties as a Board Member.
When seeking candidates to fill a vacancy, it is the responsibility of Executive Council to consider how the skills and competencies of each candidate fit with the identified gaps on the Board.
Partial compliance
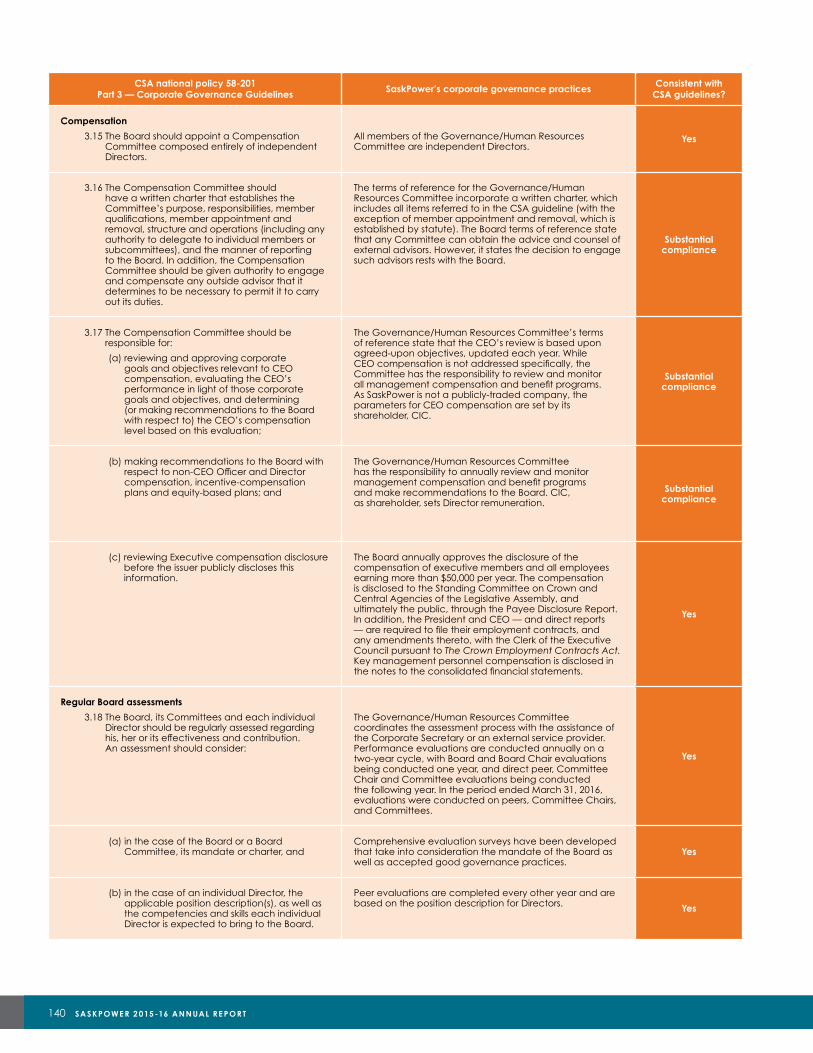
140 SASKPOWE R 2 015 -16 ANNUAL RE PORT
CSA national policy 58-201Part 3 — Corporate Governance Guidelines SaskPower’s corporate governance practices Consistent with
CSA guidelines?
Compensation
3.15 The Board should appoint a Compensation Committee composed entirely of independent Directors.
All members of the Governance/Human Resources Committee are independent Directors.
Yes
3.16 The Compensation Committee should have a written charter that establishes the Committee’s purpose, responsibilities, member qualifications, member appointment and removal, structure and operations (including any authority to delegate to individual members or subcommittees), and the manner of reporting to the Board. In addition, the Compensation Committee should be given authority to engage and compensate any outside advisor that it determines to be necessary to permit it to carry out its duties.
The terms of reference for the Governance/Human Resources Committee incorporate a written charter, which includes all items referred to in the CSA guideline (with the exception of member appointment and removal, which is established by statute). The Board terms of reference state that any Committee can obtain the advice and counsel of external advisors. However, it states the decision to engage such advisors rests with the Board.
Substantial compliance
3.17 The Compensation Committee should be responsible for:
(a) reviewing and approving corporate goals and objectives relevant to CEO compensation, evaluating the CEO’s performance in light of those corporate goals and objectives, and determining (or making recommendations to the Boardwith respect to) the CEO’s compensation level based on this evaluation;
The Governance/Human Resources Committee’s terms of reference state that the CEO’s review is based upon agreed-upon objectives, updated each year. While CEO compensation is not addressed specifically, the Committee has the responsibility to review and monitor all management compensation and benefit programs. As SaskPower is not a publicly-traded company, the parameters for CEO compensation are set by its shareholder, CIC.
Substantial compliance
(b) making recommendations to the Board with respect to non-CEO Officer and Director compensation, incentive-compensation plans and equity-based plans; and
The Governance/Human Resources Committee has the responsibility to annually review and monitor management compensation and benefit programs and make recommendations to the Board. CIC, as shareholder, sets Director remuneration.
Substantial compliance
(c) reviewing Executive compensation disclosure before the issuer publicly discloses this information.
The Board annually approves the disclosure of the compensation of executive members and all employees earning more than $50,000 per year. The compensation is disclosed to the Standing Committee on Crown and Central Agencies of the Legislative Assembly, and ultimately the public, through the Payee Disclosure Report. In addition, the President and CEO — and direct reports — are required to file their employment contracts, and any amendments thereto, with the Clerk of the Executive Council pursuant to The Crown Employment Contracts Act. Key management personnel compensation is disclosed in the notes to the consolidated financial statements.
Yes
Regular Board assessments
3.18 The Board, its Committees and each individual Director should be regularly assessed regarding his, her or its effectiveness and contribution. An assessment should consider:
The Governance/Human Resources Committee coordinates the assessment process with the assistance of the Corporate Secretary or an external service provider. Performance evaluations are conducted annually on a two-year cycle, with Board and Board Chair evaluations being conducted one year, and direct peer, Committee Chair and Committee evaluations being conducted the following year. In the period ended March 31, 2016, evaluations were conducted on peers, Committee Chairs, and Committees.
Yes
(a) in the case of the Board or a Board Committee, its mandate or charter, and
Comprehensive evaluation surveys have been developed that take into consideration the mandate of the Board as well as accepted good governance practices.
Yes
(b) in the case of an individual Director, the applicable position description(s), as well as the competencies and skills each individual Director is expected to bring to the Board.
Peer evaluations are completed every other year and are based on the position description for Directors. Yes
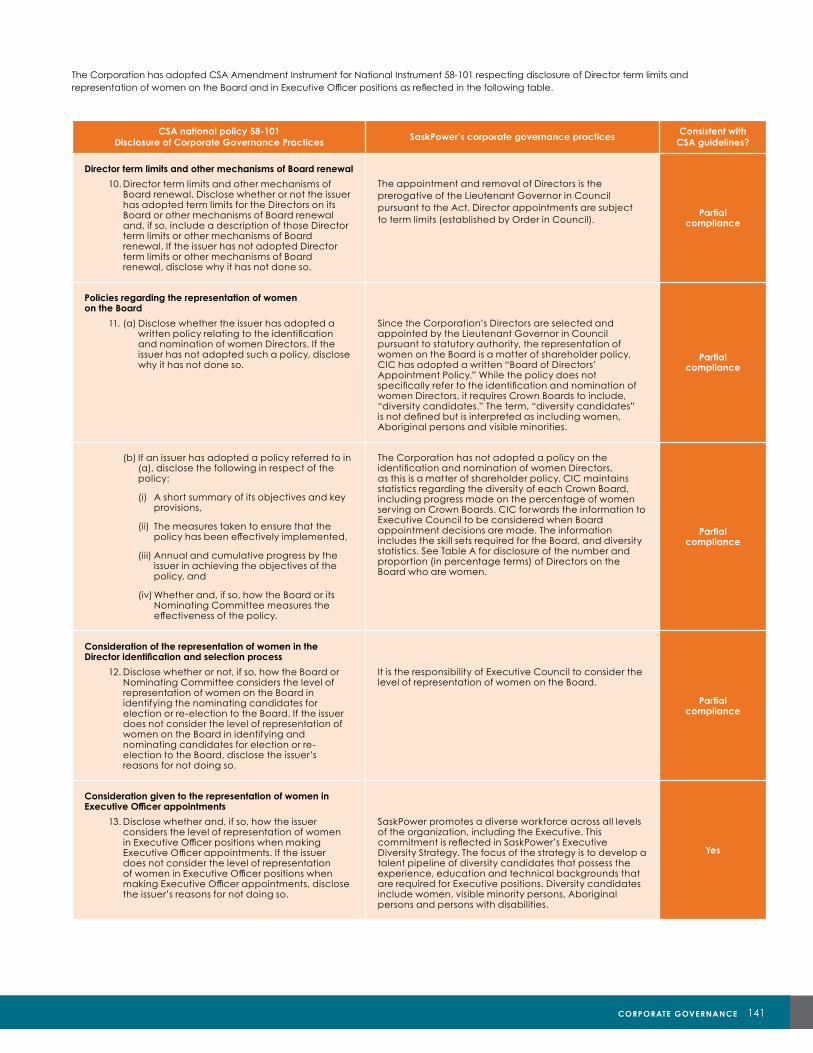
CORPORATE GOVERNANCE 141
CSA national policy 58-101Disclosure of Corporate Governance Practices SaskPower’s corporate governance practices Consistent with
CSA guidelines?
Director term limits and other mechanisms of Board renewal
10. Director term limits and other mechanisms of Board renewal. Disclose whether or not the issuer has adopted term limits for the Directors on its Board or other mechanisms of Board renewal and, if so, include a description of those Director term limits or other mechanisms of Board renewal. If the issuer has not adopted Director term limits or other mechanisms of Board renewal, disclose why it has not done so.
The appointment and removal of Directors is the prerogative of the Lieutenant Governor in Council pursuant to the Act. Director appointments are subject to term limits (established by Order in Council).
Partial compliance
Policies regarding the representation of women on the Board
11. (a) Disclose whether the issuer has adopted a written policy relating to the identification and nomination of women Directors. If the issuer has not adopted such a policy, disclose why it has not done so.
Since the Corporation’s Directors are selected and appointed by the Lieutenant Governor in Council pursuant to statutory authority, the representation of women on the Board is a matter of shareholder policy. CIC has adopted a written “Board of Directors’ Appointment Policy.” While the policy does not specifically refer to the identification and nomination of women Directors, it requires Crown Boards to include, “diversity candidates.” The term, “diversity candidates” is not defined but is interpreted as including women, Aboriginal persons and visible minorities.
Partial compliance
(b) If an issuer has adopted a policy referred to in (a), disclose the following in respect of the policy:
(i) A short summary of its objectives and key provisions,
(ii) The measures taken to ensure that the policy has been effectively implemented,
(iii) Annual and cumulative progress by the issuer in achieving the objectives of the policy, and
(iv) Whether and, if so, how the Board or its Nominating Committee measures the effectiveness of the policy.
The Corporation has not adopted a policy on the identification and nomination of women Directors, as this is a matter of shareholder policy. CIC maintains statistics regarding the diversity of each Crown Board, including progress made on the percentage of women serving on Crown Boards. CIC forwards the information to Executive Council to be considered when Board appointment decisions are made. The information includes the skill sets required for the Board, and diversity statistics. See Table A for disclosure of the number and proportion (in percentage terms) of Directors on the Board who are women.
Partial compliance
Consideration of the representation of women in the Director identification and selection process
12. Disclose whether or not, if so, how the Board or Nominating Committee considers the level of representation of women on the Board in identifying the nominating candidates for election or re-election to the Board. If the issuer does not consider the level of representation of women on the Board in identifying and nominating candidates for election or re-election to the Board, disclose the issuer’s reasons for not doing so.
It is the responsibility of Executive Council to consider the level of representation of women on the Board.
Partial compliance
Consideration given to the representation of women in Executive Officer appointments
13. Disclose whether and, if so, how the issuer considers the level of representation of women in Executive Officer positions when making Executive Officer appointments. If the issuer does not consider the level of representation of women in Executive Officer positions when making Executive Officer appointments, disclose the issuer’s reasons for not doing so.
SaskPower promotes a diverse workforce across all levels of the organization, including the Executive. This commitment is reflected in SaskPower’s Executive Diversity Strategy. The focus of the strategy is to develop a talent pipeline of diversity candidates that possess the experience, education and technical backgrounds that are required for Executive positions. Diversity candidates include women, visible minority persons, Aboriginal persons and persons with disabilities.
Yes
The Corporation has adopted CSA Amendment Instrument for National Instrument 58-101 respecting disclosure of Director term limits and representation of women on the Board and in Executive Officer positions as reflected in the following table.
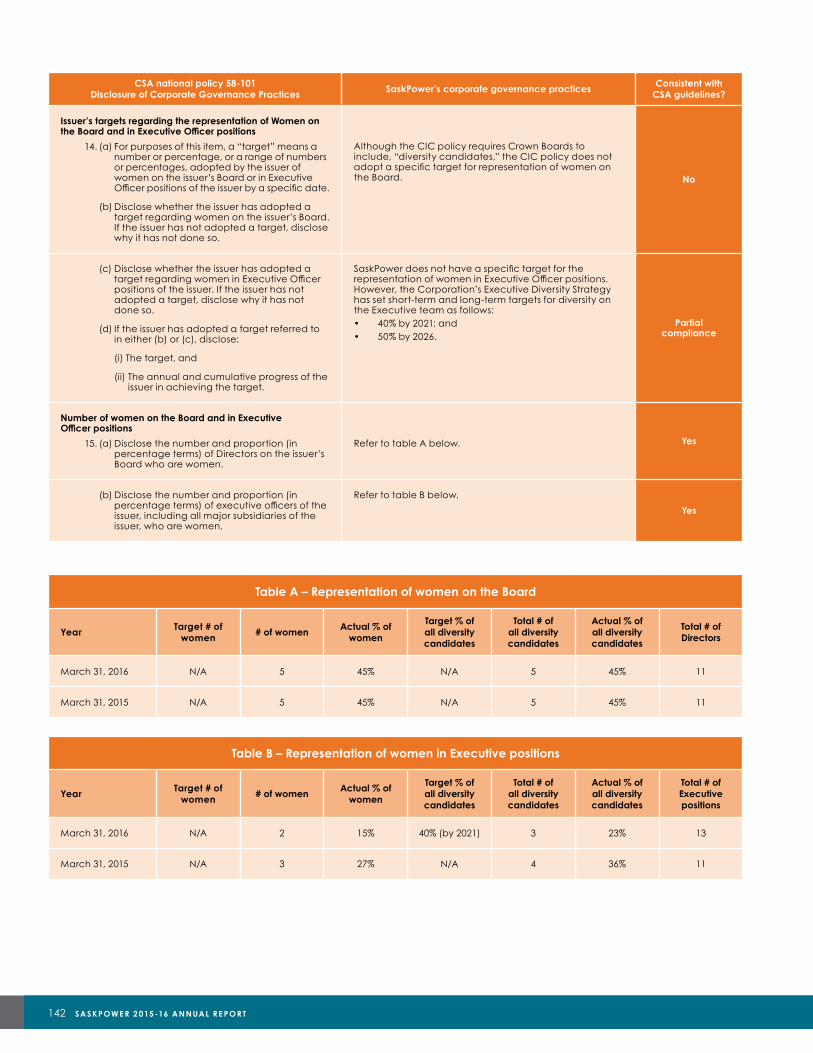
142 SASKPOWE R 2 015 -16 ANNUAL RE PORT
CSA national policy 58-101Disclosure of Corporate Governance Practices SaskPower’s corporate governance practices Consistent with
CSA guidelines?
Issuer’s targets regarding the representation of Women on the Board and in Executive Officer positions
14. (a) For purposes of this item, a “target” means anumber or percentage, or a range of numbers or percentages, adopted by the issuer of women on the issuer’s Board or in Executive Officer positions of the issuer by a specific date.
(b) Disclose whether the issuer has adopted a target regarding women on the issuer’s Board. If the issuer has not adopted a target, disclose why it has not done so.
Although the CIC policy requires Crown Boards to include, “diversity candidates,” the CIC policy does not adopt a specific target for representation of women on the Board. No
(c) Disclose whether the issuer has adopted a target regarding women in Executive Officer positions of the issuer. If the issuer has not adopted a target, disclose why it has not done so.
(d) If the issuer has adopted a target referred to in either (b) or (c), disclose:
(i) The target, and
(ii) The annual and cumulative progress of the issuer in achieving the target.
SaskPower does not have a specific target for the representation of women in Executive Officer positions. However, the Corporation’s Executive Diversity Strategy has set short-term and long-term targets for diversity on the Executive team as follows:• 40% by 2021; and• 50% by 2026.
Partial compliance
Number of women on the Board and in Executive Officer positions
15. (a) Disclose the number and proportion (in percentage terms) of Directors on the issuer’s Board who are women.
Refer to table A below. Yes
(b) Disclose the number and proportion (in percentage terms) of executive officers of the issuer, including all major subsidiaries of the issuer, who are women.
Refer to table B below.
Yes
Table A – Representation of women on the Board
YearTarget # of
women # of women
Actual % of women
Target % of all diversity candidates
Total # of all diversity candidates
Actual % of all diversity candidates
Total # of Directors
March 31, 2016 N/A 5 45% N/A 5 45% 11
March 31, 2015 N/A 5 45% N/A 5 45% 11
Table B – Representation of women in Executive positions
YearTarget # of
women # of women
Actual % of women
Target % of all diversity candidates
Total # of all diversity candidates
Actual % of all diversity candidates
Total # of Executive positions
March 31, 2016 N/A 2 15% 40% (by 2021) 3 23% 13
March 31, 2015 N/A 3 27% N/A 4 36% 11

CORPORATE GOVERNANCE 143
BOARD OF DIRECTORSAs at March 31, 2016
Rob Pletch Chair
Regina, Saskatchewan
Rob Pletch, Q.C., joined SaskPower’s Board of Directors as Chair in July 2013. Prior to this, he served as SaskEnergy’s Board Chair.
As counsel with MacPherson Leslie & Tyerman LLP in Regina, Mr. Pletch’s focus of law practice has been commercial and corporate law, securities, and mining law. He was Managing Partner at the firm from 1997-2001, and Chairman from 2003-2011.
Mr. Pletch holds a Bachelor of Arts (with Great Distinction) from the University of Saskatchewan and a Bachelor of Laws from Queen’s University. He was appointed Queen’s Counsel in 1989, and is Past President of the Law Society of Saskatchewan.
His community involvement includes serving as a Director and Board Chair for the Saskatchewan Roughriders, Governor of the Canadian Football League, Director of Canada Post Corporation, Director of Western Surety Company, Director of Great Western Brewing Company, and a Director and member of the Executive Committee of the Hospitals of Regina Foundation.
Bill Wheatley Vice-chair
Regina, Saskatchewan
Bill Wheatley is retired. He was formerly Managing Director, Chief Compliance Officer and General Counsel at Greystone Managed Investments Inc., a local investment management firm with more than $33 billion in assets under management. He is a member of the Board of Directors of VIA Rail Canada and is Past Chairman of the Saskatchewan Securities Commission.
Mr. Wheatley graduated from the University of Saskatchewan, where he earned a degree in both Commerce and Law. He was called to the bar in 1973. Before starting work with Greystone, Mr. Wheatley was the head of a Regina real estate firm and Chief of Staff to the Minister responsible for the Saskatchewan Department of Finance and the Department of Justice.
Merin Coutts Saskatoon, Saskatchewan
Merin Coutts joined the Board of Directors in February 2014. Prior to this, she served on the Saskatchewan Government Insurance Board where she chaired the HR and Governance Committee. In addition to her role on the SaskPower Board of Directors, Mrs. Coutts is the Chair of the Community Consultative Committee and a Board Director of the Saskatoon Airport Authority as well as the Chair of the Governance and Nominations Committee on the Saskatoon Regional Economic Development Authority Board of Directors.
Mrs. Coutts is the CEO of Merin Coutts Management Consulting, where she specializes in organizational effectiveness and change management solutions as well as governance and strategic planning facilitation. Prior to this she held a number of leadership positions in the telecommunications, cable and broadcast industries in Saskatchewan, including the role of Regional Manager for Shaw Communications Inc.’s Saskatchewan division.
Mrs. Coutts holds a Bachelor of Commerce from the University of Saskatchewan as well as a Chartered Director’s designation, a joint venture between the DeGroote School of Business and the Conference Board of Canada. She also holds a Chartered Professional Accountants (CPA, CMA) designation.
Judy Harwood Saskatoon, Saskatchewan
In October 2012, Ms. Harwood was elected Reeve of the Rural Municipality (RM) of Corman Park. Corman Park surrounds the city of Saskatoon and is the largest RM, by population, in Saskatchewan.
Ms. Harwood holds a certificate from Cornell University in Essentials of Hospitality Management along with her Certified Hotel Administrator (CHA) designation. Ms. Harwood was voted one of Saskatchewan’s 10 Women of Influence by Saskatchewan Business Magazine and awarded the Queen’s Golden Jubilee Medal for Outstanding Community Service.
In 2014, Ms. Harwood was elected Saskatchewan Association of Rural Municipalities Director representing Division 5 and she was also awarded the Lifetime Achievement Award from the North Saskatoon Business Association. Ms. Harwood has served on numerous Boards, including those of SaskTel, Saskatchewan Transportation Corporation, Saskatoon Prairieland Exhibition Park, Saskatoon and District Chamber of Commerce, Ronald McDonald House, Saskatoon Regional Economic Development Authority, Saskatoon Community Foundation and served as President of the North Saskatoon Business Association.

144 SASKPOWE R 2 015 -16 ANNUAL RE PORT
Jim HopsonRegina, Saskatchewan
Jim Hopson was born and raised in Regina, graduating from Thom Collegiate in 1969. He went on to earn a Bachelor of Education (with distinction) from the University of Regina and a Master of Education from the University of Oregon.
His teaching career began in 1972 in Ceylon, Saskatchewan, and in December 2004 he retired as the Director of Education for the Qu’Appelle Valley School Division.
Football was also a big part of his life, and after high school football he played four years with the Regina Rams. He was a multi-year all-star and was named Outstanding Lineman in the league in 1972. In 1973, he made the jump to the Saskatchewan Roughriders, playing until 1976.
In 2005, he returned to the Riders as their first ever full-time President and CEO, retiring in March 2015. The team appeared in four Grey Cups, winning two, with the latest coming on home turf in 2013. He was very involved in securing and planning for the new Mosaic Stadium scheduled to open in 2017.
Personally, Mr. Hopson has been named one of the Power 50 of Canadian Sports by the Globe and Mail; awarded both the Saskatchewan Centennial Medal and the Queen Elizabeth II Diamond Jubilee Medal; and recognized as one of Saskatchewan’s most influential men by Saskatchewan Business Magazine.
In 2014, Mr. Hopson was honoured with the Hugh Campbell Distinguished Leadership Award for his contributions to the Canadian Football League, the game of football and Canada’s sporting culture. In 2015, he was presented the Lifetime Achievement Award by the University of Regina Alumni Association.
Karri HowlettSaskatoon, Saskatchewan
Karri Howlett has over 18 years of experience in corporate strategy, mergers and acquisitions, financial due diligence, and risk analysis. Her knowledge is based on positions held with various financial institutions and as Principal of Karri Howlett Consulting Inc.
Ms. Howlett has conducted financial due diligence and risk analysis for several business endeavours, including business advisement and financial modelling for several mining and energy projects, and mergers of financial institutions ranging in size from $75 million to $3 billion in assets.
She is currently President and member of the Board of Directors of North Rim Exploration Ltd., a wholly owned subsidiary of RESPEC – a geosciences and engineering consulting firm based in Saskatoon, Saskatchewan. She led the company’s ownership transition from sole-proprietorship to 50% employee ownership and 50% institutional ownership in 2009, and subsequent sale to RSI Consulting Inc. in April 2016.
Ms. Howlett holds a Bachelor of Commerce, with Honours in Finance, from the University of Saskatchewan and has earned the Chartered Financial Analyst (CFA) designation and the Chartered Director Designation. An active community member, she has previously served on the Boards of the Varsity View Community Association, SkateSaskatoon, and CFA Society of Saskatchewan. She has been involved with the University of Saskatchewan’s Edwards School of Business as a lecturer in the Department of Finance, participant in the Leadership Development Program, and a protégé in the Betty-Ann Heggie Womentorship Program. She currently sits on the Boards of North Rim Exploration Ltd. and RSI Consulting Inc.
John HyshkaSaskatoon, Saskatchewan
John Hyshka, President of Hyshka + Associates, is currently a consultant. He works with clients in the corporate finance, corporate development and strategic management areas, mainly in the life sciences sector.
Prior to this, he was the Director of Economic Development of the Saskatoon Regional Economic Development Authority (SREDA) for six years and had been directly involved in the development of the agriculture biotechnology and manufacturing cluster. He was also a founding Board Member of the Saskatchewan Nutraceutical Network. After leaving SREDA, he joined Performance Plants Inc. as Chief Financial Officer with a focus on raising capital and selling technology.
Mr. Hyshka has sat on two venture capital advisory boards in Canada, was on the Board of the Saskatoon and Saskatchewan Chambers of Commerce, and the Business Development Bank of Canada. He has also been an advisor to Working Ventures for a number of years.
In 2000, he started Phenomenome Discoveries Inc. (PDI), a human health research company, with a scientist. The company launched COLOGIC®, a simple test to help assess risk for colorectal cancer. In 2015, he left Phenomenome and started his consulting firm. Mr. Hyshka is currently the Chairman of the Board of Defyrus Inc., a life science company that develops anti-viral drugs and vaccines.
Bryan LeverickSaskatoon, Saskatchewan
Bryan Leverick is the President of Saskatchewan-based Alliance Energy Ltd., and has been with the company since 1974. In addition to his role on the SaskPower Board of Directors, Mr. Leverick is a Board Member of Ducks Unlimited Canada and the Saskatoon Club. He is the Past Chair of the Royal University Hospital Foundation’s Board of Directors and Past Chairman of the Canadian Electrical Contractors Association.
Mr. Leverick has served as Past President of the Saskatchewan Construction Association, Saskatchewan Bid Depository, Saskatoon Construction Association, and Electrical Contractors Association. He is also a Past Chairman of the Saskatoon Regional Economic Development Authority, the Saskatoon City Hospital Foundation, as well as an avid supporter of the Ronald McDonald House and the Farm in the Dell. In 2003, he was honoured with the Distinguished Service Award by the Saskatchewan Construction Association, and received the Person of the Year Award in 2006.

CORPORATE GOVERNANCE 145
Mick MacBean Calgary, Alberta
Mick MacBean joined Calgary-based private equity firm, TriWest Capital Partners, in 2010 and is a Senior Managing Director of the firm. From 1998 to 2010, he served as the CEO and Director of Diamond Energy Services, a Swift Current-based energy services company that he founded. Prior to that role, Mr. MacBean was employed by ARC Financial Corporation in a variety of disciplines, including merchant banking and private equity.
Mr. MacBean is the Lead Independent Director and Chair of the Audit Committee for Peyto Exploration and Development, a large natural gas producer listed on the TSE. He is a Director of numerous Western Canadian-based private businesses within the TriWest portfolio of companies, and also serves on the Board of the Saskatchewan Hockey Hall of Fame.
Mr. MacBean holds a Bachelor of Commerce degree from the University of Saskatchewan and is also a Chartered Professional Accountant (CPA, CA) and Chartered Director. He was recognized with the Gilbert Bennett Outstanding Graduating Director award by McMaster University, DeGroote School of Business.
Leslie Neufeld Swift Current, Saskatchewan
Leslie Neufeld holds a Bachelor of Administration degree from the University of Regina, and obtained her Chartered Professional Accountant (CPA, CA) designation in 1996. Ms. Neufeld began her public practice career with Deloitte & Touche in Regina, Saskatchewan, and relocated to her hometown of Swift Current in 1996 to join Stark & Marsh CPA, LLP.
Ms. Neufeld became a partner in 2006 and currently focuses on the Technical Services business unit, which provides tax and compliance services to individuals and corporations. She has also worked extensively in the field of trust and estate taxation. From 2012 to present, she has served as the Chairperson of the Board of Directors of Stark & Marsh CPA, LLP. From June 2008 to June 2010 she served as a member of Council for the Institute of Chartered Accountants of Saskatchewan and has also participated on the Institute’s Practice Appraisal Committee.
Tammy J. Van Lambalgen Saskatoon, Saskatchewan
Tammy Van Lambalgen obtained her Bachelor of Arts degree in 1990 and her Bachelor of Laws degree in 1993, both from the University of Saskatchewan. Following graduation, she worked in Calgary for 10 years as a solicitor and as in-house counsel.
In 2003, Ms. Van Lambalgen returned to Saskatoon, joining AREVA Resources Canada. In 2008, she was promoted to Vice-president, Regulatory Affairs and General Counsel. Since that time, Ms. Van Lambalgen has had the responsibility for several different functions, most recently as Vice-president, Corporate Affairs and General Counsel.
Ms. Van Lambalgen has been on the SaskPower Board of Directors since 2013. She is also on the Board of Directors of AREVA Resources Canada, the Saskatchewan Mining Association and the Children’s Discovery Museum on the Saskatchewan.
Dale Bloom Corporate Secretary
Regina, Saskatchewan
Dale Bloom works for CIC, the holding company for Saskatchewan’s commercial Crown corporations. He was part of a team at CIC that won the Lieutenant Governor’s Gold Medal for Outstanding Public Service in Saskatchewan, as well as a Certificate of Achievement in the International Awards Programme for work in governance and performance management of public enterprises.
Mr. Bloom has worked in the public sector for over 20 years in various capacities. He has several degrees, most recently attaining his MBA in 2011 from the Kenneth Levene Graduate School of Business at the University of Regina. He has been and continues to be involved in various charitable activities in Regina.
COMPENSATIONUnder the authority of The Crown Corporations Act, 1993, SaskPower’s shareholder, CIC, directs the compensation received by Directors. In addition to reimbursement for reasonable expenses incurred while performing their duties (including related travel, meal and accommodation costs), Directors receive an annual retainer and meeting fees for service:
• The Board Chair receives an annual retainer of $40,000.
• Board Members receive an annual retainer of $25,000.
• The Audit & Finance Committee Chair receives an annual retainer of $3,500.
• Other Committee Chairs receive an annual retainer of $2,500.
• Committee members receive a $750 daily meeting fee.

146 SASKPOWE R 2 015 -16 ANNUAL RE PORT
EXECUTIVE TEAMAs at March 31, 2016
Mike Marsh President and CEO
On April 3, 2015, Mike Marsh was appointed President and Chief Executive Officer.
Mr. Marsh was previously Vice-president of Operations and Chief Operations Officer since October 2012. In this position, he had responsibility of all operational issues for Power Production, Transmission Services and Distribution Services at SaskPower.
He has over 35 years of experience and joined SaskPower in 1991, following 12 years in the construction industry in Alberta and Saskatchewan. Once at SaskPower, he spent nine years in engineering and maintenance supervisory positions at the Boundary Dam Power Station and in Power Production before serving as the Manager of Business and Financial Planning in Corporate and Financial Services for six years. He was appointed Vice-president of Transmission & Distribution in March 2007 and led this business unit through a period of change, transition and unprecedented growth in the province.
He attended the University of Saskatchewan, where he earned a Bachelor of Science degree in Mechanical Engineering. He later studied at Queen’s School of Business and earned a Master’s Degree in Business Administration. He is a member of the Association of Professional Engineers and Geoscientists of Saskatchewan.
He currently represents SaskPower on the Board of the Canadian Electricity Association (CEA) and is also Past Chair of the CEA Transmission Council. He has held positions on the CEA Distribution Council and the CEA Occupational Health and Safety Task Group.
Mr. Marsh is a Past President of the local chapter of the Canadian Progress Club – Regina Centre, a service organization offering financial assistance to charities supporting children and wellness.
Diane AveryVice-president, Customer Services
Diane Avery is a Saskatchewan native with over 27 years of experience in the utility Crown sector in both monopoly and competitive markets.
Ms. Avery joined SaskPower in 2012 and currently holds the position of Vice-president, Customer Services. She previously held a variety of roles, including Vice-president, Commercial, at SaskPower and prior to that several roles with SaskTel including Director of Technology, Director of Marketing and Director of Business Simplification. In her past positions, Ms. Avery has focused on delivering a positive customer experience and has implemented innovative solutions to customer, employee and supplier challenges.
Ms. Avery holds a Bachelor of Administration from the University of Regina. She has completed numerous professional development programs, including Creating a Culture of Innovation at the Kellogg School of Management at Northwestern University and the Executive Marketing Program at the University of Western Ontario’s Richard Ivey School of Business.
She has also been the past Board President and Chair of the Queen City Kinsmen Gymnastics Club, as well as past Board Member on the Canadian Wireless Telecommunications Association and the Saskatchewan Science Centre. She currently represents SaskPower on the Customer Council for the Canadian Electricity Association.
Guy BruceVice-president, Planning, Environment and Sustainable Development
Guy Bruce is a Saskatchewan native with over 35 years in the electricity industry. Throughout his career he has served in a variety of roles, which include plant engineering, system operations, energy trading, risk management, business planning and asset management.
Mr. Bruce was appointed to the SaskPower Executive in September 2011. Since that time he has been responsible for a number of functions, including environment, regulatory affairs, system planning, project delivery and properties. He is currently responsible for strategic planning, environment, sustainability, integrated resource planning and development of major supply options including clean energy, hydro, carbon capture and procurement from independent power producers.
Mr. Bruce is a professional electrical engineer who graduated from the University of Saskatchewan.

CORPORATE GOVERNANCE 147
Kory Hayko Vice-president, Commercial and Industrial Operations, and President
and CEO, NorthPoint Energy Solutions
Kory Hayko was appointed Vice-president, Commercial and Industrial Operations, in June 2015. Since July 2014, he has held the position of President and CEO, NorthPoint Energy Solutions, a wholly owned subsidiary of SaskPower. In July 2014 he also became Acting Vice-president, Fuel and Cross-Crown Collaboration, and prior to that served as Acting Vice-president, Customer Services.
Mr. Hayko has more than 25 years of experience in numerous roles with SaskPower. Before moving into his present position, he was Director, Energy Management and Trading, for NorthPoint Energy Solutions.
Mr. Hayko graduated from the University of Regina with a Bachelor of Applied Science in Industrial Systems Engineering, and has a Masters of Applied Science in Energy Systems. He is a member of the Association of Professional Engineers and Geoscientists of Saskatchewan and sits on the Board of the BHP Billiton-SaskPower CCS Knowledge Centre.
Outside of SaskPower, Mr. Hayko is an active member in the community. He has been for many years involved with Regina Minor Softball as an Executive Member for Zone 4 as well as coach. He also volunteers his time with the Heart and Stroke Foundation, Canadian Cancer Society, MS Society of Canada and Canadian Diabetes Association.
Sandeep Kalra Vice-president, Finance,
and Chief Financial Officer
Sandeep Kalra joined SaskPower after eight years in various positions with Finning International, the world’s largest Caterpillar distributor. Mr. Kalra’s career with Finning began in 2000 as the Director of Finance and Corporate Controller. He went on to become Vice-president of Finance for Finning South America based in Chile and then Vice-president and Corporate Treasurer at the company’s head office in Vancouver. Prior to his work with Finning, Mr. Kalra held financial positions with Hertz Corporation, PepsiCo, Deloitte and Samtel India.
He is a Chartered Professional Accountant (CPA, CA) through the Chartered Professional Accountants of Canada and a Chartered Accountant through the Institute of Chartered Accountants of India. Mr. Kalra holds a Bachelor of Commerce degree with honours from Delhi University, an MBA from the Stern School of Business at New York University and an ICD.D designation from the Institute of Corporate Directors.
Tim Eckel Vice-president,
Transmission Services
Tim Eckel was appointed Vice-president, Transmission Services, in June 2015. He has over 30 years of experience in numerous roles within SaskPower, most recently as Senior Director, Transmission Services.
Mr. Eckel has a Bachelor of Science in electrical engineering from the University of Saskatchewan, and an MBA from the University of Regina. He is a professional engineer and member of the Association of Professional Engineers and Geoscientists of Saskatchewan. He represents SaskPower on the Canadian Electricity Association Transmission Council, is an active member of a local service club and has volunteered with a number of charitable and community organizations.
Ted Elliott Vice-president,
Distribution Services
Ted Elliott was appointed Vice-president, Distribution Services, in June 2015. He first joined SaskPower in 1980, gaining experience in various areas in SaskPower including Transmission and Distribution, Operations, Training and Development, Customer Services and Human Resources.
As a second-generation power line technician, he credits his background and professional development to SaskPower and the opportunities the company has provided through a 35-year career that began out of high school, as a project labourer at Boundary Dam Power Station. He spent 11 years in the field, leaving his last posting in Maple Creek in pursuit of a training instructor role in his hometown of Weyburn. Future endeavours included the subsequent roles of Business Manager in the former Swift Current Region and eventual appointment as Region Manager (Transmission & Distribution) in Prince Albert.
Five years later, he pursued a leadership role in Human Resources in the areas of labour relations, recruitment and organizational development. He returned to Operations in 2005 in Saskatoon, leading to his appointment as General Manager/Senior Director of Distribution Services. He performed this role through the period of 2010-2015 where he and his team led the division through a major period of change, transition and unprecedented growth in the province. Mr. Elliott represents SaskPower on the Canadian Electricity Association Distribution Council.

148 SASKPOWE R 2 015 -16 ANNUAL RE PORT
Brian Ketcheson Vice-president, Human Resources and Stakeholder Relations
Brian Ketcheson was appointed Vice-president, Human Resources and Stakeholder Relations, in July 2015. A veteran of more than 32 years in the utility business, Mr. Ketcheson began his career as a power technician with Manitoba Hydro. Over the years, he took on numerous leadership roles in Corporate Services, Operations, System Control, Aboriginal Relations, Human Resources and with Manitoba Hydro International. His most recent role was as Senior Vice-president, U.S. Operations, with Algonquin Power.
Mr. Ketcheson has also taken a keen interest in continuous learning, in both instrumentation and as a power electrician from Red River College. He has an MBA from Queen’s University and is a Chartered Professional Accountant (CPA, CMA).
Mr. Ketcheson enjoys being involved in his community. He served on a number of community organizations and charity Boards in Manitoba, including the Humane Society, Salvation Army, YM/YWCA, and was a founding member of the Amadeus Steen Foundation, a children’s charity to raise money for at-risk children.
Howard MatthewsVice-president, Power Production, and President & CEO, SaskPower International
Howard Matthews was appointed Vice-president, Power Production, and President and CEO of SaskPower International in June 2015, after serving as Acting Vice-president, Power Production, since July 2014. He has held a number of positions during his career with SaskPower, beginning as an Electrical Engineer in 1989. Prior to joining the Executive, he was Director at Poplar River Power Station, a position he held since 2009.
Prior to joining SaskPower, Mr. Matthews worked as a computer programmer for the Saskatchewan Research Council, Northern Telecom and Saskatchewan Mining and Development Corporation. He also spent time as a Field Engineer with Husky Injection in Toronto. Mr. Matthews holds Bachelor’s degrees from the University of Saskatchewan in Commerce and Electrical Engineering.
Michael MoneaPresident, Carbon Capture and Storage Initiatives
Michael J. Monea joined SaskPower in 2008 as Vice-president, Carbon Capture and Storage Initiatives. In September 2011, he was appointed President of this division.
Prior to his role with SaskPower, Mr. Monea was a Senior Vice-president with Canada Capital Energy Corporation. He also served as Executive Director of the Petroleum Technology Research Centre at the University of Regina and later was appointed Chair of the Board. In 2008, he was appointed to the Society of Petroleum Engineers Distinguished Lecture Program as an expert in enhanced oil recovery.
Early on in his professional career he was trained in oil and gas operations in the United States. He created his own consulting/oil company in 1982, Nautilus Exploration and Associates Ltd., which is still an active Canadian oil and gas company.
Mr. Monea holds Professional Engineer and Geoscientist designations and is a member of the Canadian Institute of Corporate Directors.
Grant Ring Vice-president, Procurement and Supply Chain
Grant Ring was appointed Vice-president, Procurement and Supply Chain, in June of 2015. He previously held the positions of Vice-president, Business Development; President and Chief Executive Officer of NorthPoint Energy Solutions; and Acting Vice-president and Chief Financial Officer, Corporate and Financial Services.
From 2001 to 2007, Mr. Ring held the position of Treasurer, Financial Services, with Corporate and Financial Services. Prior to that, Mr. Ring spent 11 years in various positions with SaskPower. Before joining SaskPower in 1990, he was employed in various accounting positions in private sector manufacturing and construction. His work experience includes project and asset accounting; general accounting and reporting; business development; procurement; treasury and banking; and pension plans.
Mr. Ring is the Chair of the Power Corporation Superannuation Plan and a Board member of the Regina Qu’Appelle Health Region. He held the position of Chair of Financial Executives International Canada and Vice-Chair of the Public Employees Pension Plan (PEPP), as well as serving on other non-profit Boards.
Mr. Ring is a graduate of Queen’s University, holding a Master of Business Administration. He is a Chartered Professional Accountant (CPA, CMA). His contributions to the financial community were recognized in 2008 when he was named a Fellow of the Society of Management Accountants (FCMA). In 2007, he completed a certificate in executive coaching, and in 2011 achieved his ICD.D designation from the Institute of Corporate Directors.
Brad StromVice-president, Information Technology and Security, and Chief Information Officer
Brad Strom was hired as Vice-president, Information Technology and Security, and Chief Information Officer, in July 2015. Before joining SaskPower, Mr. Strom worked at Farm Credit Canada (FCC) as Vice-president, Development and Operations. During his time at FCC, he took on a number of leadership roles, where he was accountable for all aspects of the IT and Enterprise Security functions.
Prior to FCC, Mr. Strom had the opportunity to work in a number of countries such as Brazil, Argentina and England in industries such as healthcare, insurance, banking and government. The companies include SHL Systemhouse, IBM and PwC Canada.
Mr. Strom is a graduate of Carleton University in Ottawa, where he obtained a Bachelor of Science in Computer Systems Engineering. Mr. Strom is also involved in the community, and is a committed Board Member for the Caring Place, a non-profit counselling centre. He is also a provincial Board Member for Junior Achievement of Saskatchewan.

CORPORATE GOVERNANCE 149
Rachelle Verret Morphy Vice-president, Law, Land and Regulatory
Affairs, General Counsel and Assistant Secretary
Rachelle Verret Morphy joined SaskPower in 2005 as Assistant General Counsel with the Law Department. She was appointed Vice-president in 2011, with responsibility for overseeing the Law, Land and Regulatory Affairs division and advising the President, Executive and Board of Directors on governance issues.
Previously, Ms. Verret Morphy worked for a federally regulated financial institution where she was responsible for providing advice on legal, tax and regulatory matters. Ms. Verret Morphy also worked in the private practice of law for a number of years at a major Saskatchewan law firm, with a focus on procurement, construction, information technology and taxation.
Ms. Verret Morphy is both a lawyer and a Chartered Professional Accountant (CPA, CA), and holds an ICD.D from the Institute of Corporate Directors. She has a Bachelor of Laws from the University of Saskatchewan, and a Bachelor of Commerce (honours) from the University of Ottawa. She is a member of the Law Society of Saskatchewan, the Canadian Bar Association, the Chartered Professional Accountants of Saskatchewan, the Chartered Professional Accountants of Ontario, the Canadian Corporate Counsel Association and the Association of Corporate Counsel. She also volunteers as a legal advisor with Pro Bono Students Canada.
COMPENSATIONCIC has established a framework for executive compensation, and SaskPower’s Board can approve compensation packages within that framework. The Board has delegated responsibility for addressing and making recommendations concerning executive compensation issues to the Governance/Human Resources Committee. Executive performance is assessed annually against corporate and individual objectives that are aligned with our company’s Strategic Plan. The mandate for executive compensation for Saskatchewan Crown corporations is established and monitored by CIC.
Direct reports of SaskPower’s President & CEO, including all executive members, are required by legislation to file and report the details of their compensation and benefits and any changes to the Clerk of the Saskatchewan Legislature within 14 days of occurrence. In addition, the Crown and Central Agencies Committee of the Legislative Assembly of Saskatchewan requires Crown corporations, including SaskPower, to file an annual payee list that includes the total compensation of executive members.
Salary ranges for SaskPower’s Executive team, as of March 31, 2016, were:
• President and CEO: $346,440 to $433,049.
• Vice-president: $238,918 to $298,648.
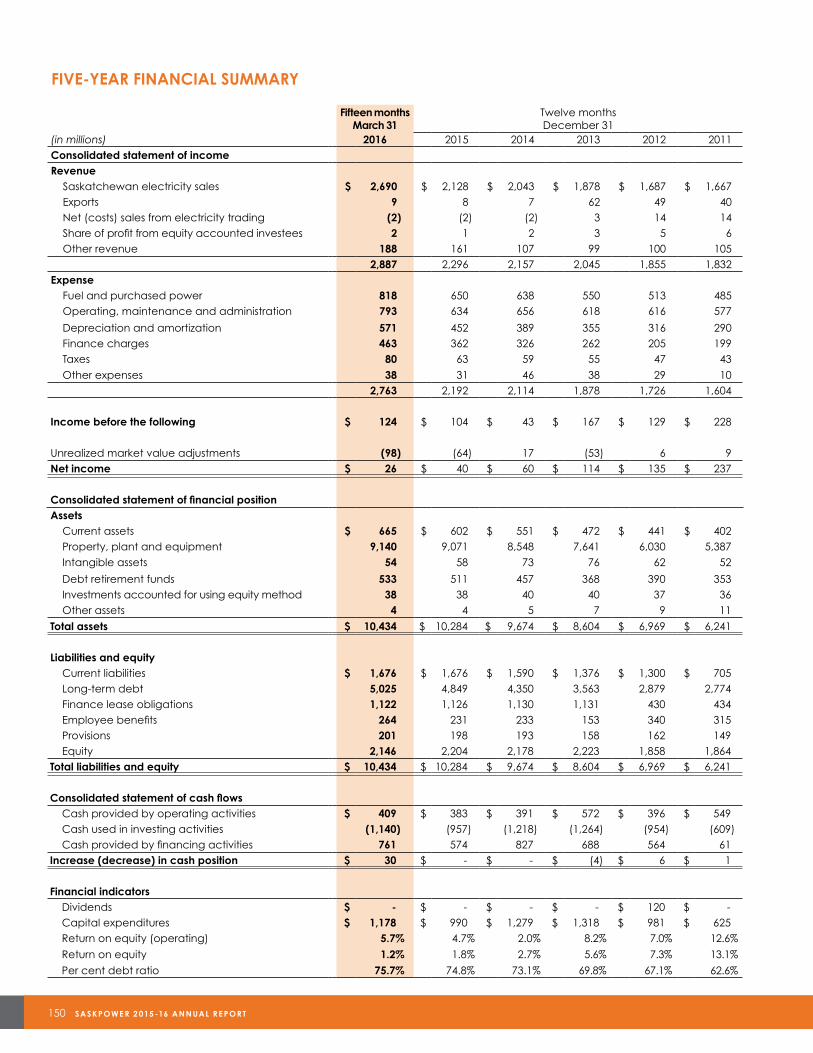
150 SASKPOWE R 2 015 -16 ANNUAL RE PORT
FIVE-YEAR FINANCIAL SUMMARY
Fifteen monthsMarch 31
Twelve monthsDecember 31
(in millions) 2016 2015 2014 2013 2012 2011Consolidated statement of incomeRevenue
Saskatchewan electricity sales $ 2,690 $ 2,128 $ 2,043 $ 1,878 $ 1,687 $ 1,667 Exports 9 8 7 62 49 40
Net (costs) sales from electricity trading (2) (2) (2) 3 14 14 Share of profit from equity accounted investees 2 1 2 3 5 6Other revenue 188 161 107 99 100 105
2,887 2,296 2,157 2,045 1,855 1,832Expense
Fuel and purchased power 818 650 638 550 513 485Operating, maintenance and administration 793 634 656 618 616 577
Depreciation and amortization 571 452 389 355 316 290Finance charges 463 362 326 262 205 199
Taxes 80 63 59 55 47 43
Other expenses 38 31 46 38 29 102,763 2,192 2,114 1,878 1,726 1,604
Income before the following $ 124 $ 104 $ 43 $ 167 $ 129 $ 228
Unrealized market value adjustments (98) (64) 17 (53) 6 9Net income $ 26 $ 40 $ 60 $ 114 $ 135 $ 237
Consolidated statement of financial positionAssets
Current assets $ 665 $ 602 $ 551 $ 472 $ 441 $ 402Property, plant and equipment 9,140 9,071 8,548 7,641 6,030 5,387Intangible assets 54 58 73 76 62 52
Debt retirement funds 533 511 457 368 390 353 Investments accounted for using equity method 38 38 40 40 37 36Other assets 4 4 5 7 9 11
Total assets $ 10,434 $ 10,284 $ 9,674 $ 8,604 $ 6,969 $ 6,241
Liabilities and equityCurrent liabilities $ 1,676 $ 1,676 $ 1,590 $ 1,376 $ 1,300 $ 705Long-term debt 5,025 4,849 4,350 3,563 2,879 2,774Finance lease obligations 1,122 1,126 1,130 1,131 430 434Employee benefits 264 231 233 153 340 315
Provisions 201 198 193 158 162 149 Equity 2,146 2,204 2,178 2,223 1,858 1,864Total liabilities and equity $ 10,434 $ 10,284 $ 9,674 $ 8,604 $ 6,969 $ 6,241
Consolidated statement of cash flowsCash provided by operating activities $ 409 $ 383 $ 391 $ 572 $ 396 $ 549Cash used in investing activities (1,140) (957) (1,218) (1,264) (954) (609)Cash provided by financing activities 761 574 827 688 564 61
Increase (decrease) in cash position $ 30 $ - $ - $ (4) $ 6 $ 1
Financial indicators Dividends $ - $ - $ - $ - $ 120 $ -
Capital expenditures $ 1,178 $ 990 $ 1,279 $ 1,318 $ 981 $ 625Return on equity (operating) 5.7% 4.7% 2.0% 8.2% 7.0% 12.6%
Return on equity 1.2% 1.8% 2.7% 5.6% 7.3% 13.1%
Per cent debt ratio 75.7% 74.8% 73.1% 69.8% 67.1% 62.6%
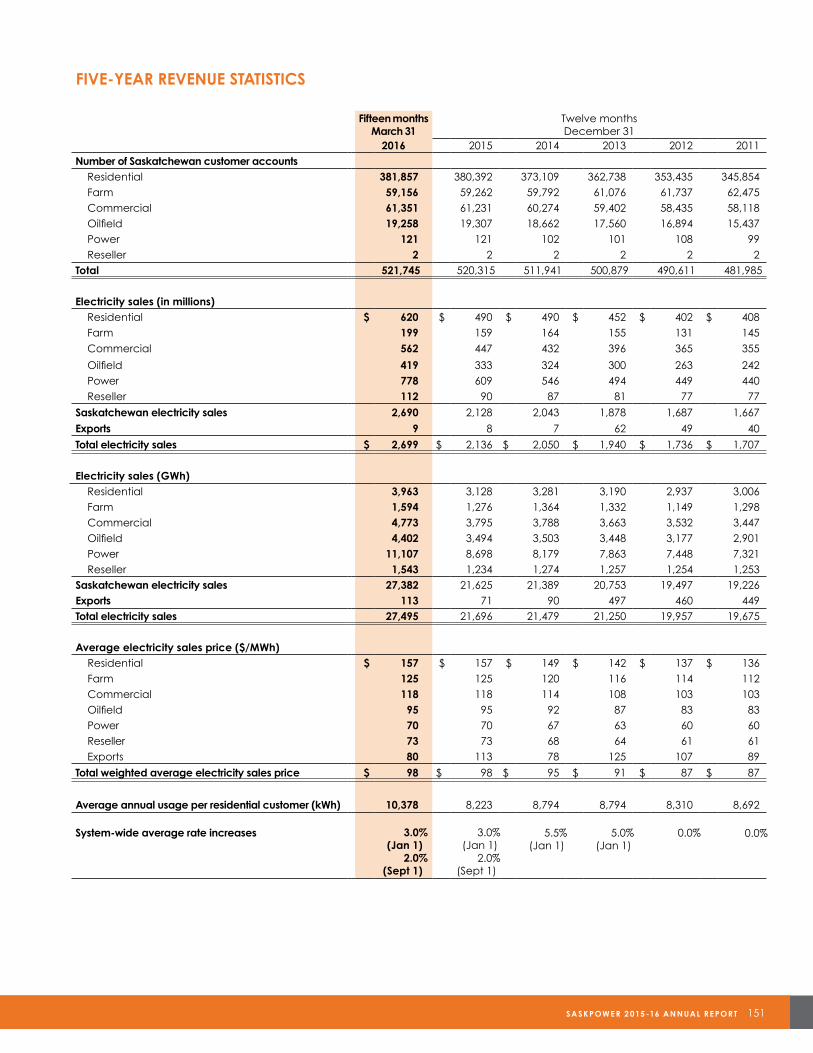
MANAGEMENT’S DISCUSSION AND ANALYSIS 151
FIVE-YEAR REVENUE STATISTICS
Fifteen monthsMarch 31
Twelve monthsDecember 31
2016 2015 2014 2013 2012 2011Number of Saskatchewan customer accounts Residential 381,857 380,392 373,109 362,738 353,435 345,854 Farm 59,156 59,262 59,792 61,076 61,737 62,475 Commercial 61,351 61,231 60,274 59,402 58,435 58,118 Oilfield 19,258 19,307 18,662 17,560 16,894 15,437 Power 121 121 102 101 108 99 Reseller 2 2 2 2 2 2Total 521,745 520,315 511,941 500,879 490,611 481,985
Electricity sales (in millions) Residential $ 620 $ 490 $ 490 $ 452 $ 402 $ 408 Farm 199 159 164 155 131 145 Commercial 562 447 432 396 365 355
Oilfield 419 333 324 300 263 242 Power 778 609 546 494 449 440 Reseller 112 90 87 81 77 77
Saskatchewan electricity sales 2,690 2,128 2,043 1,878 1,687 1,667
Exports 9 8 7 62 49 40
Total electricity sales $ 2,699 $ 2,136 $ 2,050 $ 1,940 $ 1,736 $ 1,707
Electricity sales (GWh) Residential 3,963 3,128 3,281 3,190 2,937 3,006 Farm 1,594 1,276 1,364 1,332 1,149 1,298 Commercial 4,773 3,795 3,788 3,663 3,532 3,447 Oilfield 4,402 3,494 3,503 3,448 3,177 2,901 Power 11,107 8,698 8,179 7,863 7,448 7,321 Reseller 1,543 1,234 1,274 1,257 1,254 1,253Saskatchewan electricity sales 27,382 21,625 21,389 20,753 19,497 19,226Exports 113 71 90 497 460 449Total electricity sales 27,495 21,696 21,479 21,250 19,957 19,675
Average electricity sales price ($/MWh) Residential $ 157 $ 157 $ 149 $ 142 $ 137 $ 136 Farm 125 125 120 116 114 112 Commercial 118 118 114 108 103 103 Oilfield 95 95 92 87 83 83 Power 70 70 67 63 60 60 Reseller 73 73 68 64 61 61 Exports 80 113 78 125 107 89
Total weighted average electricity sales price $ 98 $ 98 $ 95 $ 91 $ 87 $ 87
Average annual usage per residential customer (kWh) 10,378 8,223 8,794 8,794 8,310 8,692
System-wide average rate increases 3.0%(Jan 1)
2.0%(Sept 1)
3.0%(Jan 1)
2.0%(Sept 1)
5.5%(Jan 1)
5.0%(Jan 1)
0.0% 0.0%
SASKPOWE R 2 015 -16 ANNUAL RE PORT 151
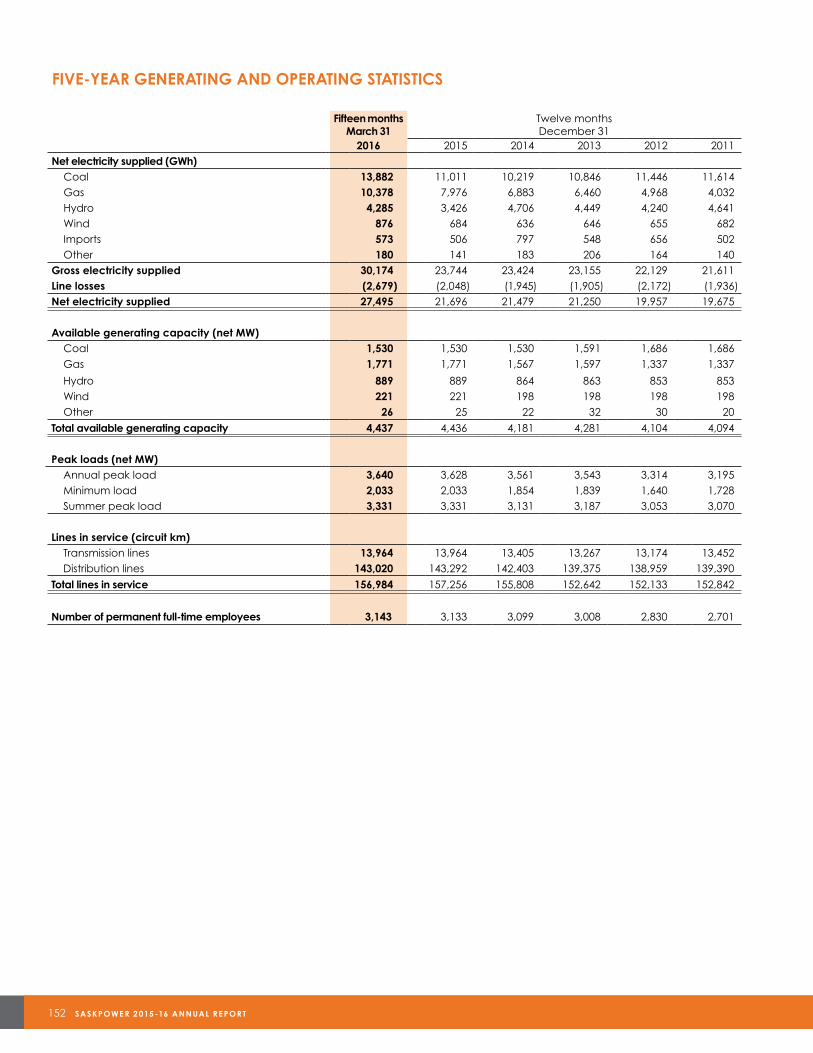
152 SASKPOWE R 2 015 -16 ANNUAL RE PORT
FIVE-YEAR GENERATING AND OPERATING STATISTICS
Fifteen monthsMarch 31
Twelve monthsDecember 31
2016 2015 2014 2013 2012 2011Net electricity supplied (GWh) Coal 13,882 11,011 10,219 10,846 11,446 11,614 Gas 10,378 7,976 6,883 6,460 4,968 4,032 Hydro 4,285 3,426 4,706 4,449 4,240 4,641 Wind 876 684 636 646 655 682 Imports 573 506 797 548 656 502 Other 180 141 183 206 164 140Gross electricity supplied 30,174 23,744 23,424 23,155 22,129 21,611Line losses (2,679) (2,048) (1,945) (1,905) (2,172) (1,936)Net electricity supplied 27,495 21,696 21,479 21,250 19,957 19,675
Available generating capacity (net MW) Coal 1,530 1,530 1,530 1,591 1,686 1,686 Gas 1,771 1,771 1,567 1,597 1,337 1,337
Hydro 889 889 864 863 853 853 Wind 221 221 198 198 198 198 Other 26 25 22 32 30 20
Total available generating capacity 4,437 4,436 4,181 4,281 4,104 4,094
Peak loads (net MW)Annual peak load 3,640 3,628 3,561 3,543 3,314 3,195Minimum load 2,033 2,033 1,854 1,839 1,640 1,728Summer peak load 3,331 3,331 3,131 3,187 3,053 3,070
Lines in service (circuit km)Transmission lines 13,964 13,964 13,405 13,267 13,174 13,452Distribution lines 143,020 143,292 142,403 139,375 138,959 139,390
Total lines in service 156,984 157,256 155,808 152,642 152,133 152,842
Number of permanent full-time employees 3,143 3,133 3,099 3,008 2,830 2,701
GLOSSARY
Advanced Metering Infrastructure (AMI)An integrated system of smart meters, communication networks, and data management systems that enables two-way communication between utilities and customers.
BiomassEnergy resources derived from organic matter. These include wood, agricultural waste and other living-cell material that can be burned to produce heat energy.
CapacityThe greatest load than can be supplied by a generating unit, power station or an entire provincial grid system.
Carbon capture and storage (CCS)Technology that reduces greenhouse gas emissions by capturing carbon dioxide, typically at fossil-fuelled power plants, and storing it in geological reservoirs deep underground.
Carbon dioxide (CO2)One of the primary greenhouse gases believed to be a cause of climate change. Carbon dioxide is produced in fossil fuel-based electricity generation.
Carbon dioxide equivalent (CO2e)A unit of measurement used to compare the emissions from various greenhouse gases based upon their global warming potential.
Climate changeClimate change refers to any change in climate over time, whether due to natural variability or as a result of human activity.
CogenerationThe simultaneous generation of electricity and useful heat or steam. The heat could be put in use in an industrial process or to heat a facility or community. The electricity could be used by the owner or sold.
DemandThe rate at which electric energy is delivered at a given instant or averaged over a period of time. It is measured in kilowatts, megawatts, etc.
DistributionProcess of moving electric energy at lower voltages from major substations to customers.
Fly ashThe fine powder by-product resulting from the combustion of pulverized coal used in many coal-fired generating stations.
Gigawatt (GW)A unit of bulk power; one billion watts or one million kilowatts.
Gigawatt hour (GWh)A unit of bulk energy; 1,000,000 kilowatt hours.
Independent Power Producer (IPP)An unregulated entity that owns power plants and generates electricity in the competitive wholesale market.
International Financial Reporting Standards (IFRS)Guidelines and rules set by the International Accounting Standards Board that companies follow when compiling financial statements. IFRS replaced the previous Canadian generally accepted accounting principles as the acceptable set of accounting standards for publicly accountable enterprises in Canada.
ISO 14001A standard that defines the elements of a sound environmental management system. The ISO 14000 series is a family of environmental management standards developed by the International Organization for Standardization (ISO).
Kilowatt hour (kWh)A unit of bulk energy; 1,000 watt hours. The measurement is generally used for billing residential customers.
LoadThe amount of electric power or energy consumed by a particular customer or group of customers.
Megawatt (MW)A unit of bulk power; 1,000 kilowatts. The unit generally used to describe the output of a commercial generator.
Megawatt hour (MWh)A unit of bulk energy; 1,000 kilowatt hours.
North American Electric Reliability Corporation (NERC)Formed in 1968, its mission is to ensure that the bulk electric system in North America is reliable, adequate and secure.
Net meteringThe offsetting of electricity consumption by a customer against the same customer’s production of electricity, typically from a small-scale renewable energy source such as wind or solar.
Open Access Transmission Tariff (OATT)The SaskPower OATT allows eligible users to access our transmission system to transport electricity to wholesale customers within Saskatchewan or across the province to other jurisdictions. The OATT also ensures SaskPower can access the transmission systems of other utilities.
OHSAS 18001A standard that defines the elements of sound occupational health and safety management systems.
Peak load demand or peak energy demandThe maximum amount of electric power or energy consumed by a particular customer or group of customers at a precise time.
Polychlorinated biphenyls (PCBs)A group of organic compounds that were once used as cooling and insulating fluids in various types of electrical equipment, including transformers and capacitors.
Power purchase agreement (PPA)A contract between electricity producers in which one party sells energy and/or generating capacity to another, who generally serves end-use retail customers. For example, instead of building a new power plant an electric company can choose to enter into a PPA.
Smart meterAn electronic device that records consumption of electric energy in intervals of an hour or less and communicates that information at least daily back to the utility for monitoring and billing.
Sulphur dioxide (SO2)Sulphur dioxide belongs to the family of sulphur oxide gases. These gases are formed when fuel containing sulphur (mainly coal and oil) is burned at power plants and during industrial processes.
Switching stationA facility containing transformers, regulators, switches and protective equipment for changing transmission voltages between transmission lines.
TransmissionProcess of moving electric power in bulk at higher voltages from the source of supply to distribution centres.
SASKPOWE R 2 015 -16 ANNUAL RE PORT 153
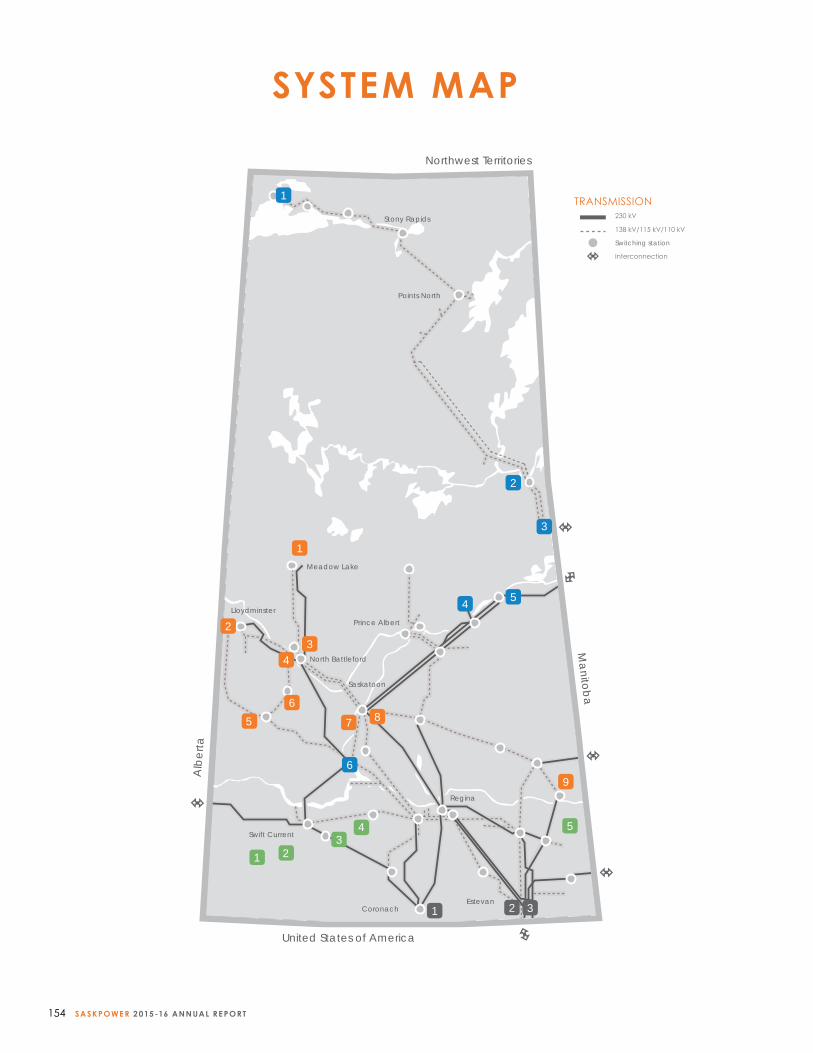
154 SASKPOWE R 2 015 -16 ANNUAL RE PORT
Points North
Meadow Lake
North Battleford
Lloydminster
Swift Current
Coronach
Regina
Estevan
Stony Rapids
Saskatoon
Prince Albert
United States of America
Northwest Territories
Ma
nito
ba
Alb
ert
a
1
5
68
2
4
2
3
5
9
7
1 2 3
1
2
54
6
1
314
13
TRANSMISSION230 kV
138 kV/115 kV/110 kV
Switching station
Interconnection
SYSTEM MAP
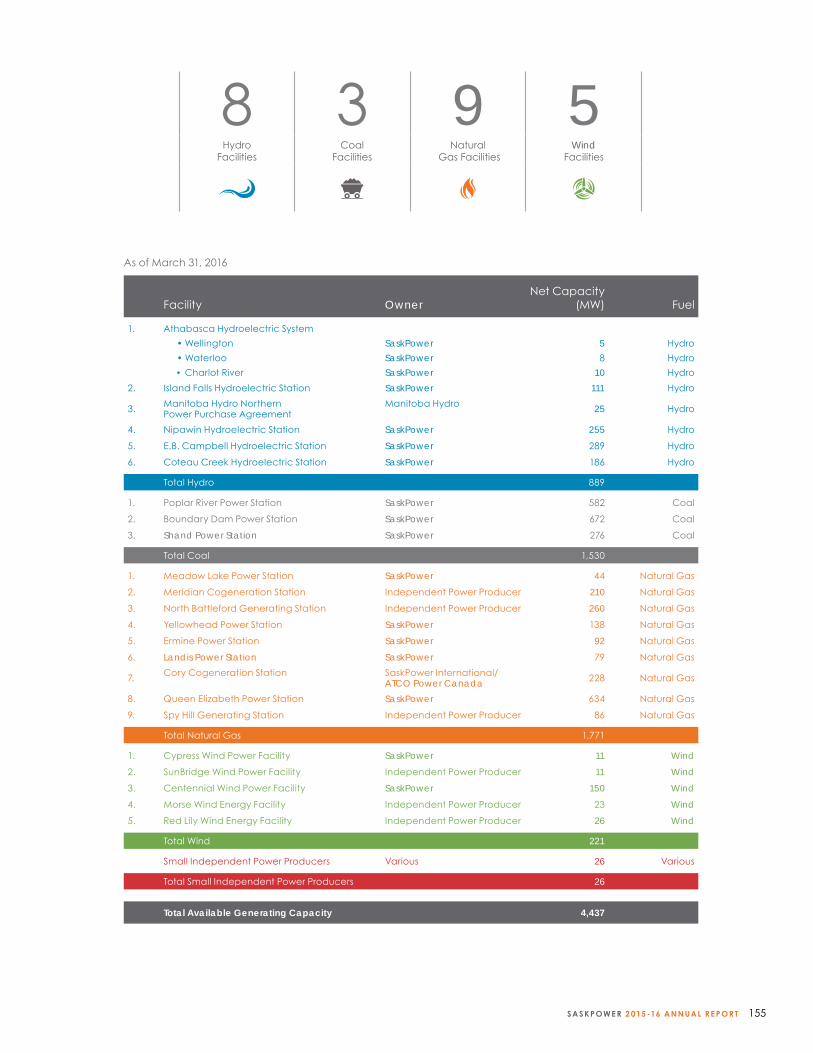
SASKPOWE R 2 015 -16 ANNUAL RE PORT 155
8 3 9 5Hydro
FacilitiesCoal
FacilitiesNatural
Gas FacilitiesWind
Facilities
Facility OwnerNet Capacity
(MW) Fuel
1. Athabasca Hydroelectric System
• Wellington SaskPower 5 Hydro
• Waterloo SaskPower 8 Hydro
• Charlot River SaskPower 10 Hydro
2. Island Falls Hydroelectric Station SaskPower 111 Hydro
3. Manitoba Hydro Northern Power Purchase Agreement
Manitoba Hydro 25 Hydro
4. Nipawin Hydroelectric Station SaskPower 255 Hydro
5. E.B. Campbell Hydroelectric Station SaskPower 289 Hydro
6. Coteau Creek Hydroelectric Station SaskPower 186 Hydro
Total Hydro 889
1. Poplar River Power Station SaskPower 582 Coal
2. Boundary Dam Power Station SaskPower 672 Coal
3. Shand Power Station SaskPower 276 Coal
Total Coal 1,530
1. Meadow Lake Power Station SaskPower 44 Natural Gas
2. Meridian Cogeneration Station Independent Power Producer 210 Natural Gas
3. North Battleford Generating Station Independent Power Producer 260 Natural Gas
4. Yellowhead Power Station SaskPower 138 Natural Gas
5. Ermine Power Station SaskPower 92 Natural Gas
6. Landis Power Station SaskPower 79 Natural Gas
7. Cory Cogeneration Station SaskPower International/ATCO Power Canada 228 Natural Gas
8. Queen Elizabeth Power Station SaskPower 634 Natural Gas
9. Spy Hill Generating Station Independent Power Producer 86 Natural Gas
Total Natural Gas 1,771
1. Cypress Wind Power Facility SaskPower 11 Wind
2. SunBridge Wind Power Facility Independent Power Producer 11 Wind
3. Centennial Wind Power Facility SaskPower 150 Wind
4. Morse Wind Energy Facility Independent Power Producer 23 Wind
5. Red Lily Wind Energy Facility Independent Power Producer 26 Wind
Total Wind 221
Small Independent Power Producers Various 26 Various
Total Small Independent Power Producers 26
Total Available Generating Capacity 4,437
As of March 31, 2016
Saskatchewan Power Corporation
2025 Victoria Avenue
Regina, Saskatchewan
Canada S4P 0S1
saskpower.com


![Sample Path Properties of Bifractional Brownian Motion · mation [which provides a powerful connection between self-similar processes and stationary processes; see Lamperti (1962)]](https://img.pdfslide.us/doc/110x75/5fb0c707f1ee9b5483365be7/sample-path-properties-of-bifractional-brownian-motion-mation-which-provides-a.jpg)