Embed Size (px)
Citation preview

A Potpourri of Interesting Research A Potpourri of Interesting Research ProblemsProblems

This plot shows a measure of El Niño/La Niña (green) and a measure of the power put into the far western Pacific Ocean by tropical cyclones (blue). The blue curve has been shifted rightward by two years on this graph. There is the suggestion that powerful cyclones in the western Pacific can trigger El Niño/La Niña cycles.
TC Effects on El Nino?

AgukabamsAgukabams(aka Landphoons, Terracanes)(aka Landphoons, Terracanes)
From aboriginal roots “agu” (land) and From aboriginal roots “agu” (land) and “kabam” (storm)“kabam” (storm)
• Case studiesCase studies
• HypothesisHypothesis
• Simple model Simple model Emanuel, K., J. Callaghan, and P. Otto, 2008: A hypothesis for the re-development of warm-core cyclones over northern Australia. Mon. Wea. Rev., 136, 3863-3872

Case : TC Abigail, Feb-March, 2001Case : TC Abigail, Feb-March, 2001

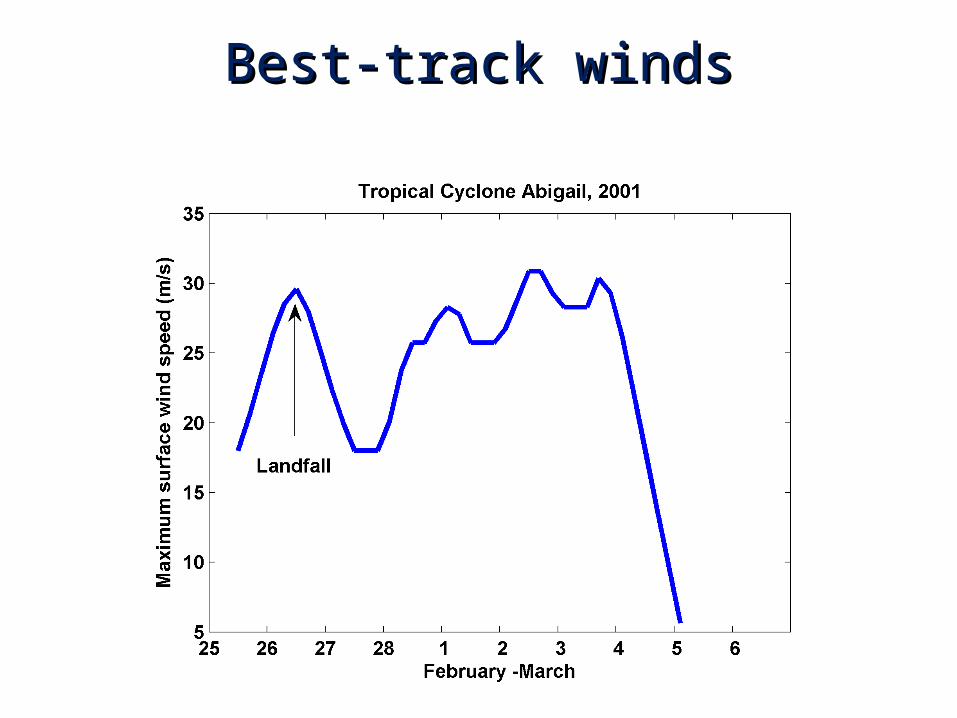
Best-track windsBest-track winds

Hypothesis:Hypothesis: Non-baroclinic Non-baroclinic rejuvenation of tropical cyclones rejuvenation of tropical cyclones over land can be caused by rapid over land can be caused by rapid flux of heat out of hot, sandy soils flux of heat out of hot, sandy soils that have been moistened by the that have been moistened by the
early rains of the systemearly rains of the system

20 cm Soil Temp at Halls Creek during 20 cm Soil Temp at Halls Creek during Passage of AbigailPassage of Abigail

Idealized Experiments: Idealized Experiments: Constant Constant translation velocity and translation velocity and
environmental temperature,environmental temperature,initialization with a warm core initialization with a warm core
vortex with maximum winds of vortex with maximum winds of 17 ms17 ms-1-1

Sensitivity to Initial Soil TemperatureSensitivity to Initial Soil Temperature(translation speed = 13 km hr(translation speed = 13 km hr-1-1))
7 2 110 10 m s

Sensitivity to thermal diffusivity
1
34 ,
13
oi
t
T C
U km hr
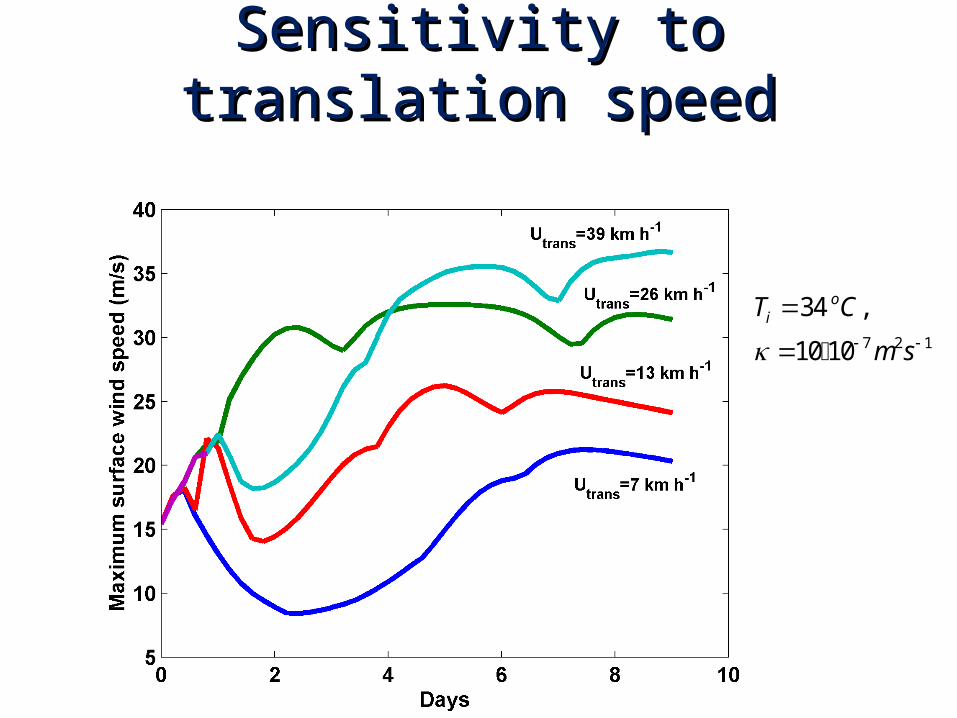
Sensitivity to translation speedSensitivity to translation speed
7 2 1
34 ,
10 10
oiT C
m s

Effect of depletion of water: PBL environmental Effect of depletion of water: PBL environmental RH declines from 80% to 0% over 8 daysRH declines from 80% to 0% over 8 days

Abigail HindcastAbigail Hindcast

Tropical Storm Erin, 2007Tropical Storm Erin, 2007

But then, deep in the heart of Oklahoma....But then, deep in the heart of Oklahoma....


12 GMT August 18 2007

18 GMT August 18 2007

00 GMT August 19 2007

06 GMT August 19 2007

12 GMT August 19 2007


Oklahoma SoilsOklahoma Soils

Soil temperature record at Hinton, OKSoil temperature record at Hinton, OK

Estimate of Soil Heat FluxEstimate of Soil Heat Flux
1 1
2
3
50
4000
1000
500
3
3
s s
s
s
ThC
th cm
C J Kg K
Kg
Wm
m
T K
t hr

Hurricanes in the Persian Gulf?Hurricanes in the Persian Gulf?
Annual Frequency=0.04


Back to NorwayBack to Norway
A Return to the Concept of Air Masses

Two Key Concepts from the Norwegian School:
• Fronts• Air masses
Bergeron, 1922: An air mass is a vast body of air whose physical properties are more or less uniform in the horizontal, while abrupt changes are found along its boundaries, i.e. the frontal zones.


“The cyclone consists of two essentially different air-masses, the one of cold and the other of warm origin. They are separated by a fairly distinct boundary surface which runs through the center of the cyclone. This boundary surface is imagined to continue, more or less distinctly, through the greater part of the troposphere.” [Emphasis mine]
Bjerknes and Solberg, 1922
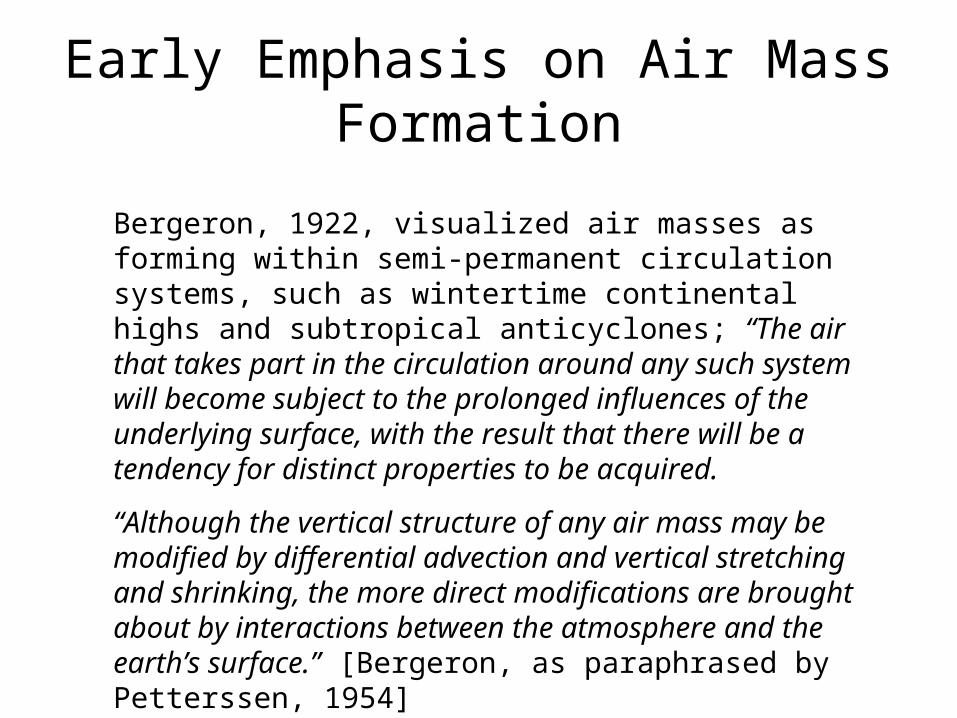
Early Emphasis on Air Mass Formation
Bergeron, 1922, visualized air masses as forming within semi-permanent circulation systems, such as wintertime continental highs and subtropical anticyclones; “The air that takes part in the circulation around any such system will become subject to the prolonged influences of the underlying surface, with the result that there will be a tendency for distinct properties to be acquired.
“Although the vertical structure of any air mass may be modified by differential advection and vertical stretching and shrinking, the more direct modifications are brought about by interactions between the atmosphere and the earth’s surface.” [Bergeron, as paraphrased by Petterssen, 1954]


Sanders, 1955:“The intense surface frontal zone attains maximum strength
near the ground and weakens rapidly with altitude.”

The Dynamics Revolution
Carl-Gustav Rossby and Hans Ertel: Conservation and invertibility of potential vorticity:
sq
×V
V is the fluid velocity, is the fluid density,
and S is any conserved state variable (usually the entropy)

Rossby Waves:
• Wherever there are gradients of q on surfaces of constant s
• Wherever there are gradients of s on rigid boundaries

Baroclinic Instability and Fronts
• Eady’s 1949 model of baroclinic instability: No interior gradients of potential vorticity
• Hoskins and Bretherton’s 1972 semi-geostrophic model of frontogenesis: no interior gradients of PV; fronts develop only at surface and tropopause

Contemporary View:
• PV dynamics seated mostly in surface and tropopause entropy gradients
• Troposphere proper can be approximated as a fluid of constant PV or constant PV gradient (β)
• 5-10 day forecast errors owing to dynamical error growth; sensitivity can be measured by adiabatic error growth
• Fronts are features of surface and (deformed) tropopause


What Ever Happened to Thermodynamics?
Some basic principles
• Heating of cold air masses from below is a relatively rapid process, occurring usually in a few days
• Cooling of air masses from below may require many tens of days

Successive temperature soundings at Fairbanks, Alaska, in December, 1961. Curves labeled with time in days relative to first sounding.


J. Curry, 1983
• “The rate of cooling is shown to be very sensitive to the amount of condensed water in the atmosphere”
• “The model requires two weeks for the formation of fully developed continental polar air, although after only four days of cooling, the air has acquired most of the air mass properties”
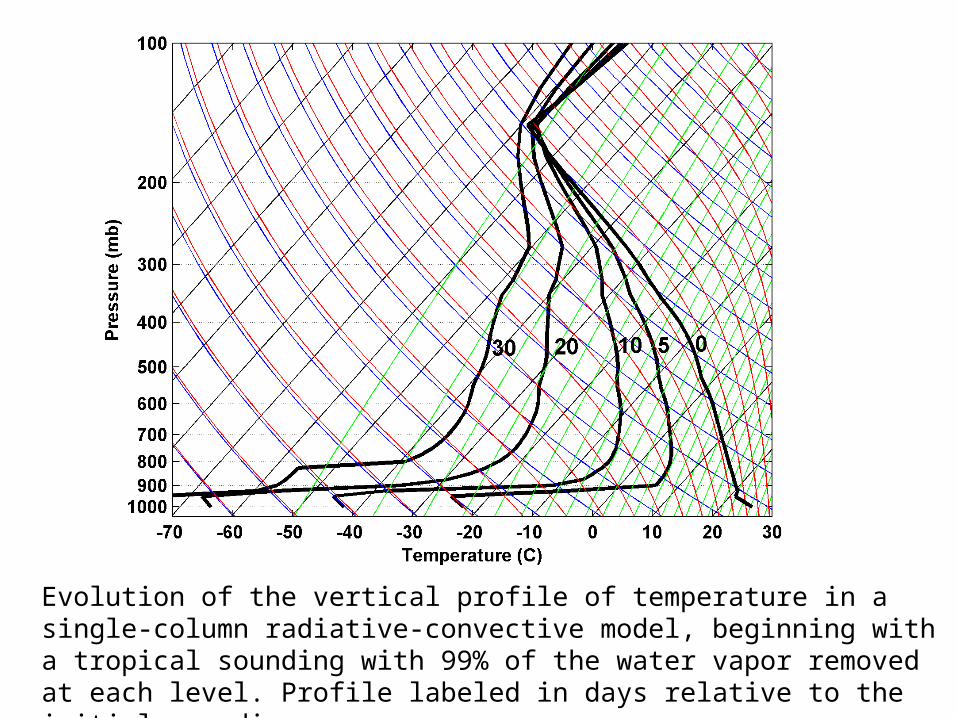
Evolution of the vertical profile of temperature in a single-column radiative-convective model, beginning with a tropical sounding with 99% of the water vapor removed at each level. Profile labeled in days relative to the initial sounding.

Evolution of the vertical profile of temperature in a single-column radiative-convective model, beginning with a subtropical sounding. In this case, the fraction of water removed decreases from 90% at the surface to 99% at 100 hPa.

Time-height plot of the fractional cloudiness in the simulation

Evolution of the vertical profile of temperature in a single-column radiative-convective model, beginning with a subtropical sounding. In this case, the fraction of water removed decreases from 60% at the surface to 99% at 100 hPa. A smooth vertical profile of is specified, vanishing at the surface and at 100 hPa and reaching a peak value of 0.5 hPa hr-1 at 750 hPa

Re-classification of Air Masses, based on the Saturated Potential Vorticity:
1 *2 ln eSPV Ω V *e is the saturation value of the equivalent
potential temperature

Features:• It is always invertible, provided the flow is balanced, since is
a state variable.• It is nearly conserved in very cold air (e.g. arctic air,
stratospheric air), because in the cold limit it reduces to the ordinary potential vorticity (PV), since at low temperature
• Neutrality to (slantwise) convection is characterized by SPV=0, which is equivalent to having moist adiabatic lapse rates along vortex lines (absolute momentum surfaces, in two dimensions). Thus in much of the tropical and middle latitude free troposphere, where we observe convective neutrality, SPV is nearly zero.
*e
*e

Define Four Basic Air Masses:
• Convected: Moist adiabatic lapse rates on vortex lines. Formation time of 1-2 days. Most of the troposphere, most of the time
• Stratosphere: High PV reservoir. Long formation time scales
• Arctic: High PV owing to radiative cooling in continental interior in winter. Formation time of 4-14 days
• PBL: Direct surface influence. Formation time of 1-6 hours


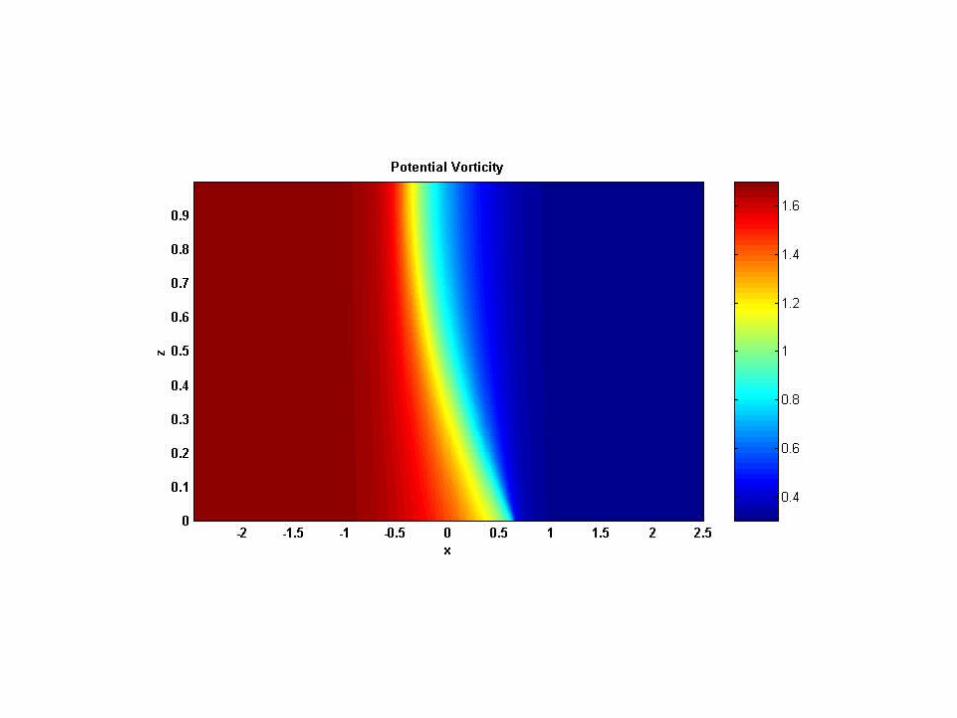
Cross-section of saturated potential vorticity (SPV) along 90oW at 00 GMT on 8 March 2003. Value have been multiplied by 104, and all values larger than 2 x 10⁴ have been reset to 2 x 10⁴

Cross-section of saturated potential vorticity (SPV) along 100oW at 00 GMT 7 July 2003

Could the Norwegians have been Right About Fronts Extending
Through the Depth of the Troposphere?

Classical Semi-Geostrophic Frontogenesis Model, but with
Pre-existing Deep Tropospheric PV Gradient


Summary
• Discussion of forecast errors usually focuses on dynamical problems, e.g. error growth
• Some medium-range forecasts may be compromised by errors in model thermodynamics, especially as they concern arctic air mass formation
• Re-classification of air masses based on SPV may prove beneficial for analyzing tropospheric dynamics and thermodynamics

Data Assimilation by Field Data Assimilation by Field AlignmentAlignment
Ravela, S., K. Emanuel and D. McLaughlin, 2007: Data Assimilation by Field Alignment. Physica(D), 230, 127-145
http://dx.doi.org/10.1016/j.physd.2006.09.035

Forecast Ensemble Truth and Observations
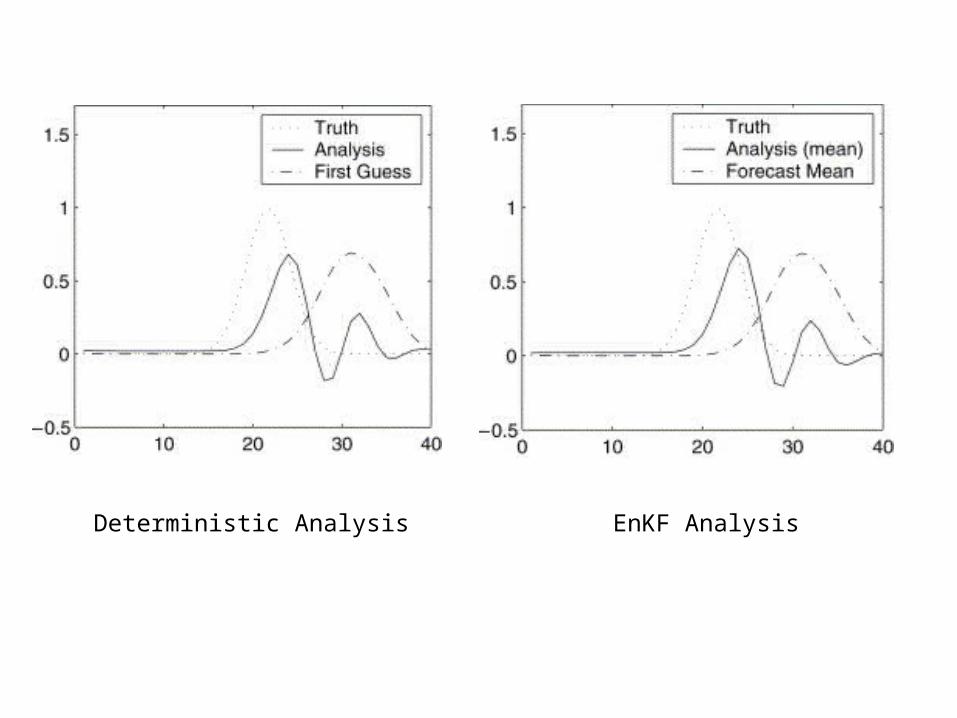
Deterministic Analysis EnKF Analysis

Aligned Forecast Ensemble Deterministic Analysis

Two Dimensions
Truth Observations

Forecast Ensemble First Guess

3D-Var Analysis First Guess after Field Alignment

Some Other TopicsSome Other Topics
• Winter sea-ice anomalies T anomalies• Application of game theory to market
response to seasonal forecasts• Rossby wave propagation in typical
tropopause distributions of PV