Embed Size (px)
Citation preview
University of Washington TacomaUW Tacoma Digital Commons
SIAS Faculty Publications School of Interdisciplinary Arts and Sciences
8-1-2014
A post-glacial sea level hinge on the central Pacificcoast of CanadaDuncan McLaren
Daryl Fedje
Murray B. Hay
Quentin Mackie
Ian J. Walker
See next page for additional authors
Follow this and additional works at: https://digitalcommons.tacoma.uw.edu/ias_pub
This Article is brought to you for free and open access by the School of Interdisciplinary Arts and Sciences at UW Tacoma Digital Commons. It hasbeen accepted for inclusion in SIAS Faculty Publications by an authorized administrator of UW Tacoma Digital Commons.
Recommended CitationMcLaren, Duncan; Fedje, Daryl; Hay, Murray B.; Mackie, Quentin; Walker, Ian J.; Shugar, Dan H.; Eamer, Jordan BR; Lian, Olav B.;and Neudorf, Christina, "A post-glacial sea level hinge on the central Pacific coast of Canada" (2014). SIAS Faculty Publications. 340.https://digitalcommons.tacoma.uw.edu/ias_pub/340
AuthorsDuncan McLaren, Daryl Fedje, Murray B. Hay, Quentin Mackie, Ian J. Walker, Dan H. Shugar, Jordan BREamer, Olav B. Lian, and Christina Neudorf
This article is available at UW Tacoma Digital Commons: https://digitalcommons.tacoma.uw.edu/ias_pub/340

A Post-glacial Sea Level Hinge on the Central Pacific Coast of Canada Duncan McLaren, Daryl Fedje, Murray Hay, Quentin Mackie, Ian J. Walker, Dan H. Shugar, Jordan B.R. Eamer, Olav B. Lian, and Christina Neudorf Highlights:
x New sea level curves for the last 15,000 years for the Pacific coast of Canada. x Hinge between regions that were isostatically depressed and raised by a forebulge. x Lake coring, archaeological testing, sedimentary exposures, diatom identification. x 106 newly reported radiocarbon ages used to construct two new sea level curves. x Long-spanning archaeological deposits are associated with the sea level hinge. x Past shoreline elevations for future investigations of a coastal migration route.
*Highlights (for review)
1
A Post-glacial Sea Level Hinge on the Central Pacific Coast 1
of Canada 2 3 Duncan McLarena,b, Daryl Fedjea,b, Murray Hayc, Quentin Mackiea, Ian J. Walkerd, Dan H. 4 Shugard, Jordan B.R. Eamerd, Olav B. Liane, and Christina Neudorfe,b 5 6 Corresponding Author: Duncan McLaren ([email protected], 1-250-888-3759). 7 8 aDepartment of Anthropology 9 University of Victoria 10 PO Box 1700 STN CSC 11 Victoria, BC, Canada, 12 V8W 2Y2 13 14 bHakai Beach Institute, Calvert Island, BC, Canada 15 The Hakai Beach Institute 16 Box 309 17 Heriot Bay, BC, Canada 18 V0P 1H0 19 20 cProgramme de géographie 21 Département des sciences humaines 22 Université du Québec à Chicoutimi 23 555, boulevard de l'Université 24 Chicoutimi, Québec, Canada 25 G7H 2B1 26 27 dCoastal Erosion & Dune Dynamics Laboratory 28 Department of Geography 29 University of Victoria 30 P.O. Box 3060, Station CSC, 31 Victoria, BC, Canada 32 V8R 3R4 33 34 eLuminescence Dating Laboratory 35 Department of Geography 36 University of the Fraser Valley 37 33844 King Road 38 Abbotsford, BC, Canada 39 V2S 7M8 40 41
*ManuscriptClick here to view linked References
2
Abstract 42 Post-glacial sea level dynamics during the last 15,000 calendar years are highly 43 variable along the Pacific coast of Canada. During the last glacial epoch, the 44 Earth's crust was depressed by ice loading along the mainland inner coast and 45 relative sea levels were as much as 200 metres higher than today. In contrast, 46 some outer coastal areas experienced a glacial forebulge (uplift) effect that caused 47 relative sea levels to drop to as much as 150 metres below present levels. Between 48 these inner and outer coasts, we hypothesize that there would have been an area 49 where sea level remained relatively stable, despite regional and global trends in 50 sea level change. To address this hypothesis, we use pond basin coring, diatom 51 analysis, archaeological site testing, sedimentary exposure sampling, and 52 radiocarbon dating to construct sea level histories for the Hakai Passage region. 53 Our data include 106 newly reported radiocarbon ages from key coastal sites that 54 together support the thesis that this area has experienced a relatively stable sea 55 level over the last 15,000 calendar years. These findings are significant in that 56 they indicate a relatively stable coastal environment amenable to long-term 57 occupation and settlement of the area. Our results will help inform future 58 archaeological investigations in the region. 59 60
Keywords: Isostatic; Eustatic; Sea Level Change; Northeast Pacific Rim; Central Pacific 61 Coast of Canada; Archaeology; Northwest Coast; Sea Level Hinge; Coastal Migration 62 Route 63
64 1 Introduction 65 During the peak of the last glacial epoch of the Pleistocene, global eustatic sea level was as low 66 as 120 metres below present (Fairbanks, 1989; Peltier and Fairbanks 2006) and many coastal 67 regions that were located away from ice sheets saw an appreciable drop in relative sea level. 68 With post glacial eustatic sea level rise, past shorelines are now deeply submerged along most of 69 the earth's coasts. In contrast, parts of the Pacific coast of Canada that were covered by several 70 hundreds of metres of ice during the last glaciation have relict shorelines that are submerged, 71 while others are stranded above current sea level as a result of the complex interplay between 72 regional glacial isostatic depression, global eustatic responses, and tectonic plate displacements 73 (e.g., Clague et al., 1982; Clague and James, 2002). Over the late Quaternary, relative sea level 74 dynamics in the region have been highly variable and dependent, in large part, on proximity to 75 ice loading during the last glacial maximum (LGM) (Clague et al. 1982; Clague 1983). Shugar et 76 al. (in review, this volume) provide a regional synthesis of relative sea level changes on the 77 Pacific coast of North America and identify the central Pacific coast of Canada as a region 78 requiring further research. During the late Pleistocene, ice proximal parts of the coast were 79 subject to appreciable isostatic depression, resulting in relative sea level positions up to 200 80 metres higher than today (Clague et al., 1982; James et al., 2009). Much of the outer coast was 81 located further away from ice loading and was uplifted by a forebulge that formed through 82 differential vertical displacement of the crust from inland to the edge of the continental shelf 83 (Clague, 1983). As a result, relative sea level in outer coastal areas was up to 150 metres lower 84 than today (Luternauer et al., 1989; Josenhans et al., 1997; Barrie and Conway 2002a). Sea level 85 curves from various locations on the Canadian Pacific coast show regional variations to this 86
3
trend and illustrate that tectonics can also be a significant factor in sea level change in particular 87 after 10,000 Cal BP (Figure 1 and also Shugar et al., in review, this volume). 88 89 Our research developed in the context of these rapid and regional sea level histories. This 90 research was guided by the following question: is there a region between the inner and outer 91 coasts where sea levels have remained relatively stable since late Pleistocene times? This 92 hypothesized phenomenon is referred to as a “sea level hinge” (cf. McLaren, 2008). The concept 93 of the sea level hinge is different from an “isostatic hinge” or “zone of flexure” in the earth’s 94 crust. The sea level hinge is dependent on both isostatic and eustatic factors and can be thought 95 of as a place where the shoreline is stable. The sea level hinge lies between two areas with very 96 different relative sea level histories, to the east with higher than today relict shorelines, and to the 97 west with lower than today relict shorelines. In this paper, we identify the Hakai Passage area of 98 the central coast of British Columbia as a sea level hinge. 99 100 1.1 Study area 101 The Hakai Passage region, located on the central Pacific coast of Canada, provides an 102 opportunity to search for evidence to test our hypothesis (Figure 2). Located 30 km to the west of 103 Hakai Passage is Goose Bank - a now-drowned coastal platform approximately 45 km wide and 104 extending 20 to 90 km offshore of the outer islands of the central coast. During the late 105 Pleistocene when relative sea level was about 135 metres lower than today, Goose Bank was a 106 low, flat island (Luternauer, 1989; Barrie and Conway, 2002a). Contrasting with this, 110 km to 107 the east of Hakai Passage, in the Bella Coola valley, relative sea level was between 150 and 200 108 metres higher than today following deglaciation (Andrews and Retherford, 1978). 109 110 Previous sea level histories developed for the Hakai Passage region (e.g., Retherford, 1972; 111 Andrews and Retherford, 1978; Cannon, 2000) are contradictory and do not corroborate well 112 with recently obtained archaeological data. These inconsistencies are likely a consequence of 113 data limitations and collation of data from a large geographic area. For instance, data points used 114 in Andrews and Retherford (1978) extend along the outer coast islands as well as the mainland 115 shore in areas both distal and proximal to major Wisconsin glacial ice loading. 116 117 Stable, relict shorelines are of interest for both geomorphic research that reconstructs relative sea 118 level histories as well as for archaeological research as they favour and often preserve long-term 119 accumulation of sedimentary and archaeological materials in a relatively constrained region (as 120 opposed to being spread across the landscape during gradual sea level regression or 121 transgression). The use of relative sea level histories and geomorphic interpretation of relict 122 shorelines has been key to locating archaeological sites of different ages along the Northwest 123 Coast of North America (e.g., Fedje and Christensen, 1999; Mackie et al., 2011; McLaren et al., 124 2011). The hypothesized central coast sea level hinge is a location where late Pleistocene and 125 early Holocene shorelines would be close to modern sea level. This presents a significant 126 opportunity for locating long-term archaeological sites and evidence of early post-glacial human 127 occupation. Fedje et al. (2004) proposed that the east side of Hecate Strait to the north, between 128 Haida Gwaii and the mainland, would be a suitable place for this type of investigation. McLaren 129 (2008) investigated the sea level history of the Dundas Island Archipelago, northeast of Haida 130

4
Gwaii, and found that relative sea level dropped only 14 metres over the last 15,000 years1 and 131 characterized this phenomenon as being the result of the presence of a sea level hinge. 132 133 1.2 Regional setting 134 The central Pacific coast of Canada remains a remote region only accessible by boat or aircraft. 135 The research presented here was undertaken in the territories of the Heiltsuk, Wuikinuxv, and 136 Nuxalk First Nations. Field research was based out of the Hakai Beach Institute on Calvert Island, 137 just south of Hakai Passage. The physiography of the Hakai Passage area is characterized by the 138 Coast Mountains to the east (which reach elevations of up to 4000 metres above sea level), and 139 isolated rocky islands and skerries to the west. Marine channels intersect the landscape 140 increasingly with distance from the mainland. Inner shores consist of steep-sided fjords, whereas 141 the outer shores are exposed, consisting generally of flat islands with irregular, steep bedrock 142 beaches or smaller embayed sedimentary beaches. A few sandy, dune- or bluff-backed beaches 143 exist on the northern and western shores of the larger Calvert Island, which also hosts mountain 144 plateaus, saddles, and peaks reaching 1000 metres above sea level. Glaciers are found today only 145 on the mainland, in the far eastern part of the region (Figure 2). Average yearly rainfall is high, 146 between 240 and 330 cm per year. The area is located in the Coastal Western Hemlock 147 biogeoclimatic zone (Meidinger and Pojar 1991) and with the exception of higher alpine areas, 148 most of the region is heavily forested by conifers which can grow to be massive and over 1000 149 years old (Figure 3). Areas of low relief found on the outer coast often host sphagnum 150 vegetation and have developed into bogs and bog forests (Figure 4). 151 152 The timing of the LGM is not well known in the study area. Paleontological and vegetation 153 evidence from southeast Alaska and Haida Gwaii, to the northwest of the study area, indicate 154 that the LGM occurred between 20,500 and 19,000 years ago (Warner et al., 1982; Heaton and 155 Grady, 2003). Parts of the west coast of Vancouver Island to the south were ice free at this time 156 and the LGM occurred later, between 19,000 and 17,700 calendar years ago (Ward et al., 2003). 157 At this time, during a period known locally as the Vashon Stade of the Fraser Glaciation (Clague 158 and James, 2002), the Cordilleran ice sheet covered most of the Coast Mountains on the 159 mainland, although some outer coastal islands may have been ice free (e.g., Heusser, 1989; 160 Clague et al., 2004). For example, the now submerged terrain of Goose Bank may not have been 161 over-ridden by ice due to its distance from the main ice mass during the Fraser Glaciation. 162 However, close to the continental shelf, ice streams were likely present both to the north and 163 south of the bank. Troughs from these features are evident in the shaded bathymetry presented 164 in Figure 5 (also see Luternauer and Murray, 1983; Mathews, 1991; Barrie and Conway, 2002b). 165 By 11,400 years ago, the extent of glacial ice cover in the Coast Mountain was similar to that of 166 today (Clague, 1981, 2000). Tidewater glaciers are still present to the north in southeast Alaska. 167 168 2 Data and methods 169 This study collates relative sea level elevations derived from relict shorelines and/or shoreline 170 proximal features (e.g., middens, etc.) from previously published and recent geological and 171 archaeological sources. This dataset includes 106 samples collected from sediment basin coring, 172 archaeological investigations, and geomorphic research within the study region by the authors. 173 Following the methods of Shennan et al. (2006) only samples of known location, age and altitude 174 were included. Each sample also needed to have some indicative meaning as to its position 175 1 All dates are in calendar years before present (1 sigma with a datum of AD 1950) unless otherwise noted.

5
relative to the intertidal zone (Table 1). For consistency, all sample elevations have been 176 adjusted relative to higher high tide (hht = higher high water, large tide) datum which is 5.161 177 metres above Chart Datum (or low low water, large tide) at Adams Harbour (CHS station #8865) 178 on Calvert Island (see Bartier and Sloan 2007 for an in-depth discussion of sea level datums on 179 the Pacific coast of Canada). In some instances, corrections were made for data points measured 180 to mean water level by subtracting 2.5 metres from each elevation measurement. Other data 181 points have been adjusted from measurements to the barnacle line by adding 1 metre (Plafker 182 1969). In some instances, LiDAR data was drawn upon to refine elevation measurements. All 183 elevation measurements are given as metres above higher high tide (ahht) or below higher high 184 tide (bhht). 185 186 Sediment basin coring was undertaken using Reasoner (1986) and Livingstone (1955) type 187 coring devices. Pond samples were taken from elevations between 94.5 and 0.5 metres ahht. 188 Three lagoons, with rock sills between 1.5 and 2 metres bhht, were also sampled. Sampling was 189 conducted from a floating coring platform with a guide tube to stabilize and align the coring 190 device. Sub-bottom sediments were then sampled by driving the coring device into the substrate 191 and retrieving the core using a portable winch. Elevations for each sample were measured 192 relative to the observed rock sill of the pond or lagoon using hand held altimeters and survey 193 traverses employing a laser range finder and reflector. Following Cannon (2000), elevation 194 estimates were made to the barnacle line (1 metre bhht). Estimates of elevation measurement 195 error for each sample are provided in Table 2. LiDAR was used to refine elevations for samples 196 taken on Calvert Island. Cores were transported back to the Archaeology Lab at the University 197 of Victoria and stored in a refrigerator. 198 199 Cores were logged and sampled with specific attention to identifiable stratigraphic transitions. 200 Slides for diatom analysis were prepared and examined. For clay-rich samples, the sediment was 201 first wet sieved through 10-micron mesh to remove the clay fraction. Using a modified version 202 of Renberg’s (1990) protocol, samples were treated with HCl and H2O2 to remove carbonates 203 and organic matter, then rinsed with distilled water, and plated onto microscope slides using 204 Naphrax. 205 206 Slides were assessed for the presence of diagnostic diatoms for determination of relative salinity 207 of the environment represented by transitional stratigraphic units. Slides were analyzed using 208 Leica DM2500 (University of Québec) and Nikon Optiphot-2 (University of Victoria) 209 transmitting light microscopes with 40x and 100x objectives. For each slide, a minimum of 5 210 transects were undertaken at 400x magnification. Detailed analysis of some diatoms employed 211 1000x (oil). 212 213 Observed diatom flora were compared to those identified in Campeau et al. (1999), Pienitz et al. 214 (2003), and Witkowski (2000) for identification. The salinity tolerance of identified flora was 215 then used to assess whether the samples were derived from freshwater, brackish, or marine 216 environments. 217 218 Archaeological deposits were sampled using a variety of methods including coring using an 219 Environmentalist's Sub-Soil Probe (ESP), auger testing, sampling of cultural deposits in natural 220 exposures, shovel testing, and controlled excavation. Radiocarbon samples were taken from the 221

6
base of cultural bearing deposits and/or organic soil horizons found in the stratigraphic sections 222 encountered. In some cases, overlying stratigraphic units were selected for dating as well to 223 investigate lengths of site occupation. Methods for measuring data point elevations were the 224 same as those described above for pond coring. 225 226 Radiocarbon age samples from pond cores and archaeological sites were sent to the W.M. Keck 227 AMS Laboratory in Irvine, California (UCIAMS). Plant macrofossils were preferentially 228 selected for dating to avoid problems such as dating old wood or marine reservoirs, if available. 229 Charcoal and shell fragments were also selected. All radiocarbon ages are reported here in 230 calendar years before present (Cal BP). Calibrations were undertaken using Calib 6.1.1 and are 231 reported on here as 1 sigma ranges. For consistency, all dates reported by other researchers drew 232 from their uncalibrated conventional ages prior to calibration to calendric years. Radiocarbon 233 ages obtained from terrestrial organic material was calibrated using the Intcal09 dataset, while 234 marine samples were assigned a 331+80 Delta R correction and calibrated using the Marine09 235 dataset (McNeely et al., 2006). 236 237 3 Results 238 A total of 138 dating samples were gathered to construct relative sea level curves for the Hakai 239 Pass region (Figure 5, listed in Table 1). Of these, 32 were drawn from the existing literature 240 and the remaining 106 new samples were collected as a part of the research we present here. 241 These new data points were sampled in two sub-regions: Hakai West and Hakai East in order to 242 limit conflation of data from too large an area. All of the radiocarbon age data shown in Figure 5 243 and listed in Table 1 are coded by the subregion from which they are sampled: Offshore – OS1 244 and 2, Hakai West – HW1 through 9, Hakai East – HE1 through 6, and Shearwater – SW. 245 246 3.1 Pond and lagoon sites 247 Six ponds and three lagoons were cored and analyzed (Figure 6, Table 2). Pond sites include five 248 on Calvert Island (HW6, 7) and one in Fish Egg Inlet (HE6), east of Fitz Hugh Sound (Figure 7). 249 The lagoon sites were located all in the Hakai West region on Calvert Island (HW8), Sterling 250 Island (HW5), and Hunter Island (HW1). 251 252 3.1.1 Pond and lagoon cores from Hakai West 253 Three lakes were cored at altitudes of 9 metres ahht or more in Hakai West (HW6, 7): Pond B at 254 94.5 metres ahht, Pond D at 22.5 metres ahht, and SBD Lake at 9.5 metres ahht. All lack marine 255 or brackish diatom indicators (Table 3) that, combined with basal radiocarbon ages, demonstrate 256 that sea level has remained below 9 metres ahht since 14,587-14,173 Cal BP (UCIAMS 118020). 257 258 In contrast to these higher elevation lakes, diatom flora in the basal sediments of Big Spring 259 Lake (HW7) include marine and brackish species (Table 3) revealing that sea water last washed 260 into this basin (6 metres ahht) 14463-14001 year ago (UCIAMS 134867). Sediments deposited 261 after this are derived from freshwater contexts. 262 263 Pond C (HW7) on northwestern Calvert Island is situated lower at 0.4 metres ahht and is 264 impounded by a coastal dune. The record from this lake is much different from those at higher 265 elevations (Figure 6). Only mid to late Holocene deposits were recovered during coring. 266 Brackish and marine diatoms and foraminifera (Table 3) suggest that this was an active 267

7
nearshore beach environment between 5885 and 4895 Cal BP (UCIAMS 118049). No diatoms 268 were found in the coarse sand that overlies these beach deposits. However, there is an abrupt 269 transition from this coarse sand to gyttja between 720 and 676 Cal BP (UCIAMS 118016), 270 presumably when the lake became impounded by the dune. 271 272 The three lagoons cored in Hakai West are Kildidt Lagoonlet (a small bounded lagoon within the 273 larger Kildidt Lagoon) on Hunter Island (sill is 1.5 metre bhht – HW1), Stirling Lagoon on north 274 Stirling Island (sill is 1.75 metres bhht – HW5), and Kwakfitz Lagoon on Calvert Island (sill is 275 1.75 metres bhht – HW8). Sediment cores sampled from all three lagoons demonstrate a similar 276 stratigraphy. At Kwakfitz Lagoon, brackish and marine diatoms are present in the earliest part of 277 the core recovered which dates between 14,681 and 14,212 Cal BP (UCIAMS 128298), 278 revealing that high tide was near modern at that time. A similar very early marine signature is 279 found in the basal sediments of the Stirling Lagoon and Kildidt Lagoonlet cores but no material 280 suitable for dating was recovered (Figure 6; Table 3). All three Hakai West lagoon cores have 281 significant zones with freshwater diatoms, that reveal relative sea level was lower than modern 282 between 14,200 and 10,700 Cal BP. A brackish diatom assemblage replaces freshwater 283 indicators between 10,693 and 10,591 Cal BP (UCIAMS 128295) at Kwakfitz lagoon. Sediments 284 at the top of all lagoon cores have the appearance of intertidal sands with brackish or marine 285 diatom flora, indicating the sills were near or below modern higher high tide after 10,700 Cal BP. 286 287 3.1.2 Pond cores from Hakai East 288 The results from Hakai West can be contrasted with the single pond cored in Hakai East 289 (Gildersleeve Pond – HW6), which is situated at 13 metres ahht (Figure 7). The lowest 290 sediments sampled have associated marine diatoms and Mytilus edulis (blue mussel) shell 291 fragments which reveal a higher sea level stand that extends back in time to between 14,577-292 14,181 (UCIAMS 128291) and 14,345-14,243 Cal BP (UCIAMS 128330). A periwinkle shell 293 found right at the transition from marine to overlying freshwater sediments dates to 14,601-294 14,071 Cal BP (UCIAMS 134627). Gyttja dominates the upper part of the core. The base of the 295 freshwater gyttja unit dates to 13,717-13,511 Cal BP (UCIAMS 134826) indicating that relative 296 sea level had dropped below 13 metres before this time and has remained beneath this elevation 297 since that time. 298 299 3.2 Archaeological sites 300 Eighty-four radiocarbon ages (69 from this project and 15 from other researchers) with measured 301 elevations were acquired from 24 archaeological sites (Table 2). Of these, 39 are from ESP cores, 302 one is from an auger test, seven are from cut bank exposures, and 37 are from test excavations. 303 Most ESP samples were intended to date either the beginning of human occupation and/or the 304 start of organic soil accumulation. Data points from excavated archaeological strata include basal 305 occupation ages and other cultural bearing strata. All samples dated from archaeological sites are 306 assumed to be above high tide at the time of occupation and/or organic soil development. 307 308 3.2.1 Archaeological samples from Hakai West 309 There are 61 archaeological data points from 14 sites in Hakai West (Figure 5 - HW1, 2, 3, 4, 5, 310 6, and 7). Of these, six basal ages are reported by Cannon (2000) and two by Andrews and 311 Retherford (1978). The remaining 53 are new samples obtained by the present authors. Age 312 ranges of the samples help to constrain the sea level curve over the last 13,500 years. Three of 313
8
the more intensively investigated and dated archaeological sites have records spanning the past 314 10,000 years. 315 316 Cultural deposits at the Triquet Island Site (EkTb9 – HW4) include an early component with 317 lithics, faunal remains, and charcoal (Figure 8A, Table 1). The lowest cultural level dates to 318 between 11,396 and 11,285 years Cal BP (UCIAMS 118001) and is 1.7 metres ahht. Overlying 319 the basal component is a sharp contact with a peat layer containing cultural material, including 320 preserved wooden artifacts dating between 7300 and 4400 years Cal BP. Later Holocene cultural 321 deposits include a thick shell midden up to 5 metres deep, which started forming 6250 Cal BP. 322 Upper strata have not been dated but the depth of this deposit suggests that it was used well into 323 the late Holocene. In addition to these data from archaeological site EkTb9, intertidal testing on 324 the west side of Triquet Island (WTB) intersected a terrestrial soil with plant macrofossils, 325 charcoal, and sclerotia (2.2 metres bhht) dating between 10,666-10,499 Cal BP (UCIAMS 326 102763 and 102764). 327 328 The basal palaeosol at the Kildidit Narrows Site (ElTa18 – HW3) contained abundant charcoal 329 and sclerotia dating as old as 13,673 - 13,454 years Cal BP (UCIAMS 118046)(4.2 metres ahht), 330 but no unequivocal artifacts were recovered (Figure 8B, Table 1). By 10,757-10,701 Cal BP 331 (UCIAMS 117997), cultural remains are well represented and include stone tools, charcoal, and 332 faunal material. Later Holocene archaeological strata are also present (Table 1 - HW3). An 333 intertidal test found organic and peaty soil with preserved wood 0.5 metres bhht and dating 334 10,645-10,519 Cal BP (UCIAMS) suggesting that relative sea level was lower at this time. 335 336 The earliest intact cultural deposits and features at the Pruth Bay Site (EjTa15 – HW7) date 337 between 10,653 and 10,562 years Cal BP (UCIAMS 128290) and are 0 metres ahht suggesting 338 that sea level was close to modern during this period. From these archeological deposits, a hearth 339 feature, associated with stone tools and a post hole, dates to between 10,151 and 9924 years Cal 340 BP (UCIAMS 128265). Underlying sand deposits contain water-rolled flakes suggesting the 341 possibility of older cultural deposits. Sediments bearing archaeological materials overlie these 342 lower components indicating repeated usage of this site in later time periods as well (Figure 8C, 343 Table 1). 344 345 3.2.2 Archaeological samples from Hakai East 346 From the Hakai East region, we consider a total of 23 dating samples from nine archaeological 347 sites, including a basal date from excavations at Namu (Carlson, 1996; Cannon, 2000; 348 Rahemtulla, 2006) and six basal occupation ages from ESP tests at archaeological sites reported 349 on by Cannon (2000). Our study provides an additional 16 ages from ESP testing at four other 350 archaeological sites. 351 352 At the Namu site (ElSx1 – HE3), the earliest deposits bearing cultural materials date between 353 11,252 and 10,789 years Cal BP (WAT 452) and are situated 6.4 metres ahht. Only the basal age 354 at Namu is considered here as a constraining factor of sea level. Other dates from the site 355 demonstrate that occupation was continuous at the site since the early Holocene (Carlson, 1996; 356 Rahemtulla, 2006) with dated cultural material and evidence of occupation from each subsequent 357 millennia. 358 359

9
Basal archaeological occupations recorded through ESP testing by Cannon (2000) span from 360 6672 to 1090 years Cal BP. Like the early deposits at Namu, the two earliest sites tested are 361 situated at higher elevations: ElSx10 (HE3) (6177-5944 Cal BP – Beta 105480) at 3.4 metres 362 ahht and ElSx5 (HE1) (6791-6549 Cal BP – Beta 1096241) at 2.1 metres ahht. Later Holocene 363 basal occupations recorded by Cannon that post-date 3000 Cal BP are below 1.25 metres ahht 364 (HE1, 3 and 4). 365 366 ESP cores sampled by our research team targeted archaeological site locations above 3.5 metres 367 ahht as Cannon (2000) had revealed that early Holocene site deposits tended to be at or above 368 this elevation. Both early and late Holocene deposits were found, with the earliest deposits on a 369 raised terrace (14.2 metres ahht) at ElSx4 (HE1) dating between 8285 and 8165 Cal BP 370 (UCIAMS 102756). All four archaeological sites tested were occupied in the last 2000 years. 371 EkSw3 was the highest elevation site tested at approximately 18 metres ahht with basal cultural 372 deposits dating between 500 – 474 Cal BP (UCIAMS 102743). EkSx11 (HE5), in Kwakume 373 Inlet was found to have basal deposits (2.9 metres ahht) dating between 1988 and 1932 Cal BP 374 (UCIAMS 102745). ElSx11 (HE3), on Strawberry Island in Namu Lake (9.3 metre ahht) was 375 found to date between 1345 and 1183 Cal BP (UCIAMS 102746). This pattern of higher 376 elevation occupation sites in the late Holocene does not constrain the sea level. Rather, the 377 elevations of the sites may relate to their use as defensive sites; a late Holocene pattern that is 378 consistent elsewhere on the Northwest Coast (Ames and Maschner 1999). Other 379 contemporaneous late Holocene ages associated with archaeological sites suggest that sea level 380 was lower than present by 1 metre between 1,000 and 500 Cal BP, including deposits sampled at 381 ElSx4 and EkSx11 and others reported on by Andrews and Retherford (1978). 382 383 3.3 Ages from sedimentary exposures 384 A total of 15 data point points are included from nearshore sedimentary exposures that do not 385 include archaeological deposits. These include seven data points published by Andrews and 386 Retherford (1978), five of which are proxy indicators for terrestrial deposits. Two of their 387 samples indicated relict marine deposits above present day sea level at Hvidsten Point and 388 Shearwater. Hvidsten Point is situated in Burke Channel (Figure 5 – HE2) and the sample is 389 described as marine deposited sediments at approximately 6 metres ahht dating between 12,364 390 and 11,412 year Cal BP (Gak 3715). However, they observed no shell, diatoms, or other marine 391 indicators to corroborate this interpretation. We sampled clay from 5 – 6.5 metres ahht from this 392 same locale. The observed diatom flora is indicative of a freshwater environment. It is possible 393 that at least a part of Burke Channel was blocked by sediment or ice in this area resulting in a 394 freshwater deposition environment in the late Pleistocene. A sample of charcoal associated with 395 the freshwater deposits was dated to 12,628 – 12,569 Cal BP (UCIAMS 131386). 396 397 In contrast, clay sediments examined at the Shearwater site (Figure 5 - SW) at approximately 12 398 metres ahht produced shells that date between 13,735 and 12,978 Cal BP (GSC 1351). 399 400 New age data from sedimentary exposures on Calvert Island presented here include a total of ten 401 samples (HW6 and 9). One data point comes from the base of a sedimentary sequence that 402 Andrews and Retherford (1978) record a glacial advance at Foggy Cove on northwest side of 403 Calvert Island. However, Andrews and Retherford did not date this feature. Our crew revisited 404 this exposure selected a sample from an organic palaeosol at the base of this sequence that was 405
10
assessed with an age of 15,025 to 14,641 years Cal BP (UCIAMS 128336). Another data point 406 is from a log found embedded in a glaciomarine clay 2.2 metres bhht. This log may be driftwood 407 and dates between 14,729 and 14,231 Cal BP (UCIAMS 115817). The other eight new data 408 points provide terrestrial indicators such as peat or dunes ranging from 16.25 metres ahht to 1.75 409 bhht and dating between 10,750 and 1570 Cal BP. 410 411 3.4 Ages from ocean cores 412 The dataset presented here includes offshore samples reported in Luternauer et al. (1989), Barrie 413 and Conway (2002a), and Hetherington et al. (2004). From Cook Bank (Figure 5 – OS2), 65 km 414 southwest of Hakai Passage, Luternauer et al. (1989) provide core samples obtained from a depth 415 of 98.5 metres bhht. Terrestrial sediment from this depth contained the remains of rooted plants 416 and wood revealing that relative sea level was lower than 98.5 metres bhht from at least 12,400 417 to 12,100 Cal BP. After this time it rose above 98.5 metres bhht. 418 419 From Goose Bank, 40 km northwest of Hakai Pass, Barrie and Conway (2002a) report on 420 samples recovered from offshore coring operations (Figure 5 – OS1). Three additional data 421 points from this work are given in Hetherington et al. (2004). These researchers identify a 422 palaeo-shoreline based on the recovery of intertidal shellfish and their data reveal that relative 423 sea level was between 135.5 and 123.5 metres bhht during the time spanning 15,000 and 12,000 424 Cal BP. 425 426 3.5 Sea level curves for the Hakai region 427 To interpret the variability within the broader relative sea level dataset, we grouped the data into 428 respective sub-regions for Hakai West, Hakai East, Cook Bank, and Goose Bank and graphed 429 each by elevation (relative to hht) and by calibrated age range. These regional relative sea level 430 curves thus approximate changes in the higher high tide position through time. Data points from 431 basal archaeological deposits are assumed to be above higher high water. In some cases, these 432 basal occupations may have been several metres above higher high water and, for this reason, 433 these data only limit sea level to some elevation below. Most habitation sites on this part of the 434 Northwest Coast are in close proximity to the high tide mark having been occupied by people 435 reliant on the sea for transportation and diet. 436 437 3.5.1 Hakai West sea level curve 438 The Hakai West relative sea level curve includes islands to the west of Fitz Hugh Sound on the 439 north and south sides of Hakai Pass (Figure 10 and Figure 12). The earliest data point is from 440 terrestrial deposits below what may be a glacial advance sequence (cf Andrews and Retherford, 441 1978), suggesting that relative sea level was below 1.5 metres ahht 15,025-14,641 Cal BP. Soon 442 after (14681-14001 Cal BP), marine diatoms were deposited in the basal sediments of the three 443 lagoon cores and Big Spring Lake, which indicates that relative sea level rose to above 6 metres 444 ahht. Around 14,500 Cal BP, relative sea level began to regress and, between 14,000 and 10,000 445 Cal BP, relative sea level dropped to a lower position than today as indicated by freshwater 446 diatoms in the lagoon cores. Between 10,700 and 10,500 Cal BP, relative sea level rose from this 447 lower position to 1.75 metres bhht and all of the lagoons cores have intertidal sediments from 448 this time onwards. Archaeological deposits constrain the upper end of high tide after 10,700 BP 449 to within 2 metres of present. One small transgression (1 to 2 metres ahht) appears to have 450 occurred between 6,000 - 5,000 Cal BP. 451

11
452 3.5.2 Hakai East sea level curve 453 The Hakai East relative sea level curve is specific to the region on the East Side of Fitz High 454 Sound and includes Fish Egg Inlet to the south and the southwestern tip of King Island to the 455 North (Figure 11 and Figure 12). The earliest ages for this curve come from Gildersleeve Pond 456 with a sill elevation of 13 metres ahht, revealing that it was inundated by marine and brackish 457 water between 14,345 and 14,243 Cal BP (UCIAMS 128330). Basal (terrestrial) ages for 458 archaeological deposits at Namu indicate that relative sea level was below 6 metres ahht between 459 11,252 and 10,789 Cal BP. All remaining data points on the curve after this time are terrestrial 460 and suggest that sea level dropped below 2 metres ahht over the next 5,000 years (sites ElSx4, 461 ElSx5, ElSx10, Table 1). In the late Holocene, relative sea level drops to modern or slightly 462 below modern levels between 4,000 and 3,000 Cal BP, which is consistent with the trend seen in 463 the Hakai West curve. 464 465 3.5.3 Cook Bank sea level curve 466 The data for Cook Bank reveals that sea level was lower than 98.5 metres bhht from at least 467 12,931 to 11,999 Cal BP (RIDDL 984) (Luternauer et al. 1989). Wave cut terraces at 102.5 468 metre bhht suggest that relative sea level may have been at least 4 metres lower than this. At this 469 time, Cook Bank would have been a low-lying coastal plain connected to the north end of 470 Vancouver Island (see shaded bathymetry in Figure 5). Subaerial exposure of this landform was 471 the result of isostatic uplift, or a glacial forebulge effect (Clague, 1983) that was sufficient to 472 raise the area above global sea level. Transgression of the core site occurred sometime around 473 11,400 Cal BP, which resulted in drowning of the Cook Bank plain from the combined effects of 474 forebulge collapse, following regional deglaciation, and eustatic sea level rise. 475 476 3.5.4 Goose Bank sea level curve 477 Recovery of intertidal shellfish in deposits on Goose Bank at depths as deep as 135.5 metres bhht 478 provided data for the construction of a regional relative sea level curve (Barrie and Conway 479 2002a; Hetherington et al. 2004). The Goose Bank data suggest that relative sea level was 135.5 480 metres bhht between 14,599 and 13,980 Cal BP (TO 9309) and then it rose to 97.5 metres bhht 481 between 11,600-11,243 Cal BP (RIDDL 979). At this time, Goose Bank would have been a large, 482 low-lying island (approximately 50 km x 40 km). 483 484 3.5.5 Outlying data points 485 One data point, from Shearwater, does not fit conformably with the relative sea level curves 486 generated for our sub regions (Andrews and Retherford 1978). This data point reveals that 487 Shearwater was submerged more than 12 metres ahht between 13,735 and 12,978 Cal BP (GSC 488 1351). This is the most northerly, and therefore the most likely to be glacial proximal of the data 489 points considered and it may have been more affected by isostatic depression accounting for it 490 being an outlier. The next closest data point is Kildidt Lagoonlet, 22 km to the south of 491 Shearwater and has near contemporaneous dates of 13981-13851 (UCIAMS128294) to 11124-492 10868 (UCIAMS 128293) associated with a freshwater diatom flora that indicate that relative sea 493 level in that area was below 1.5 metres bhht at the same time. 494 495 Andrews and Retherford (1978) suggest that sea level was at or above 11 metres ahht between 496 12,364 and 11,412 Cal BP at Hvidsten Point based on their interpretation of a sedimentary 497

12
exposure there. However, our analysis of diatoms from the same deposit reveals that this data 498 point is freshwater rather than marine. This data point may be associated with a localized 499 impoundment, by sediment or ice, of Burke Channel during the late Pleistocene and may reflect 500 this rather than relative sea level. 501 502 For the Bella Coola Valley (inland of North Bentick Arm), approximately 140 km east of the 503 study area, Retherford (1972) reports on a number of marine terraces and deltas situated between 504 200 and 250 metres ahht. In South Bentick Arm, 100 km to the east of Hakai Pass, similar 505 features at about 200 metres ahht are attributed to high early post-glacial sea levels (Retherford 506 1972). Hall (2003) reports on a single age on marine shell collected from an exposure in the 507 Bella Coola Valley near the mouth of Saloompt River. No elevation is given for the sample but 508 based on the geographical description, it is above 52 ahht and dates to 11,400 Cal BP. Combined 509 these additional data points provide further evidence of the localized contexts for sea level 510 change in the region. 511 512 4 Discussion 513 The Hakai West sea level curve (Figure 12) reveals that relative sea level in the area has been 514 within 10 metres of present over the last 15,000 years. The Hakai East sea level curve shows 515 more variation with sea level dropping 15.5 metres over the same period. The data presented 516 here demonstrate that a sea level 'hinge' existed between regions with higher and lower (than 517 today) relative sea levels on the central Pacific coast of Canada (Figure 13). The sea level hinge 518 was found to be most stable in the Hakai West region. However, moraines and other glacial 519 features on the landscape reveal that it is likely that much of the Hakai West region was under 520 ice some time before 15,000 BP. During this time, with the increased volume of ice on land it is 521 possible that the sea level hinge was located further offshore. 522 523 The Hakai area is a part of a larger region that extends southeast to northwest along the eastern 524 shores of Queen Charlotte Sound, Hecate Strait, Dixon Entrance, and Clarence Channel along 525 which we argue that a similar hinge-like area may be located (Fedje et al., 2004; McLaren, 2008; 526 McLaren et al., 2011; Shugar et al., in review, this volume). Migration of this hinge through time 527 was dependent on local isostatic and global eustatic factors. The stability of any particular area 528 within this region was dependent on localized factors pertaining to the amount of ice and tectonic 529 activity. It is uncertain whether hinge areas as stable as Hakai West occur elsewhere along the 530 coast. 531 532 The degree of stability of the shoreline in the Hakai region, and in the Hakai West area in 533 particular, is remarkable. Elsewhere, the interplay between eustatic, isostatic, and tectonic factors 534 tend to result in substantial changes to shoreline elevation through time. This stability means that, 535 in the Hakai region, isostatic rebound was occurring at equal pace with global eustatic sea level 536 rise at the end of the last glaciation. Between 14,000 and 10,000 Cal BP eustatic sea level rise 537 was approximately 1.2 cm per year (Fairbanks, 1989). As relative sea level remained essentially 538 constant, isostatic rebound rates for the Hakai West region must have been comparable. This 539 pattern also suggests that the area has remained relatively tectonically stable over the Holocene 540 accounting for very little change in relative sea level (see Shugar et al., in review, this volume for 541 a discussion of tectonics and sea level change). 542 543

13
Places with stable shorelines allow relatively uninterrupted accumulation of archaeological 544 deposits over long periods of time. In theory, these larger accumulations should be easier to find 545 and they would be expected to retain long records of cultural and ecological information. Places 546 where early archaeological deposits occur may be similar to places that are suitable for coastal 547 habitation today, such as pocket beaches, harbours, and tombolos. This can be contrasted with 548 areas such as Goose Bank, Haida Gwaii, and non-glaciated regions around the globe where late-549 Pleistocene shorelines are drowned by up to 150 metres rendering them very difficult to access, 550 or inland areas such as Kitimat or the Fraser Valley where relative sea level was 200 metres 551 higher than today and where significant glaciations occurred up until the end of the Pleistocene. 552 553 Relative stability in sea level allows for the establishment of persistent places across the 554 landscape. Of the archaeological sites tested, four show persistent occupation for 10,000 or more 555 years: Namu (ElSx1), Kildidt Narrows (ElTa18), Triquet Island (EkTb9), and Pruth Bay 556 (EjTa15). It is highly likely that there are several other sites in the area with equally long records. 557 This pattern of site re-use and persistence differs from settlement patterns on Haida Gwaii (200 558 km west of the study area) where early and late period sites tend not to co-occur (Mackie and 559 Sumpter 2005) and where Holocene sea level rose to 15 metres ahht and then fell back to modern 560 levels. 561 562 The identification of a sea level hinge is of particular interest for investigations into early period 563 archaeology of the Northwest Coast and the peopling of the Americas (Fedje et al., 2004; Mackie 564 et al., 2013). Fladmark (1979) presented a compelling argument in which the Northwest Coast is 565 depicted as the most likely route by which early human inhabitants of the Americas 566 circumnavigated the continental ice sheets that covered much of Canada during the Last Glacial 567 maximum. In their comprehensive review of the timing of the LGM, Clague et al. (2004) argue 568 that post glacial human occupation of outer coastal areas of Southeast Alaska and British 569 Columbia could have occurred as early as 16,000 Cal BP. Early archaeological sites to the south 570 including Paisley Caves (Gilbert et al., 2008; Jenkins et al., 2012) in Oregon, and Manis 571 Mastodon (Gustafson et al. 1979; Waters et al. 2011) in Washington State, reveal that the 572 western margins of North America was occupied by at least 13,800 Cal BP. The research 573 presented here has revealed potential shoreline targets for archaeological prospection up to 574 15,000 years old, providing potential for future investigations into the early human occupation of 575 the Americas. 576 577 5 Conclusions 578 This paper presents a relative sea level history spanning the past 15,000 years for the Hakai 579 Passage region on the central Pacific coast of Canada. Data was gathered using geological and 580 archaeological methods. Overall, the research presented here demonstrates that relative sea level 581 remained remarkably constant through this 15,000 year period despite the large scale changes 582 resulting from global eustatic and regional isostatic processes during the same time period. The 583 evidence reveals that isostatic rebound kept pace with eustatic sea level change and uplift over 584 this period. Part of the reason for this stability is that the study area is located on a sea level 585 hinge between a region with higher relative sea level to the east and lower relative sea level to 586 the west. The sea level history of the study area demonstrates that sea level change in ice-587 proximal regions can be highly variable and localized (see also Shugar et al. in review). Attempts 588 to model sea level change in any region along the Pacific coast of Canada and southern Alaska 589

14
need to take local, regional, and global influences into account. The sea level history presented 590 here will enable research to more effectively target sites that have the potential to lengthen the 591 record of human occupation in the region to early post-glacial times. 592 593 6 Acknowledgements 594 595 The research presented here was undertaken in Heiltsuk, Wuikinuxv, and Nuxalk Territories, and 596 we gratefully acknowledge the support of these Nations. The authors are very appreciative for 597 funding and generous logistical support provided by Eric Peterson and Christina Munck 598 through the Tula Foundation, Hakai Beach Institute, and the Hakai Network. Additional 599 funding was provided via Natural Sciences and Engineering Research Council (NSERC) 600 Discovery grants to Ian Walker and Olav Lian, an NSERC Post-graduate Scholarship (PGS-D) to 601 Jordan Eamer, a MITACS Elevate Post-Doctoral Fellowship to Dan Shugar, and Hakai Network 602 Post-doctoral fellowships to Duncan McLaren and Christina Neudorf. Work reported on here 603 was conducted under permits from the BC Archaeology Branch (#2011-171) and BC Parks 604 (#105588 and #105935). Many people assisted with field work and logistics including 605 Wayne Jacob, Rod Wargo, Sky McEwan, Grant Callegari, Elroy White, Robert Windsor, 606 Brodie Lawson, Andrea Walkus, Joshua Vickers, Jennifer Carpenter, Harvey Humchitt, 607 Johnny Johnson, Peter Johnson, Patrick Johnson, Dana Lepofsky, Ken Lertzman, Julia Jackley, 608 Jenny Cohen, Aurora Skala, Seonaid Duffield, David Fargo, Cecilia Porter, Brittany Walker, 609 Cathy Rzeplinski, Jim Stafford, Dan Huesken, Steven Acheson, Brie Mackovic, Libby Griffin, 610 Bryn Fedje, Joanne McSporran, John Maxwell and the staff at the Hakai Beach Institute. 611 612 613

15
614 Figure 1. Regional sea level curves constructed for the Pacific Coast of Canada. Victoria: Fedje et al. (2009) and James et 615 al. (2009); Dundas: McLaren et al. (2011); Prince Rupert and south Haida Gwaii: Fedje et al. (2005); global eustatic: 616 Peltier and Fairbanks (2006). This figure illustrates the diversity of relative sea level curves on the Northwest Coast. 617 618 619 620
16
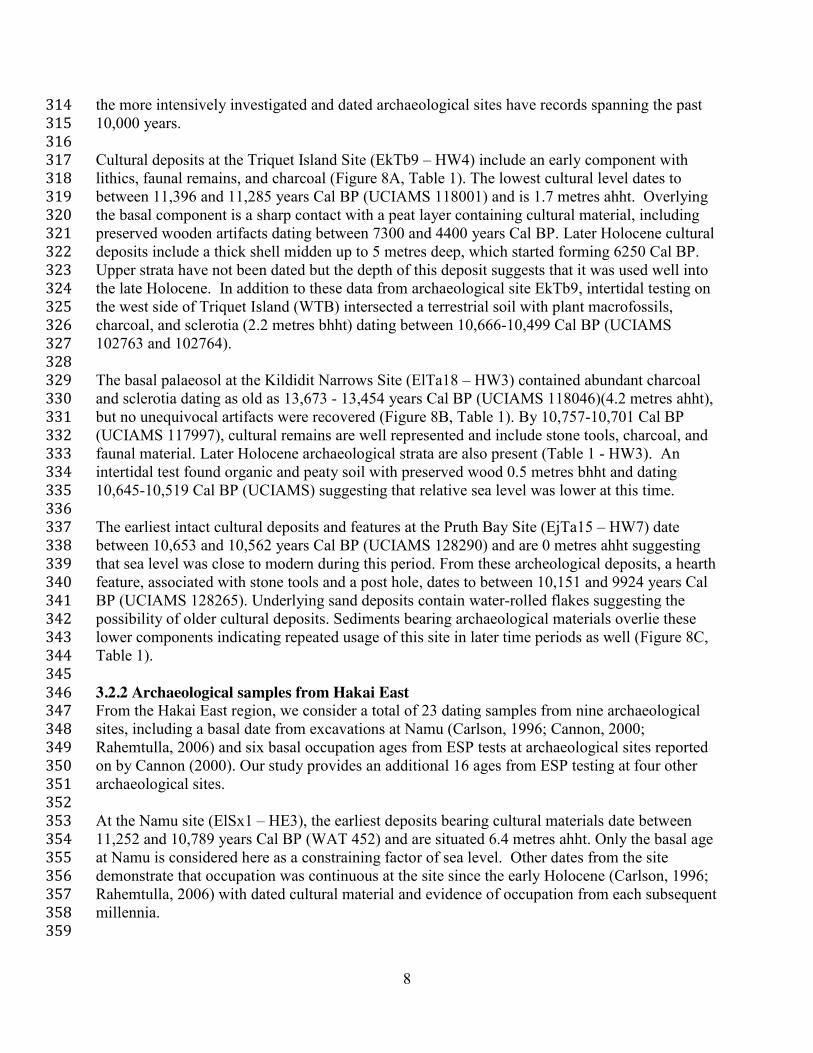
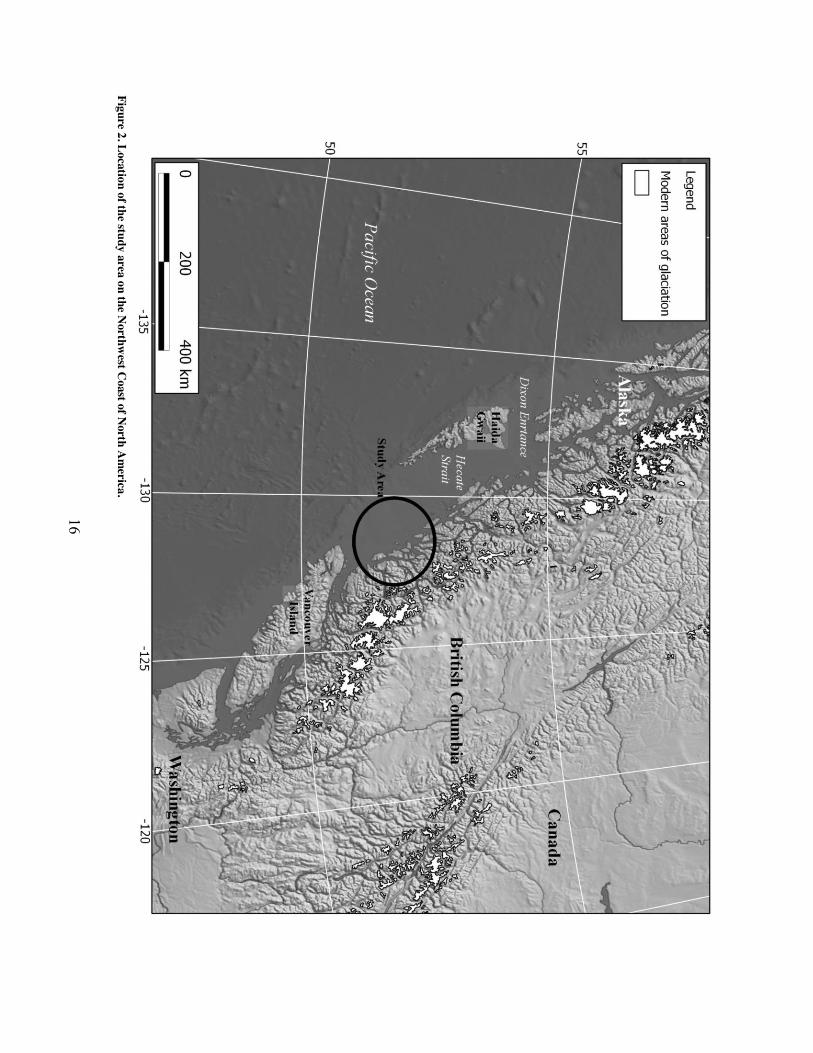
Figure 2. Location of the study area on the N
orthwest C
oast of North A
merica.
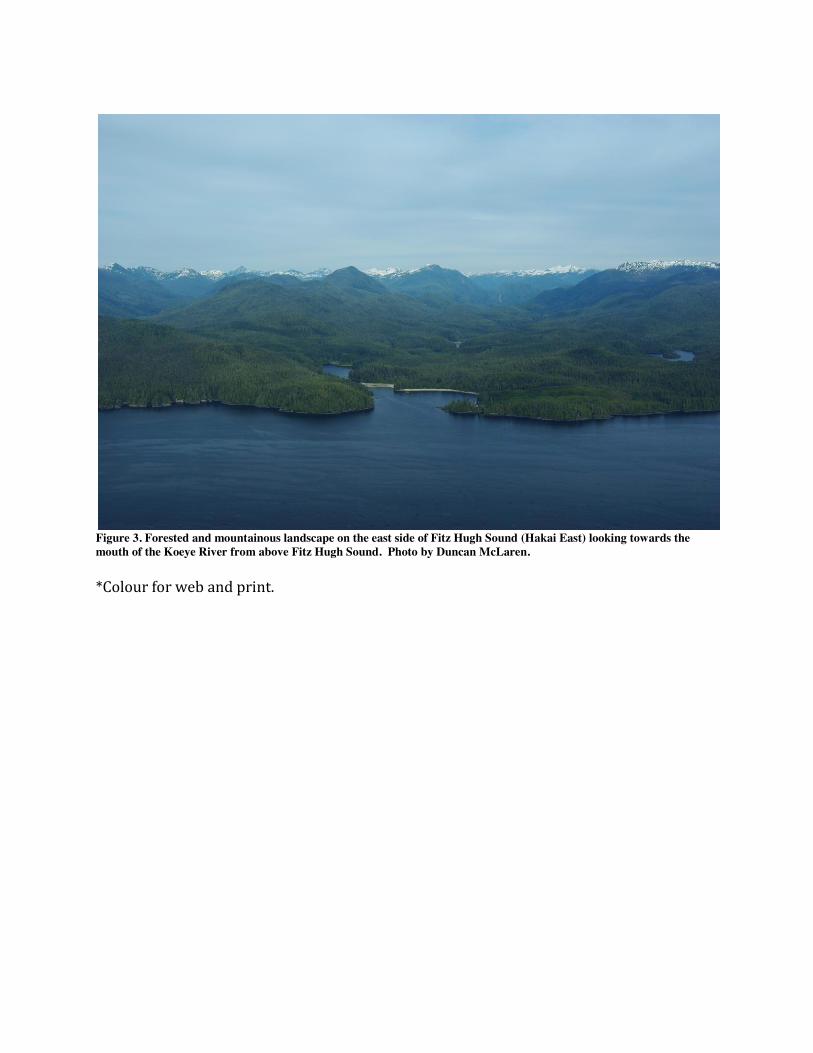
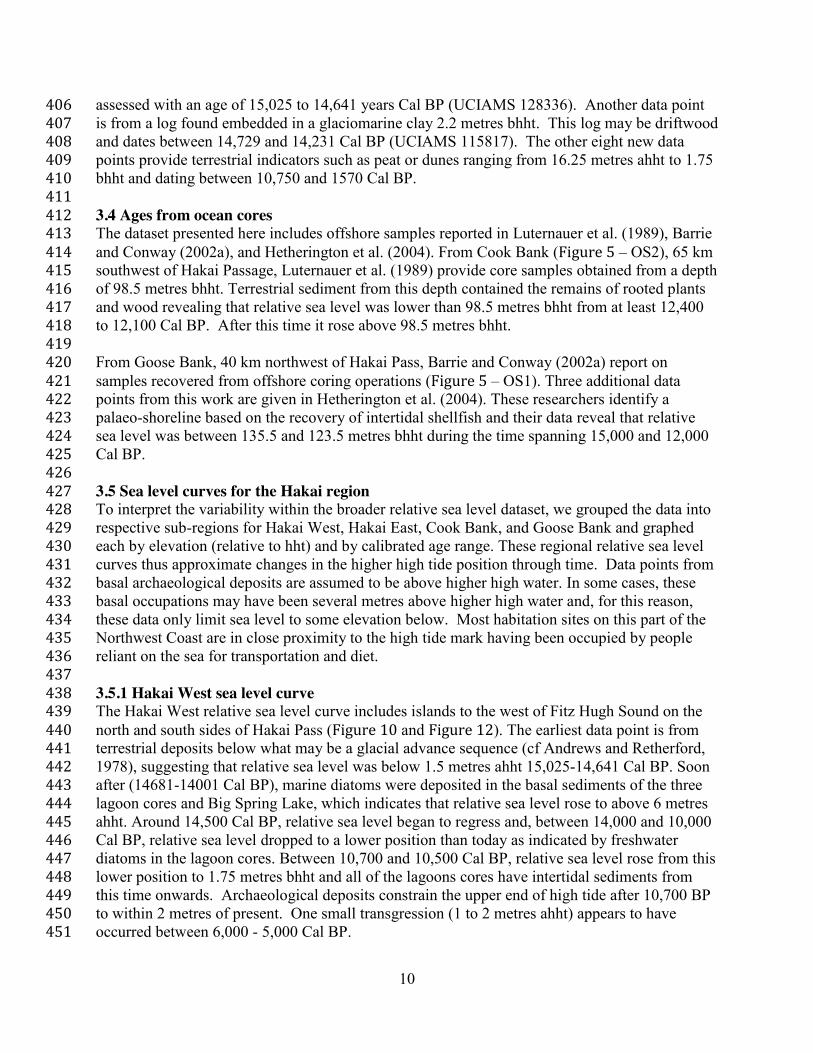
Figure 3. Forested and mountainous landscape on the east side of Fitz Hugh Sound (Hakai East) looking towards the mouth of the Koeye River from above Fitz Hugh Sound. Photo by Duncan McLaren. *Colour for web and print.
18
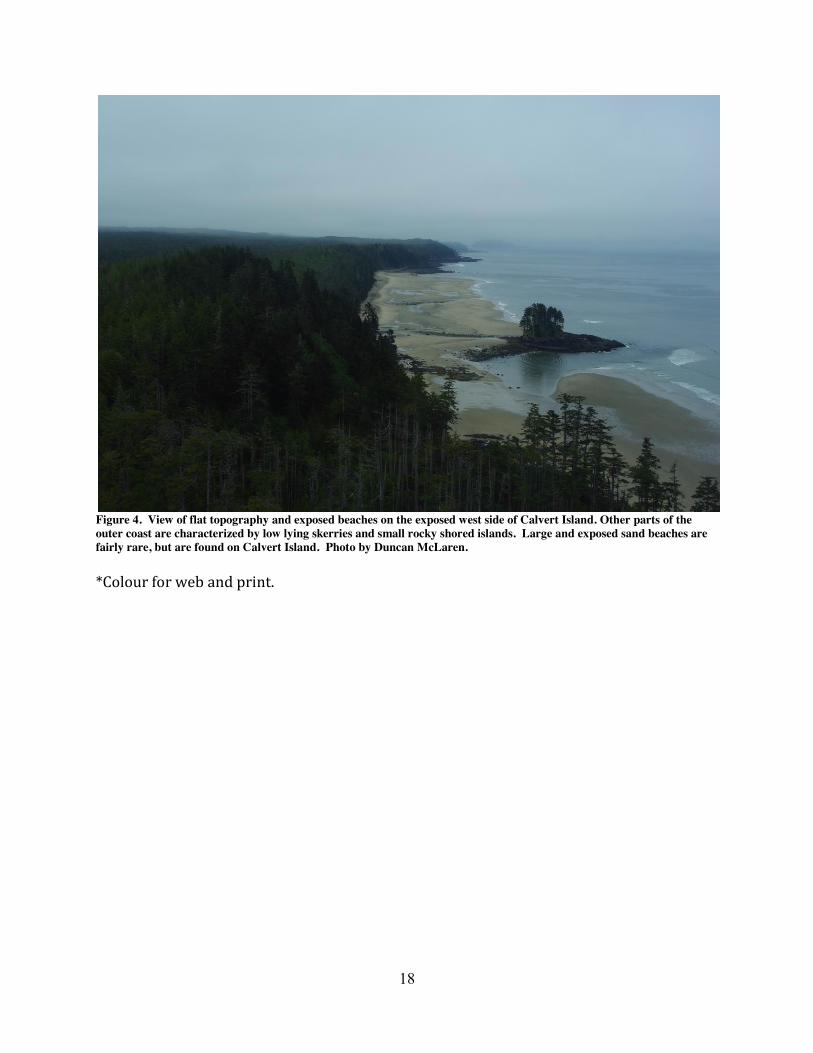
Figure 4. View of flat topography and exposed beaches on the exposed west side of Calvert Island. Other parts of the outer coast are characterized by low lying skerries and small rocky shored islands. Large and exposed sand beaches are fairly rare, but are found on Calvert Island. Photo by Duncan McLaren. *Colour for web and print.
19
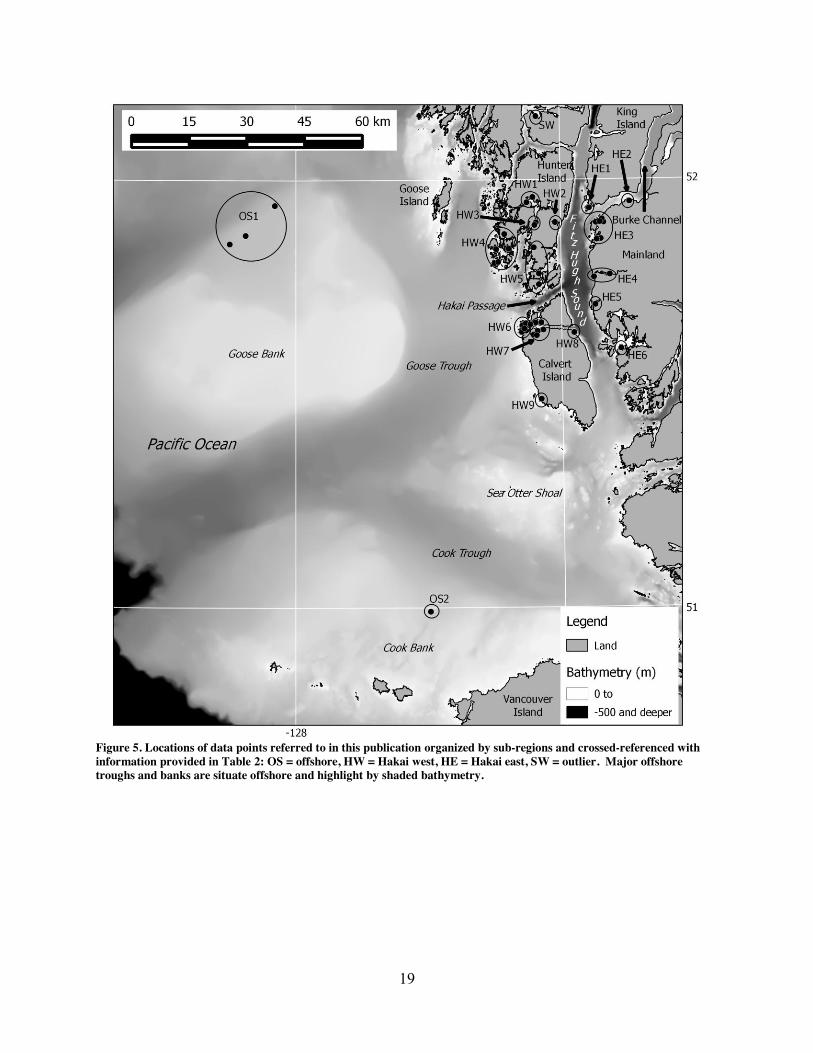
Figure 5. Locations of data points referred to in this publication organized by sub-regions and crossed-referenced with information provided in Table 2: OS = offshore, HW = Hakai west, HE = Hakai east, SW = outlier. Major offshore troughs and banks are situate offshore and highlight by shaded bathymetry.

20
Figure 6. Isolation basin core stratigraphy from Hakai West. F = freshwater diatoms, B = brackish diatoms, M = marine diatoms. Elevation estimates for the sill of each pond or lagoon core is given below each core log. All basins were impounded by rock sills with the exception of Pond ‘C’ which is dune impounded. All radiocarbon dates are Cal BP.

21
Figure 7. Isolation basin core stratigraphy from Hakai East, Gildersleeve pond 13 metres ahht. F = freshwater diatoms, B = brackish diatoms, M = marine diatoms. The stratigraphic record demonstrates that high tide was more elevated than this position before 14,345 - 14,243 Cal BP.

22
Figure 8. Selected stratigraphic profiles from test excavations conducted at A) Triquet Island (EkTb9 – basal date is 1.7 m ahht), B) Kildidt Narrows (ElTa18 – basal date is 4.2 m ahht), and C) Pruth Bay (EjTa15 – basal date is 0.1 m ahht).
23
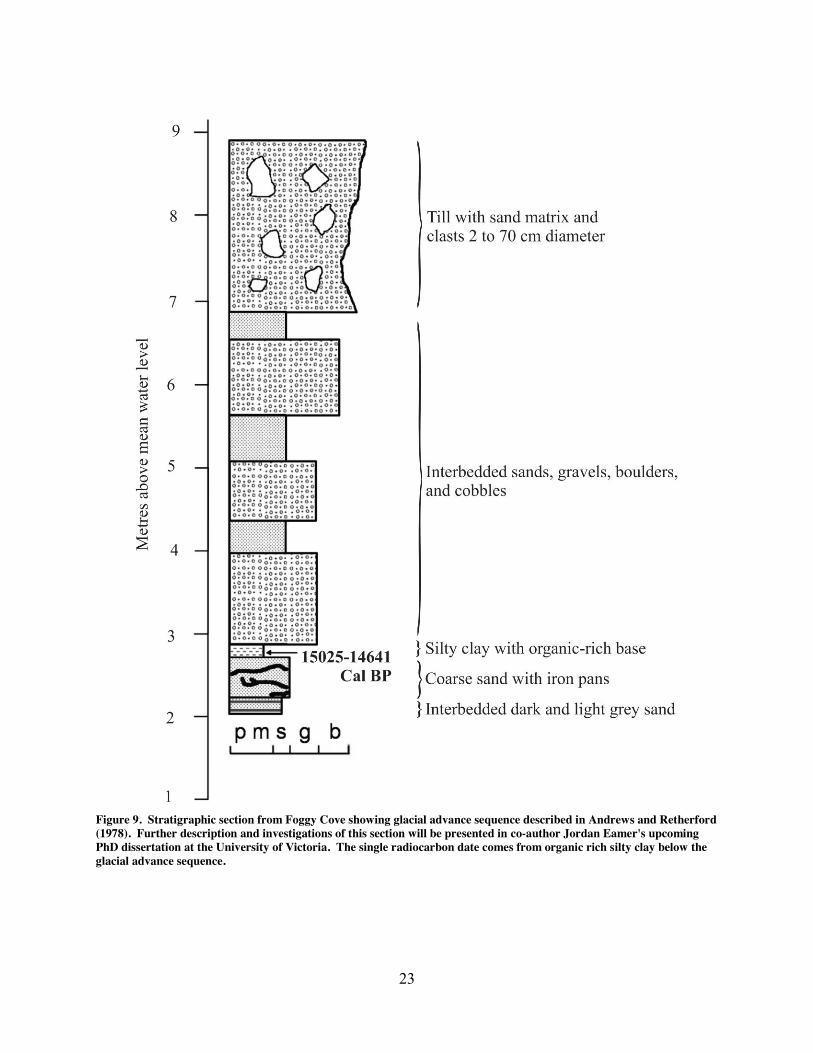
Figure 9. Stratigraphic section from Foggy Cove showing glacial advance sequence described in Andrews and Retherford (1978). Further description and investigations of this section will be presented in co-author Jordan Eamer's upcoming PhD dissertation at the University of Victoria. The single radiocarbon date comes from organic rich silty clay below the glacial advance sequence.

24
Figure 10. Index points and sea level curve for the H
akai West region of the study area. D
ata points are coded as follows: green- above higher high tide, red – intertidal,
blue – below low
tide.
25
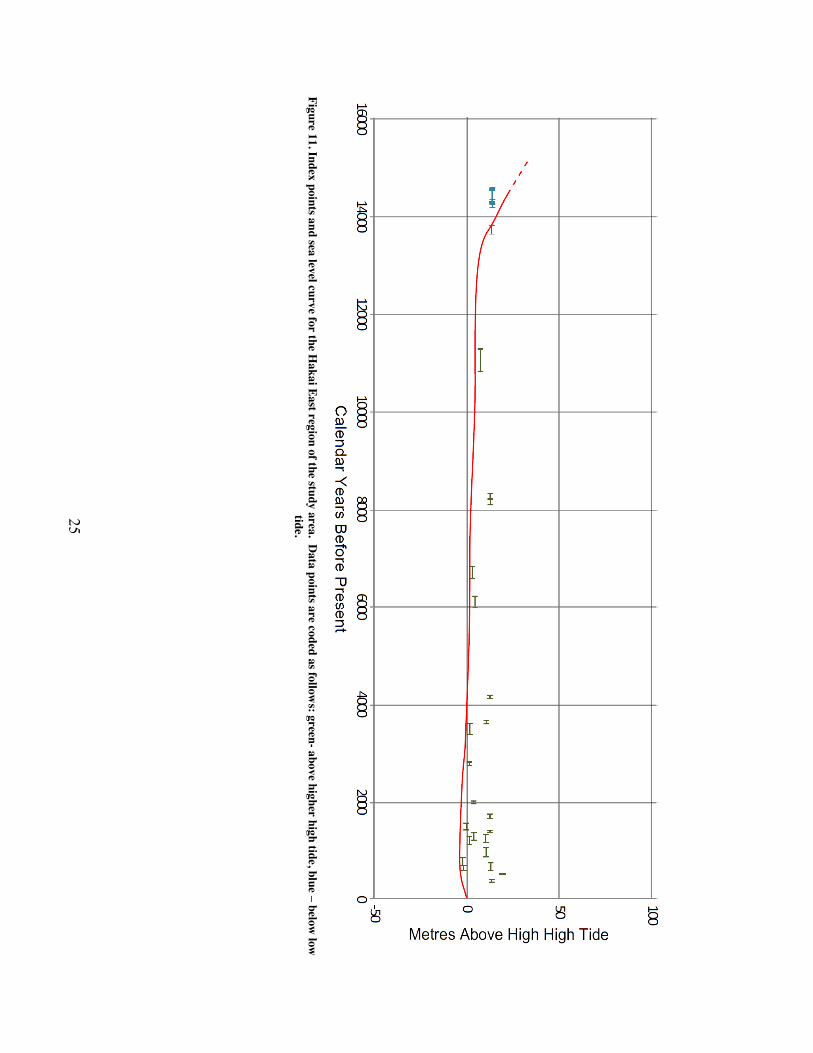
Figure 11. Index points and sea level curve for the H
akai East region of the study area. Data points are coded as follow
s: green- above higher high tide, blue – below low
tide.

26
Figure 12. R
elative sea level curves for the study area including global eustatic (Peltier and Fairbanks 2006), Hakai (W
est, East) and offshore relative sea level curves (Barrie and C
onway 2002, Luternauer et al. 1989). D
ata points are coded as follows: green- terrestrial, red - intertidal, blue - m
arine. *Colour for w
eb and print.

27
Figure 13. Stylized cross-section of study area showing the effects of isostatic and eustatic adjustments and the presence of a forebulge on relative sea level through time.

28
Table 1. Table showing indicative meaning of samples collected. Sea Level Position Indicator Type Indicative Meaning Limitation
Above
Archaeology site, habitation site and/or shell midden, charcoal rich, with lithics
and other artifacts
Most habitation sites in the region are situated
adjacent to the shoreline but above the high tide
line
Limited to indicating that intertidal zone was below
the elevation of the sample. Intertidal site types such as fish traps
and clam gardens are not included
Above Freshwater diatoms sediments.
The sample or sill of the depositional basin was above high tide when
deposited
Limited to indicating that the intertidal zone was below the elevation of
the sample
Above Peat deposit The peat developed above high tide
Limited to indicating that the intertidal zone was below the elevation of
the sample
Above Organic soil The soil developed above high tide
Limited to indicating that the intertidal zone was below the elevation of
the sample
Marginal Brackish diatoms from sediments
The sample or sill of the depositional basin was between low and high tide when deposited
Indicating that the sample was deposited in
the intertidal zone
Marginal In situ intertidal faunal remains, e.g. shell fish
The sample was in the between low and high tide when deposited
Indicating that the sample was deposited in
the intertidal zone
Below Marine diatoms from sediments
The sample or sill of the depositional basin was below low tide when
deposited
Limited to indicating that the intertidal zone was
above this sample
Below In situ sub-tidal faunal remains
The sample or sill of the depositional basin was below low tide when
deposited
Limited to indicating that the intertidal zone was
above this sample

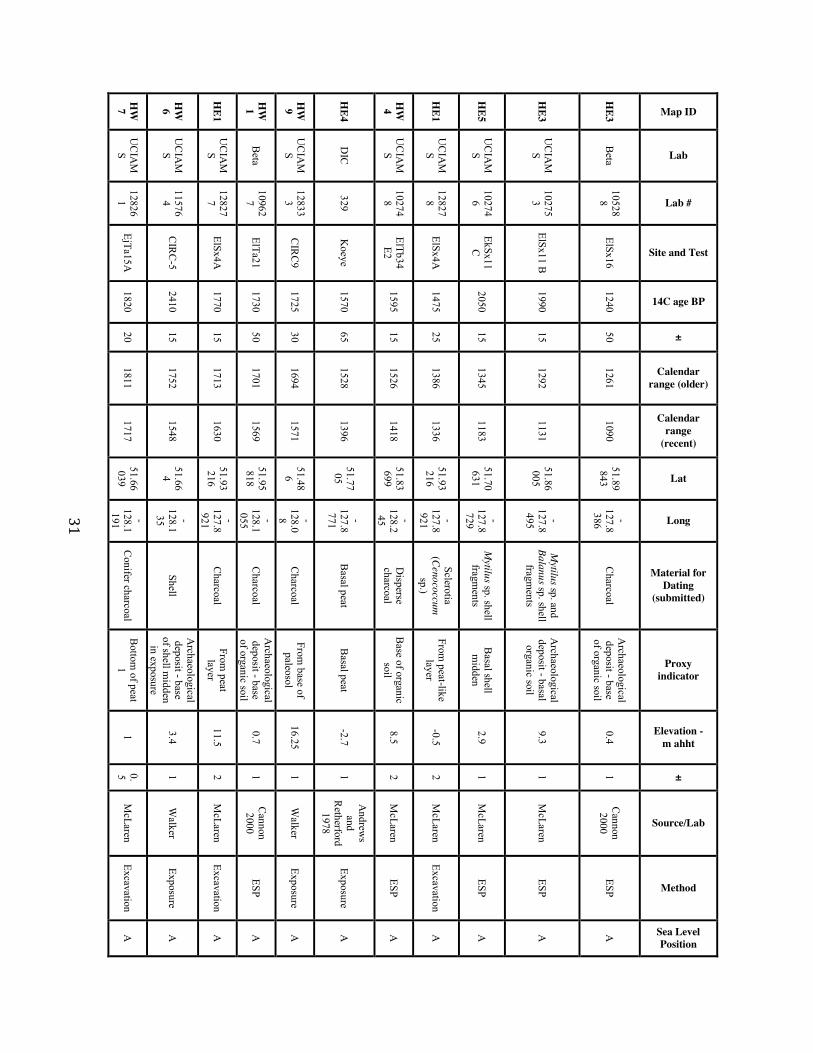
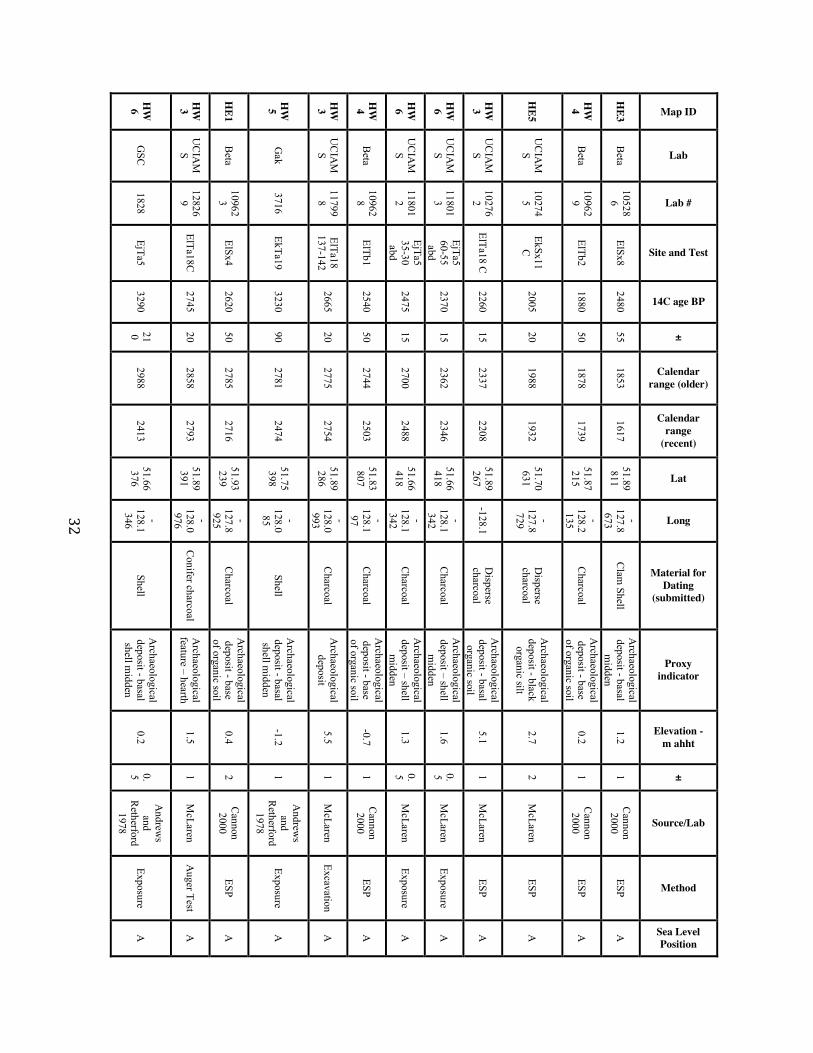
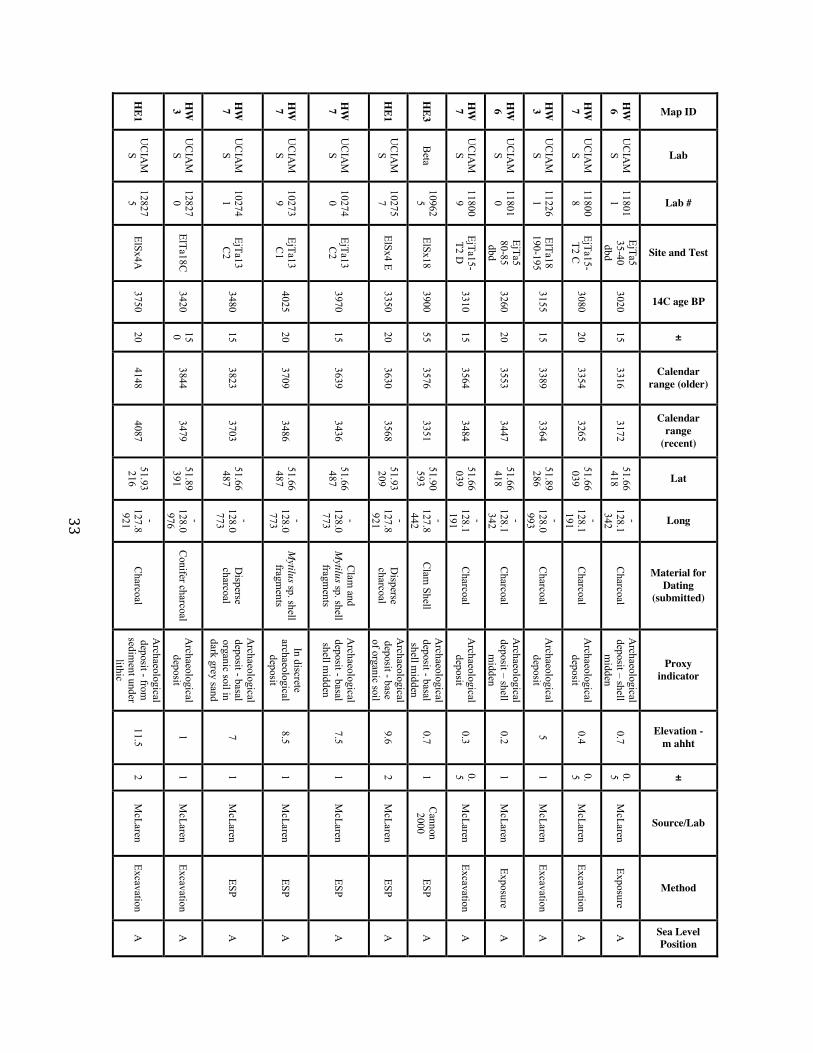
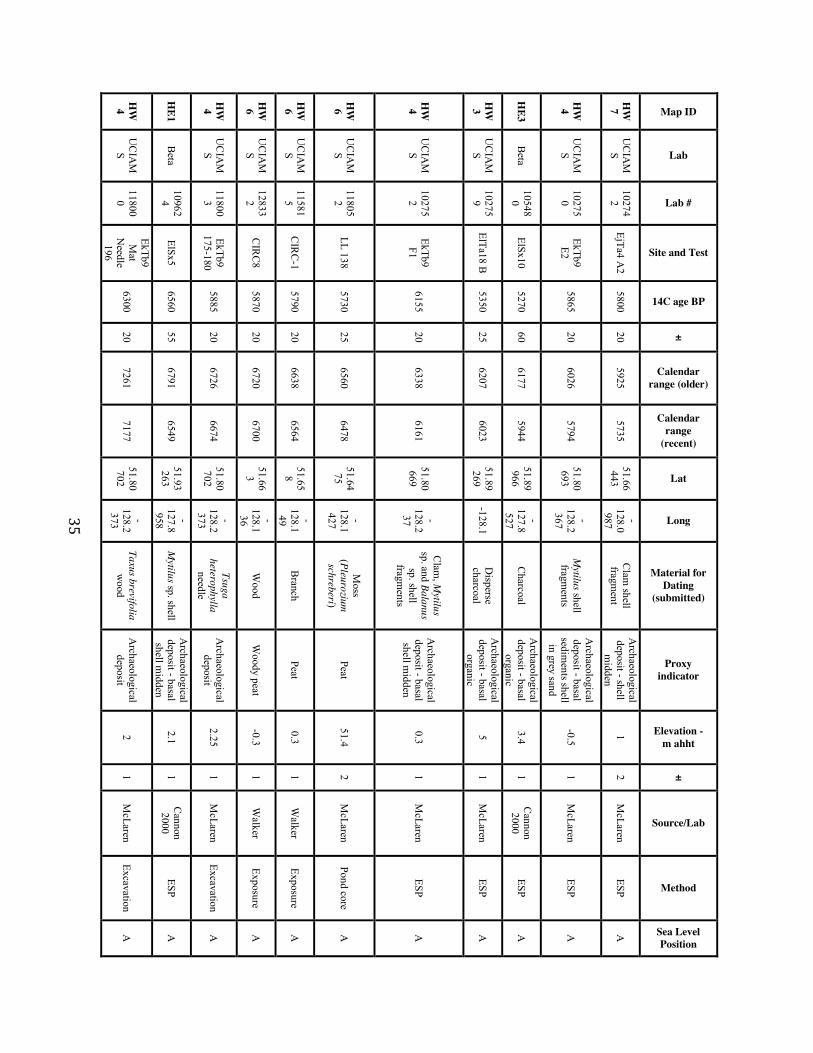
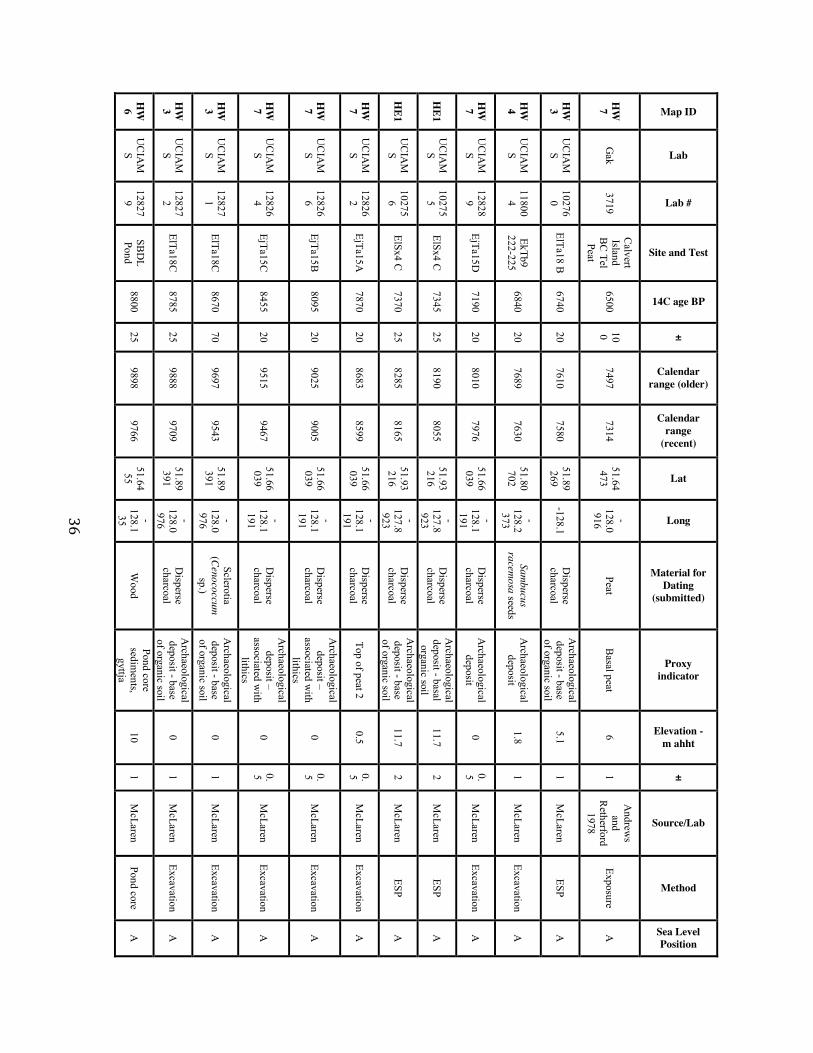
29 Table 2. List of all data points w
ith information pertinent to the construction of sea level curves for the H
akai region. The 'Map ID
' column cross-references w
ith point groups on Figure 5 and classifies points based on the sea level curve that they have been applied tow
ard: OS = offshore, H
W = H
akai west, H
E = Hakai east, SW
= outlier. Sam
ple are from the follow
ing regions: OS1 = G
oose Bank, OS2 = C
ook Bank, MS = M
cMullen G
round, SW = Shearw
ater, HW
1 = Kildidt Lagoon, H
W2 =
eastern Hunter Island, H
W3 = K
ildidt Narrow
s, HW
4 = Nulu w
est, HW
5 = Nulu east, H
W6 = C
alvert beaches, HW
7 = Kw
akshua Channel, H
W 8 = K
wak-Fitz Lagoon,
HW
9 = SW C
alvert, HE1 = southw
estern King Island, H
E2 = Hvidsten Point, H
E3 = Nam
u area, HE4 = low
er Koeye R
iver, HE5 = K
wakum
e Inlet, HE6= G
ildersleeve Pond. C
alendar range is 1 sigma. The 'Sea Level Position' indicates A
(above), M (m
arginal), B (below).
Map ID
Lab
Lab #
Site and Test
14C age BP
±
Calendar range (older)
Calendar range
(recent)
Lat
Long
Material for Dating
(submitted)
Proxy indicator
Elevation - m ahht
±
Source/Lab
Method
Sea Level Position
HW7
UC
IAM
S 11800
6 EjTa15-T2 A
2 90
15 251
35 51.66039
-128.1191
Sclerotia (C
enococcum
sp.)
Top of archaeological
deposit 1.1
0.5 M
cLaren Excavation
A
HE1
UC
IAM
S 12827
6 ElSx4A
345
20 378
320 51.93216
-127.8921
Charcoal
From top of
archaeological deposit - shell
midden
12.5 2
McLaren
Excavation A
HW7
UC
IAM
S 11800
5 EjTa15-T2 A
1 270
20 419
291 51.66039
-128.1191
Charcoal
Archaeological
deposit 1.1
1 M
cLaren Excavation
A
HE4
UC
IAM
S 10274
3 EkSw
3 A
395 15
500 474
51.77671
-127.8175
Disperse
charcoal
Archaeological
deposit - basal organic silt in
association w
ith fire cracked rock
18 2
McLaren
ESP A
HE4
UC
IAM
S 10274
4 EkSw
3 B
405 15
502 482
51.77672
-127.8175
Disperse
charcoal
Archaeological
deposit - basal shell m
idden 18.5
2 M
cLaren ESP
A
HW3
UC
IAM
S 10276
1 ElTa18 C
1355
15 655
535 51.89267
-128.1 Strongylocentrot
us sp. spine fragm
ents
Archaeological
deposit - basal shell m
idden 5.3
1 M
cLaren ESP
A

30
Map ID
Lab
Lab #
Site and Test
14C age BP
±
Calendar range (older)
Calendar range
(recent)
Lat
Long
Material for Dating
(submitted)
Proxy indicator
Elevation - m ahht
±
Source/Lab
Method
Sea Level Position
HE1
UC
IAM
S 10275
8 ElSx4 IT
660 20
663 567
51.93228
-127.8929
Tsuga heterophylla
needle
Intertidal test w
ith underlying
archaeological deposits
-2.7 0.5
McLaren
ESP A
HW7
UC
IAM
S 11800
7 EjTa15-
T2 B
710 15
674 664
51.66039
-128.1191
Charcoal
Archaeological
deposit 0.6
0.5 M
cLaren Excavation
A
HW7
UC
IAM
S 11801
6 Pond C
20
770 15
720 676
51.66412
-128.1
26
Tsuga heterophylla
needles
Pond core sedim
ents - brackish-
marine diatom
s
0.5 1
McLaren
Pond core B
-B
HE1
UC
IAM
S 10275
4 ElSx4 C
1425
15 722
566 51.93216
-127.8923
Clam
shell fragm
ents
Archaeological
deposit - basal shell m
idden 11.9
2 M
cLaren ESP
A
HW5
Beta
105289
ElTa3 770
50 729
673 51.84034
-128.1027
Charcoal
Archaeological
deposit - base of organic soil
0.1 2
Cannon 2000
ESP A
HE5
UC
IAM
S 10274
7 EkSx11
D2
1530 20
824 663
51.7063
-127.8729
Balanus sp. shell
Archaeological
deposit intertidal shell
midden
-3.1 2
McLaren
ESP A
HW4
UC
IAM
S 10274
9 ElTb34
E2 1540
15 832
670 51.83699
-128.2
45
Clam
shell fragm
ents
Archaeological
deposit - basal shell m
idden 6.6
1 M
cLaren ESP
A
HE3
UC
IAM
S 10269
1 ElSx11 B
1715
15 1032
841 51.86005
-127.8495
Mytilus sp. shell
and fish bone fragm
ents
Archaeological
deposit - basal shell m
idden 9.4
1 M
cLaren ESP
A
HW7
UC
IAM
S 12826
0 EjTa15A
1225
20 1226
1088 51.66039
-128.1191
Wood
Top of peat deposit
1 0.5
McLaren
Excavation A
31
Map ID
Lab
Lab #
Site and Test
14C age BP
±
Calendar range (older)
Calendar range
(recent)
Lat
Long
Material for Dating
(submitted)
Proxy indicator
Elevation - m ahht
±
Source/Lab
Method
Sea Level Position
HE3
Beta
105288
ElSx16 1240
50 1261
1090 51.89843
-127.8386
Charcoal
Archaeological
deposit - base of organic soil
0.4 1
Cannon 2000
ESP A
HE3
UC
IAM
S 10275
3 ElSx11 B
1990
15 1292
1131 51.86005
-127.8495
Mytilus sp. and
Balanus sp. shell fragm
ents
Archaeological
deposit - basal organic soil
9.3 1
McLaren
ESP A
HE5
UC
IAM
S 10274
6 EkSx11
C
2050 15
1345 1183
51.70631
-127.8729
Mytilus sp. shell fragm
ents B
asal shell m
idden 2.9
1 M
cLaren ESP
A
HE1
UC
IAM
S 12827
8 ElSx4A
1475
25 1386
1336 51.93216
-127.8921
Sclerotia (C
enococcum
sp.)
From peat-like layer
-0.5 2
McLaren
Excavation A
HW4
UC
IAM
S 10274
8 ElTb34
E2 1595
15 1526
1418 51.83699
-128.2
45
Disperse
charcoal B
ase of organic soil
8.5 2
McLaren
ESP A
HE4
DIC
329
Koeye
1570 65
1528 1396
51.7705
-127.8771
Basal peat
Basal peat
-2.7 1
Andrew
s and
Retherford 1978
Exposure A
HW9
UC
IAM
S 12833
3 C
IRC
9 1725
30 1694
1571 51.48
6
-128.0
8 C
harcoal From
base of paleosol
16.25 1
Walker
Exposure A
HW1
Beta
109627
ElTa21 1730
50 1701
1569 51.95818
-128.1055
Charcoal
Archaeological
deposit - base of organic soil
0.7 1
Cannon 2000
ESP A
HE1
UC
IAM
S 12827
7 ElSx4A
1770
15 1713
1630 51.93216
-127.8921
Charcoal
From peat
layer 11.5
2 M
cLaren Excavation
A
HW6
UC
IAM
S 11576
4 C
IRC
-5 2410
15 1752
1548 51.66
4
-128.1
35 Shell
Archaeological
deposit - base of shell m
idden in exposure
3.4 1
Walker
Exposure A
HW7
UC
IAM
S 12826
1 EjTa15A
1820
20 1811
1717 51.66039
-128.1191
Conifer charcoal
Bottom
of peat 1
1 0.5
McLaren
Excavation A
32
Map ID
Lab
Lab #
Site and Test
14C age BP
±
Calendar range (older)
Calendar range
(recent)
Lat
Long
Material for Dating
(submitted)
Proxy indicator
Elevation - m ahht
±
Source/Lab
Method
Sea Level Position
HE3
Beta
105286
ElSx8 2480
55 1853
1617 51.89811
-127.8673
Clam
Shell A
rchaeological deposit - basal
midden
1.2 1
Cannon 2000
ESP A
HW4
Beta
109629
ElTb2 1880
50 1878
1739 51.87215
-128.2135
Charcoal
Archaeological
deposit - base of organic soil
0.2 1
Cannon 2000
ESP A
HE5
UC
IAM
S 10274
5 EkSx11
C
2005 20
1988 1932
51.70631
-127.8729
Disperse
charcoal
Archaeological
deposit - black organic silt
2.7 2
McLaren
ESP A
HW3
UC
IAM
S 10276
2 ElTa18 C
2260
15 2337
2208 51.89267
-128.1 D
isperse charcoal
Archaeological
deposit - basal organic soil
5.1 1
McLaren
ESP A
HW6
UC
IAM
S 11801
3
EjTa5 60-55 abd
2370 15
2362 2346
51.66418
-128.1342
Charcoal
Archaeological
deposit – shell m
idden 1.6
0.5 M
cLaren Exposure
A
HW6
UC
IAM
S 11801
2
EjTa5 35-30 abd
2475 15
2700 2488
51.66418
-128.1342
Charcoal
Archaeological
deposit – shell m
idden 1.3
0.5 M
cLaren Exposure
A
HW4
Beta
109628
ElTb1 2540
50 2744
2503 51.83807
-128.1
97 C
harcoal A
rchaeological deposit - base of organic soil
-0.7 1
Cannon 2000
ESP A
HW3
UC
IAM
S 11799
8 ElTa18 137-142
2665 20
2775 2754
51.89286
-128.0993
Charcoal
Archaeological
deposit 5.5
1 M
cLaren Excavation
A
HW5
Gak
3716 EkTa19
3230 90
2781 2474
51.75398
-128.0
85 Shell
Archaeological
deposit - basal shell m
idden -1.2
1
Andrew
s and
Retherford 1978
Exposure A
HE1
Beta
109623
ElSx4 2620
50 2785
2716 51.93239
-127.8925
Charcoal
Archaeological
deposit - base of organic soil
0.4 2
Cannon 2000
ESP A
HW3
UC
IAM
S 12826
9 ElTa18C
2745
20 2858
2793 51.89391
-128.0976
Conifer charcoal
Archaeological
feature – hearth 1.5
1 M
cLaren A
uger Test A
HW6
GSC
1828
EjTa5 3290
210 2988
2413 51.66376
-128.1346
Shell A
rchaeological deposit - basal shell m
idden 0.2
0.5
Andrew
s and
Retherford 1978
Exposure A
33
Map ID
Lab
Lab #
Site and Test
14C age BP
±
Calendar range (older)
Calendar range
(recent)
Lat
Long
Material for Dating
(submitted)
Proxy indicator
Elevation - m ahht
±
Source/Lab
Method
Sea Level Position
HW6
UC
IAM
S 11801
1
EjTa5 35-40 dbd
3020 15
3316 3172
51.66418
-128.1342
Charcoal
Archaeological
deposit – shell m
idden 0.7
0.5 M
cLaren Exposure
A
HW7
UC
IAM
S 11800
8 EjTa15-
T2 C
3080 20
3354 3265
51.66039
-128.1191
Charcoal
Archaeological
deposit 0.4
0.5 M
cLaren Excavation
A
HW3
UC
IAM
S 11226
1 ElTa18 190-195
3155 15
3389 3364
51.89286
-128.0993
Charcoal
Archaeological
deposit 5
1 M
cLaren Excavation
A
HW6
UC
IAM
S 11801
0
EjTa5 80-85 dbd
3260 20
3553 3447
51.66418
-128.1342
Charcoal
Archaeological
deposit – shell m
idden 0.2
1 M
cLaren Exposure
A
HW7
UC
IAM
S 11800
9 EjTa15-
T2 D
3310 15
3564 3484
51.66039
-128.1191
Charcoal
Archaeological
deposit 0.3
0.5 M
cLaren Excavation
A
HE3
Beta
109625
ElSx18 3900
55 3576
3351 51.90593
-127.8442
Clam
Shell A
rchaeological deposit - basal shell m
idden 0.7
1 C
annon 2000
ESP A
HE1
UC
IAM
S 10275
7 ElSx4 E
3350 20
3630 3568
51.93209
-127.8921
Disperse
charcoal
Archaeological
deposit - base of organic soil
9.6 2
McLaren
ESP A
HW7
UC
IAM
S 10274
0 EjTa13
C2
3970 15
3639 3436
51.66487
-128.0773
Clam
and M
ytilus sp. shell fragm
ents
Archaeological
deposit - basal shell m
idden 7.5
1 M
cLaren ESP
A
HW7
UC
IAM
S 10273
9 EjTa13
C1
4025 20
3709 3486
51.66487
-128.0773
Mytilus sp. shell fragm
ents
In discrete archaeological
deposit 8.5
1 M
cLaren ESP
A
HW7
UC
IAM
S 10274
1 EjTa13
C2
3480 15
3823 3703
51.66487
-128.0773
Disperse
charcoal
Archaeological
deposit - basal organic soil in dark grey sand
7 1
McLaren
ESP A
HW3
UC
IAM
S 12827
0 ElTa18C
3420
150 3844
3479 51.89391
-128.0976
Conifer charcoal
Archaeological
deposit 1
1 M
cLaren Excavation
A
HE1
UC
IAM
S 12827
5 ElSx4A
3750
20 4148
4087 51.93216
-127.8921
Charcoal
Archaeological
deposit - from
sediment under
lithic
11.5 2
McLaren
Excavation A

34
Map ID
Lab
Lab #
Site and Test
14C age BP
±
Calendar range (older)
Calendar range
(recent)
Lat
Long
Material for Dating
(submitted)
Proxy indicator
Elevation - m ahht
±
Source/Lab
Method
Sea Level Position
HW2
Beta
101924
ElTa25 4510
65 4404
4122 51.89908
-128.0219
Clam
Shell A
rchaeological deposit - basal shell m
idden 2.2
1 C
annon 2000
ESP A
HW4
UC
IAM
S 10275
1 EkTb9
E2 4775
20 4770
4515 51.80693
-128.2367
Clam
shell fragm
ents
Archaeological
deposit - basal shell m
idden 0.8
1 M
cLaren ESP
A
HW6
Gak
3717 Surf C
ove D
une 4020
100 4804
4317 51.66
08
-128.1
46 H
umic sedim
ent B
uried Hum
ic Layer in D
une 9
1
Andrew
s and
Retherford 1978
Exposure A
HW7
UC
IAM
S 11804
8 Pond C
4780
35 5230
4959 51.66412
-128.1
26
Charcoal,
Foraminifera,
micro-crustacean
claw
Pond core sedim
ents - foram
inifera and brackish-
marine diatom
s
0.4 1
McLaren
Pond core B
-B
HW7
UC
IAM
S 11801
7 Pond C
36
4520 15
5295 5071
51.66412
-128.1
26 D
eciduous leaf
Pond core sedim
ents - brackish-
marine diatom
s
0.4 1
McLaren
Pond core B
-B
HW6
UC
IAM
S 12833
1 C
IRC
6 4680
20 5464
5325 51.65
8
-128.1
49 W
ood
Top of peat layer from
w
hich CIR
C1
was collected
0.7 1
Walker
Exposure A
HW4
UC
IAM
S 11799
9 EkTb9
120-125 4930
20 5658
5610 51.80702
-128.2373
Charcoal
Archaeological
deposit 2.8
1 M
cLaren Excavation
A
HW4
UC
IAM
S 11800
2 EkTb9
140-145 4965
15 5712
5657 51.80702
-128.2373
Sambucus
racemosa seed
Archaeological
deposit 0.6
1 M
cLaren Excavation
A
HW7
UC
IAM
S 11804
9 Pond C
5035
25 5885
5733 51.66412
-128.1
26
Charcoal,
sclerotia, unidentified seed, needle fragm
ents
Pond core sedim
ents - brackish-
marine diatom
s
0.4 1
McLaren
Pond core B
-B
HW6
UC
IAM
S 11581
6 C
IRC
-2 5045
20 5886
5744 51.66
4
-128.1
35 C
one From
base of peat
0.4 1
Walker
Terrestrial excavation
A
35
Map ID
Lab
Lab #
Site and Test
14C age BP
±
Calendar range (older)
Calendar range
(recent)
Lat
Long
Material for Dating
(submitted)
Proxy indicator
Elevation - m ahht
±
Source/Lab
Method
Sea Level Position
HW7
UC
IAM
S 10274
2 EjTa4 A
2 5800
20 5925
5735 51.66443
-128.0987
Clam
shell fragm
ent
Archaeological
deposit - shell m
idden 1
2 M
cLaren ESP
A
HW4
UC
IAM
S 10275
0 EkTb9
E2 5865
20 6026
5794 51.80693
-128.2367
Mytilus shell
fragments
Archaeological
deposit - basal sedim
ents shell in grey sand
-0.5 1
McLaren
ESP A
HE3
Beta
105480
ElSx10 5270
60 6177
5944 51.89966
-127.8527
Charcoal
Archaeological
deposit - basal organic
3.4 1
Cannon 2000
ESP A
HW3
UC
IAM
S 10275
9 ElTa18 B
5350
25 6207
6023 51.89269
-128.1 D
isperse charcoal
Archaeological
deposit - basal organic
5 1
McLaren
ESP A
HW4
UC
IAM
S 10275
2 EkTb9
F1 6155
20 6338
6161 51.80669
-128.2
37
Clam
, Mytilus
sp. and Balanus sp. shell
fragments
Archaeological
deposit - basal shell m
idden 0.3
1 M
cLaren ESP
A
HW6
UC
IAM
S 11805
2 LL 138
5730 25
6560 6478
51.6475
-128.1427
Moss
(Pleurozium
schreberi) Peat
51.4 2
McLaren
Pond core A
HW6
UC
IAM
S 11581
5 C
IRC
-1 5790
20 6638
6564 51.65
8
-128.1
49 B
ranch Peat
0.3 1
Walker
Exposure A
HW6
UC
IAM
S 12833
2 C
IRC
8 5870
20 6720
6700 51.66
3
-128.1
36 W
ood W
oody peat -0.3
1 W
alker Exposure
A
HW4
UC
IAM
S 11800
3 EkTb9
175-180 5885
20 6726
6674 51.80702
-128.2373
Tsuga heterophylla
needle
Archaeological
deposit 2.25
1 M
cLaren Excavation
A
HE1
Beta
109624
ElSx5 6560
55 6791
6549 51.93263
-127.8958
Mytilus sp. shell
Archaeological
deposit - basal shell m
idden 2.1
1 C
annon 2000
ESP A
HW4
UC
IAM
S 11800
0
EkTb9 M
at N
eedle 196
6300 20
7261 7177
51.80702
-128.2373
Taxus brevifolia w
ood A
rchaeological deposit
2 1
McLaren
Excavation A
36
Map ID
Lab
Lab #
Site and Test
14C age BP
±
Calendar range (older)
Calendar range
(recent)
Lat
Long
Material for Dating
(submitted)
Proxy indicator
Elevation - m ahht
±
Source/Lab
Method
Sea Level Position
HW7
Gak
3719
Calvert
Island B
C Tel
Peat
6500 100
7497 7314
51.64473
-128.0916
Peat B
asal peat 6
1
Andrew
s and
Retherford 1978
Exposure A
HW3
UC
IAM
S 10276
0 ElTa18 B
6740
20 7610
7580 51.89269
-128.1 D
isperse charcoal
Archaeological
deposit - base of organic soil
5.1 1
McLaren
ESP A
HW4
UC
IAM
S 11800
4 EkTb9
222-225 6840
20 7689
7630 51.80702
-128.2373
Sambucus
racemosa seeds
Archaeological
deposit 1.8
1 M
cLaren Excavation
A
HW7
UC
IAM
S 12828
9 EjTa15D
7190
20 8010
7976 51.66039
-128.1191
Disperse
charcoal A
rchaeological deposit
0 0.5
McLaren
Excavation A
HE1
UC
IAM
S 10275
5 ElSx4 C
7345
25 8190
8055 51.93216
-127.8923
Disperse
charcoal
Archaeological
deposit - basal organic soil
11.7 2
McLaren
ESP A
HE1
UC
IAM
S 10275
6 ElSx4 C
7370
25 8285
8165 51.93216
-127.8923
Disperse
charcoal
Archaeological
deposit - base of organic soil
11.7 2
McLaren
ESP A
HW7
UC
IAM
S 12826
2 EjTa15A
7870
20 8683
8599 51.66039
-128.1191
Disperse
charcoal Top of peat 2
0.5 0.5
McLaren
Excavation A
HW7
UC
IAM
S 12826
6 EjTa15B
8095
20 9025
9005 51.66039
-128.1191
Disperse
charcoal
Archaeological
deposit – associated w
ith lithics
0 0.5
McLaren
Excavation A
HW7
UC
IAM
S 12826
4 EjTa15C
8455
20 9515
9467 51.66039
-128.1191
Disperse
charcoal
Archaeological
deposit – associated w
ith lithics
0 0.5
McLaren
Excavation A
HW3
UC
IAM
S 12827
1 ElTa18C
8670
70 9697
9543 51.89391
-128.0976
Sclerotia (C
enococcum
sp.)
Archaeological
deposit - base of organic soil
0 1
McLaren
Excavation A
HW3
UC
IAM
S 12827
2 ElTa18C
8785
25 9888
9709 51.89391
-128.0976
Disperse
charcoal
Archaeological
deposit - base of organic soil
0 1
McLaren
Excavation A
HW6
UC
IAM
S 12827
9 SB
DL
Pond 8800
25 9898
9766 51.64
55
-128.1
35 W
ood Pond core sedim
ents, gyttja
10 1
McLaren
Pond core A

37
Map ID
Lab
Lab #
Site and Test
14C age BP
±
Calendar range (older)
Calendar range
(recent)
Lat
Long
Material for Dating
(submitted)
Proxy indicator
Elevation - m ahht
±
Source/Lab
Method
Sea Level Position
HW7
UC
IAM
S 11226
2
EjTa15-T2; 140-
150 8835
20 10116
9787 51.80702
-128.2373
Charcoal
Archaeological
deposit 0.1
0.5 M
cLaren Excavation
A
HW7
UC
IAM
S 12826
5 EjTa15C
8885
20 10151
9924 51.66039
-128.1191
Conifer tw
ig charcoal
Archaeological
deposit - from
hearth feature 0
0.5 M
cLaren Excavation
A
HW7
UC
IAM
S 12826
3 EjTa15A
8905
20 10160
9940 51.66039
-128.1191
Conifer charcoal
Bottom
of peat 2
0 0.5
McLaren
Excavation A
HW4
UC
IAM
S 11226
3 EkTb9; 220-225
9140 25
10288 10238
51.80702
-128.2373
Charcoal
Archaeological
deposit 1.8
1 M
cLaren Excavation
A
HW8
UC
IAM
S 12829
6
Kw
ak-Fitz
Lagoon 126
9280 20
10515 10426
51.641
-127.9543
Conifer needles,
seed, deciduous tw
ig
Lagoon core sedim
ents - brackish-freshw
ater diatom
s
-1.75 1
McLaren
Lagoon core
B-A
HW4
UC
IAM
S 10276
4 W
TB
9310 25
10566 10499
51.80451
-128.2516
Sclerotia (C
enococcum
sp.)
Terrestrial organic layer
below
intertidal deposits
-2.2 0.5
McLaren
ESP A
HW3
UC
IAM
S 13485
7
ElTa18 2013 D
30-40
9355 25
10645 10519
51.89286
-128.0993
Wood
Archaeological
deposit - above w
ood chip -0.5
1 M
cLaren Excavation
A
HW7
UC
IAM
S 12829
0 EjTa15D
9370
25 10653
10562 51.66039
-128.1191
Disperse
charcoal
Betw
een two
discrete archaeological
deposits
0 0.5
McLaren
Excavation A
HW4
UC
IAM
S 10276
3 W
TB
9400 30
10666 10583
51.80451
-128.2516
Seeds
Terrestrial organic layer
below
intertidal deposits
-2.2 0.5
McLaren
ESP A
HW8
UC
IAM
S 12829
5
Kw
ak-Fitz
Lagoon 81
9420 25
10693 10591
51.641
-127.9543
Conifer needles
and cone bract
Pond core sedim
ents - brackish diatom
s
-1.75 0.5
McLaren
Lagoon core
B

38
Map ID
Lab
Lab #
Site and Test
14C age BP
±
Calendar range (older)
Calendar range
(recent)
Lat
Long
Material for Dating
(submitted)
Proxy indicator
Elevation - m ahht
±
Source/Lab
Method
Sea Level Position
HW6
UC
IAM
S 12833
5 C
IRC
12 9465
20 10737
10681 51.64
2
-128.1
52 W
ood W
oody peat -1.75
1 W
alker Exposure
A
HW3
UC
IAM
S 11799
5 ElTa18 262-267
9475 20
10745 10692
51.89286
-128.0993
Charcoal
Archaeological
deposit 4.3
1 M
cLaren Excavation
A
HW3
UC
IAM
S 11799
7
ElTa18 217-222
A
9490 20
10757 10701
51.89286
-128.0993
Charcoal
Archaeological
deposit 4.7
1 M
cLaren Excavation
A
HW9
UC
IAM
S 12833
7 C
IRC
11 9600
25 11092
10795 51.48
6
-128.0
8 Leaf
From top of
organic soil 16.2
1 W
alker Exposure
A
HW1
UC
IAM
S 12829
3
Kildidt
Lagoonlet 121
9620 20
11124 10868
51.94593
-128.1284
Sphagnum stem
Lagoon core sedim
ents - freshw
ater diatom
s
-1.5 0.5
McLaren
Lagoon core
A
HW6
UC
IAM
S 12828
0 SB
DL
Pond 9705
25 11196
11146 51.64
55
-128.1
35
Tsuga heterophylla and Picea sitchensis
needles
Pond core sedim
ents –gyttja
10 1
McLaren
Pond core A
HE3
WA
T 452
ElSx1 9720
140 11252
10789 51.85883
-127.8649
Charcoal
Base of
archaeological deposits
6.4 1
Cannon 2000
Excavation A
HW4
UC
IAM
S 11800
1 EkTb9
230-235 9960
25 11396
11285 51.80702
-128.2373
Charcoal
Archaeological
deposit 1.7
1 M
cLaren Excavation
A
HW3
Beta
109626
ElTa18 9940
50 11591
11247 51.89883
-128.0938
Charcoal
Archaeological
deposit - base of organic soil
3.6 1
Cannon 2000
ESP A
OS2
RID
DL
979 C
ook B
ank 9940
75 11600
11243 50.99
-128.5 Plant m
atter O
cean core sedim
ents - m
arine sand -97.7
2 Luternauer et al. 1989
Marine
core B
HW5
UC
IAM
S 12830
0
Stirling Lagoon
182 10030
30 11610
11403 51.77
92
-128.0845
Deciduous tw
ig
Lagoon core sedim
ents -freshw
ater diatom
s
-1.75 0.5
McLaren
Lagoon core
A

39
Map ID
Lab
Lab #
Site and Test
14C age BP
±
Calendar range (older)
Calendar range
(recent)
Lat
Long
Material for Dating
(submitted)
Proxy indicator
Elevation - m ahht
±
Source/Lab
Method
Sea Level Position
HE2
Gak
3715 H
vidsten Point
10200 150
12364 11412
51.9468
-127.7397
Wood
Sediments in
exposure – freshw
ater diatom
s
6 0.5
Andrew
s and
Retherford 1978
Exposure A
OS2
RID
DL
983 C
ook B
ank 10290
80 12376
11836 50.99
-128.5 W
ood O
cean core sedim
ents - m
arine sand -98
1 Luternauer et al. 1989
Marine
core B
OS1
TO
1342 G
oose B
ank 11030
70 12320
11901 51.85
-129.2
5 Zirfaea pilsbryi
Ocean core
sediments -
intertidal shell -125
2 B
arrie and C
onway
2002a
Marine
core B
-B
OS2
RID
DL
985 C
ook B
ank 10470
75 12554
12220 50.99
-128.5 R
oot O
cean core sedim
ents - organic soil
-98.4 1
Luternauer et al. 1989
Marine
core A
OS2
RID
DL
981 C
ook B
ank 10485
70 12562
12222 50.99
-128.5 W
ood O
cean core sedim
ents - m
arine sand -97.9
1 Luternauer et al. 1989
Marine
core B
HE2
UC
IAM
S 13138
6 H
vidsten Point
10660 30
12628 12569
51.9468
-127.7397
Charcoal
Sediments in
exposure - freshw
ater diatom
s
6 0.5
McLaren
Exposure A
OS1
TO
1254 G
oose B
ank 11440
70 12718
12412 51.94
-129.0
8
Macom
a incongura
Ocean core
sediments -
intertidal shell -135.5
2 B
arrie and C
onway
2002a
Marine
core B
-B
OS1
TO
1256 G
oose B
ank 11450
80 12735
12412 51.87
-129.1
9 Spisula falcata
Ocean core
sediments -
intertidal shell to -50m
-123.5 2
Barrie and C
onway
2002a
Marine
core B
-B
OS1
TO
1257 G
oose B
ank 11460
80 12746
12418 51.87
-129.1
9
Saxidomus
giganteus
Ocean core –
intertidal to subtidal shell
-122.5 2
Hetherington et al. 2003
Marine
core B
-B
HW7
UC
IAM
S 13485
8
Big
Spring Lake 282
10855 35
12779 12638
51.6479
-128.0
7
Pinus contorta needle
Pond core sedim
ents - freshw
ater diatom
s
6 1
McLaren
Pond core A
HW3
UC
IAM
S 11799
6
ElTa18 267-272
A
10920 25
12858 12701
51.89286
-128.0993
Charcoal
Pond core sedim
ents - basal organic
soil
4.2 1
McLaren
Excavation A

40
Map ID
Lab
Lab #
Site and Test
14C age BP
±
Calendar range (older)
Calendar range
(recent)
Lat
Long
Material for Dating
(submitted)
Proxy indicator
Elevation - m ahht
±
Source/Lab
Method
Sea Level Position
HW5
UC
IAM
S 12830
1
Stirling Lagoon
206 10990
25 12926
12753 51.77
92
-128.0845
Deciduous tw
ig
Pond core sedim
ents - fresh w
ater diatom
s
-1.75 0.5
McLaren
Lagoon core
A
OS2
RID
DL
984 C
ook B
ank 10650
350 12931
11999 50.99
-128.5 W
ood O
cean core sedim
ents -organic soil
-98.3 1
Luternauer et al. 1989
Marine
core A
HW7
UC
IAM
S 12829
2
Big
Spring Lake 262
11020 30
13048 12768
51.6479
-128.0
7
Picea sitchensis needle
Pond core sedim
ents - freshw
ater diatom
s
6 1
McLaren
Pond core A
HW6
UC
IAM
S 11801
9 SB
DL
182-183 11565
25 13443
13341 51.64582
-128.1354
Pinus contorta seed, Picea seed
and needle fragm
ents
Pond core sedim
ents - freshw
ater diatom
s
9.4 1
McLaren
Pond core A
HW3
UC
IAM
S 11804
6
ElTa18 267-272
B
11720 80
13673 13454
51.89286
-128.0993
Sclerotia (C
enococcum
sp.)
Archaeological site - basal organic soil
4.2 1
McLaren
Excavation A
HE6
UC
IAM
S 13482
6 G
ildersleeve Pond
11770 30
13717 13511
51.60326
-127.7786
Wood
Pond core sedim
ents - freshw
ater diatom
s
13 1
McLaren
Pond core A
SW
GSC
1351
Shearwat
er 12210
330 13735
12978 52.14
73
-128.0903
Shell
Sediments in
exposure - glaciom
arine clay
12 2
Andrew
s and
Retherford 1978
Exposure B
HW8
UC
IAM
S 12829
7
Kw
ak-Fitz
Lagoon 310
12040 30
13945 13822
51.641
-127.9543
Pinus contorta needles
Lagoon core sedim
ents - brackish diatom
s
-1.75 0.5
McLaren
Lagoon core
B
HW1
UC
IAM
S 12829
4
Kildidt
Lagoonlet 229
12075 30
13981 13851
51.94593
-128.1284
Picea sitchensis needle
Lagoon core sedim
ents - freshw
ater diatom
s
-1.5 0.5
McLaren
Lagoon core
A

41
Map ID
Lab
Lab #
Site and Test
14C age BP
±
Calendar range (older)
Calendar range
(recent)
Lat
Long
Material for Dating
(submitted)
Proxy indicator
Elevation - m ahht
±
Source/Lab
Method
Sea Level Position
HW7
UC
IAM
S 11801
8 Pond D
321-322
12250 35
14178 14015
51.63655
-128.1064
Pinus contorta needle fragm
ents
Pond core sedim
ents - freshw
ater diatom
s
22.4 0.5
McLaren
Pond core A
HE5
UC
IAM
S 12833
0
Gildersle
eve Pond 538
13225 30
14345 14243
51.60326
-127.7786
Mussel shell
Pond core sedim
ents - m
arine and brackish diatom
s
13 0.5
McLaren
Pond core B
HW7
UC
IAM
S 13485
7
Big
Spring Lake 287-9
12275 50
14463 14001
51.6479
-128.0
7
Seed, needle fragm
ent, leaf fragm
ent
Pond core sedim
ents - fresh and
marine diatom
s
6 1
McLaren
Pond core A
and B
HW7
UC
IAM
S 11801
5 Pond B
139
12335 35
14511 14095
51.63482
-128.0
95
Deciduous leaf
fragments, Pinus
contorta needle base,
Cyperaceae seed
Pond core sedim
ents - freshw
ater diatom
s
94.4 1
McLaren
Pond core A
HE5
UC
IAM
S 12829
1
Gildersle
eve Pond 545
12400 25
14577 14181
51.60326
-127.7786
Seed
Pond core sedim
ents - m
arine and brackish diatom
s
13 1
McLaren
Pond core B
HW7
UC
IAM
S 11801
4 Pond B
136
12400 30
14582 14177
51.63482
-128.0
95
Pinus contorta needle
fragments,
Potamogeton
seed
Pond core sedim
ents - freshw
ater diatom
s
94.4 1
McLaren
Pond core A
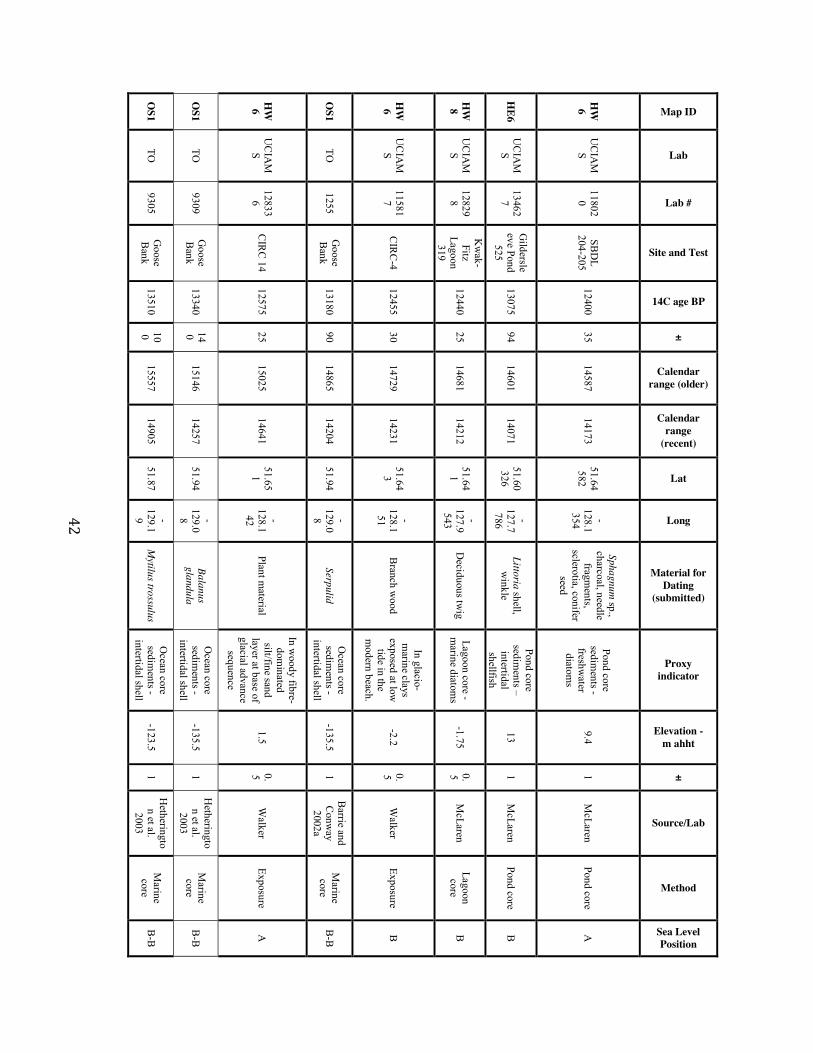
42
Map ID
Lab
Lab #
Site and Test
14C age BP
±
Calendar range (older)
Calendar range
(recent)
Lat
Long
Material for Dating
(submitted)
Proxy indicator
Elevation - m ahht
±
Source/Lab
Method
Sea Level Position
HW6
UC
IAM
S 11802
0 SB
DL
204-205 12400
35 14587
14173 51.64582
-128.1354
Sphagnum sp.,
charcoal, needle fragm
ents, sclerotia, conifer
seed
Pond core sedim
ents - freshw
ater diatom
s
9.4 1
McLaren
Pond core A
HE6
UC
IAM
S 13462
7
Gildersle
eve Pond 525
13075 94
14601 14071
51.60326
-127.7786
Littoria shell, w
inkle
Pond core sedim
ents – intertidal shellfish
13 1
McLaren
Pond core B
HW8
UC
IAM
S 12829
8
Kw
ak-Fitz
Lagoon 319
12440 25
14681 14212
51.641
-127.9543
Deciduous tw
ig Lagoon core -
marine diatom
s -1.75
0.5 M
cLaren Lagoon
core B
HW6
UC
IAM
S 11581
7 C
IRC
-4 12455
30 14729
14231 51.64
3
-128.1
51 B
ranch wood
In glacio-m
arine clays exposed at low
tide in the
modern beach.
-2.2 0.5
Walker
Exposure B
OS1
TO
1255 G
oose B
ank 13180
90 14865
14204 51.94
-129.0
8 Serpulid
Ocean core
sediments -
intertidal shell -135.5
1 B
arrie and C
onway
2002a
Marine
core B
-B
HW6
UC
IAM
S 12833
6 C
IRC
14 12575
25 15025
14641 51.65
1
-128.1
42 Plant m
aterial
In woody fibre-
dominated
silt/fine sand layer at base of glacial advance
sequence
1.5 0.5
Walker
Exposure A
OS1
TO
9309 G
oose B
ank 13340
140 15146
14257 51.94
-129.0
8
Balanus glandula
Ocean core
sediments -
intertidal shell -135.5
1 H
etherington et al. 2003
Marine
core B
-B
OS1
TO
9305 G
oose B
ank 13510
100 15557
14905 51.87
-129.1
9 M
ytilus trossulus O
cean core sedim
ents - intertidal shell
-123.5 1
Hetherington et al. 2003
Marine
core B
-B
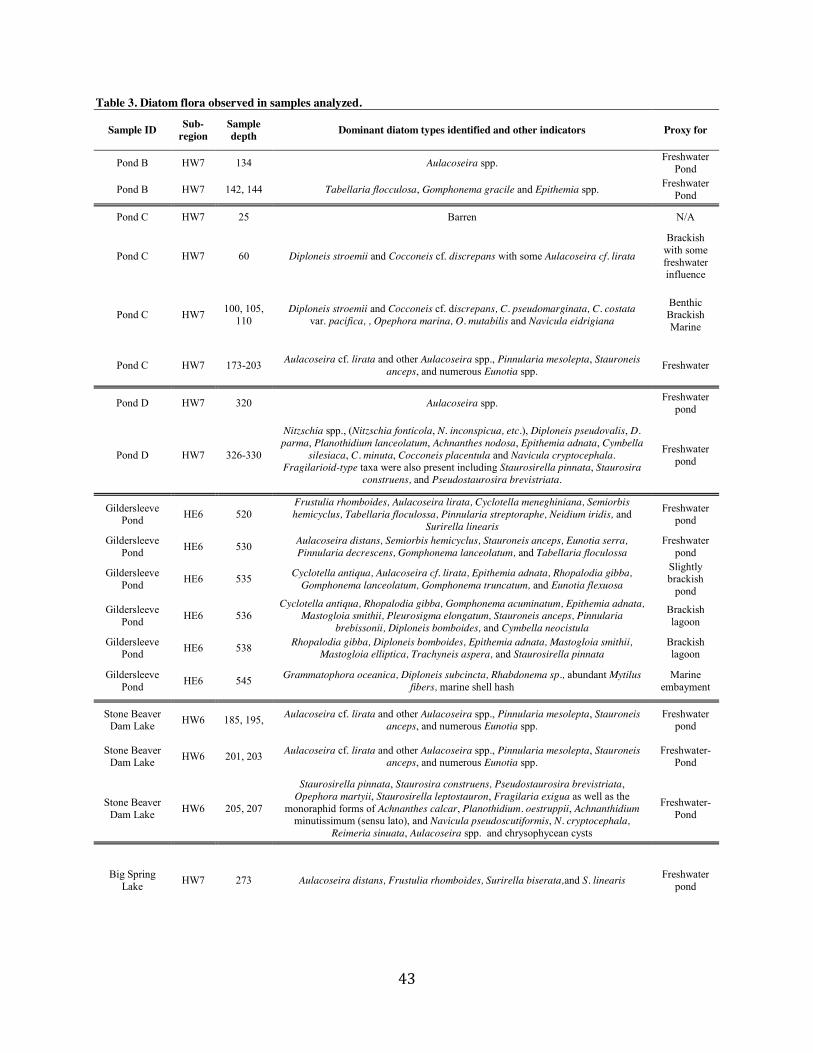
43
Table 3. Diatom flora observed in samples analyzed.
Sample ID Sub-region
Sample depth Dominant diatom types identified and other indicators Proxy for
Pond B HW7 134 Aulacoseira spp. Freshwater Pond
Pond B HW7 142, 144 Tabellaria flocculosa, Gomphonema gracile and Epithemia spp. Freshwater Pond
Pond C HW7 25 Barren N/A
Pond C HW7 60 Diploneis stroemii and Cocconeis cf. discrepans with some Aulacoseira cf. lirata
Brackish with some freshwater influence
Pond C HW7 100, 105, 110
Diploneis stroemii and Cocconeis cf. discrepans, C. pseudomarginata, C. costata var. pacifica, , Opephora marina, O. mutabilis and Navicula eidrigiana
Benthic Brackish Marine
Pond C HW7 173-203 Aulacoseira cf. lirata and other Aulacoseira spp., Pinnularia mesolepta, Stauroneis anceps, and numerous Eunotia spp. Freshwater
Pond D HW7 320 Aulacoseira spp. Freshwater pond
Pond D HW7 326-330
Nitzschia spp., (Nitzschia fonticola, N. inconspicua, etc.), Diploneis pseudovalis, D. parma, Planothidium lanceolatum, Achnanthes nodosa, Epithemia adnata, Cymbella
silesiaca, C. minuta, Cocconeis placentula and Navicula cryptocephala. Fragilarioid-type taxa were also present including Staurosirella pinnata, Staurosira
construens, and Pseudostaurosira brevistriata.
Freshwater pond
Gildersleeve Pond HE6 520
Frustulia rhomboides, Aulacoseira lirata, Cyclotella meneghiniana, Semiorbis hemicyclus, Tabellaria floculossa, Pinnularia streptoraphe, Neidium iridis, and
Surirella linearis
Freshwater pond
Gildersleeve Pond HE6 530 Aulacoseira distans, Semiorbis hemicyclus, Stauroneis anceps, Eunotia serra,
Pinnularia decrescens, Gomphonema lanceolatum, and Tabellaria floculossa Freshwater
pond
Gildersleeve Pond HE6 535 Cyclotella antiqua, Aulacoseira cf. lirata, Epithemia adnata, Rhopalodia gibba,
Gomphonema lanceolatum, Gomphonema truncatum, and Eunotia flexuosa
Slightly brackish
pond
Gildersleeve Pond HE6 536
Cyclotella antiqua, Rhopalodia gibba, Gomphonema acuminatum, Epithemia adnata, Mastogloia smithii, Pleurosigma elongatum, Stauroneis anceps, Pinnularia
brebissonii, Diploneis bomboides, and Cymbella neocistula
Brackish lagoon
Gildersleeve Pond HE6 538 Rhopalodia gibba, Diploneis bomboides, Epithemia adnata, Mastogloia smithii,
Mastogloia elliptica, Trachyneis aspera, and Staurosirella pinnata Brackish lagoon
Gildersleeve Pond HE6 545 Grammatophora oceanica, Diploneis subcincta, Rhabdonema sp., abundant Mytilus
fibers, marine shell hash Marine
embayment
Stone Beaver Dam Lake HW6 185, 195, Aulacoseira cf. lirata and other Aulacoseira spp., Pinnularia mesolepta, Stauroneis
anceps, and numerous Eunotia spp. Freshwater
pond
Stone Beaver Dam Lake HW6 201, 203 Aulacoseira cf. lirata and other Aulacoseira spp., Pinnularia mesolepta, Stauroneis
anceps, and numerous Eunotia spp. Freshwater-
Pond
Stone Beaver Dam Lake HW6 205, 207
Staurosirella pinnata, Staurosira construens, Pseudostaurosira brevistriata, Opephora martyii, Staurosirella leptostauron, Fragilaria exigua as well as the
monoraphid forms of Achnanthes calcar, Planothidium. oestruppii, Achnanthidium minutissimum (sensu lato), and Navicula pseudoscutiformis, N. cryptocephala,
Reimeria sinuata, Aulacoseira spp. and chrysophycean cysts
Freshwater-Pond
Big Spring Lake HW7 273 Aulacoseira distans, Frustulia rhomboides, Surirella biserata,and S. linearis Freshwater
pond

44
Sample ID Sub-region
Sample depth Dominant diatom types identified and other indicators Proxy for
Big Spring Lake HW7 278 Aulacoseira distans, Frustulia rhomboides, Staurosirella pinnata, Navicula
leptostrata, and Nitzchia cf. fonticola Freshwater
pond
Big Spring Lake HW7 288
Aulacoseira distans, Frustulia rhomboides, Cyclotella triparta, Gyrosigma balticum, Coscinodiscus radiatus, C. apiculatus, Bacillaria socialis, Cocconeis scutellum, and
C. costata
Freshwater pond with
some marine washes
Big Spring Lake HW7 294 Frustulia rhomboides, Eunotia incisa, Gyrosigma arcticum, Cocconeis costata, C.
scutellum, C. cf. kamtchatkensis, Cosconodiscus apiculatus, and Raphoneis sp.
Brackish-marine
embayment with minor freshwater
input
Stirling Lagoon HW5 179 Shell (biogenic sand) Intertidal
Stirling Lagoon HW5 183, 193 Aulacoseira distans, Aulacoseira lirata, Cocconeis placentula, Eunotia tibia, E. faba,
Pinnularia gibba, P. stomatophora, and Diploneis ovalis Freshwater
Stirling Lagoon HW5 208 Eunotia spp, and Pinnularia spp. Freshwater
Stirling Lagoon HW5 212 Stauroneis anceps, Pinnularia mesolepta, P. subgibba, P. brauniana, P.
microstauron, P. krasskei, Cymbella apera, and Rhopalodia gibba Freshwater
pond
Stirling Lagoon HW5 227 Grammataphora oceanica, Rhabdonema sp., Coscinodiscus apiculatus,
Thalassiosira eccentricus, Ctenophora pulchella, and Cocconeis costata
Marine to brackish
embayment
Stirling Lagoon HW5 244
Thalassiosira baltica, Thalassiosira pacifica, Tryblionella coarctica, Coscinodiscus apiculatus, Cocconeis costata, Paralia sulcata, Trachyneis aspera, and
Plagiogramma staurophorum
Marine to brackish
embayment
Stirling Lagoon HW5 263
Cosconidiscus apiculatus, Thalassiosira pacifica, Gyrosigma acuminatum, G. balticum, Grammataphora oceanica, Bacillara socialis, Cocconeis costata, C.
placentula, Ctenophora pulchella, Rhoicosphenia abbreviata, and Rhabdonema sp.
Marine to brackish
embayment
Kildidt Lagoonlet HW1 121 Cyclotella triparta, C. stelligera, Aulacoseira sp., and Staurosirella pinnata Freshwater
pond
Kildidt Lagoonlet HW1 147
Tabellaria floculossa, Aulacoseira distans, A. granulata, A. lirata, Frustulia rhomboides, Cyclotella sp., Gyrosigma balticum, Pinnularia subgibba, Staurosirella
pinnata, Diploneis cf. vacillans, Tryblionella coarctica, and Cocconeis costata
Freshwater pond
Kildidt Lagoonlet HW1 175 Aulacoseira distans, A. granulata, Frustulia rhomboides, Semiorbis hemiyclus,
Stauroneis anceps, Eunotia tibia, E. faba, E. serra, and Pinnularia subgibba Freshwater
pond
Kildidt Lagoonlet HW1 230 Aulacoseira distans, Stauroneis anceps, Eunotia flexuosa, Eunotia serra, Surirella
bifrons, Pinnularia stomatophora, Pinnularia brauniana, and Cymbella subcuspidata Freshwater
pond
Kildidt Lagoonlet HW1 235
Plagiogramma staurophorum, Grammataphora oceanica, Gyrosigma acuminatum, Surirella brightwellii, Paralia sulcata, Trachyneis aspera, Diploneis subcincta,
Diploneis bomboides, Rhabdonema sp., and Cocconeis pseudomarginata
Brackish lagoon
Kildidt Lagoonlet HW1 241 Cocconeis scutellum, Rhopalodia cf. pacifica, Grammatophora oceanica, and
Chaetoceros subsecundus Marine
embayment
Kwakfitz Lagoon HW8 61 Gyrosigma spp., Diploneis didyma, Coscinodiscus spp. Brackish/
Marine
Kwakfitz Lagoon HW8 82 Gyrosigma spp. very abundant Brackish,
lagoon

45
Sample ID Sub-region
Sample depth Dominant diatom types identified and other indicators Proxy for
Kwakfitz Lagoon HW8 106
Aulacoseira granulata, Gyrosigma balticum, Thalassiosira eccentrica, Tabellaria tabulata, Mastogloia exigua, Mastogloia exigua, Surirella brightwelli, Nitzschia
radicula, and Pinnularia problematica
Brackish, lagoon
Kwakfitz Lagoon HW8 126
Aulacoseira distans, Aulacoseira granulata, Frustulia rhomboides, Stauroneis anceps, Pinnularia stomatophora, Pinnularia problematica, Pinnularia cf.
brebissonii, Gyrosigma balticum, and Tabellaria floculossa
Freshwater pond
Kwakfitz Lagoon HW8 308 Aulacoseira spp., Tabellaria spp., Surirella spp., and Eunotia spp. Freshwater
Pond
Kwakfitz Lagoon HW8 311 Aulacoseira lirata, Aulacoseira distans, Stenopterobia curvula, Pinnularia gibba,
Pinnularia cf. brebisonii, Nitzschia radicula,amd and Surirella bifrons Freshwater
Pond
Kwakfitz Lagoon HW8 314 Caloneis spp. Gyrosigma spp., Diploneis bomboides, and Pinularia pluvianiformis Marine
embayment
Kwakfitz Lagoon HW8 319
Cocconeis costata, Cocconeis scutelum, Cocconeis placentula, Coscinodiscus apiculatus, Ctenophora pulchella, Rhabdonema sp., Rhopalodia musculus,
Rhopalodia gibba, Bacillaria socialis, and Grammataphora oceanica
Marine embayment
Hvidsten Point HE2 +197-199 Navicula cf. rhynchocephala, Pinnularia cf. intermedia, Eunotia sudetica, Freshwater
Hvidsten Point HE2 +162 Frustulia rhomboides, Aulacoseira perglabra, Aulacoseira distans, Cyclotella
stelligera Freshwater
46
References Ames, K., Maschner, H., 1999. Peoples of the Northwest Coast: their archaeology and prehistory. Thames and Hudson, London. Andrews, J.T., Retherford, R.M., 1978. A reconnaissance survey of late Quaternary sea levels, Bella Bella/Bella Coola region, central British Columbia coast. Canadian Journal of Earth Science. 15, 341-350. Barrie, J.V., Conway, K.W., 2002a. Rapid sea-level change and coastal evolution on the Pacific margin of Canada. Sedimentary Geology 150, 171-183. Barrie, J.V., Conway, K.W., 2002b. Contrasting glacial sedimentation processes and sea-level changes in two adjacent basins on the Pacific margin of Canada. In: Dowdesell, J.A. and O'Cafaigh, C. (Eds.), Glacier-Influenced Sedimentation on High-Latitude Continental Margins. Geological Society, Special Publications No. 203, London, pp. 181-194. Bartier, P.M., Sloan, N.A., 2007. Reconciling maps with charts towards harmonizing coastal zone base mapping: a case study from British Columbia. Journal of Coastal Research 23, 75-86. Campeau, S.,Pienitz, R., Héquette, A., 1998. Diatoms from the Beaufort Sea coast, southern Arctic Ocean (Canada): Modern analogues for reconstructing Late Quaternary environments and RSLs. Bibliotheca Diatomologica 43. Cramer, Stuttgart. Cannon, A., 2000. Settlement and sea-levels on the central coast of British Columbia: evidence from shell midden cores. American Antiquity 65, 67-77. Carlson, R.L., 1996. Early Namu. In: Carlson, R.L. and Dalla Bona, L. (Eds.), Early Human Occupation in British Columbia, UBC Press. Vancouver, pp. 83-102. Clague, J.J., 1981. Late Quaternary geology and geochronology of British Columbia Part 2: summary and discussion of radiocarbon-dated Quaternary history. Paper 80-35, Geological Survey of Canada, Ottawa. Clague, J.J., 1983. Glacio-isostatic effects of the Cordilleran Ice Sheet, British Columbia, Canada. In: Smith, D. Dawson, A. (Eds), Shorelines and Isostasy. Academic Press, London, pp. 321-343. Clague, J.J., 2000. Recognizing order in chaotic sequences of Quaternary sediments in the Canadian Cordillera. Quaternary International 68-71, 29-38. Clague, J.J., Harper, J.R., Hebda, R.J., Howes, D.E., 1982. Late Quaternary sea levels and crustal movements, coastal British Columbia. Canadian Journal of Earth Science. 19, 597-618. Clague, J.J., James, T.S., 2002. History and isostatic effects of the last ice sheet in southern British Columbia. Quaternary Science. Reviews. 21, 71-87.

47
Clague, J.J., Mathewes, R.W., Ager, T., 2004. Environments of Northwestern North America before the Last Glacial Maximum. In: Madsen, D.B. (Ed.), Entering America: Northeast Asia and Beringia Before the Last Glacial Maximum. University of Utah Press, Salt Lake City, pp. 63-94. Fairbanks, R.G., 1989. A 17,000-year glacio-eustatic sea level record: influence of glacial melting rates on the Younger Dryas event and deep-ocean circulation. Nature 342, 637–642. Fedje, D.W., and Christensen, T., 1999. Modeling paleoshorelines and locating early Holocene coastal sites in Haida Gwaii. American Antiquity 64, 635-652. Fedje, D.W., Josenhans, H., Clague, J.J., Barrie, J.V., Archer, D.W.G., Southon, J.R., 2005. Hecate Strait paleoshorelines. In: Fedje, D.W., Mathewes, R.W. (Eds.), Haida Gwaii: Human History and Environment from the Time of Loon to the Time of the Iron People. UBC Press, Vancouver, pp. 21–37. Fedje, D.W., Mackie, Q., Dixon E.J., Heaton, T., 2004. Late Wisconsin environments and archaeological visibility on the northern Northwest Coast. In: Madsen, D.B. (Ed.), Entering America: Northeast Asia and Beringia Before the Last Glacial Maximum. University of Utah Press, Salt Lake City, pp. 97-138. Fedje, D.W.; Sumpter, I.D., Southon, J.R., 2009. Sea-levels and archaeology in the Gulf Islands National Park Reserve. Canadian Journal of Archaeology 33, 234–253. Fladmark, K., 1979. Routes: Alternative migration corridors for early man in North America. American Antiquity 44, 55-69. Gilbert, T., Jenkins, D.L., Götherstrom, A., Naveran, N., Sanchez, J.J., Hofreiter, M., Thomsen, P.F., Binladen, J., Higham, T.F.G., Yohe, R.M. II, Parr, R., Cummings, L.S., Willerslev, E., 2008. DNA from pre-Clovis human coprolites in Oregon. North America Science 320,786–89. Gustafson, C. E., Gilbow, D., Daugherty, R.D., 1979. The Manis Mastodon site: Early man on the Olympic Peninsula. Canadian Journal of Archaeology 3, 57–65. Hall, D.R., 2003. Paleoenvironments, the Tsini'Tsini Site, and Nuxalk oral history. In: Carlson, R.L. (Ed.), Archaeology of Coastal British Columbia: Essays in Honour of Professor Philip Hobler. Archaeology Press, Simon Fraser University, Burnaby, pp. 13-28. Heaton, T.H. and Grady, F., 2003. The late Wisconsin vertebrate history of Prince of Wales Island, Southeast Alaska. In: Schubert, B.W., Mead, J.I., and Graham, R.W. (Eds.), Ice Age Cave Faunas of North America. Indiana University Press, Bloomington, pp. 17-53. Hetherington, R., Barrie, J.V., Reid, R.G.B., MacLeod, R., Smith, D.J., 2004. Paleogeography, glacially induced crustal displacement, and Late Quaternary coastlines on the continental shelf of British Columbia, Canada. Quaternary Science Reviews 23, 295-318.

48
Heusser, Calvin J., 1989. North Pacific Coastal Refugia. In: Scudder, Geoffrey G.E., and Nicholas Gessler (eds.) The Outer Shores. Queen Charlotte Islands Museum Press, Skidegate, pp. 91-106. James, T.S., Gowan, E.J., Hutchinson, I., Clague, J.J., Barrie, J.V., Conway, K.W., 2009. Sea-level change and paleogeographic reconstructions, southern Vancouver Island, British Columbia, Canada. Quaternary Science Reviews 28, 1200-1216. Jenkins, D.L., Davis, L.G, Stafford T.W. Jr., Campos, P.F., Hockett, B., Jones, G.T., Cummings, L.S., Yost, C., Connolly, T.J., Yohe, R.M. II, Gibbons, S.C., Raghavan, M., Rasmussen, M., Paijmans, J.L.A., Hofreiter, M., Kemp, B., Barta, J.L., Monroe, C., Gilbert, M., Willersev, E. 2012. Clovis age Western Stemmed projectile points and human coprolites at the Paisley Caves. Science, 337:223–28. Josenhans, H., Fedje, D., Pienitz, R., Southon, J., 1997. Early humans and rapidly changing Holocene sea levels in the Queen Charlotte Islands-Hecate Strait, British Columbia, Canada. Science 277, 71-74. Livingstone, D.A, 1955. A lightweight piston sampler for lake deposits. Ecology 36, 137-139. Luternauer, J. L., Murray, J. W., 1983. Late Quaternary morphologic development and sedimentation, central British Columbia continental shelf. Geological Survey of Canada, Paper 83-21, 38 pp. Luternauer, J.L., Clague, J.J., Conway, K.W., Barrie, J.V., Blaise, B., Mathewes, R.W., 1989. Late Pleistocene terrestrial deposits on the continental shelf of western Canada - evidence for rapid sea-level change at the end of the last glaciation. Geology 17, 357-360. Mackie, A. and Sumpter, I.D., 2005. Shoreline settlement patterns in Gwaii Haanas during the early and late Holocene. In: Fedje, D.W., Mathewes, R.W. (Eds.), Haida Gwaii: Human History and Environment from the Time of Loon to the Time of the Iron People. UBC Press, Vancouver, pp. 274-302. Mackie, Q. David, L. Fedje D., McLaren, D. Gusick, A., 2013. Locating Pleistocene-age submerged archaeological sites on the Northwest Coast: Current Status of Research and Future Directions. In: Graf, K.E., Ketron, C.V., and Waters, M.R. (Eds.), Paleoamerican Odyssey. Center for the Study of the First Americans, Department of Anthropology, Texas A&M University. pp. 133-147. Mackie, Q., Fedje, D., McLaren, D., Smith, N., McKechnie, I, 2011. Early environments and archaeology of coastal British Columbia. In: Bicho, N., Haws, J., and Davis, L. (Eds.) Trekking the Shore: Changing Coastlines and the Antiquity of Coastal Settlement. Springer Publishing Company, New York, pp 51-104. Mathews, W.H., 1991. Ice sheets and ice streams: thoughts on the Cordilleran Ice Sheet

49
symposium. Géographie Physique et Quaternaire 45, 263-267. McLaren, D., 2008. Sea level change and archaeological site locations on the Dundas Island Archipelago of north coastal British Columbia. PhD Dissertation, Interdisciplinary Studies, University of Victoria. McLaren, D., Martindale, A., Fedje, D., Mackie, Q., 2011. Relict shorelines and shell middens of the Dundas Archipelago. Canadian Journal of Archaeology. 35, 86-116. McNeely R., Dyke A. S., Southon J. R., 2006. Canadian marine reservoir ages, preliminary data assessment, Open File 5049, pp. 3. Geological Survey Canada. Meidinger, D., Pojar, J.,1991. Ecosystems of British Columbia. Government of British Columbia, Ministry of Forests, Special Report Series 6, Victoria, BC. Peltier, W.R., Fairbanks, R.G., 2006. Global glacial ice volume and Last Glacial Maximum duration from an extended Barbados sea level record. Quaternary Science Reviews 25, 3322-3337. Pienitz, R., Fedje D.W., Poulin, M., 2003. Marine and non-marine diatoms from the Haida Gwaii archipelago and surrounding coasts, northeastern Pacific, Canada. Bibliotheca Diatomologica 48. J. Cramer, Berlin Plafker, G., 1969. Tectonics of the March 27 1964 Alaska Earthquake. US Department of the Interior, Earthquake Series. US Government Printers, Washington, DC. Rahemtulla, F., 2006. Design of Stone Tool Technology During the Early Period (CA. 10,000-5,000 B.P.) at Namu, Central Coast of British Columbia. PhD. Dissertation, Department of Archaeology, Simon Fraser University, Burnaby. Reasoner, M. A., 1986. An inexpensive, lightweight percussion core sampling system. Géographie Physique et Quaternaire 40, 217-219. Renberg, I., 1990. A procedure for preparing large sets of diatom slides from sediment cores. Journal of Paleolimnology 4, 87-90. Retherford, R.M., 1972. Late Quaternary geologic environments and their relation to archaeological studies in the Bella Bella-Bella Coola region of the British Columbia coast, University of Colorado, Boulder. Shennan, I., Bradley, S., Milne, G. Brooks, A., Bassett, S., Hamilton, S., 2006. Relative sea-level changes, glacial isostatic modeling, and ice-sheet reconstructions from the British Isles since the Last Glacial Maximum. Journal of Quaternary Science 21, 585-599.

50
Waters, M.R., Stafford, T.W. Jr., McDonald, H.G., Gustafson, C., Rasmussen, M., Cappellini, E., Olsen, J.V., Szklarczyk, D., Jensen, L.J., Thomas, M., Gilbert, M., Willerslev, E., 2011. Pre-Clovis mastodon hunting 13,800 years ago at the Manis site, Washington. Science 334, 351–53. Ward, B.C., Wilson, M.C., Nagorsen, D.W., Nelson, D.E., Driver, J.C., Wigen, R.J., 2003. Port Eliza cave: North American West Coast interstdial environment and implications for human migration. Quaternary Science Reviews 22, 1383-1388. Warner, B.G., Mathewes, R.W., Clague, J.J., 1982. Ice-free conditions on the Queen Charlotte Islands, British Columbia, at the height of late Wisconsinan glaciation. Science 218, 675-677. Witkowski, A., Bertalot, H. and Metzeltin, D., 2000. Diatom flora of marine coasts. Volume I. Iconographia Diatomologica 7. A.R. Gantner Verlag K.G., Ruggell

*Figure