Embed Size (px)
Citation preview

A Pointillist Approach for ComparingHoneypots
Fabien Pouget?1 and Thorsten Holz??2
1 Institut Eurecom, BP 193, 06904 Sophia-Antipolis Cedex, France2 Laboratory for Dependable Distributed Systems, RWTH Aachen University, 52056
Aachen, Germany
Abstract. Our research focuses on the usage of honeypots for gatheringdetailed statistics on the Internet threats over a long period of time. Inthis context, we are deploying honeypots (sensors) of different interactionlevels in various locations.Generally speaking, honeypots are often classified by their level of inter-action. For instance, it is admitted that a high interaction approach issuited for recording hacker shell commands, while a low interaction ap-proach provides limited information on the attackers’ activities. So far,there exists no serious comparison to express the level of information onwhich those approaches differ. Thanks to the environment that we aredeploying, we are able to provide a rigorous comparison between the twoapproaches, both qualitatively and quantitatively. We build our work onan interesting classification of the observed attacks, and we pay partic-ular attention during the comparison to the bias introduced by packetlosses.The proposed analysis leads to an interesting study of malicious activ-ities hidden by the noise of less interesting ones. Finally, it shows thecomplementarities of the two approaches: a high interaction honeypotallows us to control the relevance of low interaction honeypot configu-rations. Thus, both interaction levels are required to build an efficientnetwork of distributed honeypots.
1 Introduction
Many solutions exist for observing malicious traffic on the Internet. However,they often consist in monitoring a very large number of IP addresses like awhole class A network or a large range of unused IPs. Several names have beenused to describe this technique, such as network telescopes [1, 2], blackholes [3,4], darknets [5] and Internet Motion Sensor (IMS) [6]. Some other solutionsconsist in passive measurement of live networks by centralizing and analyzingfirewall logs or IDS alerts [7, 8]. A few websites report such trends like DShield,
? Work by F. Pouget is partially supported by the French ACI CADHO in collabora-tion with LAAS-CNRS and CERT Renater
?? Work by T. Holz is supported by the Deutsche Forschungsgemeinschaft (DFG) aspart of the Graduiertenkolleg “Software for mobile communication systems”

SANS/ISC or MyNetwatchman [7, 9, 10]. Coarse-grained interface counters andmore fine-grained flow analysis tools such as NetFlow [11] offer another readilyavailable source of information.
So far, nobody has investigated the possibility of using a large number of localand similar sensors deployed all over the Internet. However, we strongly believethat local observations can complement the more global ones listed above. Adirect analogy can be made here with weather forecast or volcanic eruption pre-diction, where both global and local approaches are applied. As a consequence,we are on the way to deploying many small honeypot environments in variouslocations thanks to motivated partners, as part of the Leurre.com Project. Themain objective is to gather statistics and precise information on the attacks thatoccur in the wild on a long-term perspective. We have initially used high in-teraction honeypots. Then, because of the incoming and increasing number ofparticipants in addition to the hard constraints imposed by their implementa-tion, we have considered the idea of deploying low interaction honeypots. At thetime of writing, some environments of different interaction levels are running.We invite the interested reader to have a look at the existing publications formore information on that point [12–14].
An important issue that must be addressed with such deployment is the biasintroduced by the choice of low interaction platforms. The environmental setupwe present here gives us the opportunity to make a rigorous comparison of twodifferent interaction approaches, both qualitatively and quantitatively. So far,such a comparison did not exist. Honeypots have been classified in interactioncategories without concrete justification [15]. For instance, it is admitted that ahigh interaction approach is suited for recording hacker shell commands, whilea low interaction approach provides limited information on the attackers’ activ-ities. This paper intends to show that this classification is too restrictive. As faras our research objectives are concerned, both approaches present value. Thecontributions of this paper are the following:
– We show that both approaches provide very similar global statistics basedon the information we collect.
– A comparison of data collected by both types of environments leads to aninteresting study of malicious activities that are hidden by the noise of lessinteresting ones.
– This analysis highlights the complementarities of the two approaches: a highinteraction honeypot offers a simple way to control the relevance of low in-teraction honeypot configurations and can be used as an effective etalonsystem. Thus, both interaction levels are required to build an efficient net-work of distributed honeypots.
The rest of the paper is structured as follows: Section 2 describes and justifiesthe setup of the distributed honeypot. This environment has been implementedin two different ways corresponding to two distinct interaction levels. The analy-sis is then built on these two approaches. Section 3 introduces a comparisonof global statistics obtained by means of these two distinct implementations. in

particular, we show the similarity of the information provided by the two envi-ronments. In Section 4 we take a closer look at some activities that are apparentlydifferent between platforms. This in-depth study of both platforms leads to thediscovery of strange attack scenarios that require particular attention. We fi-nally explain to what extent high interaction honeypots can be used as referencesystems to optimize the configuration of low interaction ones. These two lastSections provide rationales for the Leurre.com project that we are deploying.Finally, Section 6 concludes this paper.
2 Environment Setup: two different levels of interaction
2.1 High Interaction Experimental Setup - H1
We have presented in previous publications [12,16] some experiments based on socalled ”high interaction honeypots”. This environment, called in the followingH1, is a virtual network built on top of VMware (see Figure 1) [17]. Threemachines are attached to a virtual Ethernet switch 3 supporting ARP spoofing.The VMware commercial product enables us to configure them according to ourspecific needs. mach0 is a Windows98 workstation, mach1 is a Windows NTServer and mach2 is a Linux Redhat 7.3 server. The three virtual guests arebuilt on non-persistent disks [17]: changes are lost when virtual machines arepowered off or reset. We perform regular reboots to guarantee that the virtualmachines are not compromised, as the objective is to gather statistical data ina long-term perspective. A fourth virtual machine is created to collect data inthe virtual network. It is also attached to the virtual switch and tcpdump isused as a packet gatherer [18]. This machine and the VMware host station areas much as possible invisible from the outside. Both mach0 and mach2 run anftp server; in addition, mach1 provides a web server. Logs are collected daily andtransferred to a centralized and secure place.
We have also made some comparisons with another deployed ”high inter-action” honeypot called GenII [19]. However, the collected data were based onsnort-inline 4 alerts. First, alerts provide different information than raw data(see Section 2.3 to find explanations on the information we can extract) and arequite likely false positives. Second, snort-inline drops packets based on the wayit estimates risk. These two reasons have prevented us from making interest-ing comparisons at this stage. Thus, we do not refer to this architecture in thefollowing.
2.2 Low Interaction Experimental Setup - H2
We have deployed a platform called H2 similar to H1 presented before, but withemulated operating systems and services. We have developed it based on severalopen source utilities. Indeed, it consists in a modified version of honeyd [20]. The
3 A switch in the VMware jargon actually behaves like a hub4 snort-inline is an open source Intrusion Prevention System (IPS)

Fig. 1. H1 Environment scheme
platform only needs a single host station, which is carefully secured by means ofaccess controls and integrity checks. This host implements a proxy ARP. Thisway, the host machine answers to requests sent to several IP addresses. EachIP is bound to a certain profile (or personality in the honeyd jargon). Thus, H2
emulation capacity is limited to a configuration file and a few scripts. It emulatesthe three same Operating Systems as H1 for mach0, mach1 and mach2. We havescanned the open ports in H1 and opened the very same ones in the honeydconfiguration file for each of the three virtual machines. Some service scriptsthat are available in [20] have been linked to open ports, like port 80 (webserver) or port 21 (ftp). As a consequence, H2 can be seen as offering a similaryet simplified behavioral model of H1. In the same manner, we connect everyday to the host machine to retrieve traffic logs and check the integrity of chosenfiles.
2.3 Information Extraction
As previously explained, dump files are periodically collected from H1 and H2
and are stored in a centralized database. There, they are analyzed by means ofother utilities and additional information is brought in, such as IP geograph-ical location, domain name resolution, passive OS fingerprinting, TCP streamanalysis, etc. For the sake of conciseness, we do not want to detail the databasearchitecture and the way we obtain information in this paper; we invite the in-terested reader to look at our previous publications, where we have describedthe setup in detail [14, 21].

3 Global Statistics Analysis
3.1 Introduction
Honeypots can be seen as black boxes: they describe a system whose internalstructure is not known. All what matters is that the device transforms giveninputs into predictable outputs.
In our case, incoming malicious requests are the input and provided repliesare the output. Let I1 be the quantity of information from Honeypot H1 (thehigh interaction honeypot). In the same way, let I2 be the quantity of infor-mation provided by Honeypot H2 (the low interaction honeypot). Intuitively,we expect I2 / I1. However, it is more difficult to estimate to which extent I2
brings less information. The following Sections intend to qualify and quantifythis information difference I1 − I2.
The initial setting is the following: environments H1 and H2 are both placedin the same network. The virtual machines mach0, mach1 and mach2 have threeadjacent IPs in H1, say X.X.X.1, X.X.X.2, X.X.X.3. In a similar way, virtual ma-chines mach0, mach1 and mach2 have in H2 contiguous addresses, resp. X.X.X.6,X.X.X.7, X.X.X.8.
H1 has been running since February 2003. Environment H2 started runningon July 2004. A technical problem prevented us from collecting the whole monthof November 2004. Thus, we will focus on data collected on both environmentsfrom August 2004 to October 2004, that is 10 continuous weeks.
We propose in the following Section to study the differences between the twoplatforms in that period, thanks to the information stored in the database (seeSection 2.3).
3.2 Attack Categories
Both environments H1 and H2 are targets of attacks. Each environment containsthree virtual machines running different services and different OSs. They are notequally targeted. This leads us to define three major categories of attacks:
– The ones which target only one machine. They are called attacks of Type I.– The ones which target two out of three virtual machines. They are called
attacks of Type II.– The ones which target all three virtual machines. They are called attacks of
Type III.
Table 1 represents the distribution (in percentage) of these 3 categories oneach environment H1 and H2. Values are very similar. This attack classificationis used in the following to start comparing environments.
3.3 Type III Attack Analysis
We propose in this Section to look at Type III attacks. They stem for around35% of the total attacks. Figure 2 represents the number of associated sources

Attack Type H1 Environment H2 Environment
Total 7150 7364
Type I 4204 (59%) 4544 (62%)
Type II 288 (4%) 278 (4%)
Type III 2658 (37%) 2542 (34%)
Table 1. Different Attack Types observed on H1 and H2
Fig. 2. Attacks of Type III on the two French platforms H1 and H2
observed on environments H1 (dark curve) and H2 (light curve) every 2 days.Curves have the same general shape. We do not expect any difference for thereason that attacks targeting the three virtual honeypots are likely to be broad-sweeping scans [13]. Thus, those scans should be observed independently on theplatform. In other words, there should be the same number of scans on bothplatforms. This is not exactly the case in Figure 2 where curves present smalldissimilarities.
A closer look at the attacks confirms that almost all IP sources associatedwith Type III attacks have been observed on both environments. For those whichare not included in one curve, it appears that they are classified as attacks of typeIII in one environment, and in attacks of Type II in the other one. In a few cases,they are even classified as attacks of type I. An analysis of the correspondingpacket traffic reveals that they often consist of a single TCP packet sent toone target. It might happen that packets are lost due to congestions in theInternet and we can imagine that such packets are not retransmitted by theattacker. To validate this assumption, we check that there is no bias in the lossobservation, that is, we observe an equal number of packet losses on platform H1
and on platform H2. In addition, the number of supposed scan packet losses isdistributed among all virtual machines without apparent preferences. As a firstapproximation, the value we observe can also be linked to the estimated TCP

packet loss value in the path between the attacking machine and the honeypotenvironment at a given date. If for a period of time ∆(t) the estimated packetloss between the attacking source and the honeypots environment is p loss, thenthe probability Pr of getting an incomplete scan on the six virtual machinesbecomes:
Pr = 1− (1− p loss)6 (1)
In this experiment, we identify 92 such losses over a total of 2851 distinct typeIII attacks during the two-month observation (observed on both environmentsor only one). According to the previous equation, this is equivalent to an averagepacket loss of 0.6%, which remains coherent with actual traffic monitoring [22].This is even quite low if we compare with the global average 2-5% observed onthe Internet Traffic Report web site [23]. However, we also note on their sitehigh differences between continents. European traffic seems less susceptible, inaverage, to packet losses than other continents such as Asia.
A first assertion based on our experiment is:
Assertion 1 It is not necessary to deploy honeypots using hundreds of publicIP addresses in order to identify scan activities against large block IPs. Threeaddresses contained in that block are sufficient. Large-scale scans will be attackson the three honeypot machines. We may observe only two attempts in case ofpacket losses, as it appears that not all scanning engines do implement packetretransmission processes.
To complete the analysis, we also observe another interesting property com-mon to H1 and H2 based on the fact that virtual machines have been assignedcontiguous IP addresses. The main scanning technique consists in issuing re-quests to IP address by incrementing their IP value by 1. To quantify the im-portance of this scanning method, we represent in 3.3 the six possible orders ofscanning that have been observed. We give for each of them their frequency (inpercentage), that is, the number of IP sources which have targeted the threevirtual machines over the total number of IP sources associated to Type IIIattacks.
Type III Attack Order Percentage
Order 1: Mach0, Mach1, Mach2 79%
Order 2: Mach0, Mach2, Mach1 5%
Order 3: Mach1, mach0, Mach2 4%
Order 4: Mach1, Mach2, Mach0 5%
Order 5: Mach2, Mach0, Mach1 3%
Order 6: Mach2, Mach1, Mach0 4%Table 2. Scanning order for Type III attacks
The figures remain quite constant when computing it on a monthly basis.Attacks targeting machines by increasing IP numbers correspond to 79% of the

total. The other values are more or less equal. It is important to point out thatall attacks which have targeted the three machines of one platform in a differentorder than Order 1 have, instead, respected this Order 1 when sending packetsto the three machines of the other platform.
This highlights the fact that all scans are done according to Order 1 but somepackets may arrive in a different order on the platform, creating the illusion ofother scanning orders. This remark is also validated by studying the sourceports used by the attacking machine, and more specially, their sequence over thescans on the honeypot virtual machines. It consists in 80% of the cases in anarithmetic sequence with a common difference of 1. These simple observations oftwo different but correlated sequences (targeted virtual machines and attackingsource ports) leads to three major remarks:
– We observe scan activities that sweep through IP addresses sequentially indecreasing order in very few cases.
– Almost all scans that target three consecutive IPs are programmed to hitthem sequentially in increasing IP order. It might happen, however, that theorder is slightly disrupted because of some packet retransmissions. A studyof the different source ports used by the attacking machine confirms this (thenon-privileged ports are used sequentially).
– Scanning machines do not wait for a scan to be finished in order to targetthe next IP. Scanning threads are not blocking. In other words, we observethat temporal periods of scanning activities against two virtual machinesfrom a same source can overlap.
Finally, we intend to have a closer look at some scanner implementationoptions in order to build relationships with the observed traces. For instance,the advscan Sourceforge Project allows parametering some variables such as thenumber of concurrent threads, the delay or the scanning duration [24].
3.4 Type II Attack Analysis
Attacks of Type II represent a very small fraction of all observed attacks on H1
and H2. As we explain in the previous Section, some scanning activities thattarget a large block of IPs can miss some addresses insofar as the tools do notretransmit lost packets. It has been observed that 88% of the attacks of type IIare residues of scanning attacks on both environments H1 and H2, and thus, areincomplete Type III attacks. The remaining 12% are more interesting:
– For 9% of Type II attacks: The IPs have been observed against two virtualmachines on one environment, namely mach0 and mach2. The attacking IPshave also been observed on the other environment. A closer look at thesource ports used by the attacking machines leads to the conclusion thatthese attacks scan one out of two successive IPs. Indeed, all these IPs whichhave targeted mach0 (X.X.X.1) and mach2 (X.X.X.3) on H1 have targetedmach1 (X.X.X.7) only on H2. Inversely, all these IPs which have targeted

mach0 (X.X.X.6) and mach2 (X.X.X.8) on H2 have only targeted mach1(X.X.X.3) on H1. This can be seen as a limitation of our local honeypotplatforms. Indeed, we will not be able to distinguish attacks with largerscan hops. We are not aware of any tool using this strategy. However, acomplementary analysis can be performed by means of large telescopes anddarknets.
– For 3% of Type II attacks: They concern attacks on the sole two Windowsmachines mach0 and mach1 on both environments H1 and H2. They are forinstance attack attempts on port 5554 (Sasser Worm FTP Server [25]) orport 9898 (Dabber Worm backdoor [26]). It is clearly not the usual propa-gation techniques of these worms. We face attacks that have acquired someknowledge of the existence of Windows machines on both environments, andthat have made some random-like attempts on them. Indeed, we do not ob-serve attempts on both ports but only one on each machine. The attackingIPs are also not observed on both environments, unlike the others.
This leads to a second assertion:
Assertion 2 Attacks targeting two out of three machines can be specific to thetwo victim machines, but are with high probability residues of scanning activities.
3.5 Type I Attack Analysis
Categories of type I are far more difficult to compare between environments H1
and H2. They account for around 60% of all attacks on each machine. Figure3 represent some global characteristics of these attacks on both environments.To be more precise, Figure 3(a) presents the geographical location of the attacksources corresponding to Type I attacks. On the horizontal axis are presentedthe top 10 countries. The vertical axis gives the number of associated attackingsources for each environment. Figure 3(b) gives the estimated attacking OS,based on passive OS fingerprinting techniques [27]. The vertical axis gives alsothe number of associated attacking sources for each environment.
As a general remark, there is no important differences between environmentsH1 and H2. For instance, both are targeted by 4 main countries with the sameorder of magnitude (France FR, China CN, Germany DE, United States of Amer-ica US)5. The other country participations are more variable over months butremain coherent between both environments. The passive fingerprinting analysisconfirms this similarity between attacks on the two environments too. The IPsources which attack the platforms are essentially running on Windows. To com-plete this comparison, Figure 4 lists the 10 most targeted ports on each platformH1 and H2. The vertical axis shows the number of associated attacking sourcesfor each environment. The order is identical and the number of attacks on those10 ports are very similar on both environments.
5 The geographical location has been obtained by means of the Maxmind commercialutility [28]
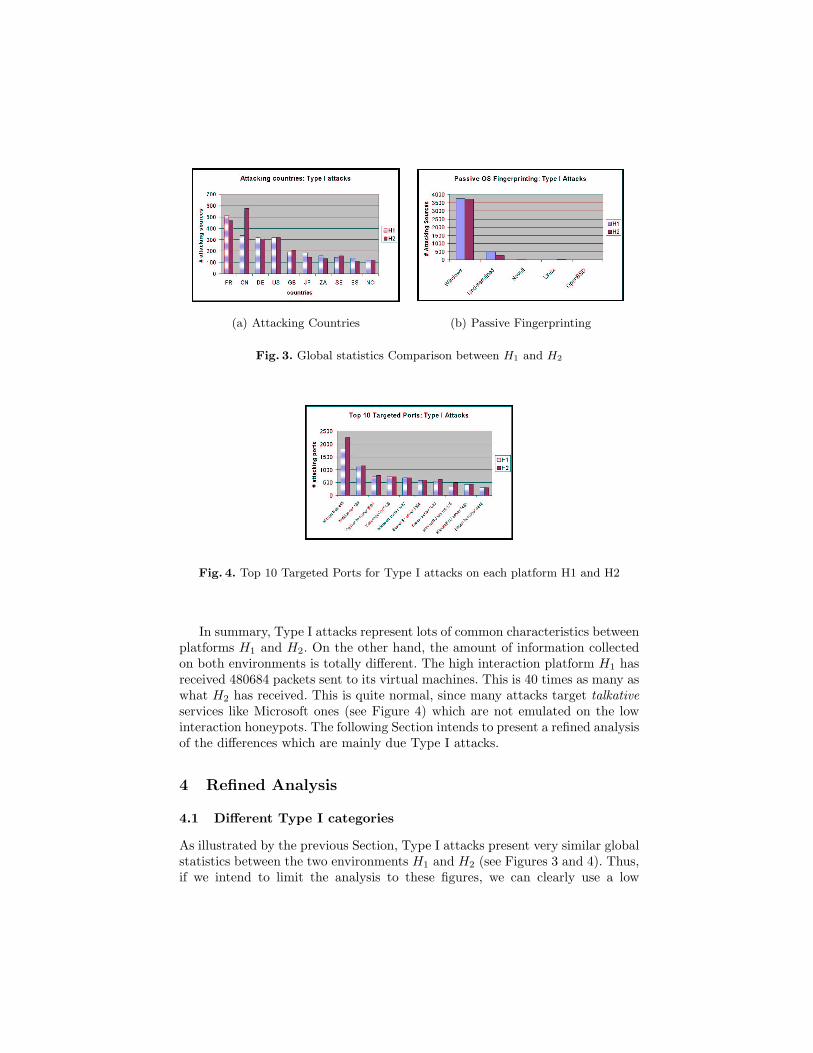
(a) Attacking Countries (b) Passive Fingerprinting
Fig. 3. Global statistics Comparison between H1 and H2
Fig. 4. Top 10 Targeted Ports for Type I attacks on each platform H1 and H2
In summary, Type I attacks represent lots of common characteristics betweenplatforms H1 and H2. On the other hand, the amount of information collectedon both environments is totally different. The high interaction platform H1 hasreceived 480684 packets sent to its virtual machines. This is 40 times as many aswhat H2 has received. This is quite normal, since many attacks target talkativeservices like Microsoft ones (see Figure 4) which are not emulated on the lowinteraction honeypots. The following Section intends to present a refined analysisof the differences which are mainly due Type I attacks.
4 Refined Analysis
4.1 Different Type I categories
As illustrated by the previous Section, Type I attacks present very similar globalstatistics between the two environments H1 and H2 (see Figures 3 and 4). Thus,if we intend to limit the analysis to these figures, we can clearly use a low

interaction honeypot instead of a high interaction one. The complexity of thelast configuration is not justified, according to the comparison we made. On theother hand, the number of collected packets is totally different. At this stage, wecannot guarantee that type I attacks observed on H1 are exactly the same as theones observed on H2. Since the previous statistics tend to indicate this property,we propose in this Section to refine the Type I attack analysis, in order to checkthat they indeed present very similar characteristics between both platforms.Thanks to our setup, we are able to distinguish two distinct phenomena thatare correct explanations for some observed type I attacks. We group all theremaining non classified attacks in a third category. These three categories oftype I attacks are discussed in the following Sections.
4.2 Sequential Scans residue
This is the first category of Type I attacks. They are to be compared withthe same large scanning activities than we presented in Section 3.3. This casecan be rare but we can also imagine that two losses can happen on the sameenvironment. It is simply identified by looking at common IP addresses on bothenvironments which have targeted one machine on one environment and threevirtual machines on the other one, during a short period of time. We find thesame number of corresponding sources on H1 and on H2, 1 out of 1000 TypeIII attacks in average. To validate that it correctly corresponds to packet losses,we consider that if for a period ∆(t) the estimated packet loss between theattacking source and the honeypots environment is p loss, then the probabilityPr to observe two losses out of three scans becomes approximatively:
Pr = 3 ∗ p loss2 ∗ (1− p loss) (2)
This remains coherent with the low number of cases we observe. This categoryhas been observed thanks to the complementarities between H1 and H2. Indeed,a single environment cannot allow identification of such attacks.
4.3 Random Propagation Activities
This is the second category of Type I attacks we can imagine. Many tools chooserandom IPs during their propagation process. They can be worms or bots (Sasser,W32/Agobot, Bobax, etc [25, 29]). As they choose their victims randomly (orat least randomly in a certain IP class, for instance a class B if they favor localpropagation), it is quite normal to observe a given IP source only once if itbelongs to such an attack process.
To identify these Type I attacks, we have decided to build a technique uponthe work already published: we have presented in [13] a clustering algorithmthat allows identifying root causes of frequent processes observed in one en-vironment. Due to space limitations, we refer the interested reader to [13] fora detailed description of the clustering technique. In brief, we basically gather

all attacks presenting some common features (duration of the attacks, num-ber of packets sent, targeted ports. . . ) based on generalization techniques andassociation-rules mining. The resulting clusters are further refined using ”phrasedistance” between attack payloads. In summary, we gather within a cluster allattacking sources that are likely to have used the same attack tool to target agiven machine.
As a consequence, tools propagating through random IPs have similar char-acteristics, even if they are not observed twice on the environments, so theyshould belong to the very same cluster. These Type I sources are more preciselycharacterized by clusters where all IP sources have targeted only one virtualmachine, and where the attacks within a single cluster are equally distributedamong virtual machines. If the distribution of the attacks per virtual machine ishomogeneous (which means we do not observe a significant number of attacks ona few virtual machines only), we consider that the attack belongs to this categorywhich we call Random Propagation Strategy Category. We have systematicallyverified this property for all clusters, with the algorithm presented in Table 3.
If we consider the 240 clusters associated with attacks on H1, only 54 cor-respond to type I attacks. In addition, 43 out of these 54 clusters have randompropagation strategies. The remaining 0.5% of the observed clusters that are as-sociated with type I attacks are discussed in the next category. Finally, we wantto point out that attacks on that category can be identified as easily on platformH1 as on H2.
4.4 Targeted Attacks and Opened Issues
This is the third category of Type I attacks. It gathers all Type I attacks whichcannot be classified in the two previous categories. They are not numerous, asexplained above. They are represented by 0.5% of the clusters and imply a fewdozen attacking sources. This category regroups various attacks of interest, dueto their originality. These attacks have always targeted the same virtual machinein only one environment. The reasons why some attacks focus on one machineonly are really worth being investigated to determine if a specific service istargeted or if this is due to another phenomenon. In the following, we give twoillustrative examples:
– Example 1: Attacks on port 25666 target virtual machine mach0 on H1. Thisattack has been observed 387 times from 378 different IP addresses betweenAugust 2004 and February 2005. Each attack source sends on average threepackets to mach0. A closer look reveals that all packets have 80 or 8080(http) as TCP source port and RST-ACK flags set. They are replies to DoSattacks against web servers, also known as backscatters ( [2]). In summary,we have observed for 6 months DoS attacks against different web servers,and these attacks always spoofed mach0 IP address with source port 25666.Such regular processes have been observed in other platforms we developed.Up to now, we have observed 15 of these processes on H1 and H2.

Surprisingly enough, these attacks occur very regularly, day after day. Itseems also surprising that DoS tools choose to use static spoofed addresses:either spoofed (IP,port) are somehow hardcoded in a tool used by differentpeople (which would be more than bizarre), or these DoS attacks, observedduring 6 months, are part of a unique process launched against several tar-gets over a very long period of time. This means that the spoofed addresslist has been generated once, and has then been used for multiple attacks.The regularity of such a process also indicates that a common cause is theunderlying reason for all these attacks. Finally, these periodic backscatterscome to ports that are likely close on both environments (usually very highnon-privileged ports in the range [1025, 65535]). Thus, we would get the sameamount of information, whatever the targeted environment is.
– Example 2: Targeted port 5000 Attack on mach1 on H2. Two very differentworms are mainly responsible for port 5000 scans. The first, Bobax, usesport 5000 to identify Windows XP systems. Windows XP uses port 5000(TCP) for ’Universal Plug and Play (UPnP)’, which is open by default.The second worm, Kibuv, uses an old vulnerability in Windows XP’s UPnPimplementation to break into these systems. This vulnerability was one of thefirst discovered in Windows XP and patches have long been made available.However, we observe a cluster that is associated to that port. It gathers73 distinct IP sources that have targeted only one virtual machine on portsequence 5000. Surprisingly enough, the 73 attacks have targeted the verysame virtual machine within two months. This does not match the Bobaxand Kibuv worm propagation scheme, as it has been found that they ratherscan machines randomly. In addition, it is important to note that the portis closed on that machine. Packets contain no payload. They are limited tohalf a dozen TCP SYN packets. This attack cannot be considered as randominsofar as it always implies the same virtual target.At the time of writing, we have no concrete explanation of such a phenom-enon. It has also been noticed by other administrators in Incidents mailinglists [30]. The Michigan Internet Motion Sensors group notifies in [31] thatthe observed activities do ”not support the theory of Kibuv entirely”. Thismight be due to revived threats such as Sockets de Troie (Blazer 5) or 1998Trojan ICKiller or Yahoo Chat or non-referenced tools based on the UPnPexploit [32,33]. A closer look at the received packets is required at this stageto determine the attack. However, as the port 5000 is close in both plat-forms H1 and H2, we would get the same amount of information, whateverthe targeted environment is.
Type I attacks are very interesting. We have identified backscatters relatedactivities and tools with widespread random propagation. A few numbers of at-tacks remain unclassified. They seem to be specific to the platform itself, so someprecautions must be required to understand them. At the time of writing, theyare hidden in the noisy permanent activities and thus, they do not really triggerlots of attention. Simple honeypots emulating a few IPs allow their identifica-tion. This is a preliminary but necessary step to start their in-depth analysis.

For each Cluster Cj of type I:
Preliminaries :
Compute the number Nj of attacks associated to Cj on the EnvironmentCompute the number Nj,0 of attacks associated to Cj on the virtual machine mach0Compute the number Nj,1 of attacks associated to Cj on the virtual machine mach1Compute the number Nj,2 of attacks associated to Cj on the virtual machine mach2We check that Nj,0 + Nj,1 + Nj,2 = Nj
Threshold = 0.1Nj
Test on Cluster Cj:
Mean = µ =Nj
3
variance = σ2 =P
0≤k≤2(Nj,k−µ)2
3
IF σ < ThresholdTHEN
res = 1Cluster Cj associated to random propagation tools
ELSEres = 0Cluster Cj associated to targeted attacksA closer look at packet contents is required.
Table 3. Simple algorithm associated to Type I tools having random propagationstrategies
Then, more interaction on that port would bring valuable information on thatattack. As the attack is very specific and we have no preliminary knowledge onit, writing a simple script to H2 is not the correct choice. A controlled environ-ment like H1 must be built to observe the attack details when launched againstreal interactive systems. In a second step, a script can be developed for H2.
We show here that high interaction honeypots are very complementary tolow interaction honeypots as they can indicate which services are not currentlyinteractive enough on low interaction honeypots. We intend in the last Sectionto make this analysis more automatic so that we can determine which servicesmust be developed (by means of scripts) on the low interaction honeypot to geta similar amount of information.
4.5 Interaction Differences and Improvements
The platforms are globally targeted in the same way, as has been detailed in theprevious Sections. However, it is also clear that we collect more data on a highinteraction honeypot, as real services exchange more packets witht the attackers.In average, 40 times more packets are collected with H1 than with H2. Based onthese observations, this Section intends to show where the information is lacking,and how this can be handled.
As specified in Section 2, platforms H1 and H2 have similar configurations.All open ports on machines in H1 are also opened in H2, and vice-versa. On theH2 side, it can be sufficient to open a port in order to get attack information.It can also be necessary to develop simple emulation scripts in order to enhance

the environment interaction. Thus, the idea is the following: The more attacksinteract with a port, the more important it is that honeyd runs an interactivescript behind. In other words, if the amount of information we obtain on attacksthrough a given port on H1 is a lot higher than the one captured on H2 againstthe same port, one of the two following actions must be undertaken:
– A script must be implemented to emulate the associated service if any.– The script interaction should be brought to a higher level if the script already
exists.
Obviously enough, each attack may require different interaction levels. Forinstance, scans do not require high interaction and an open port on both envi-ronments will give the same amount of information.
Furthermore, the error would be to consider here only packets from/to a givenport to compare the amount of information between the two environments. Forinstance, if a source sends a request on port A and then waits for the answerto communicate with port B, the missing information if port A is closed onthe other environment is a lot more important than just considering the simplerequest/answer on port A. We miss all the communication with port B as well.
As a consequence, we use the clusters presented in [13] and introduced inSection 4 to avoid these problems and to determine what services should beenriched on H2. Each cluster groups together all IP Sources sharing strong char-acteristics in their attack processes. These attacking sources have exchanged thesame amount of information on one environment. The interaction we get on avirtual machine must be weighted by the frequency of the attacks on the in-volved ports, as we explain above. The interaction is quantified by consideringthe number of exchanged packets. This can be refined by taking payload lengthinto account, but we limit this analysis on this simple assumption. This leads tothe algorithm presented in Table 4:
The algorithm has been launched on each platform for a 2-month period. Weget the following results:
– For ports where simple scripts are already attached to H2, it appears theybehave correctly compared to the real services running in H1.
– For Netbios ports (135, 139 and 445 specially), the ratio I(H2)I(H1)
is equal to1.5%. No script emulates these services in H2. This is clearly not acceptable,insofar as H2 is missing a large quantity of information in comparison to H1.We are in the process of writing scripts to emulate these services.
– For other ports like 111, 515,. . . , the operation of opening these ports pro-vides as much information as the real services in H1 at this time. There isno need to emulate these services.
The algorithm gives an important hint of which ports are not correctly config-ured on the low interaction environment. It also provides a priority list of theseservices the emulation of which should be improved as fast as possible. Theresult confirms that most of the missing information comes from the Microsoft

Preliminaries :
FOR the two Environments H1 and H2:FOR each Virtual Machine Mj and each associated port pj,k:
Gather the list of Clusters Cl,k corresponding to attacks on Virtual Machine Mj against at least port pj,k
Be N the total number of IP Sources having targeted Virtual machine Mj
Be η the threshold to compare interactions between environments. η = 0.7FOR each Cluster Cl,k
Compute the number nl of Sources belonging to Cluster Cl,k
Compute Pl, the total number of exchanged packets between Sources belonging to Cluster Cl,k
Compute the frequency of Cluster Cl,k as
fl = nlN
Interaction Estimation:
The interaction estimation is for H1
I(H1) =P
l≥1 Pl.fl
The interaction estimation is for H2
I(H2) =P
m≥1 Pm.fm
Analysis:
IF I(H2)I(H1)
≤ η
The current implementation on port pj,k for Virtual Machine Mj in H2 is not correctThe Interaction on this port is not satisfactory. The associated script should be enhanced.
Table 4. Comparing Interactions between H1 and H2
services. To conclude, this algorithm highlights the important complementari-ties that can be obtained by using both a high interaction and a low interactionhoneypot.
5 Leurre.com Project
We have presented in previous publications some experiments based on a highinteraction honeypot [13, 34]. These experiments have shown 1) that most ofthe attacks are caused by a small number of attack tools and that some verystable processes occur in the wild, and 2) that some processes have not beennoticed by more global observations from darknets and telescopes. Thus it isworth deploying local sensors to complement the existing approaches.
The major objective consists in getting statistical information from the at-tacks. Therefore, low interaction honeypots represent a suitable solution. Indeed,we only want to observe the first attack steps in order to get a better understand-ing of current malicious activities. This paper provides another strong motiva-tion, as it shows that low interaction honeypots brings as much information ashigh interaction ones when it comes down to global statistics on the attacks. Inaddition, some regular comparisons between the two types of environments (thehigh interaction environment being the etalon system) lead to an optimizationof the low interaction configuration.

Leurre.com project aims at disseminating such platforms everywhere thanksto motivated partners, on a voluntary basis. Partners are invited to join thisproject and install a platform on their own. We take care of the installationby furnishing the platform image and configuration files. Thus, the installationprocess is automatic. In exchange, we give the partners access to the databaseand its enriched information 6. We are also developing a dedicated web to makeresearch faster and more efficient. The project has started triggering interestfrom many organizations, whether academic, industrial or governmental. Wehope the number of partners will keep on increasing in the near future.
6 Conclusion
This paper presents a very important contribution to the Leurre.com project.Indeed, it shows on one hand that high interaction honeypots are somehow super-fluous in the context of large-scale deployment of sensors, since global statisticsremain very similar. On the other hand, it shows that they are vital for con-trolling the configuration relevance of low interaction honeypots. This leads tothe conclusion that complementarities between high and low interaction honey-pots can increase the accuracy of information collected by simple environmentsdeployed in different places. Besides, this comparison has led to an interestinganalysis of collected data. First, it allows identifying very specific attacks andweird phenomena, as has been shown through some examples. Second, it high-lights the need to take into account packet losses in the analysis of maliciousdata. Otherwise, this can lead to misled conclusions.
Last but not least, we hope this paper will be an incitement for other partnersto join the open project Leurre.com that we are deploying.
Acknowledgments
The authors wish to thank Prof. M. Dacier and V.H. Pham for their helpfulcomments.
References
1. CAIDA, the Cooperative Association for Internet Data Analysis. Internet: http://www.caida.org/, 2005.
2. D. Moore, G. Voelker, and S. Savage. Infering internet denial-of-service activity.In The USENIX Security Symposium, August 2001.
3. D. Song, R. Malan, and R. Stone. A global snap-shot of internet worm activity. Technical report.URL:http://research.arbor.net/downloads/snapshot worm activity.pdf.
6 A Non-Disclosure Agreement is signed to protect the confidentiality of the names ofthe partners

4. B. Gemberling C. Morrow. How to allow your customers to blackhole their owntraffic. URL:http://www.secsup.org/CustomerBlackhole/.
5. Team Cymru: The Darknet Project. Internet: http://www.cymru.com/Darknet/,2004.
6. E. Cooke, M. Bailey, Z.M. Mao, D. Watson, F. Jahanian, and D. McPherson. To-ward understanding distributed blackhole placement. In Proceedings of the RecentAdvances of Intrusion Detection RAID’04, September 2004.
7. The SANS Institute Internet Storm Center. The trusted source for computersecurity trainind, certification and research. URL:http://isc.sans.org.
8. V. Yegneswaran, P. Barford, and S. Jha. Global intrusion detection in the dominooverlay system. 2004.
9. DShield Distributed Intrusion Detection System. URL:http://www.dshield.org.10. myNetWatchman. Network intrusion detection and reporting.
URL:http://www.mynetwatchman.com.11. Cisco Systems. Netflow Services and Applications (1999).12. M. Dacier, F. Pouget, and H. Debar. Attack processes found on the internet. In
NATO Symposium IST-041/RSY-013, April 2004.13. F. Pouget and M. Dacier. Honeypot-based forensics. In AusCERT Asia Pacific
Information Technology Security Conference 2004 (AusCERT2004), May 2004.14. F. Pouget, M. Dacier, and V.H. Pham. Leurre.com: On the advantages of deploying
a large scale distributed honeypot platform. In E-Crime and Computer EvidenceConference(ECCE 2005), March 2005.
15. L. Spitzner. Honeypots: Tracking Hackers. Addison-Wesley, 2002.16. M. Dacier, F. Pouget, and H. Debar. Honeypots, a practical mean to validate
malicious fault assumptions. In The 10th Pacific Ream Dependable ComputingConference (PRDC04), February 2004.
17. VMWare Corporation. User’ s manual. version 4.1. URL:http://www.vmware.com.18. TCPDump utility. URL:http://www.tcpdump.org.19. The Honeynet Project. Know Your Enemy: GenII Honeynets, 2003. http://www.
honeynet.org/papers/gen2/.20. honeyd Homepage. Internet: http://honeyd.org/, 2004.21. F. Pouget, M. Dacier, and H. Debar. Honeynets: Foundations for the development
of early warning systems. 2005. Publisher Springler-Verlag, LNCS, NATO ARWSeries.
22. Stanford Linear Accelerator Center. Tutorial on internet monitoring and pinger,2001. URL: http://www.slac.stanford.edu/comp/net/wan-mon/tutorial.html.
23. Internet Traffic Report, 2005. URL: http://www.internettrafficreport.com/main.htm.24. The AdvanceSCAN advscan utility, 2005. URL:
http://advancemame.sourceforge.net/doc-advscan.html.25. Symantec Security Response. W32-sasser.worm,
2004. URL: http://securityresponse.symantec.com/ avcen-ter/venc/data/w32.sasser.worm.html.
26. LURHQ. Dabber worm analysis, 2004. URL: http://www.lurhq.com/dabber.html.27. p0f: Passive OS Fingerprinting Tool. Internet: http://lcamtuf.coredump.cx/p0f.
shtml, 2004.28. MaxMind: Geolocation and Credit Card Fraud Detection. Internet: http://www.
maxmind.com, 2004.29. SOPHOS. Sophos virus analysis: W32/agobot-pq, 2004. URL:
http://www.sophos.com.au/virusinfo/analyses/w32agobotpq.html.30. 5000 spike? Internet: http://lists.sans.org/pipermail/list/2004-May/
048192.html, 2004.

31. TCP port 5000 syn increasing. Internet: http://seclists.org/lists/incidents/2004/May/0074.html, 2004.
32. Security Port Scanner, Trojan Port List: ICKiller. Internet: http://www.
glocksoft.com/trojan list/ICKiller.htm, 2005.33. 2003 UPnP Exploit. Internet: http://www.packetstormsecurity.org/
0112-exploits/XPloit.c, 2003.34. Fabien Pouget and Marc Dacier. Honeypot-based forensics. In George Mohay,
Andrew Clark, and Kathryn Kerr, editors, Proceedings of AusCERT Asia PacificInformation Technology Security Conference 2004, pages 1–15, 2004.