Embed Size (px)
Citation preview

A Playbook for the FutureValue Creation in Power and Utilities 2018

Boston Consulting Group (BCG) is a global management consulting firm and the world’s leading advisor on business strategy. We partner with clients from the private, public, and not-for-profit sectors in all regions to identify their highest-value opportunities, address their most critical challenges, and transform their enterprises. Our customized approach combines deep insight into the dynamics of companies and markets with close collaboration at all levels of the client organization. This ensures that our clients achieve sustainable competitive advantage, build more capable organizations, and secure lasting results. Founded in 1963, BCG is a private company with offices in more than 90 cities in 50 countries. For more information, please visit bcg.com.

December 2018
Guillaume Aubert, Benjamin Vannier, and Julie Powers
A Playbook for the FutureValue Creation in Power and Utilities 2018
2 Value Creation in Power and Utilities 2018: A Playbook for the Future
AT A GLANCE
Many utilities achieving middle-of-the-road shareholder returns deployed a familiar playbook over the past five years: increasing their exposure to regulated businesses that offer safer and more stable returns, boosting the rate base, and keeping costs under control. The leaders in shareholder value creation executed these steps and more. They not only delivered on the established playbook but also invested in adjacencies to drive value beyond their core business.
WINNERS AND LOSERS For TSR leaders, higher exposure to gas distribution and significant bets on non-commodity businesses drove success. Utility companies that handled public-safety issues badly, executed poorly on very large capital projects, or failed to respond to market trends and continued with legacy businesses lagged in TSR performance.
A PLAYBOOK FOR THE FUTURE To be in the vanguard, companies need to embrace digital technologies, demon-strate that they can successfully move into activities outside their core business, and redefine their role in the value chain while continuing to manage their core efficiently. Accomplishing all this will be no easy feat, but these capabilities will be essential as the industry continues to transform in new ways.

Boston Consulting Group 3
Disruptive forces from new technologies and market transitions are growing by the day, and utilities need to respond or risk falling behind.
At one time, following the standard playbook paid off for power and utility players. That’s why companies have increased their exposure to regulated
businesses in recent years. By doing so, they benefited from safer, more stable returns. But the playbook’s rules keep changing and so does the field of play. Dis- ruptive forces from new technologies and market transitions are growing by the day, and utilities need to respond or risk falling behind.
Understanding how the TSR leaders have achieved their success provides insight into the shareholder value creation drivers of the future. Companies that followed the standard utility playbook—by increasing the rate base, exiting riskier business areas, and keeping costs in check—delivered TSR in the middle of the pack over our five-year study period from mid-2013 through mid-2018. To be in the vanguard, companies had to demonstrate that they could adapt to change by placing big bets on adjacent noncommodity businesses and by embracing emerging technologies. This ability will be essential as the industry continues to transform in radically new ways.
The Key Drivers of TSR Performance In BCG’s overall 2018 Value Creators study, the global power and utility industry delivered median TSR of 10.9% from 2013 through 2017, placing it in the bottom quartile of those rankings. For this study focusing on power and utility companies, we selected a sample of North American players so that we could better under-stand the drivers of TSR in a common regulatory environment and identify actions that companies need to take to maximize their TSR performance in the future. (See the sidebar “Companies in Our Sample.”) We also extended the time horizon through June 30, 2018, in order to provide a more timely analysis. TSR for the 32 companies we analyzed averaged 13% from the end of June 2013 through the end of June 2018.
Power and utility companies display less share price variation than companies in other industries because their return on equity is largely set by the regulator and is therefore more stable than in other industries. Many investors value the fact that utilities are defensive, noncyclical or less-cyclical stocks. But while the overall per-formance of North American power and utility companies was modest compared with that of other sectors—almost all of which produced leaders with TSRs of 40% or above—a closer look reveals notable variations. Fourth-quartile TSR performers produced an average annual TSR of just 4% over our study period. By comparison, top-quartile performers delivered an average TSR of 18%.
4 Value Creation in Power and Utilities 2018: A Playbook for the Future
The new imperative to adapt rather than rely on well-worn strategies was reflected in individual TSR drivers. (See the sidebar “The Components of TSR.”) Debt reduc-tion and generous dividend contributions were key components of TSR among first-quartile companies. But so too was multiple expansion as investors rewarded TSR leaders with higher valuations in anticipation of future growth. For the sector’s laggards, sales growth was the main driver of TSR, while multiple expansion and cash flow contributions had little impact.
The leaders and the laggards shared some common characteristics. These traits united companies regardless of whether they were network businesses, integrated utilities, or hybrid players. Front-runners and midtier companies both followed the industry playbook, but leaders excelled at responding to market disruptions. TSR stragglers failed to deliver new projects, displayed operational weaknesses, or missed market opportunities.
Copying the Utility Playbook Several macroeconomic tailwinds eased the financial pressures on North American power and utility companies over the past five years. Historically low interest rates and the impact of low wholesale gas prices on the utilities’ generation costs allowed them to invest without causing large hikes in total energy bills.
Given this favorable environment, many utilities stuck with a familiar strategy cen-tered on their core business: increasing capital expenditure to boost their rate base and maximize regulated revenues, keeping a lid on operating costs to contain bill growth, and improving their record on outages to meet the regulator’s reliability expectations.
Our sample of 32 North American power and utility companies (4 of which were Canadian) includes two broad categories: unregulated busi- nesses and regulated businesses.
The seven unregulated players are hybrid companies that are engaged in more than one activity across the energy chain and whose generation business is primarily in competitive energy markets. These companies deliver between one-fifth and five times the electricity they generate via their networks, and the regulated portion of their generation portfolios constitutes less than 60% of their total portfolio.
The 25 regulated businesses comprise networks and integrated companies. The six network companies deliver more than five times the amount of electricity they generate. Several also own gas transmission and distribution (T&D) assets. The remaining group consists of integrated players. They deliver between one-fifth and five times the electricity they generate via their networks, and more than 60% of their generation portfolios are regu- lated. Several of these companies also have gas T&D networks as well as midstream assets.
COMPANIES IN OUR SAMPLE

Boston Consulting Group 5
Switching out of competitive power-generating businesses, which sell their output in unregulated markets, and into regulated assets was another important page in the utility playbook. Conventional generation has come under pressure as demand for power in the developed world has plateaued, while an abundance of inexpen-sive natural gas has challenged the economics of nuclear and coal-fired generation. The rise of energy efficiency measures, distributed generation, and utility-scale re-newables and storage solutions has contributed to the changing market dynamic. In response, companies have increased their exposure to regulated assets through ac-quisitions, divestments, and asymmetrical investments in the rate base.
Total shareholder return is measured as the return from a stock invest-ment, assuming all dividends are reinvested in the stock. TSR is the product of multiple factors. (See the exhibit below.) Our model uses a combination of revenue growth and margin change to assess changes in fundamental value. The model then factors in the change in a company’s valuation multiple to determine the impact of investor expectations.
Together, these two factors determine the change in a company’s market capitalization and the capital gain (or loss) for investors. Finally, the model tracks the distribution of free cash flow to investors and debt holders in the form of dividends, share repur-chases, and repayments of debt to determine the contribution of free- cash-flow payouts to a company’s TSR.
• Revenue growth• Net income or EBITDA margin expansion
• Growth and profitability expectations (revenues, earnings per share, innovation, margins, return on invested capital)• Consistency of performance and meeting expectations• Confidence in management• Portfolio changes• Targeting of optimal investors• Financial policies • Risk factors (debt, volatility, M&A)
• Capital expenditures• Working-capital needs• Dividends, share repurchases, debt, cash
Three TSR drivers Management levers
Capital gains
Change invaluationmultiple
Cash flowcontribution
1
2
3
TSR
Profit growth
Source: BCG analysis.
TSR Is the Product of Multiple Factors
THE COMPONENTS OF TSR

6 Value Creation in Power and Utilities 2018: A Playbook for the Future
By taking these measures, companies delivered TSRs of 8% to 14%. Following the industry playbook effectively and optimizing their core business—as several mid- tier players did—only got companies so far, however. This approach was a neces-sary step, although it was not sufficient to make companies into TSR leaders. Utilities that were looking to produce strong TSRs for their shareholders and to differentiate themselves from their peers had to deploy other strategic moves as well.
One reason was that tending to the core business, unsurprisingly, was not a unique strategy. Companies generally kept the increases in their operating expenses in line with their revenue growth. Similarly, nearly all of the utilities successfully upped their rate base over the period. While TSR leaders increased the rate base by 9% per year on average, the laggards as well as the players in the middle of the pack also boosted the base at a healthy rate, with both of these groups averaging 7.5%.
Other parts of the playbook produced greater variability. Some companies were better than their competitors at improving network reliability—reducing the duration and the frequency of power outages, for example. But while this may have bolstered their standing with regulators, it did not translate into higher share-holder returns. (See Exhibit 1.) And while hybrid and integrated players shifted their portfolios into regulated power and utility assets, this move did not lead to higher TSR.
Average annual TSR,mid-2013 through mid-2018 (%)
2017 SAIDI1 (minutes)
Top decile First quartile Second quartile Third quartile Fourth quartile0
5
10
15
12
14
89
11
93-155<56 <64 64-92 >155
Sources: Federal Energy Regulatory Commission Form 1; S&P Capital IQ; Energy Information Administration (EIA); BCG analysis.Note: Includes 29 utilities with regulated electric operations reporting reliability data to the EIA. SAIDI (the System Average Interruption Duration Index) measures the average outage duration for each customer served.12017 SAIDI Performance (excluding major-event days), weighted by rate base for multientity utilities.
Exhibit 1 | Better Reliability Did Not Automatically Drive Higher Shareholder Returns
Boston Consulting Group 7
Responding Effectively to Market Opportunities The secret to TSR success lay in how companies reacted to market disruptions and opportunities.
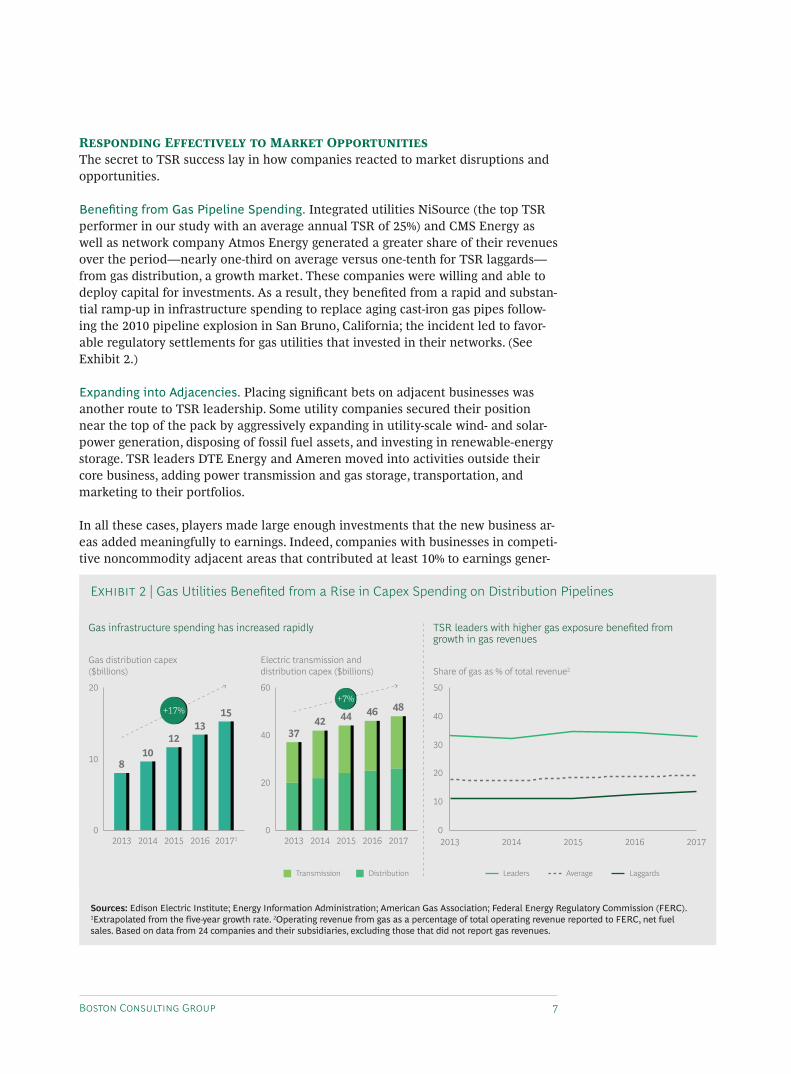
Benefiting from Gas Pipeline Spending. Integrated utilities NiSource (the top TSR performer in our study with an average annual TSR of 25%) and CMS Energy as well as network company Atmos Energy generated a greater share of their revenues over the period—nearly one-third on average versus one-tenth for TSR laggards—from gas distribution, a growth market. These companies were willing and able to deploy capital for investments. As a result, they benefited from a rapid and substan-tial ramp-up in infrastructure spending to replace aging cast-iron gas pipes follow-ing the 2010 pipeline explosion in San Bruno, California; the incident led to favor-able regulatory settlements for gas utilities that invested in their networks. (See Exhibit 2.)
Expanding into Adjacencies. Placing significant bets on adjacent businesses was another route to TSR leadership. Some utility companies secured their position near the top of the pack by aggressively expanding in utility-scale wind- and solar- power generation, disposing of fossil fuel assets, and investing in renewable-energy storage. TSR leaders DTE Energy and Ameren moved into activities outside their core business, adding power transmission and gas storage, transportation, and marketing to their portfolios.
In all these cases, players made large enough investments that the new business ar-eas added meaningfully to earnings. Indeed, companies with businesses in competi-tive noncommodity adjacent areas that contributed at least 10% to earnings gener-
Gas distribution capex($billions)
Gas infrastructure spending has increased rapidly TSR leaders with higher gas exposure benefited from growth in gas revenues
Electric transmission anddistribution capex ($billions) Share of gas as % of total revenue2
0
10
20
0
20
60
40
0
20
10
50
30
40
Transmission Distribution Leaders Average Laggards
2016 2017120152013 2014 2016 201720152013 2014 2016 201720152013 2014
810
1213
15
3742 44 46 48+17%
+7%
Sources: Edison Electric Institute; Energy Information Administration; American Gas Association; Federal Energy Regulatory Commission (FERC).1Extrapolated from the five-year growth rate. 2Operating revenue from gas as a percentage of total operating revenue reported to FERC, net fuel sales. Based on data from 24 companies and their subsidiaries, excluding those that did not report gas revenues.
Exhibit 2 | Gas Utilities Benefited from a Rise in Capex Spending on Distribution Pipelines
8 Value Creation in Power and Utilities 2018: A Playbook for the Future
ally had a higher TSR (as much as 5% higher depending on the period) than those with little or no earnings contribution from these areas. (Competitive noncommodi-ty adjacent areas are adjacent businesses unrelated to commodity-fueled merchant power generation, such as competitive transmission and natural gas pipelines.)
For utilities that miscued their expansion into adjacencies, however, shareholders were often unsympathetic. Companies that came late to the party, overpaying for acquisitions in new business areas as a result, saw their share prices slide, ranking in the bottom half of our sample.
Dropping the Ball Failing to execute properly and not responding to market trends were the main reasons that some companies were TSR laggards. And unlike others in our sample group, these companies’ earnings margins shrank and their debt increased over the period. There were three main areas where these companies disappointed.
Public-Safety Shortcomings. Companies that handled public-safety incidents poorly, raising concerns that equipment maintenance or other operational failings were partly to blame, typically produced weak TSR. Regulatory interventions and inves-tor uncertainty about the extent of the utility companies’ liability exacerbated share price declines.
Project Overruns. Poor project execution inhibited TSR performance for some companies. In a few instances, big cost overruns and delays led to project cancella-tions or suspensions, executive resignations, and investigations. The lesson is clear: keeping large-scale capital-intensive projects on time and on budget is essential if utilities hope to create value for shareholders. Failure to deliver on projects can be extremely costly and can leave companies at the bottom of the TSR rankings. Three of the eight performers in the fourth quartile of our sample, including the bottom- ranked company, either were hit by project overruns or had exposure to a utility that was affected.
Missed Market Trends. Reluctance to switch out of legacy businesses was another sure-fire way to deliver poor value creation. One company that delivered fourth- quartile TSR was hurt by its strategic commitment to continue with uneconomical nuclear and coal generation rather than move to regulated assets. For utilities, such overreliance on legacy operations can mean being left behind in an evolving marketplace.
A Playbook for the Future The future will demand changes from all players, whether it’s a shift in strategic direction or an acceleration of current initiatives. High-performing companies have shown that they can take the steps required to adapt to evolving market dynamics. But none of them can afford to rest on their laurels if they want to be in the van-guard of future shareholder value creation.
Power and utility companies will need to find new ways to increase their core gen-erating and network businesses in the face of mounting cost and regulatory pres-
Reluctance to switch out of legacy
businesses was a sure-fire way to deliver
poor value creation.

Boston Consulting Group 9
sures. But they will also have to prepare for growing disruption from the rise of distributed generation, digitization, and changing load profiles by expanding into adjacent markets and redefining their role in the energy landscape.
Managing the CoreNorth American utilities are facing a cocktail of pressures: weak growth in demand for grid power, the need to replace aging assets, and the impact of rising interest rates on their borrowing costs. By expanding their rate base, utility companies can increase revenues and meet their financial commitments. Many utilities have guid-ed their shareholders toward projected average annual earnings growth of 6% from 2017 through 2022. This will require that utility companies make significant invest-ments in their rate base so that they can boost regulated revenues to meet these targets. Because of the outlook for modest load growth and regulators’ determina-tion to ensure that energy bills don’t rise above inflation, however, the growth in regulated revenues is unlikely to be sufficient for companies to meet their earnings targets. We estimate that the revenue gap could be as much as $41 billion by 2022. (See Exhibit 3.)
Confronted with such revenue shortfalls, companies have a few options. One is to increase earnings by further reducing their operating and maintenance costs through lean operations, outsourcing, more efficient use of capital, and reorganiz-ing their portfolios to create efficiencies. Strategic M&A is another source of cost savings: Wisconsin Energy’s 2015 merger with Integrys Energy produced $130 mil-lion in synergies by combining administrative, planning, and procurement func-
Total electric rate base1 ($billions) Total electric regulated revenues ($billions)4
Companies need to invest in their rate base to meet earningsand revenue targets
But regulators’ reluctance to sanction rate baseinvestments will lead to a significant revenue shortfall
02017 2022
500
1,000
1,500
0
100
200
300
400
Revenues required under a 6% earnings growth scenarioRevenues under an inflationary (2%) revenue increase scenario
770
1,055+7%
Key assumptions:• 6% annual earnings growth2
• 9.5% allowed ROE3
(down from 9.73% in 2017)• 50-50 debt equity split
265250298
223 236281
243 257223 236229 250
2341
7 1431
2019 2022 2021 2017 2018 2020
Sources: Edison Electric Institute (EEI); Federal Energy Regulatory Commission; Annual Energy Outlook 2018, Energy Information Administration (EIA); BCG analysis.Note: Based on EIA’s reference scenario for electric-power-demand growth.1Including companies in peer set. 2Based on survey of utility earnings guidance. 3EEI estimate of projected 2022 ROE on the basis of investor-owned utilities. 4Assuming inflationary operating-cost growth.
Exhibit 3 | Power Utilities’ Earnings Expectations May Clash with Regulators’ Desire to Curb Investment
10 Value Creation in Power and Utilities 2018: A Playbook for the Future
tions, thus creating headroom for rate base growth without big hikes in customer bills. Investing in advanced analytics technologies to reduce costs is a third option.
Utilities will still need to work harder at boosting their rate base by persuading the regulator to approve spending on initiatives that benefit users and the wider com-munity in new ways, such as making the power grid more resilient or increasing electric-vehicle usage (which could lower households’ overall energy bills—given that EVs are becoming less expensive to operate than traditional vehicles—and re-duce their carbon footprint). By pursuing these forward-looking investments, utili-ties will be able to make a strong case to the regulator for above-inflation returns.
Preparing for a Disruptive Future As the energy landscape evolves, new areas are growing in importance. Distributed generation and energy storage technologies are allowing individuals to disconnect from the grid, generate power for themselves, and sell the surplus back to their local utility. (See “The Power Grid of the Future,” BCG article, July 2018.) The pro-liferation of data from energy systems is driving the growth of smart meters and other Internet of Things devices. Digitization also promises to transform grid opera-tions, with sensors enabling real-time network monitoring while predictive mainte-nance reduces outages and cuts repair bills.
In tandem with these transitions, utilities’ relationship with their customers and the agencies that govern them is changing irreversibly. Consumers expect a more per-sonalized experience, 24-7 access to bill information from their digital devices, greater choice about how their energy is generated, and more control over energy usage through smart-home energy management systems.
Regulators are responding to market transitions with alternative models and fresh demands. In New York, the regulator requires utilities to produce one-third of their energy from renewable sources and penalizes companies that don’t. Meeting the growing thirst for clean energy is only one example. Utilities are also being asked to do more with their aging infrastructure by delivering new standards of resilience, reliability, safety, and customer choice.
Meanwhile, regulators are altering the ways in which they reward companies. They are shifting from cost-plus compensation to models that give utilities an incentive to improve their performance and offer new products and services. Through inno-vative cost recovery mechanisms, New York’s regulator offers incentives to utilities that facilitate grid connections to renewable-energy sources and curb customer usage through demand management initiatives.
These nascent developments will accelerate over the coming years. Some disrup-tions will pose a threat to incumbent utilities, but others will offer opportunities to create shareholder value for companies that can adapt. Indeed, a handful of utili-ties are already investing in electric-vehicle-charging infrastructure. Further out, companies may partner with local governments on smart-city solutions, which use advanced 5G sensors to manage traffic congestion and alert drivers when parking spaces become available, for example.
Utilities’ relationship with their customers
and their regulators is changing irreversibly.
Boston Consulting Group 11
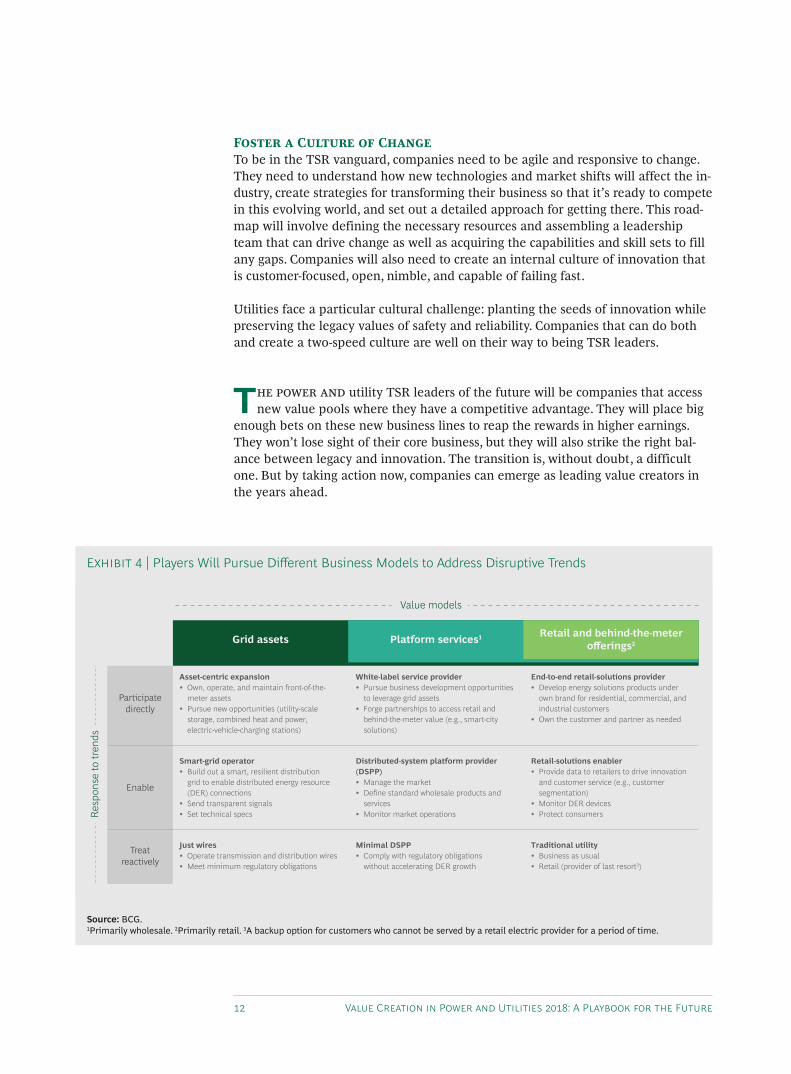
We expect utilities to adopt different business models for the future, with varying degrees of participation. These models will focus on three areas: grid assets, plat-form services, and retail and behind-the-meter offerings. (See Exhibit 4.)
Four Steps to Future Value Creation Utilities will face both opportunities and challenges in the future. As companies advance their strategies, they need to consider the following steps.
Be Proactive in Shaping Regulatory Decision MakingFuture TSR leaders will help drive the regulatory debate about rate base expan-sions and key policy decisions. They will engage early with industry, environmental groups, and nonprofit organizations and will partner with other utilities to build support for the investment proposals they submit to the regulator. They will ensure that company plans remain in step with changing regulatory structures and will work proactively with the regulator on pilots that support their business case.
Segment Potential Business Opportunities Forward-thinking companies can’t rely on a one-size-fits-all philosophy for invest-ment. They need to use different strategies depending on how a new area fits within their existing business and capabilities. Some adjacencies, such as utility- scale wind and solar-power generation or electric-vehicle-charging infrastructure, will merit substantial investment with the aim of achieving a significant uplift in earnings.
Early-stage opportunities that are still being tested—such as many smart-city appli-cations—will require a toe-in-the-water approach that relies on low-investment pi-lots. Nascent technologies that have yet to display their full impact on energy mar-kets, such as blockchain, will need to be actively monitored in case they become major disruptors. Companies will also need to be alert to shifts in their traditional business areas that will result from changing spending priorities, as happened in the gas market following the San Bruno explosion.
Maximize the Potential of DigitalBy investing in big data technologies, companies can generate savings and manage their core businesses better using advanced data-driven analytics. These technolo-gies can help companies identify new revenue sources and invest their capital more efficiently, find ways to reduce spending on operations, and enhance workforce pro-ductivity. (See “How Utilities Can Boost Workforce Productivity with Digital,” BCG article, March 2018.) They can also lead to improvements in network reliability, cus-tomer satisfaction, and safety. And they can drive reductions in customers’ bills and support utilities’ investment cases with regulators.
In our study of one US utility, we found that the company generated savings of $1.3 billion from an initial investment of $500 million. It developed more than 60 use cases for advanced analytics solutions across the business, including in the areas of grid assets, smart energy services, advanced metering, customer-facing activities, and support functions.
Early-stage prospects still in the testing stage will require a toe-in-the-water approach that relies on low-investment pilots.
12 Value Creation in Power and Utilities 2018: A Playbook for the Future
Foster a Culture of ChangeTo be in the TSR vanguard, companies need to be agile and responsive to change. They need to understand how new technologies and market shifts will affect the in-dustry, create strategies for transforming their business so that it’s ready to compete in this evolving world, and set out a detailed approach for getting there. This road-map will involve defining the necessary resources and assembling a leadership team that can drive change as well as acquiring the capabilities and skill sets to fill any gaps. Companies will also need to create an internal culture of innovation that is customer-focused, open, nimble, and capable of failing fast.
Utilities face a particular cultural challenge: planting the seeds of innovation while preserving the legacy values of safety and reliability. Companies that can do both and create a two-speed culture are well on their way to being TSR leaders.
The power and utility TSR leaders of the future will be companies that access new value pools where they have a competitive advantage. They will place big
enough bets on these new business lines to reap the rewards in higher earnings. They won’t lose sight of their core business, but they will also strike the right bal-ance between legacy and innovation. The transition is, without doubt, a difficult one. But by taking action now, companies can emerge as leading value creators in the years ahead.
Enable
Treatreactively
Value models
Asset-centric expansion• Own, operate, and maintain front-of-the-
meter assets• Pursue new opportunities (utility-scale
storage, combined heat and power, electric-vehicle-charging stations)
White-label service provider• Pursue business development opportunities
to leverage grid assets• Forge partnerships to access retail and
behind-the-meter value (e.g., smart-city solutions)
End-to-end retail-solutions provider• Develop energy solutions products under
own brand for residential, commercial, and industrial customers
• Own the customer and partner as needed
Smart-grid operator• Build out a smart, resilient distribution
grid to enable distributed energy resource (DER) connections
• Send transparent signals • Set technical specs
Distributed-system platform provider (DSPP)• Manage the market • Define standard wholesale products and
services• Monitor market operations
Retail-solutions enabler• Provide data to retailers to drive innovation
and customer service (e.g., customer segmentation)
• Monitor DER devices• Protect consumers
Just wires• Operate transmission and distribution wires• Meet minimum regulatory obligations
Minimal DSPP• Comply with regulatory obligations
without accelerating DER growth
Traditional utility• Business as usual• Retail (provider of last resort3)
Grid assets Platform services1 Retail and behind-the-meterofferings2
Resp
onse
to tr
ends
Participatedirectly
Source: BCG.1Primarily wholesale. 2Primarily retail. 3A backup option for customers who cannot be served by a retail electric provider for a period of time.
Exhibit 4 | Players Will Pursue Different Business Models to Address Disruptive Trends

Boston Consulting Group 13
Appendix: Companies StudiedThe full list of companies that BCG tracked for this report is as follows.
NextEra Energy Hybrid-unregulated 78.8Duke Energy Integrated 56.3Southern Integrated 47.0Dominion Energy Integrated 44.6Exelon Hybrid-unregulated 41.1National Grid Transmission and distribution 37.2American Electric Power Integrated 34.1Sempra Energy Hybrid-unregulated 31.6Public Service Enterprise Group Hybrid-unregulated 27.3Consolidated Edison Transmission and distribution 24.3Xcel Energy Integrated 23.2Pacific Gas and Electric Integrated 22.0Edison International Transmission and distribution 20.6WEC Energy Group Integrated 20.4PPL Hybrid-unregulated 20.0DTE Energy Integrated 18.8Eversource Energy Transmission and distribution 18.6FirstEnergy Hybrid-unregulated 17.1Ameren Integrated 14.8Entergy Integrated 14.6Fortis Integrated 13.5CMS Energy Integrated 13.4CenterPoint Energy Transmission and distribution 12.0Atmos Energy Transmission and distribution 10.0Alliant Energy Integrated 9.9NiSource Integrated 9.5Pinnacle West Capital Integrated 9.0Emera Integrated 7.5Canadian Utilities Integrated 6.8Vectren Integrated 5.9Scana Integrated 5.5Algonquin Power & Utilities Hybrid-unregulated 4.6
Company Utility type 2018 market cap($billions)
Sources: S&P Capital IQ; BCG ValueScience Center. Note: All data as of June 30, 2018.
Companies in Our Sample

14 Value Creation in Power and Utilities 2018: A Playbook for the Future
About the AuthorsGuillaume Aubert is a senior partner and managing director in the Washington, DC, office of Boston Consulting Group. You may contact him by email at [email protected].
Benjamin Vannier is a partner and managing director in the firm’s Philadelphia office. You may contact him by email at [email protected].
Julie Powers is a project leader in BCG’s Philadelphia office. You may contact her by email at [email protected].
Acknowledgments The authors would like to thank Justin Dean, David Gee, Christie Jiang, Corina Melchor, Pattabi Ses-hadri, Ross LaFleur, and Ryan McKenzie for their contributions to this report. In addition, they are grateful to Matthew Fletcher for writing assistance and Joan Elliott for marketing support. They thank Katherine Andrews, Gary Callahan, Siobhan Donovan, Kim Friedman, Abby Garland, Sean Hourihan, and Shannon Nardi for their contributions to editing and production.
For Further ContactIf you would like to discuss this report, please contact one of the authors.

For information or permission to reprint, please contact BCG at [email protected].
To find the latest BCG content and register to receive e-alerts on this topic or others, please visit bcg.com. Follow Boston Consulting Group on Facebook and Twitter.
© Boston Consulting Group 2018. All rights reserved.12/18

bcg.com