Embed Size (px)
Citation preview

16-08 | August 23, 2016
A Pilot Survey of Agent Securities Lending Activity
Viktoria Baklanova Office of Financial Research [email protected]
Cecilia Caglio Federal Reserve Board of Governors [email protected]
Frank Keane Federal Reserve Bank of New York [email protected]
Burt Porter Securities and Exchange Commission [email protected]
The Office of Financial Research (OFR) Working Paper Series allows members of the OFR staff and their coauthors to disseminate preliminary research findings in a format intended to generate discussion and critical comments. Papers in the OFR Working Paper Series are works in progress and subject to revision. Views and opinions expressed are those of the authors and do not necessarily represent official positions or policy of the OFR or Treasury. Comments and suggestions for improvements are welcome and should be directed to the authors. OFR working papers may be quoted without additional permission.

1
A Pilot Survey of Agent Securities Lending Activity
Viktoria Baklanova1, Cecilia Caglio2, Frank Keane3, Burt Porter4,5
Abstract
This paper reports aggregate statistics on securities lending activity based on a recently concluded pilot data collection by staff from the Office of Financial Research (OFR), the Federal Reserve System, and staff from the Securities and Exchange Commission (SEC). In its annual reports, the Financial Stability Oversight Council identified a lack of data about securities lending activity as a priority for the Council.6 This pilot data collection was a step toward addressing this critical data need. The voluntary pilot collection included end-of-day loan-level data for three non-consecutive business days from seven securities lending agents. Most but not all participating lending agents were subsidiaries of banks. The dataset of 75 reporting fields provides substantial new information about securities lending activity, including information concerning securities owners, securities borrowers, attributes of securities loans, collateral management, and cash reinvestment practices. However, the pilot data collection was limited in scope and duration. Comprehensive data are still lacking. To close this data gap, a permanent collection of data covering securities lending activity is recommended by the Council.7
1 Viktoria Baklanova, Office of Financial Research, E-mail: [email protected]. 2 Cecilia Caglio, Federal Reserve Board of Governors, E-mail: [email protected]. 3 Frank Keane, Federal Reserve Bank of New York, E-mail: [email protected]. 4 Burt Porter, Securities and Exchange Commission, E-mail: [email protected]. The Securities and Exchange Commission, as a matter of policy, disclaims responsibility for any private publication or statement by any of its employees. The views expressed herein are those of the authors and do not necessarily reflect the views of the Commission or of the author’s colleagues on the staff of the Commission. 5 The authors thank Marco Cipriani, Adam Copeland, Mark Flannery, Sebastian Infante, Antoine Martin, Susan McLaughlin, Stacey Schreft, and Stathis Tompaidis for constructive comments on earlier versions of this paper. The authors also thank Alex Kroeger, Jasmine Park, and Danylo Rakowsky for their excellent research assistance. Views and opinions are those of the authors and do not necessarily represent the views of the Office of Financial Research, the U.S. Department of the Treasury, the Securities and Exchange Commission, the Federal Reserve Bank of New York, the Board of Governors, or the Federal Reserve System. This paper also appears as Federal Reserve Bank of New York Staff Report and as a Securities and Exchange Commission White Paper. 6 See 2014, 2015, and 2016 annual reports published by the Financial Stability Oversight Council. 7 See Council’s 2016 annual report (available at www.treasury.gov/initiatives/fsoc/studies-reports/Pages/2016-Annual-Report.aspx).

2
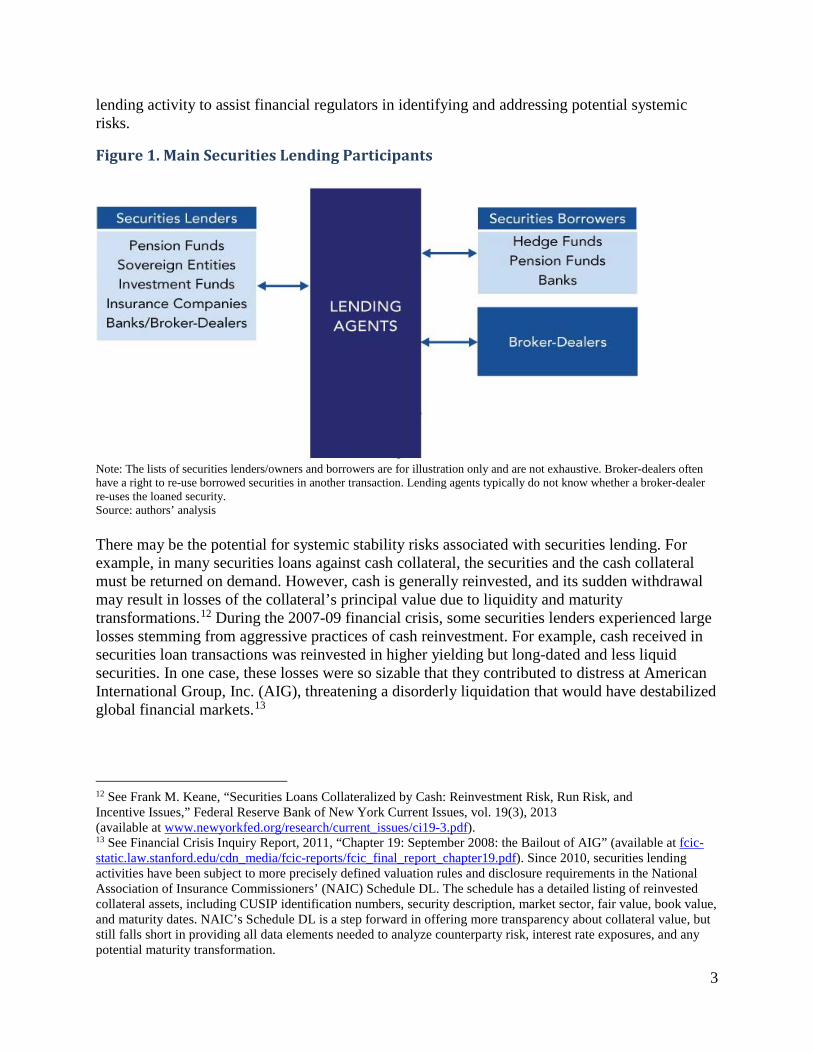
1. Background A securities loan is a transaction in which the lender (a securities owner) temporarily transfers securities to another party, a securities borrower, for compensation (see Figure 1). This transfer is secured by collateral which can be cash, securities, or another form of financial commitment such as a letter of credit. There are typically three parties participating in securities lending activity: the lender that owns the securities, the securities borrower, and a lending agent that facilitates the transaction between lender and borrower.8 The agent may also manage the reinvestment of any cash collateral associated with the securities loans, pursuant to the investments guideline set forth by the securities owner. Agents often lessen the lender’s risk by indemnifying lenders against the risk that the value of the pledged collateral will be insufficient to repurchase the loaned security should the security not be returned by the borrower. Indemnification against loss due to loss of principal in cash reinvestment is less common, but is also evident in the pilot data. Compensation arrangements between the lender and the borrower depend on the nature of collateral for the loaned security. When collateral for a security loan is in the form of other securities, the borrower pays the lender a fee. The fee is a function of the availability of the security being borrowed. Securities in high demand command a higher fee. When collateral for a security loan is in the form of cash, the security lender pays a rebate rate to the borrower. Similar to the lending fee, the rebate rate is a function of the availability of the security being borrowed. However, because the rebate rate is paid by the lender to the borrower, the rebate rate for a security in high demand can be low or even negative.9 The lender derives compensation from the interest earned on cash collateral reinvestment. The total compensation for the lender is a function of the investment returns on the cash collateral and the rebate rate. Lenders typically share a portion of their total compensation with the agent and it is common for the lender to retain most of it. Many types of market participants engage in securities lending. It contributes substantially to market quality through its roles in market making, facilitating trade settlement, and short selling.10 Securities lending increases short-term market liquidity by allowing market makers to increase temporarily the supply of securities available to meet demand for those securities. In these ways, securities lending is vital to smooth market functioning.11 Given the importance of this market, the authors believe that there is a need for a more comprehensive view of securities
8 Some lenders do not rely on third-party agent lenders, but use internal departments to execute their securities lending activity. Such internal departments may have the same incentive and risk considerations as do unaffiliated lending agents. 9 A negative rebate rate means that the lender receives the rebate rate from the borrower. 10 Short selling can serve several purposes. In general, investors use short selling to profit from an expected downward price movement. Some investors may hedge the risk of an economic long position by engaging in short selling of a related security. Market intermediaries sometimes use short selling to provide liquidity when faced with unanticipated demand for certain securities. 11 See Paul C. Lipson, Bradley K. Sabel and Frank M. Keane, “Securities Lending,” Federal Reserve Bank of New York Staff Report no. 555, March 2012 (available at www.newyorkfed.org/research/staff_reports/sr555.pdf).
3
lending activity to assist financial regulators in identifying and addressing potential systemic risks.
Figure 1. Main Securities Lending Participants
Note: The lists of securities lenders/owners and borrowers are for illustration only and are not exhaustive. Broker-dealers often have a right to re-use borrowed securities in another transaction. Lending agents typically do not know whether a broker-dealer re-uses the loaned security. Source: authors’ analysis There may be the potential for systemic stability risks associated with securities lending. For example, in many securities loans against cash collateral, the securities and the cash collateral must be returned on demand. However, cash is generally reinvested, and its sudden withdrawal may result in losses of the collateral’s principal value due to liquidity and maturity transformations.12 During the 2007-09 financial crisis, some securities lenders experienced large losses stemming from aggressive practices of cash reinvestment. For example, cash received in securities loan transactions was reinvested in higher yielding but long-dated and less liquid securities. In one case, these losses were so sizable that they contributed to distress at American International Group, Inc. (AIG), threatening a disorderly liquidation that would have destabilized global financial markets.13
12 See Frank M. Keane, “Securities Loans Collateralized by Cash: Reinvestment Risk, Run Risk, and Incentive Issues,” Federal Reserve Bank of New York Current Issues, vol. 19(3), 2013 (available at www.newyorkfed.org/research/current_issues/ci19-3.pdf). 13 See Financial Crisis Inquiry Report, 2011, “Chapter 19: September 2008: the Bailout of AIG” (available at fcic-static.law.stanford.edu/cdn_media/fcic-reports/fcic_final_report_chapter19.pdf). Since 2010, securities lending activities have been subject to more precisely defined valuation rules and disclosure requirements in the National Association of Insurance Commissioners’ (NAIC) Schedule DL. The schedule has a detailed listing of reinvested collateral assets, including CUSIP identification numbers, security description, market sector, fair value, book value, and maturity dates. NAIC’s Schedule DL is a step forward in offering more transparency about collateral value, but still falls short in providing all data elements needed to analyze counterparty risk, interest rate exposures, and any potential maturity transformation.
4
After the financial crisis, many securities lenders revised their collateral management policies to reduce exposures to risks emanating from cash reinvestment in long-dated or high-risk assets. Cash collateral reinvestment practices of some lenders have reportedly become more conservative since the financial crisis.14 In addition to regulatory limits imposed on some securities owners,15 regulators have taken further steps to reduce risks and improve transparency of cash pools that securities owners commonly use for cash reinvestment purposes.16 Finally, securities owners increasingly accept securities as collateral (see Tables 1 and 13). In 2015, staff from the OFR, the Federal Reserve System and the SEC launched a pilot data collection focused on securities lending activity. Seven large lending agents voluntarily participated in the pilot. Benchmarked against available market size data, securities lending activity facilitated by agents participating in this pilot represent a significant share of the total activity.17 However, the pilot did not capture all securities lending agents or the bilateral activity conducted without agent participation. A more broad-based permanent data collection would provide consistent and comprehensive coverage of this activity. A securities lending data collection could complement the bilateral repo data collection currently under consideration because both are considered necessary for effective monitoring of financial stability.18
2. How the Data Collection was Organized The pilot participants provided a snapshot of their securities lending book at the closing of each of three reporting days in 2015: Oct. 9, Nov. 10, and Dec. 31. Each snapshot included three related sets of data elements (see Table A in the appendix for a complete list of variables collected):
• Inventory of securities available for lending; • Transaction-level detail for outstanding securities loans; and • Cash and noncash collateral information.
14 See, for example, BlackRock, Inc., “Securities Lending: The Facts,” Viewpoint, May 2015 (available at www.blackrock.com/corporate/en-at/literature/whitepaper/viewpoint-securities-lending-the-facts-may-2015.pdf). 15 For example, registered investment companies are restricted by SEC rules to lending no more than one-third of their total assets. See “Securities Lending by U.S. Open-End and Closed-End Investment Companies,” Feb. 27, 2014 (available at www.sec.gov/divisions/investment/securities-lending-open-closed-end-investment-companies.htm). 16 For example, money market mutual funds, which are often used to reinvest cash collateral, are now subject to more stringent risk limits and transparency rules. See SEC’s final rule issued July 23, 2014, and published in the Federal Register on August 14, 2014, “Money Market Fund Reform; Amendments to Form PF.” 17 A lack of data standardization and uneven coverage makes it difficult to estimate with precision the total amount of securities lending activity. See Viktoria Baklanova, Adam Copeland, and Rebecca McCaughrin, “Reference Guide to U.S. Repo and Securities Lending Markets,” OFR Working Paper no. 15-17, Sept. 9, 2015 (available at financialresearch.gov/working-papers/files/OFRwp-2015-17_Reference-Guide-to-U.S.-Repo-and-Securities-Lending-Markets.pdf). 18 For more information about the bilateral repo data collection, see Viktoria Baklanova, Cecilia Caglio, Marco Cipriani, and Adam Copeland, “The U.S. Bilateral Repo Market: Lessons from a New Survey,” OFR Brief Series no. 16-01, Jan. 13, 2016 (available at financialresearch.gov/briefs/files/OFRbr-2016-01_US-Bilateral-Repo-Market-Lessons-from-Survey.pdf). See also supra note 6.

5
To classify securities owners, the Agency Lending Disclosure (ALD) standard was used.19 The ALD standard includes 25 categories of securities owners. For the purpose of this analysis, the 25 ALD categories of securities owners were arranged into six distinct groups:
1. Pension funds and endowments, including ERISA pension plans, non-ERISA pension plans, corporate pension funds, state pension funds, foundations, and labor unions;
2. Investment firms, including 1940 Act registered investment companies, other investment companies, hedge funds, partnerships, UCITS, investment trusts, common trusts, collective trusts, and other trusts;
3. Banks and broker-dealers, including credit unions; 4. Governmental entities, including central banks, sovereign wealth fund, and supranational
entities; 5. Others, including corporate entities; 6. Insurance companies.
Due to the confidentiality restrictions that some securities owners place on their agents, not all respondents provided categories of all of their securities owners. This limitation reflects the global nature of the business, the variation in legal constraints on customer disclosure across jurisdictions, and the voluntary nature of the pilot data collection.
3. Data Description and Analysis This section describes the data collected. The discussion is organized in four parts: statistics concerning the sample coverage, information concerning securities owners and securities borrowers, attributes of the securities loans, and collateral management and cash reinvestment practices.
Sizing the Securities Lending Market Table 1 reports the aggregate market value of securities available for lending and securities on loan by collateral type. Over the three reporting days, lending agents reported, on average, $9.4 trillion in securities available for lending. There were, on average, $1 trillion in securities loans outstanding or about 11 percent of the lendable assets. The collateral received was about equally split between cash ($532 billion) and noncash ($487 billion).
19 The Agency Lending Disclosure (ALD) standard was established in 2004 and is currently maintained by the Industry Taskforce on Agency Lending Disclosure. See Securities Industry and Financial Markets Association (SIFMA) website at www.sifma.org/services/standard-forms-and-documentation/agency-lending-disclosure/.

6
Table 1. Market Value of Securities Available for Lending and on Loan by Collateral Type ($ billions)
Reporting Date
Lendable Assets
On Loan vs. Cash Collateral
On Loan vs.
Noncash Collateral
Total on Loan
Total on Loan
(percent)
Oct. 9, 2015 9,381 560 484 1,045 11.1% Nov. 10, 2015 9,538 555 484 1,039 10.9% Dec. 31, 2015 9,409 481 490 972 10.3%
Average $9,443 $532 $487 $1,019 10.8% Sources: Securities Lending Data Collection Pilot, authors’ calculations.
Securities Owners and Borrowers Table 2 reports the market value of lendable assets by the organizational type of the entity making the securities available for lending. Across the three reporting dates, investment firms, on average, had nearly $3 trillion of securities available for lending, the most of any securities owner type. However, due to existing legal restrictions, this figure may overstate the value of securities that investment firms could actually lend. For example, one type of investment firm, a registered investment company, cannot have on loan at any time securities representing more than one-third of the fund’s total value.20 Despite this restriction, the agents may report the total value of a fund as available for lending. This is because neither the lender, who owns the securities, nor its agent knows which securities will be in demand. The agent would make securities from a given portfolio unavailable when the value of securities on loan reaches the cap imposed by the securities’ owner. Of types of securities owners, pension funds and endowments had the second largest supply of securities available for lending, on average $2.5 trillion. This statistic has similar limitations: while the agent may report the entire portfolio as “available for lending,” pension fund trustees may place restrictions on the portion of the portfolio that may actually be on loan at any time.
20 See supra note 13. See also Investment Company Institute Viewpoints, “Securities Lending by Mutual Funds, ETFs, and Closed-End Funds: The Basics,” Sept. 15, 2014 (available at www.ici.org/viewpoints/view_14_sec_lending_01, accessed May 2, 2016).

7
Table 2. Securities Available for Lending Aggregated by Types of Securities Owners ( $ billions)
Reporting Date
Investment Firms
Pension
Funds and Endowments
Governmental Entities
Insurance Companies
Banks and Broker-Dealers
Others
Total
Oct. 9, 2015 2,981 2,534 1,574 656 130 1,506 9,381 Nov. 10, 2015 3,020 2,543 1,562 648 125 1,639 9,538 Dec. 31, 2015 2,962 2,479 1,551 683 124 1,609 9,409
Average $2,988 $2,519 $1,563 $663 $126 $1,585 $9,443 Note: The “Others” category includes securities owners that were not identified by the pilot participants. Sources: Securities Lending Data Collection Pilot, authors’ calculations. Table 3 reports the market value of securities on loan by the organizational type of the entity making the securities available for lending. Across the three reporting dates, pension funds and endowments, on average, had $332 billion in market value of securities on loan, the most of any securities owner type. Governmental entities had the second largest volume of securities on loan, on average $327 billion.
Table 3. Securities on Loan Aggregated by Types of Securities Owners ($ billions)
Reporting Date
Investment
Firms
Pension Funds and
Endowments
Governmental
Entities
Insurance Companies
Banks and
Broker-Dealers
Others
Total
Oct. 9, 2015 176 348 337 37 16 131 1,045 Nov. 10, 2015 180 340 335 37 16 131 1,039 Dec. 31, 2015 166 309 308 34 15 140 972
Average $174 $332 $327 $36 $16 $134 $1,019 Note: The type “Others” includes securities owners that were not identified by the pilot participants. Sources: Securities Lending Data Collection Pilot, authors’ calculations. Table 4 reports the market values of securities on loan by type of securities borrower for each reporting date. The average value of all securities on loan across three reporting dates was $1 trillion. Broker-dealers were the largest borrowers, collectively borrowing $869 billion in market value of securities. Hedge funds and state pension funds together borrowed less than $10 billion. Although the pilot cannot identify such cases, broker-dealers often borrow securities on behalf of their clients. These clients may be hedge funds or other types of firms.

8
Table 4: Market Value of Securities on Loan by Types of Securities Borrowers ($ billions)
Reporting Date
Registered
Broker-Dealers
Banks/Credit Unions
State Pension Funds
Hedge Funds
Total
Oct. 9, 2015 891.8 143.4 8.0 1.4 1,044.6 Nov. 10, 2015 887.7 144.0 6.4 1.3 1,039.4 Dec. 31, 2015 827.7 138.8 4.2 1.2 971.9
Average $869.1 $142.0 $6.2 $1.3 $1,018.6 Sources: Securities Lending Data Collection Pilot, authors’ calculations.
Securities Inventory and Loan Data Table 5 reports the value of securities available for lending and on loan by asset class. U.S. equity securities were the largest type of securities available for lending ($3.2 trillion), but only 10 percent (or $315 billion) was actually on loan. Of U.S. Treasuries and agencies, $302 billion in securities was on loan, which represented 27 percent of the lendable securities in this category. Approximately 81 percent of loans of U.S. corporate bonds and 70 percent of loans of U.S. equity securities were collateralized by cash. In contrast, only about half of loans of U.S. Treasuries and agencies were collateralized by cash collateral (48 percent).
Table 5. Securities Lending Activity by Asset Class (weighted average of the three reporting dates, $ billions)
Security Type
Lendable Assets
On Loan vs. Cash Collateral
On Loan
vs. Noncash Collateral
Total on Loan
Total on Loan
Relative to Lendable Assets
(percent)
U.S. Treasury/Agency 1,132 144 158 302 27% U.S. Corporate Bonds 1,450 50 12 62 4% U.S. Equity 3,173 222 94 315 10% Foreign Sovereign and Supranational 557 33 87 121 22%
Foreign Corporate Bonds 285 9 8 17 6% Foreign Equity 2,138 55 101 156 7% Not available 707 21 26 46 7%
Note: “Not available” are securities that could not be classified. U.S. Treasury/Agency securities include agency mortgage-backed securities and debentures. Percentages calculated by diving Total on Loan by Lendable Assets. Sources: Securities Lending Data Collection Pilot, Markit Group, Ltd., authors’ calculations.

9
Table 6 reports contractual maturities of securities loans by asset class. Most loans (or 81 percent, on average) were open, on-demand loans, that either borrower or lender could terminate at any time, and could be subject to potential run risk. A larger share of loans of U.S. Treasuries and agencies were callable contracts (24 percent) and term loans (11 percent) compared to the other security types.21
Table 6. Contractual Maturities of Securities Loans by Asset Class (weighted average of three reporting dates, percent of the asset class total)
Contractual maturity
U.S.
Treasury/ Agency
U.S. Corporate
Bonds
U.S. Equity
Foreign Sovereign and Supranational
Foreign Corporate
Bonds
Foreign Equity
Total
Open 60 98 93 82 91 91 81 Callable 24 0 1 9 9 2 9 Evergreen 5 0 2 5 0 3 4 Term 11 2 4 4 0 4 6
Note: Contractual maturities of securities loans for which respondents did not report the asset class are not shown, but included in the total. The total value of such securities loans was $46 billion. U.S. Treasury/Agency securities include agency mortgage-backed securities and debentures. Sources: Securities Lending Data Collection Pilot, Markit Group, Ltd., authors’ calculations. The survey data allowed us to calculate the actual number of days the securities loans have been outstanding as of the reporting date. Table 7 reports the number of days the contractually open loans have been outstanding. As background, open securities loans are often rolled over for a long period of time. Contractual maturities do not provide information about how long the loan has been outstanding, or how many times it has been rolled over. As the table shows, the majority (or 54 percent) of contractually open loans were outstanding for over a month. Seventy-three percent of such open loans of foreign sovereign and supranational debt securities were outstanding for over a month. These data indicate that securities loans tend to have longer rolled over maturities than suggested by the prevalence of the contractually open loans, which can be terminated on demand. Nonetheless, the open maturity of the majority of securities loans implies that cash reinvestment activity must consider liquidity and maturity of the related investment in the context of liabilities that can mature at any time.
21 A callable loan can be called by the lender on a specified date prior to the final legal maturity date of the securities loan. Open loans are continuing loans where no maturity date is specified. Open can be viewed as callable any day by either a lender or a borrower. Term loans that can be extended on or prior to the maturity date were referred to as “evergreen” in the data collection request.

10
Table 7. Age of Open Securities Loans as of Report Date (weighted average of the three r eporting dates, percent of asset class total)
Days Outstanding
U.S.
Treasury/ Agency
U.S. Corporate
Bonds U.S.
Equity Foreign
Sovereign and Supranational
Foreign Corporate
Bonds Foreign Equity Total
0-1 day 13 7 9 3 4 7 9 2-7 days 10 11 11 5 8 11 10 8-30 days 23 29 27 18 27 28 25 31-90 days 21 28 25 24 25 29 25 91-365 days 23 23 24 39 27 25 25 Over 365 days 10 3 3 10 9 2 5
Note: Securities with a security type of “Not Available” are included along with the other six security types in the Total column. The total market value of such loans was $38 billion. U.S. Treasury/Agency securities include agency mortgage-backed securities and debentures. Columns may not total 100 percent due to rounding. Sources: Securities Lending Data Collection Pilot, Markit Group, Ltd., authors’ calculations. As discussed above, the lending fee is the fee paid by the securities borrower to the lender in a securities loan collateralized by other securities.22 Table 8 reports securities lending fees on open security loans by security type borrowed. Securities lending fees reflect the value or price of a security in the collateral market.23 For the three sample days in the pilot the mean lending fees by security type showed that, on average, security lending fees for loans of foreign equity securities were highest, followed by those for U.S. corporate bonds, U.S. equities, foreign corporate bonds, U.S. government securities, and foreign sovereign bonds. On two reporting days, the mean lending fee for borrowing U.S. equity securities exceed the 95th percentile lending fee. This result can be explained by the presence of special securities with very high lending fees that compose less than 5 percent of the market-weighted sample.
22 In a securities loan collateralized by cash, arrangements are more complex and involve both a rebate rate and a cash investment rate. 23 The collateral market is where participants borrow and lend securities rather than money, and the price of the transaction reflects the relative demand and supply of a particular security. Hard-to-find securities generally cost more to borrow and are said to be more “special.”

11
Table 8. Lending Fees (market value-weighted, in percent)
Security Type
Oct. 9, 2015
Nov. 10, 2015
Dec. 31, 2015
5th Percentile Mean 95th
Percentile 5th
Percentile Mean 95th Percentile
5th Percentile Mean
95th
Percentile
U.S. Treasury/ Agencies 0.05 0.13 0.31 0.05 0.15 0.40 0.06 0.20 0.60
U.S. Corporate Bonds 0.08 0.27 0.38 0.08 0.28 0.25 0.08 0.27 0.25
U.S. Equity 0.13 0.32 1.15 0.13 0.33 1.25 0.15 0.34 1.00 Foreign Sovereign and Supranational
0.05 0.12 0.27 0.05 0.11 0.25 0.05 0.12 0.35
Foreign Corporate Bonds 0.07 0.19 0.45 0.07 0.18 0.40 0.07 0.20 0.50
Foreign Equity 0.07 0.48 2.00 0.07 0.56 2.50 0.08 0.59 2.29 Notes: Lending fees indicate pricing for securities loans collateralized by noncash assets. Data exclude loans under an exclusive fee agreement and loans for which lending fee data were not provided by the pilot participants. The values are annualized using a 360-day count convention. U.S. Treasury/Agency securities include agency mortgage-backed securities and debentures. Sources: Securities Lending Data Collection Pilot, Markit Group, Ltd., authors’ calculations. Table 9 reports rebate rates on contractually open security loans collateralized with cash by securities type borrowed. As mentioned above, securities loans against cash collateral remain the most common form of securities loan transactions in the United States, comprising 52 percent of securities loans in our sample, on average, across the three reporting days. Cash collateral is reinvested in other securities or pooled investment vehicles.

12
Table 9. Rebate Rates (market value-weighted, in percent)
Security Type
Oct. 9, 2015
Nov. 10, 2015
Dec. 31, 2015
5th Percentile
Mean 95th
Percentile 5th
Percentile Mean 95th Percentile
5th Percentile Mean 95
Percentile
U.S. Treasury/ Agencies 0.08 0.17 0.28 -0.26 0.03 0.25 -1.25 0.27 0.66
U.S. Corporate Bonds -1.25 -0.20 0.04 -1.25 -0.22 0.02 -1.25 -0.19 0.15
U.S. Equity -2.00 -0.45 0.13 -2.00 -0.49 0.11 -1.75 -0.44 0.12 Foreign Sovereign and Supranational
-0.40 0.15 2.07 -0.40 0.17 2.07 -0.90 0.09 2.07
Foreign Corporate Bonds
-0.45 0.02 0.55 -0.50 -0.03 0.58 -0.65 -0.01 0.58
Foreign Equity -4.00 -0.55 0.63 -4.00 -0.60 1.25 -4.00 -0.50 0.70 Notes: Rebate rates are paid by the securities lender to the securities borrower and can be positive or negative. Data exclude loans under an exclusive fee agreement, loans collateralized by securities, and loans for which rebate rate data were not provided by the pilot participants. U.S. Treasury/Agency securities include agency mortgage-backed securities and debentures. Sources: Securities Lending Data Collection Pilot, Markit Group, Ltd., authors’ calculations. Table 10 reports the market value-weighted required margin on contractually open securities loans by type of loaned security. The means for each asset type are consistent with prevailing market practices for margin on securities lending activity, which generally range from 102 percent to 105 percent.24 Margins on securities loans are negotiable. The variation around the standard margins of 102 and 105 percent can be attributed to firm-specific differences in margining policies and the quality and type of the collateral security. The pilot data included some extreme values for required margin that may be explained by either the inability to price the loaned security or margining practices for multiple borrowings by a single borrower. Alternatively, agent lending firms may manage margin across all loans for a given borrower account. As a result, the margin for a particular loan may not reflect its idiosyncratic risks. This practice may lead to some specific loans appear to be under-collateralized while others appear to be over-collateralized.
24 As reported by market participants during meetings with potential pilot participants.

13
Table 10. Required Margin (market value-weighted, in percent)
Security Type
Oct. 10, 2015
Nov. 9, 2015
Dec. 31, 2015
5th Percentile
Mean 95th
Percentile 5th
Percentile Mean 95th Percentile
5th Percentile Mean 95th
Percentile
U.S. Treasury/ Agencies 100 102 105 100 102 105 100 102 105
U.S. Corporate Bonds 102 102 103 102 102 105 102 102 105
U.S. Equity 102 103 108 102 103 110 102 103 110 Foreign Sovereign and Supranational
100 104 106 100 104 106 100 103 106
Foreign Corporate Bonds 101 103 108 101 103 108 101 103 108
Foreign Equity 100 105 111 100 105 111 100 105 111 Notes: Data exclude loans for which required margin data were not provided by the pilot participants. U.S. Treasury/Agency securities include agency mortgage-backed securities and debentures. Sources: Securities Lending Data Collection Pilot, Markit Group, Ltd., authors’ calculations. Table 11 reports the fraction of securities loans that are indemnified against loss if the pledged collateral is insufficient to replace the lent security should the borrower default on the loan. Indemnification continues to be a common practice among lending agents participating in the pilot.
Table 11. Securities Loan Indemnification by Type of Securities Owners (in percent)
Securities Owner Type Oct. 9, 2015
Nov. 10, 2015
Dec. 31, 2015
Banks and Broker-Dealers 100 100 100 Governmental Entities 97 97 97 Insurance Companies 98 98 98 Investment Firms 99 99 99 Others 95 95 93 Pension Funds and Endowments 97 97 98 Note: Indemnification statistics exclude loans for which security owner type was not provided. Sources: Securities Lending Data Collection Pilot, authors’ calculations.

14
Secured Loan Collateral Management Table 12 reports data on cash versus noncash collateral accepted, by type of securities owner. For the first two reporting dates, the division between cash and noncash is consistent with cash collateral accounting for approximately 55 percent of the total. On Dec. 31, 2015, the value of accepted cash collateral declined whereas the value of noncash collateral is relatively unchanged. On the pilot reporting dates, investment firms and pension funds accepted approximately two-thirds of collateral in the form of cash, while governmental entities accepted the majority of collateral in securities.
Table 12. Collateral Types Accepted by Securities Owners ($ billion)
Securities Owner Type
Oct. 9, 2015
Nov. 10, 2015
Dec. 31, 2015
Cash Noncash Cash Noncash Cash Noncash
Banks and Broker-Dealers 1 15 1 15 1 14 Governmental Entities 138 198 137 197 110 199 Insurance Companies 19 19 19 19 16 18 Investment Firms 112 63 116 65 103 64 Others 14 4 15 6 14 6 Pension Funds and Endowments 236 112 226 114 199 110 Note: Statistics exclude loans for which securities owner classification was not provided. Sources: Securities Lending Data Collection Pilot, authors’ calculations. Chart 1 reports information on the reinvestment of cash collateral. For each collection date, the percentage of total cash collateral reinvested is calculated in each of 18 reinvestment categories specified in the pilot data submission request. The most common reinvestment choice was money market securities, including asset-backed commercial paper (ABCP).25 This option represents over 19 percent of cash collateral reinvestment for each reporting date. Other top reinvestment choices include various types of repos, prime money market funds, as well as direct investment by securities lenders that do not rely on agents for cash collateral management services. When cash collateral is delivered back to the lender, the agent has limited information concerning the lender’s investment strategy.
25 Money market securities are short-term debt securities issued with maturities of one year or less. Examples of money market securities are certificates of deposit and commercial paper. See more at www.finra.org/investors/money-market-securities-and-more#sthash.YmUdLThf.dpuf.

15
Chart 1. Cash Collateral Reinvestment Options (percent of total cash collateral)
Note: “Other” includes all security types not captured by the other options. Sources: Securities Lending Data Collection Pilot, authors’ calculations. Table 13 reports information on indemnification of cash reinvestments. In addition to indemnifying securities owners against losses due to a borrower default, agents sometimes indemnify securities owners against potential losses incurred through cash reinvestment. The survey data suggest that agents often indemnify the principal amount of cash reinvested in the repo market, but not if reinvested in the direct purchases of securities. Both cash reinvestment indemnification and securities loan indemnification provide additional protections to the securities owners, but expose the lending agent to risk. The securities owner type that is most often indemnified against losses from cash collateral reinvestment is government entities, with 37 to 38 percent of their reinvested cash collateral being indemnified. The least often indemnified are insurance companies and investment firms, each with 7 to 8 percent of their reinvested cash collateral indemnified.

16
Table 13. Percent of Total Cash Reinvestment Indemnified by Securities Owner Type
Securities Owner Type Oct. 9, 2015
Nov. 10, 2015
Dec. 31, 2015
Banks and Broker-Dealers 8 14 15 Governmental Entities 37 38 37 Insurance Companies 8 7 8 Investment Firms 8 7 8 Others 19 22 13 Pension Funds and Endowments 22 21 20
Note: Data exclude loans for which securities owner classification was not provided. Sources: Securities Lending Data Collection Pilot, authors’ calculations. Table 14 reports the market value of accepted noncash collateral by security type on each reporting date. Sovereign or supranational debt represented 36 to 38 percent of the total and was the largest category of seven security types posted as collateral. U.S. Treasury and agency debt accounted for 28 to 32 percent of the total. Equity securities accounted for 27 to 33 percent of the total. The remainder, summing to 2 percent of the total, was split among corporate bonds, private structured debt, and “other” types (see Table B in the appendix for a complete list of reported security types for noncash collateral).
Table 14. Noncash Collateral by Security Type ($ billion)
Sources: Securities Lending Data Collection Pilot, authors’ calculations.
4. Next Steps As noted earlier, securities lending is important to well-functioning capital markets, and can expose market participants to significant risk. Given its importance, there is a need for a comprehensive view of securities lending activity. This view would assist financial regulators in
Security Type
Oct. 9, 2015
Nov. 10, 2015
Dec. 31, 2015
Corporate Bonds 7.3 7.5 6.9 Equities 136.0 147.5 179.1 Other 0.3 0.2 0.4 Private Structured Debt 6.7 5.9 4.0 Sovereign or Supranational Debt 195.3 184.9 200.3 U.S. Agencies 96.0 101.2 86.4 U.S. Treasuries 68.0 67.5 63.2

17
identifying and addressing potential risks to financial stability. The data collection pilot was a first step in understanding the data available from market participants as well as the complexities involved in collecting and aggregating the data. Insights from the data collection pilot will prove invaluable in designing any potential reporting scheme for a more permanent data collection.26 Challenges remain in collecting and interpreting securities lending market data. More work must be done to ensure data quality through the use of appropriate standards. Such standards include the legal entity identifier (LEI) and the categorization of financial instruments. Staff from U.S. regulators are working with international regulatory bodies to examine potential steps to harmonize reporting requirements, definitions, and concepts.
26 Securities lending markets and the institutions participating in them are global. Staff from U.S. financial regulators participating in the data collection pilot actively contribute to the global securities financing transaction data collection and aggregation initiative of the Financial Stability Board. For details on the Financial Stability Board’s recommendations, see Financial Stability Board, “Transforming Shadow Banking into Resilient Market-based Finance. Standards and processes for global securities financing data collection and aggregation,” Nov. 18, 2015 (available at www.fsb.org/wp-content/uploads/FSB-Standards-for-Global-Securities-Financing-Data-Collection.pdf, accessed May 2, 2016).

18
5. Appendix
Table A. Securities Lending Pilot Reporting Fields
Notes: BO is Beneficial Owner. “Borrower End Date” field reflects contractual maturity of a securities loan for a specific borrower. Source: Securities Lending Data Collection Pilot
Table B. Reported Noncash Collateral by Security Type 1. U.S. Treasury 2. U.S. Government Agency 3. Municipal Debt 4. Non-U.S. Sovereign or Multinational Agency Debt Security 5. Corporate Bond (non-structured) 6. Private Structured Debt 7. Equity Securities 8. Cash as Securities 9. Other Source: Securities Lending Data Collection Pilot
Securities Inventory Securities Loan Cash Collateral Non-cash CollateralAgent Name Agent ID Agent ID Agent IDAgent ID BO ID BO ID BO IDBO Name Transaction ID Borrower ID Borrower IDBO ID Borrower Name Cash Collateral Value Collateral Security IssuerBO ID Type Borrower ID Currency Collateral Security SEDOL IDBO Domicile Borrower ID Type Reinvestment Type Collateral Security CUSIP IDBO Sector Borrower Domicile Market Value of Reinvestment Collateral Security ISIN IDSecurity Issuer Borrower Sector Quantity Collateral Security QUICK IDSecurity SEDOL ID Booking Location Currency of Reinvestment Triparty?Security CUSIP ID Borrower Start Date Cash Reinvestment Indemnification Collateral Asset ClassSecurity ISIN ID Borrrower Transaction Type Reinvestment Security Issuer Security Collateral Market ValueSecurity QUICK ID Borrower Call or Extention Notice Reinvestment Security SEDOL ID CurrencyTotal Lendable Supply Quantity Borrower End Date Reinvestment Security CUSIP ID QuantityTotal Lendable Supply Market Value BO Start Date Reinvestment Security ISIN IDCurrency Security Issuer Reinvestment Security QUICK IDQuantity on Loan Security SEDOL ID Final Maturity
Security CUSIP ID Reset DateSecurity ISIN ID YieldSecurity QUICK IDMarket Value QuantityCurrencyExclusive FeeSecurities Lending Fee/ PremiumRebate RateLoan IndemnificationCollateral TypeRequired Margin