Embed Size (px)
Citation preview
NREL is a national laboratory of the U.S. Department of Energy Office of Energy Efficiency & Renewable Energy Operated by the Alliance for Sustainable Energy, LLC
This report is available at no cost from the National Renewable Energy Laboratory (NREL) at www.nrel.gov/publications.
Contract No. DE-AC36-08GO28308
A Physics-Based GOES Satellite Product for Use in NREL’s National Solar Radiation Database Preprint M. Sengupta, A. Habte, P. Gotseff, A. Weekley, and A. Lopez National Renewable Energy Laboratory
C. Molling University of Wisconsin
A. Heidinger National Oceanic Atmospheric Administration
To be presented at Solar 2014 San Francisco, California July 6–10, 2014
Conference Paper NREL/CP-5D00-62237 July 2014
NOTICE
The submitted manuscript has been offered by an employee of the Alliance for Sustainable Energy, LLC (Alliance), a contractor of the US Government under Contract No. DE-AC36-08GO28308. Accordingly, the US Government and Alliance retain a nonexclusive royalty-free license to publish or reproduce the published form of this contribution, or allow others to do so, for US Government purposes.
This report was prepared as an account of work sponsored by an agency of the United States government. Neither the United States government nor any agency thereof, nor any of their employees, makes any warranty, express or implied, or assumes any legal liability or responsibility for the accuracy, completeness, or usefulness of any information, apparatus, product, or process disclosed, or represents that its use would not infringe privately owned rights. Reference herein to any specific commercial product, process, or service by trade name, trademark, manufacturer, or otherwise does not necessarily constitute or imply its endorsement, recommendation, or favoring by the United States government or any agency thereof. The views and opinions of authors expressed herein do not necessarily state or reflect those of the United States government or any agency thereof.
This report is available at no cost from the National Renewable Energy Laboratory (NREL) at www.nrel.gov/publications.
Available electronically at http://www.osti.gov/scitech
Available for a processing fee to U.S. Department of Energy and its contractors, in paper, from:
U.S. Department of Energy Office of Scientific and Technical Information P.O. Box 62 Oak Ridge, TN 37831-0062 phone: 865.576.8401 fax: 865.576.5728 email: mailto:[email protected]
Available for sale to the public, in paper, from:
U.S. Department of Commerce National Technical Information Service 5285 Port Royal Road Springfield, VA 22161 phone: 800.553.6847 fax: 703.605.6900 email: [email protected] online ordering: http://www.ntis.gov/help/ordermethods.aspx
Cover Photos: (left to right) photo by Pat Corkery, NREL 16416, photo from SunEdison, NREL 17423, photo by Pat Corkery, NREL 16560, photo by Dennis Schroeder, NREL 17613, photo by Dean Armstrong, NREL 17436, photo by Pat Corkery, NREL 17721.
A Physics-Based GOES Satellite Product for Use in NREL’s National Solar Radiation Database
Manajit Sengupta, Aron Habte, Peter Gotseff, Andrew Weekley, and Anthony Lopez
15013 Denver West Pkwy National Renewable Energy Laboratory
Golden, CO
Christine Molling University of Wisconsin
Andrew Heidinger
National Oceanic Atmospheric Administration
ABSTRACT The National Renewable Energy Laboratory (NREL), University of Wisconsin, and National Oceanic Atmospheric Administration are collaborating to investigate the integration of the Satellite Algorithm for Shortwave Radiation Budget (SASRAB) products into future versions of NREL’s 4-km by 4-km gridded National Solar Radiation Database (NSRDB). SASRAB product comparison with ground measurement sites revealed that the satellite-based surface radiation suffered from a significant low bias under clear-sky conditions. NREL researchers evaluated and ranked three reduced-order clear-sky radiative transfer algorithms that could be used to replace the current biased satellite-based clear-sky irradiance. These models use aerosol optical depth (AOD) and precipitable water vapor (PWV) as primary inputs. During initial model evaluation, surface measurements of AOD were used for model ranking, resulting in the selection of the spectral-based AOD Bird model [1] for production work. During final production, the selected model was fed satellite-based AOD and PWV, but during validation the model DNI output was found to be biased high due to underestimated satellite-derived AOD. For final implementation, a solution was found to incorporate an empirical weighting factor to the satellite AOD and apply it to the Modified MAC model: MMAC [3], a broadband AOD-based clear-sky model. Final validation showed improved clear-sky irradiance values when compared to surface measurements from the original SASRAB product.
Keywords: satellite solar resource data; National Solar Radiation Database; NSRDB; radiative transfer algorithms; clear-sky models; aerosol optical depth; AOD
1. INTRODUCTION Providing publicly accessible high-quality and long-term satellite-based solar resource data sets of the United States reduces barriers to solar grid penetration. Two widely used approaches derive solar resource from satellites: (a) an empirical approach that relates ground-based observations using satellite measurements and (b) a physics-based approach that considers the radiation received at the satellite and creates
retrievals to estimate clouds and surface radiation. Although empirical methods have been used traditionally for computing surface radiation, the advent of faster computing has made operational physical models viable. The Global Solar Insolation Project (GSIP) is an operational physical model from the National Oceanic Atmospheric Administration (NOAA) that computes global horizontal irradiance (GHI) using the visible and infrared channel measurements from the GOES satellites. GSIP uses a two-stage scheme that first retrieves cloud properties and then uses those properties in the Satellite Algorithm for Shortwave Radiation Budget (SASRAB) model to calculate surface radiation. The National Renewable Energy Laboratory (NREL), University of Wisconsin, and NOAA are collaborating to adapt GSIP to create a data set with high temporal, hourly, and spatial resolution that matches the GOES 4-km by 4-km image pixels. The product initially generates the cloud properties using the AVHRR Pathfinder Atmospheres-Extended (PATMOS-x) algorithms, whereas GHI and diffuse horizontal radiation (DHI) are calculated using SASRAB. A comparison to ground sites resulted in the finding that the satellite-based surface radiation suffered from a significant low bias under clear-sky conditions. To remove this bias, we evaluated reduced-order clear-sky radiative transfer algorithms that require aerosol optical depth (AOD) and precipitable water vapor (PWV) as primary inputs. Using surface-derived AOD and precipitable water as model inputs, new calculated irradiance showed significant improvement in the clear-sky radiation compared to surface measurements from the original SASRAB product. These models were used as a starting point to develop replacement clear-sky irradiance (direct normal irradiance, or DNI, and GHI) in the 1998 to 2012 SASRAB data set for eventual use in NREL’s future National Solar Radiation Database (NSRDB).
The remainder of this paper is organized as follows. Section 2 describes the initial clear-sky model performance and selection based on surface measurements. Section 3 describes the bias problem that is encountered when using the satellite-based AOD input to the clear-sky models along with the
1
This report is available at no cost from the National Renewable Energy Laboratory (NREL) at www.nrel.gov/publications.
resolution to implement an empirically trained weighted AOD. The last part of Section 3 presents final results that quantify the improvements in the satellite-based clear-sky irradiance estimates using MMAC compared to the original SASRAB product.
2. CLEAR-SKY MODEL PERFORMANCE Three clear-sky models [1], [2], [3] were converted from their original sources into a MATLAB script format and used for the initial performance evaluation. The relative improvement in performance of the three converted clear-sky models compared to the current SASRAB clear-sky algorithm was quantified using the seven continental NOAA SURFRAD ground measurement sites for an arbitrarily chosen validation year, 2009. These seven sites represent varying mid-latitude continental atmospheric sky conditions from the desert Southwest (Desert Rock, Nevada) to the high-humidity South (Goodwin Creek, Mississippi). NOAA also has nine Integrated Surface Irradiance Study (ISIS) measurement stations that are well distributed throughout the United States, but their use for initial performance evaluation was rejected because of a lack of ground-based AOD measurements required for clear-sky model input. 2.1 Surface Measurement Inputs The seven NOAA SURFRAD sites supplying broadband radiation (GHI and DNI) at 1-minute averaged intervals were used to quantify the clear-sky model performance. In addition, the colocated surface meteorological measurements (surface pressure, temperature, relative humidity, wind speed, and direction) as well as AOD measurements were used to create more accurate site-specific model inputs to the clear-sky models. This allowed us to evaluate the models with the best available surface data to determine local atmospheric conditions as model inputs. The SURFRAD GHI and DNI were preprocessed to align properly with the instantaneous GOES images (used as the original source of the SASRAB products) that are taken twice hourly at :00 and :30 past the hour for GOES West and at :15 and :45 past the hour for GOES East. That is, the 1-minute SURFRAD irradiance was 30-minute time-averaged on the center of the corresponding GOES image time stamp. AOD measurements were determined from the colocated Multi-Filter Rotating Shadowband Radiometer (MFRSR) [4]. Because each clear-sky model requires AOD at different wavelengths, the following approach was used for this analysis: The MFRSR measured spectral AOD wavelengths at 415 nm, 501 nm, 616 nm, 672 nm, and 868 nm. In addition, two clear-sky models used spectral-based AOD—the Bird model used AOD at 380 nm and 500 nm, and REST2 used the Angstrom turbidity coefficient α and Angstrom wavelength exponent, β, to describe atmospheric turbidity. Finally,
MMAC used broadband AOD (BAOD). For this analysis, the Angstrom turbidity values were calculated for the REST2 model, and using those values, the spectral AOD for Bird and BAOD for MMAC were back calculated to ensure that all AODs were internally consistent and described the same atmospheric turbidity conditions. For the spectral-based models (Bird and REST2), this was performed in the following manner:
In general, AOD is generally a smooth extinction function dependent on wavelength. 𝜏(𝜆) = 𝛽𝜆−𝛼 (1) The natural log of each side can be taken, resulting in ln(𝜏𝜆) = ln(𝛽)− 𝛼 ∙ ln(𝜆) (2) This equation has the form of a linear equation for λ measured in microns. In a stable atmosphere, this results in a straight line with an intercept of β = τ (λ = 1 μm) and slope α. α and β are then determined using the linear fit of MFRSR spectral AOD data to Equation (2). Thus, the AOD at any specified wavelength can be calculated from Equation (1). The MMAC model AOD is slightly different because it is based on BAOD. Here, BAOD was computed using (1), but an effective wavelength, λeff, was used that is based on an empirical relationship that is a function of AOD at 700 nm and relative air mass [5]. This compensated for the nonlinear spectral shift in BAOD with air mass. Additionally, colocated SURFRAD temperature and relative humidity were used to determine the PWV based on a method by Gueymard [6]. This data was preprocessed on the same time scale as the irradiance data to coincide with the satellite image. 2.2 Satellite Measurement Inputs The GOES-based PATMOS-x/SASRAB product makes more than 50 measured atmospheric parameters available in self-contained Hierarchical Data Format files. However, for this analysis, only the calculated insolation (GHI), insulation_diffuse (DHI), and cloud_type were used. Further, this analysis was restricted to clear skies as determined by SASRAB. This is equivalent to satellite image pixels in which cloud_type is identified as “0.” The nearest GOES East or GOES West satellite pixel corresponding to a SURFRAD location was used to extract the calculated insolation and cloud type for analysis. The satellite cloud_type was the primary filter for identifying clear skies with a secondary requirement that the satellite reported zenith angle is less than 85 degrees. This threshold
2
This report is available at no cost from the National Renewable Energy Laboratory (NREL) at www.nrel.gov/publications.
was intended to eliminate the highest zenith angles (sunrise and sunset). The times of all half-hour SASRAB data that passed these criteria were then intersected with the corresponding half-hour averaged SURFRAD data for subsequent processing of the 2009 analysis year. 2.3 Initial Model Comparison
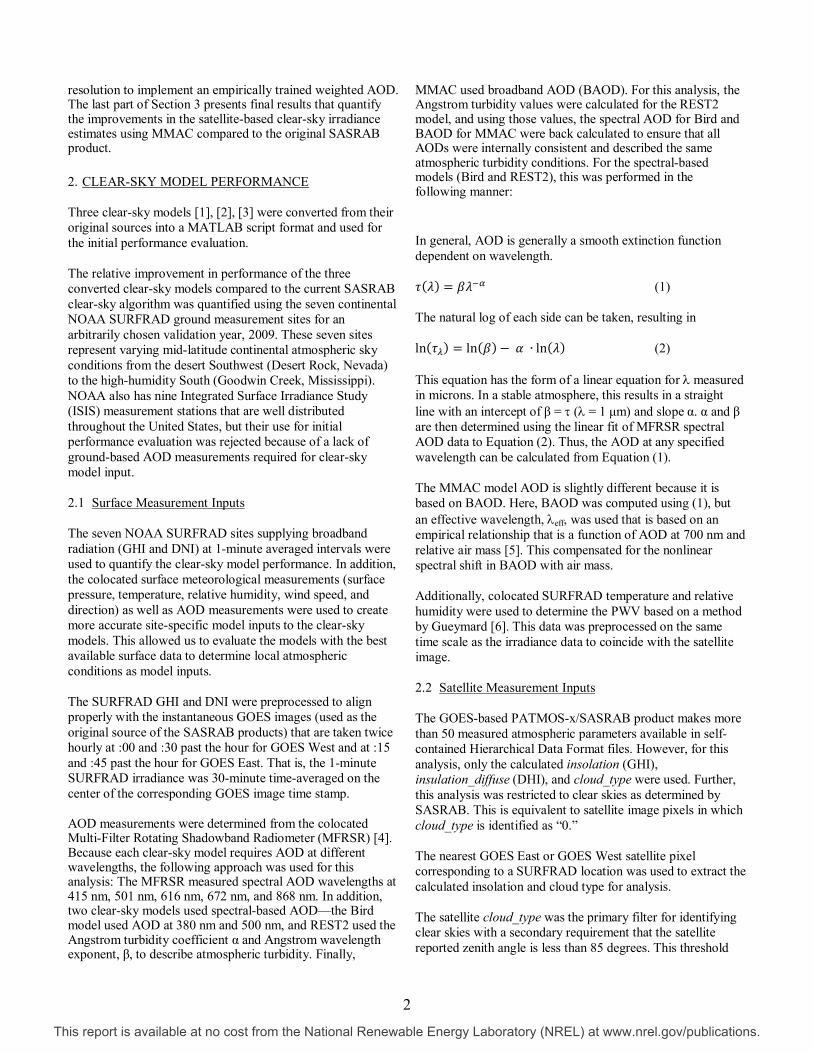
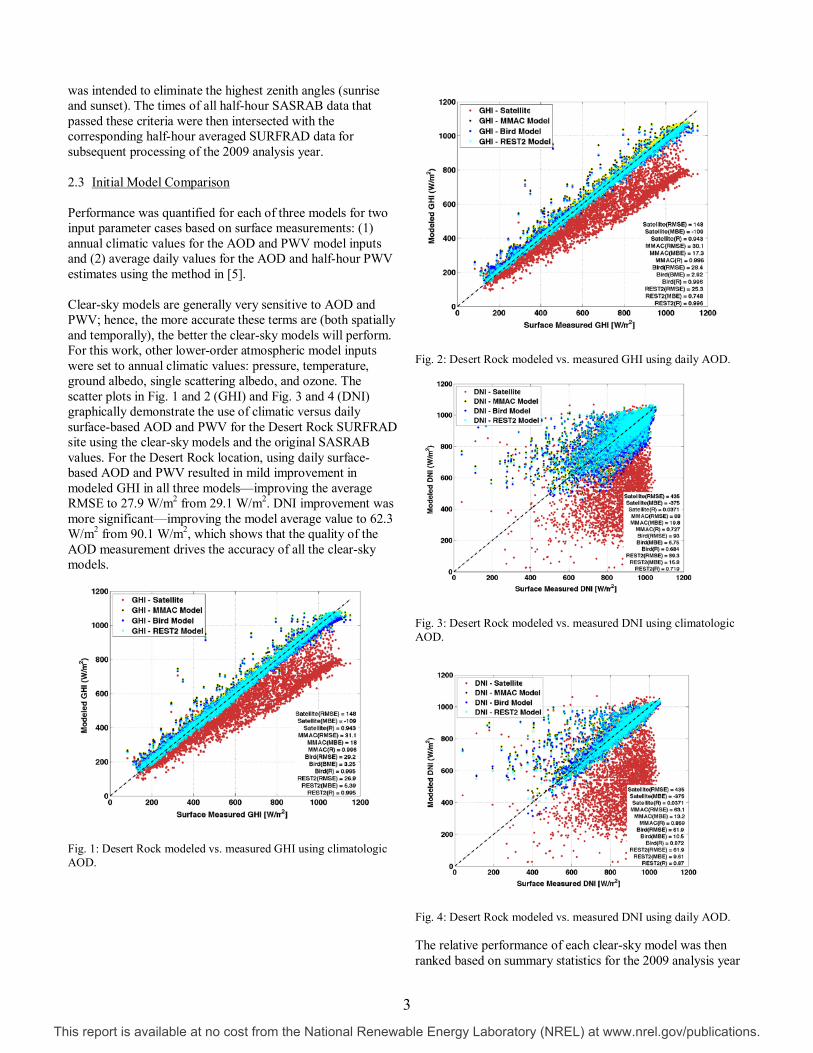
Performance was quantified for each of three models for two input parameter cases based on surface measurements: (1) annual climatic values for the AOD and PWV model inputs and (2) average daily values for the AOD and half-hour PWV estimates using the method in [5]. Clear-sky models are generally very sensitive to AOD and PWV; hence, the more accurate these terms are (both spatially and temporally), the better the clear-sky models will perform. For this work, other lower-order atmospheric model inputs were set to annual climatic values: pressure, temperature, ground albedo, single scattering albedo, and ozone. The scatter plots in Fig. 1 and 2 (GHI) and Fig. 3 and 4 (DNI) graphically demonstrate the use of climatic versus daily surface-based AOD and PWV for the Desert Rock SURFRAD site using the clear-sky models and the original SASRAB values. For the Desert Rock location, using daily surface-based AOD and PWV resulted in mild improvement in modeled GHI in all three models—improving the average RMSE to 27.9 W/m2 from 29.1 W/m2. DNI improvement was more significant—improving the model average value to 62.3 W/m2 from 90.1 W/m2, which shows that the quality of the AOD measurement drives the accuracy of all the clear-sky models.
Fig. 1: Desert Rock modeled vs. measured GHI using climatologic AOD.
Fig. 2: Desert Rock modeled vs. measured GHI using daily AOD.
Fig. 3: Desert Rock modeled vs. measured DNI using climatologic AOD.
Fig. 4: Desert Rock modeled vs. measured DNI using daily AOD.
The relative performance of each clear-sky model was then ranked based on summary statistics for the 2009 analysis year
3
This report is available at no cost from the National Renewable Energy Laboratory (NREL) at www.nrel.gov/publications.
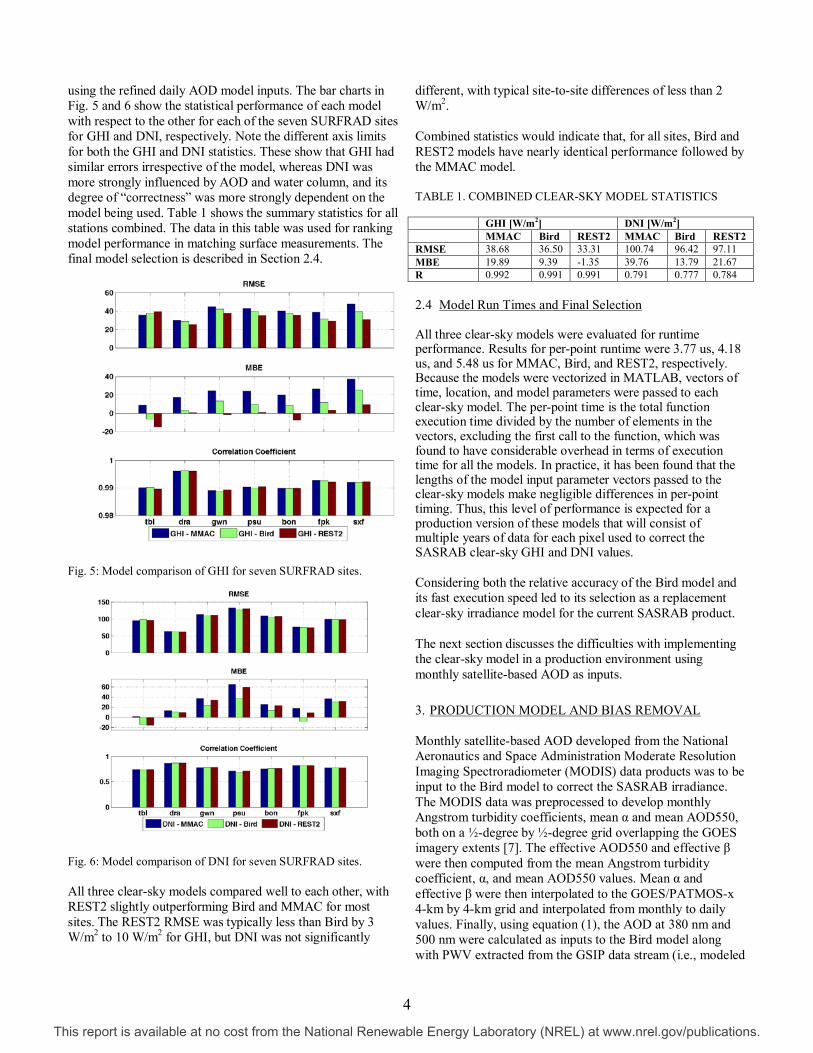
using the refined daily AOD model inputs. The bar charts in Fig. 5 and 6 show the statistical performance of each model with respect to the other for each of the seven SURFRAD sites for GHI and DNI, respectively. Note the different axis limits for both the GHI and DNI statistics. These show that GHI had similar errors irrespective of the model, whereas DNI was more strongly influenced by AOD and water column, and its degree of “correctness” was more strongly dependent on the model being used. Table 1 shows the summary statistics for all stations combined. The data in this table was used for ranking model performance in matching surface measurements. The final model selection is described in Section 2.4.
Fig. 5: Model comparison of GHI for seven SURFRAD sites.
Fig. 6: Model comparison of DNI for seven SURFRAD sites. All three clear-sky models compared well to each other, with REST2 slightly outperforming Bird and MMAC for most sites. The REST2 RMSE was typically less than Bird by 3 W/m2 to 10 W/m2 for GHI, but DNI was not significantly
different, with typical site-to-site differences of less than 2 W/m2. Combined statistics would indicate that, for all sites, Bird and REST2 models have nearly identical performance followed by the MMAC model. TABLE 1. COMBINED CLEAR-SKY MODEL STATISTICS
GHI [W/m2] DNI [W/m2] MMAC Bird REST2 MMAC Bird REST2 RMSE 38.68 36.50 33.31 100.74 96.42 97.11 MBE 19.89 9.39 -1.35 39.76 13.79 21.67 R 0.992 0.991 0.991 0.791 0.777 0.784 2.4 Model Run Times and Final Selection All three clear-sky models were evaluated for runtime performance. Results for per-point runtime were 3.77 us, 4.18 us, and 5.48 us for MMAC, Bird, and REST2, respectively. Because the models were vectorized in MATLAB, vectors of time, location, and model parameters were passed to each clear-sky model. The per-point time is the total function execution time divided by the number of elements in the vectors, excluding the first call to the function, which was found to have considerable overhead in terms of execution time for all the models. In practice, it has been found that the lengths of the model input parameter vectors passed to the clear-sky models make negligible differences in per-point timing. Thus, this level of performance is expected for a production version of these models that will consist of multiple years of data for each pixel used to correct the SASRAB clear-sky GHI and DNI values. Considering both the relative accuracy of the Bird model and its fast execution speed led to its selection as a replacement clear-sky irradiance model for the current SASRAB product. The next section discusses the difficulties with implementing the clear-sky model in a production environment using monthly satellite-based AOD as inputs. 3. PRODUCTION MODEL AND BIAS REMOVAL Monthly satellite-based AOD developed from the National Aeronautics and Space Administration Moderate Resolution Imaging Spectroradiometer (MODIS) data products was to be input to the Bird model to correct the SASRAB irradiance. The MODIS data was preprocessed to develop monthly Angstrom turbidity coefficients, mean α and mean AOD550, both on a ½-degree by ½-degree grid overlapping the GOES imagery extents [7]. The effective AOD550 and effective β were then computed from the mean Angstrom turbidity coefficient, α, and mean AOD550 values. Mean α and effective β were then interpolated to the GOES/PATMOS-x 4-km by 4-km grid and interpolated from monthly to daily values. Finally, using equation (1), the AOD at 380 nm and 500 nm were calculated as inputs to the Bird model along with PWV extracted from the GSIP data stream (i.e., modeled
4
This report is available at no cost from the National Renewable Energy Laboratory (NREL) at www.nrel.gov/publications.
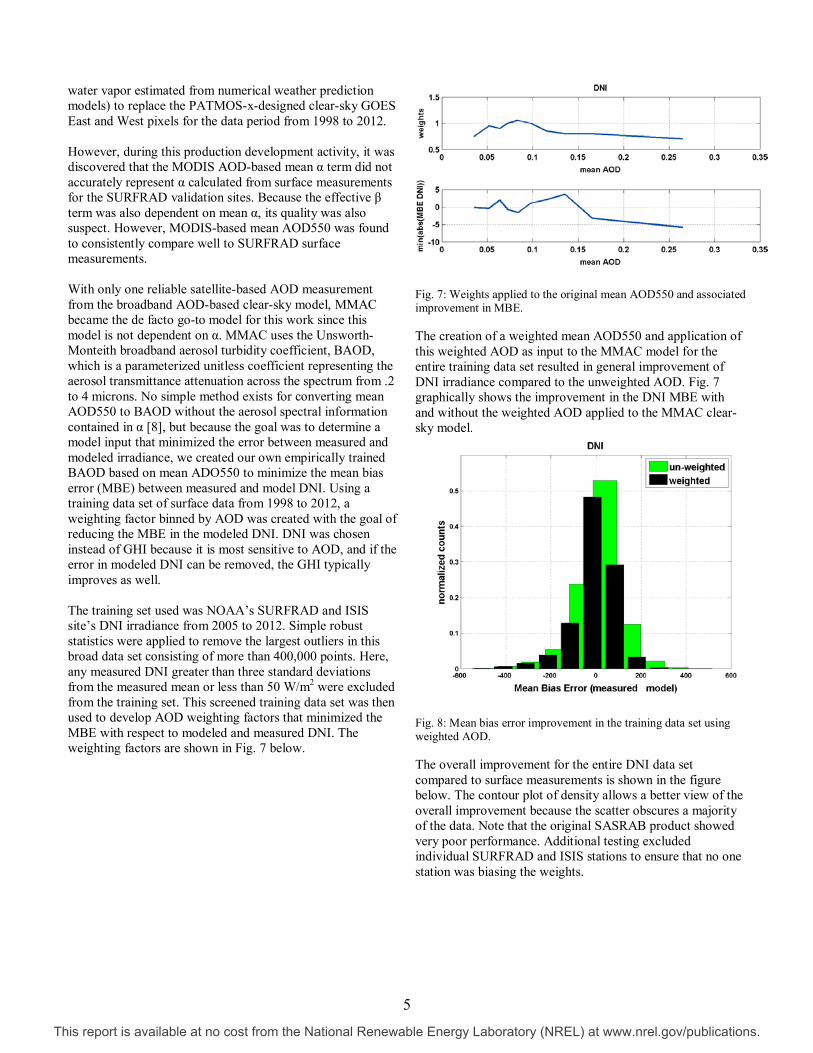
water vapor estimated from numerical weather prediction models) to replace the PATMOS-x-designed clear-sky GOES East and West pixels for the data period from 1998 to 2012. However, during this production development activity, it was discovered that the MODIS AOD-based mean α term did not accurately represent α calculated from surface measurements for the SURFRAD validation sites. Because the effective β term was also dependent on mean α, its quality was also suspect. However, MODIS-based mean AOD550 was found to consistently compare well to SURFRAD surface measurements. With only one reliable satellite-based AOD measurement from the broadband AOD-based clear-sky model, MMAC became the de facto go-to model for this work since this model is not dependent on α. MMAC uses the Unsworth-Monteith broadband aerosol turbidity coefficient, BAOD, which is a parameterized unitless coefficient representing the aerosol transmittance attenuation across the spectrum from .2 to 4 microns. No simple method exists for converting mean AOD550 to BAOD without the aerosol spectral information contained in α [8], but because the goal was to determine a model input that minimized the error between measured and modeled irradiance, we created our own empirically trained BAOD based on mean ADO550 to minimize the mean bias error (MBE) between measured and model DNI. Using a training data set of surface data from 1998 to 2012, a weighting factor binned by AOD was created with the goal of reducing the MBE in the modeled DNI. DNI was chosen instead of GHI because it is most sensitive to AOD, and if the error in modeled DNI can be removed, the GHI typically improves as well. The training set used was NOAA’s SURFRAD and ISIS site’s DNI irradiance from 2005 to 2012. Simple robust statistics were applied to remove the largest outliers in this broad data set consisting of more than 400,000 points. Here, any measured DNI greater than three standard deviations from the measured mean or less than 50 W/m2 were excluded from the training set. This screened training data set was then used to develop AOD weighting factors that minimized the MBE with respect to modeled and measured DNI. The weighting factors are shown in Fig. 7 below.
Fig. 7: Weights applied to the original mean AOD550 and associated improvement in MBE.
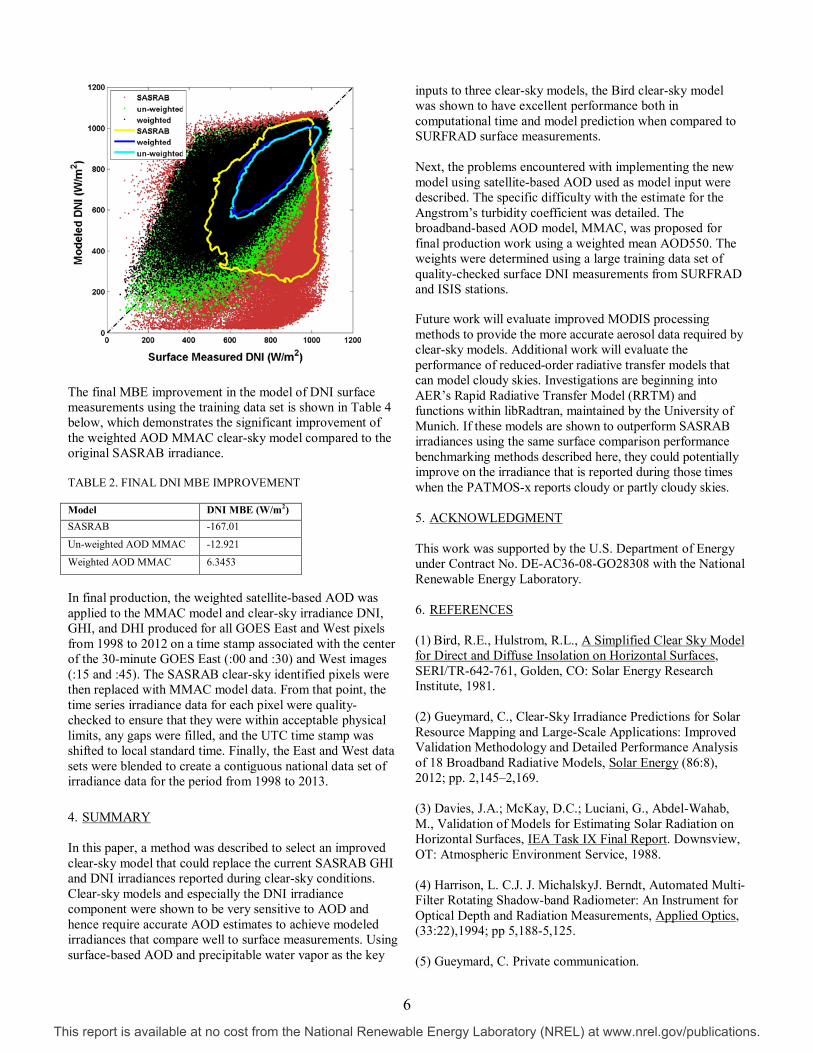
The creation of a weighted mean AOD550 and application of this weighted AOD as input to the MMAC model for the entire training data set resulted in general improvement of DNI irradiance compared to the unweighted AOD. Fig. 7 graphically shows the improvement in the DNI MBE with and without the weighted AOD applied to the MMAC clear-sky model.
Fig. 8: Mean bias error improvement in the training data set using weighted AOD.
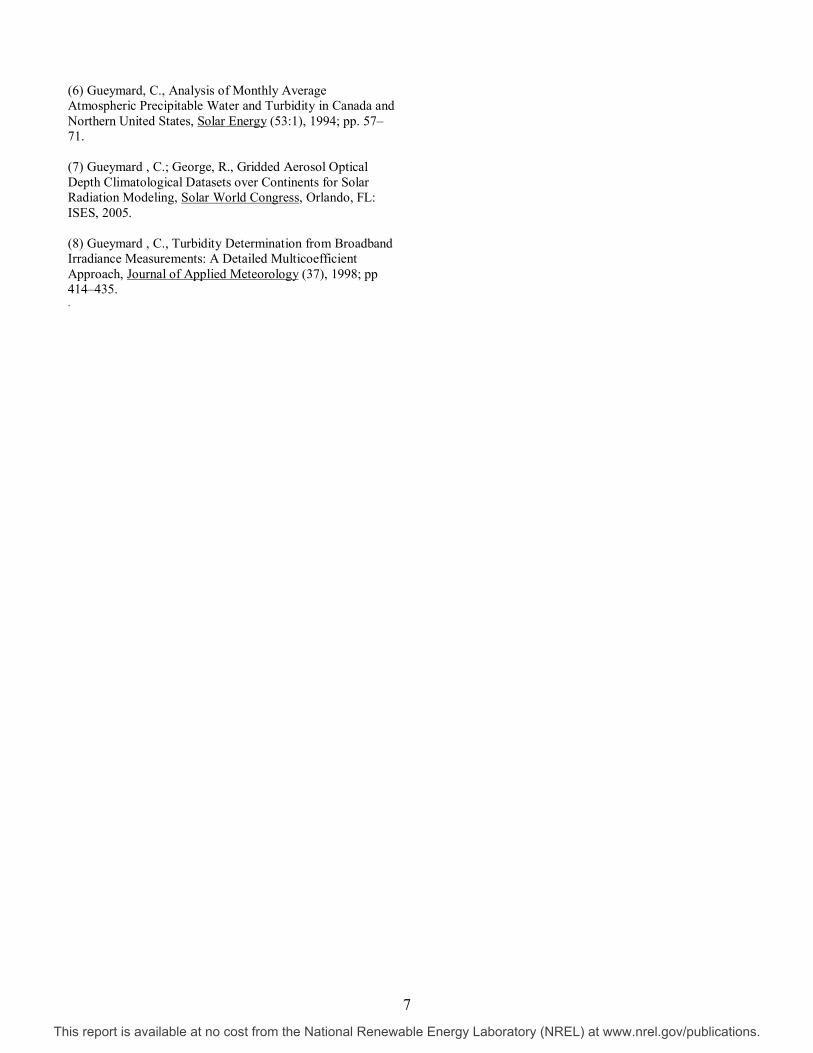
The overall improvement for the entire DNI data set compared to surface measurements is shown in the figure below. The contour plot of density allows a better view of the overall improvement because the scatter obscures a majority of the data. Note that the original SASRAB product showed very poor performance. Additional testing excluded individual SURFRAD and ISIS stations to ensure that no one station was biasing the weights.
5
This report is available at no cost from the National Renewable Energy Laboratory (NREL) at www.nrel.gov/publications.
The final MBE improvement in the model of DNI surface measurements using the training data set is shown in Table 4 below, which demonstrates the significant improvement of the weighted AOD MMAC clear-sky model compared to the original SASRAB irradiance. TABLE 2. FINAL DNI MBE IMPROVEMENT
Model DNI MBE (W/m2) SASRAB -167.01
Un-weighted AOD MMAC -12.921
Weighted AOD MMAC 6.3453
In final production, the weighted satellite-based AOD was applied to the MMAC model and clear-sky irradiance DNI, GHI, and DHI produced for all GOES East and West pixels from 1998 to 2012 on a time stamp associated with the center of the 30-minute GOES East (:00 and :30) and West images (:15 and :45). The SASRAB clear-sky identified pixels were then replaced with MMAC model data. From that point, the time series irradiance data for each pixel were quality-checked to ensure that they were within acceptable physical limits, any gaps were filled, and the UTC time stamp was shifted to local standard time. Finally, the East and West data sets were blended to create a contiguous national data set of irradiance data for the period from 1998 to 2013. 4. SUMMARY In this paper, a method was described to select an improved clear-sky model that could replace the current SASRAB GHI and DNI irradiances reported during clear-sky conditions. Clear-sky models and especially the DNI irradiance component were shown to be very sensitive to AOD and hence require accurate AOD estimates to achieve modeled irradiances that compare well to surface measurements. Using surface-based AOD and precipitable water vapor as the key
inputs to three clear-sky models, the Bird clear-sky model was shown to have excellent performance both in computational time and model prediction when compared to SURFRAD surface measurements. Next, the problems encountered with implementing the new model using satellite-based AOD used as model input were described. The specific difficulty with the estimate for the Angstrom’s turbidity coefficient was detailed. The broadband-based AOD model, MMAC, was proposed for final production work using a weighted mean AOD550. The weights were determined using a large training data set of quality-checked surface DNI measurements from SURFRAD and ISIS stations. Future work will evaluate improved MODIS processing methods to provide the more accurate aerosol data required by clear-sky models. Additional work will evaluate the performance of reduced-order radiative transfer models that can model cloudy skies. Investigations are beginning into AER’s Rapid Radiative Transfer Model (RRTM) and functions within libRadtran, maintained by the University of Munich. If these models are shown to outperform SASRAB irradiances using the same surface comparison performance benchmarking methods described here, they could potentially improve on the irradiance that is reported during those times when the PATMOS-x reports cloudy or partly cloudy skies. 5. ACKNOWLEDGMENT This work was supported by the U.S. Department of Energy under Contract No. DE-AC36-08-GO28308 with the National Renewable Energy Laboratory. 6. REFERENCES (1) Bird, R.E., Hulstrom, R.L., A Simplified Clear Sky Model for Direct and Diffuse Insolation on Horizontal Surfaces, SERI/TR-642-761, Golden, CO: Solar Energy Research Institute, 1981. (2) Gueymard, C., Clear-Sky Irradiance Predictions for Solar Resource Mapping and Large-Scale Applications: Improved Validation Methodology and Detailed Performance Analysis of 18 Broadband Radiative Models, Solar Energy (86:8), 2012; pp. 2,145–2,169. (3) Davies, J.A.; McKay, D.C.; Luciani, G., Abdel-Wahab, M., Validation of Models for Estimating Solar Radiation on Horizontal Surfaces, IEA Task IX Final Report. Downsview, OT: Atmospheric Environment Service, 1988. (4) Harrison, L. C.J. J. MichalskyJ. Berndt, Automated Multi-Filter Rotating Shadow-band Radiometer: An Instrument for Optical Depth and Radiation Measurements, Applied Optics, (33:22),1994; pp 5,188-5,125. (5) Gueymard, C. Private communication.
6
This report is available at no cost from the National Renewable Energy Laboratory (NREL) at www.nrel.gov/publications.
(6) Gueymard, C., Analysis of Monthly Average Atmospheric Precipitable Water and Turbidity in Canada and Northern United States, Solar Energy (53:1), 1994; pp. 57–71. (7) Gueymard , C.; George, R., Gridded Aerosol Optical Depth Climatological Datasets over Continents for Solar Radiation Modeling, Solar World Congress, Orlando, FL: ISES, 2005. (8) Gueymard , C., Turbidity Determination from Broadband Irradiance Measurements: A Detailed Multicoefficient Approach, Journal of Applied Meteorology (37), 1998; pp 414–435. .
7
This report is available at no cost from the National Renewable Energy Laboratory (NREL) at www.nrel.gov/publications.