Embed Size (px)
Citation preview
A Physical Map of the Escherichia coli K12 GenomeAuthor(s): Cassandra L. Smith, Jason G. Econome, Andrew Schutt, Stephanie Klco, Charles R.CantorSource: Science, New Series, Vol. 236, No. 4807 (Jun. 12, 1987), pp. 1448-1453Published by: American Association for the Advancement of ScienceStable URL: http://www.jstor.org/stable/1699706Accessed: 21/05/2010 16:36
Your use of the JSTOR archive indicates your acceptance of JSTOR's Terms and Conditions of Use, available athttp://www.jstor.org/page/info/about/policies/terms.jsp. JSTOR's Terms and Conditions of Use provides, in part, that unlessyou have obtained prior permission, you may not download an entire issue of a journal or multiple copies of articles, and youmay use content in the JSTOR archive only for your personal, non-commercial use.
Please contact the publisher regarding any further use of this work. Publisher contact information may be obtained athttp://www.jstor.org/action/showPublisher?publisherCode=aaas.
Each copy of any part of a JSTOR transmission must contain the same copyright notice that appears on the screen or printedpage of such transmission.
JSTOR is a not-for-profit service that helps scholars, researchers, and students discover, use, and build upon a wide range ofcontent in a trusted digital archive. We use information technology and tools to increase productivity and facilitate new formsof scholarship. For more information about JSTOR, please contact [email protected].
American Association for the Advancement of Science is collaborating with JSTOR to digitize, preserve andextend access to Science.
http://www.jstor.org
A Physical Map of the Escherichia coli 1(12 Genome
CASSANDRA L. SMITH, JASON G. ECONOME, ANDREW SCHUYr, STEPHANIE KLCO, CHARLES R. CANTOR
A physical map of a genome is the structure of its DNA. Construction of such a map is a first step in the complete characterization of that DNA. The restriction endonucle- ase Not I cuts the genome of Escherichia coli K12 into 22 DNA fragments ranging from 20 kilobases (20,000 base pairs) to 1000 kilobases. These can be separated by pulsed field gel electrophoresis. The order of the fragments in the genome was determined from available E. coli genetic information and analysis of partial digest patterns. The resulting ordered set of fragments is a macrorestriction map. This map facilitates genetic and molecular studies on E. coli, and its construction serves as a model for further endeavors on larger genomes.
R ECENT DEVELOPMENTS IN THE PREPARATION AND SEPA- ration of large DNA fragments have made it possible to devise relatively simple schemes to map the DNA structure
of entire genomes (1). The new techniques include preparation of unbroken genomic DNA by embedding cells in agarose, fragmenta- tion of genomic DNA into specific large pieces by in situ digestion in agarose, with restriction endonucleases that recognize very rare cutting sites, high resolution size separation of the resulting DNA fragments by pulsed field gel electrophoresis (PFG), and develop- ment of accurate size standards for large DNA fragments (2-6). A natural target for the application of these methods is the single circular chromosomal DNA of Escherichta coli since this organism has been the prototype for so many genetic and molecular biological studies. Using these methods, we have determined a macrorestric- tion map of the entire genome of E. coli. We have also demonstrated how this map will be useful for subsequent genetic and molecular biological studies. The methods developed are generally useful even for those organisms for which little or no genetics or molecular biology is now known.
Cleavage of E. coli DNA into large pieces. The size of the E. coli genome has been estimated by various methods at 3.0 to 4.7 megabase pairs (Mb) (7, 8). Intact E. coli chromosomal DNA does not migrate in agarose gels under the conditions used, presumably because of its circular topology; linear molecules in this size range, however, are readily amenable to PFG separation (9). The optimal size range for PFG fractionation of DNA lies between 50 kb and 1500 kb (6). Our goal was to find a way to cut the E. coli genome into pieces in this size range and then determine the order of these pieces. The smaller the number of fragments generated, the easier the task would be.
We isolated intact E. coli chromosomal DNA (3, 6) and screened a number of different restriction enzymes to see which would cut the
DNA into a convenient number of large fragments (Fig. 1). As expected, enzymes with six base recognition sites produced frag- ments that were almost all smaller than 50 kb. In spite of the few exceptions, like Xho I, which yielded a number of DNA pieces in the 50- to 200-kb size range, the general conclusion was that these enzymes cut the genome too frequently to be useful for initial PFG analysis. However, the two restriction enzymes available with eight base recognition sequences, Not I and Sfi I, produced a range of DNA fragments from 15 kb to more than,500 kb.
The size of these fragments was determined by PFG analysis at various pulse times that were chosen to expand portions of the molecular size range for optimal resolution. Under appropriate conditions, most fragments could be isolated as individual electro- phoretic bands showing the expected monotonic increase in ethidi- um bromide staining intensity with molecular size. In selected cases, quantitative densitometry was used to confirm occasional bands that were multiplets. In other cases, comparison of different E. coli strains allowed the degeneracy of bands with multiple fragments to be resolved. The sizes of the Not I and Sfi I fragments for the E. colt K12 (X+, F+) wild-type strain, EMG2 (E. coli Genetic Stock Center Number CGSC 4401) are given in Table 1. The molecular size of the E. coli genome can be determined unambiguously by adding the sizes of all the fragments. The agreement between the genorne size separately determined from Not I and Sfi I digests is excellent and establishes 4.7 Mb as the best measurement to date of the true size oftheE. coli K12 (X +, F+) genome. When the size of lambda phage and F+ plasmid are subtracted, the size of the unperturbed E. coli circular chromosome would be 0.15 Mb smaller.
After some initial studies, three strains were chosen for further characterization of the Not I restriction fragments. Strain EMG2 (10) was selected as the reference strain for restriction mapping. It is a well-characterized E. coli K12 wild-type strain, containing lambda prophage and carrying an F+ plasmid. Strain MC1009 (11) was chosen because a number of its Not I bands are particularly well resolved. It is mostly K12 but has some E. coli B DNA, is missing F+ plasmid, and lambda phage, has a 30-kb deletion including the lacZ operon, and another small deletion in the ara-leu region. The third strain used was W3110 (12). It is a K12 strain closely related to EMG2, missing F+ plasmid and lambda phage, and frequently used as a laboratory wild type but, in fact, carrying an inversion of about a quarter of the E. coli chromosome between rrnD and n-zE. The Not I digest of these three strains is compared in Fig. 2. While most fragments are the same, a number of major differences are apparent, and some of these differences have assisted us in construct- ing and confirming the Not I restriction map of EMG2.
The authors are in the Department of Genetics and Development at the College of Physicians and Surgeons, Columbia University, New York, NY 10032.
1448 SCIENCE, VOL. 236
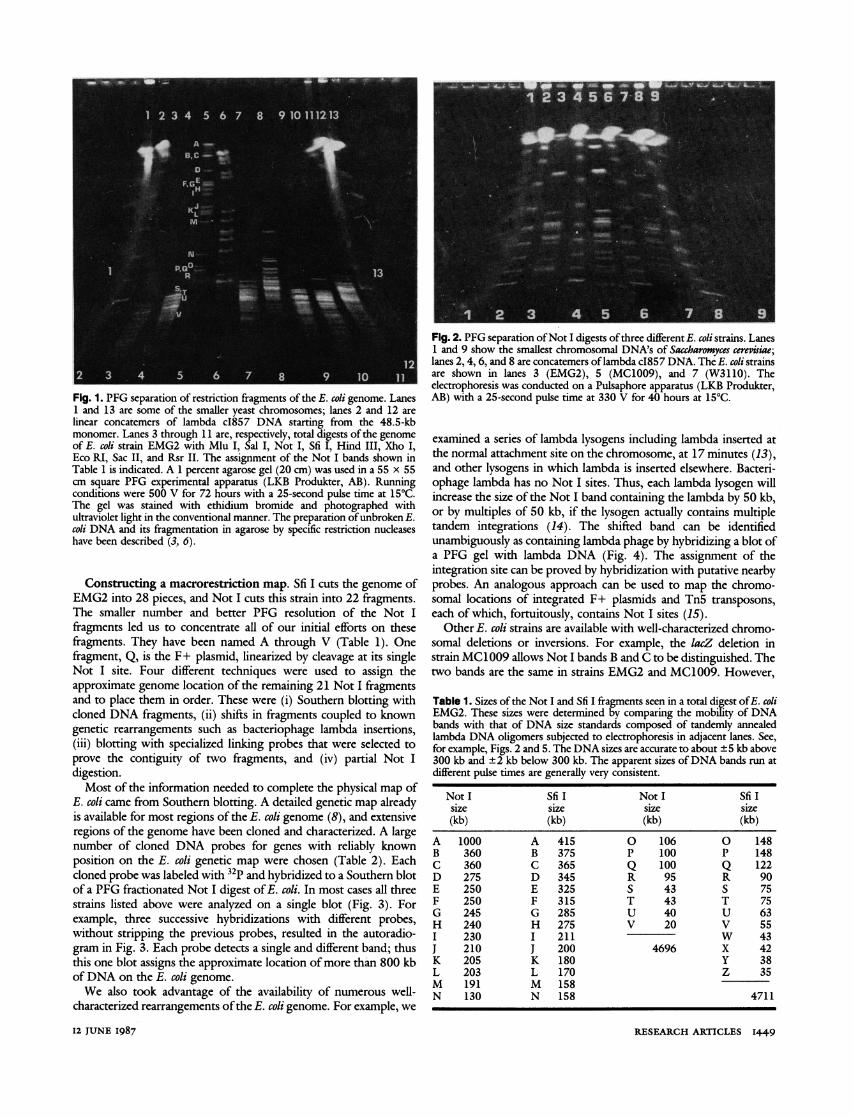
Fig. 1. PFG separation of restriction fragments of the E. coli genome. Lanes 1 and 13 are some of the smaller yeast chromosomes; lanes 2 and 12 are linear concatemers of lambda cI857 DNA starting from the 48.5-kb monomer. Lanes 3 through 11 are, respectively, total digests of the genome of E. coli strain EMG2 with Mlu I, Sal I, Not I, Sfi I, Hind III, Xho I, Eco RI, Sac II, and Rsr II. The assignment of the Not I bands shown in Table 1 is indicated. A 1 percent agarose gel (20 cm) was used in a 55 x 55 cm square PFG experimental apparatus (LKB Produkter, AB). Running conditions were 500 V for 72 hours with a 25-second pulse time at 15?C. The gel was stained with ethidium bromide and photographed with ultraviolet light in the conventional manner. The preparation of unbroken E. coli DNA and its fragmentation in agarose by specific restriction nucleases have been described (3, 6).
Fig. 2. PFG separation of Not I digests of three different E. coli strains. Lanes 1 and 9 show the smallest chromosomal DNA's of Saccharomyces cerevsiae; lanes 2, 4, 6, and 8 are concatemers of lambda cI857 DNA. The E. coli strains are shown in lanes 3 (EMG2), 5 (MC1009), and 7 (W3110). The electrophoresis was conducted on a Pulsaphore apparatus (LKB Produkter, AB) with a 25-second pulse time at 330 V for 40 hours at 15?C.
Constructing a macrorestriction map. Sfi I cuts the genome of EMG2 into 28 pieces, and Not I cuts this strain into 22 fragments. The smaller number and better PFG resolution of the Not I fragments led us to concentrate all of our initial efforts on these fragments. They have been named A through V (Table 1). One fragment, Q, is the F+ plasmid, linearized by cleavage at its single Not I site. Four different techniques were used to assign the approximate genome location of the remaining 21 Not I fragments and to place them in order. These were (i) Southern blotting with cloned DNA fragments, (ii) shifts in fragments coupled to known genetic rearrangements such as bacteriophage lambda insertions, (iii) blotting with specialized linking probes that were selected to prove the contiguity of two fragments, and (iv) partial Not I digestion.
Most of the information needed to complete the physical map of E. coli came from Southern blotting. A detailed genetic map already is available for most regions of the E. coli genome (8), and extensive regions of the genome have been cloned and characterized. A large number of cloned DNA probes for genes with reliably known position on the E. coli genetic map were chosen (Table 2). Each cloned probe was labeled with 32P and hybridized to a Southern blot of a PFG fractionated Not I digest of E. coli. In most cases all three strains listed above were analyzed on a single blot (Fig. 3). For example, three successive hybridizations with different probes, without stripping the previous probes, resulted in the autoradio- gram in Fig. 3. Each probe detects a single and different band; thus this one blot assigns the approximate location of more than 800 kb of DNA on the E. coli genome.
We also took advantage of the availability of numerous well- characterized rearrangements of the E. coli genome. For example, we
examined a series of lambda lysogens including lambda inserted at the normal attachment site on the chromosome, at 17 minutes (13), and other lysogens in which lambda is inserted elsewhere. Bacteri- ophage lambda has no Not I sites. Thus, each lambda lysogen will increase the size of the Not I band containing the lambda by 50 kb, or by multiples of 50 kb, if the lysogen actually contains multiple tandem integrations (14). The shifted band can be identified unambiguously as containing lambda phage by hybridizing a blot of a PFG gel with lambda DNA (Fig. 4). The assignment of the integration site can be proved by hybridization with putative nearby probes. An analogous approach can be used to map the chromo- somal locations of integrated F+ plasmids and Tn5 transposons, each of which, fortuitously, contains Not I sites (15).
Other E. coli strains are available with well-characterized chromo- somal deletions or inversions. For example, the lacZ deletion in strain MC1009 allows Not I bands B and C to be distinguished. The two bands are the same in strains EMG2 and MCLOO9. However,
Table 1. Sizes of the Not I and Sfi I fragments seen in a total digest of E. coli EMG2. These sizes were determined by comparing the mobility of DNA bands with that of DNA size standards composed of tandemly annealed lambda DNA oligomers subjected to electrophoresis in adjacent lanes. See, for example, Figs. 2 and 5. The DNA sizes are accurate to about ?5 kb above 300 kb and ?2 kb below 300 kb. The apparent sizes of DNA bands run at different pulse times are generally very consistent.
NotI SfiI NotI Sfi I size size size size (kb) (kb) (kb) (kb)
A 1000 A 415 0 106 0 148 B 360 B 375 P 100 P 148 C 360 C 365 Q 100 Q 122 D 275 D 345 R 95 R 90 E 250 E 325 S 43 S 75 F 250 F 315 T 43 T 75 G 245 G 285 U 40 U 63 H 240 H 275 V 20 V 55 I 230 I 211 W 43 J 210 J 200 4696 X 42 K 205 K 180 Y 38 L 203 L 170 Z 35 M 191 M 158 N 130 N 158 4711
12 JUNE I987 RESEARCH ARTICLES I449
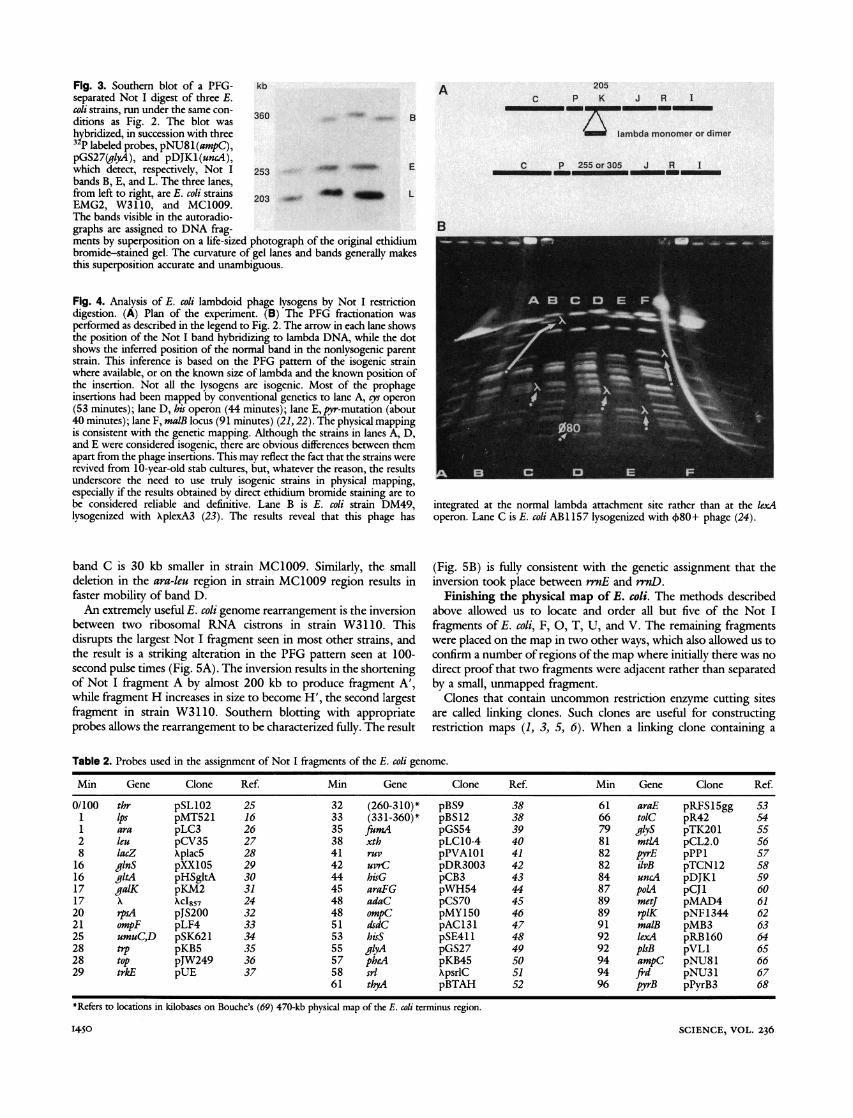
Fig. 3. Southern blot of a PFG- kb A 205 separated Not I digest of three E. C P K J R I coli strains, run under the same con- 360 ditions as Fig. 2. The blot was B hybridized, in succession with three ' lambda monomer or dimer 32P labeled probes, pNU81(ampC), pGS27(gljA), and pDJKl(uncA), C..25...... which detect, respectively, Not I 253 -.. ... E ... bands B, E, and L. The three lanes, from left to right, are E. coli strains 203 _ d L EMG2, W3110, and MC1009. The bands visible in the autoradio- graphs are assigned to DNA frag- B ments by superposition on a life-sized photograph of the original ethidium bromide-stained gel. The curvature of gel lanes and bands generally makes this superposition accurate and unambiguous.
Fig. 4. Analysis of E. coli lambdoid phage lysogens by Not I restriction digestion. (A) Plan of the experiment. (B) The PFG fractionation was performed as described in the legend to Fig. 2. The arrow in each lane shows the position of the Not I band hybridizing to lambda DNA, while the dot shows the inferred position of the normal band in the nonlysogenic parent strain. This inference is based on the PFG pattern of the isogenic strain where available, or on the known size of lambda and the known position of the insertion. Not all the lysogens are isogenic. Most of the prophage insertions had been mapped by conventional genetics to lane A, cys operon (53 minutes); lane D, his operon (44 minutes); lane E,pyr-mutation (about 40 minutes); lane F, malB locus (91 minutes) (21, 22). The physical mapping is consistent with the genetic mapping. Although the strains in lanes A, D, and E were considered isogenic, there are obvious differences between them apart from the phage insertions. This may reflect the fact that the strains were revived from 10-year-old stab cultures, but, whatever the reason, the results underscore the need to use truly isogenic strains in physical mapping, especially if the results obtained by direct ethidium bromide staining are to be considered reliable and definitive. Lane B is E. coli strain DM49, integrated at the normal lambda attachment site rather than at the lexA lysogenized with XplexA3 (23). The results reveal that this phage has operon. Lane C is E. coli AB1 157 lysogenized with 4)80+ phage (24).
band C is 30 kb smaller in strain MC1009. Similarly, the small deletion in the ara-keu region in strain MC1009 region results in faster mobility of band D.
An extremely useful E. coli genome rearrangement is the inversion between two ribosomal RNA cistrons in strain W31 10. This disrupts the largest Not I fragment seen in most other strains, and the result is a striking alteration in the PFG pattern seen at 100- second pulse times (Fig. 5A). The inversion results in the shortening of Not I fragment A by almost 200 kb to produce fragment A', while fragment H increases in size to become H', the second largest fragment in strain W3110. Southern blotting with appropriate probes allows the rearrangement to be characterized fully. The result
(Fig. 5B) is fully consistent with the genetic assignment that the inversion took place between rrnE and mnD.
Finishing the physical map of E. coli. The methods described above allowed us to locate and order all but five of the Not I fragments of E. coli, F, 0, T, U, and V. The remaining fragments were placed on the map in two other ways, which also allowed us to confirm a number of regions of the map where initially there was no direct proof that two fragments were adjacent rather than separated by a small, unmapped fragment.
Clones that contain uncommon restriction enzyme cutting sites are called linking clones. Such clones are useful for constructing restriction maps (1, 3, 5, 6). When a linking clone containing a
Table 2. Probes used in the assignment of Not I fragments of the E. coli genome.
Min Gene Clone Ref. Min Gene Clone Ref. Min Gene Clone Ref.
0/100 thr pSL102 25 32 (260-310)* pBS9 38 61 araE pRFS15gg 53 1 Ips pMT521 16 33 (331-360)* pBS12 38 66 tolC pR42 54 1 ara pLC3 26 35 fumA pGS54 39 79 glyS pTK201 55 2 leu pCV35 27 38 xth pLCIO-4 40 81 mtlA pCL2.0 56 8 lacZ Xplac5 28 41 ruv pPVAIOI 41 82 pyrE pPP1 57
16 glnS pXX105 29 42 uvC pDR3003 42 82 ilvB pTCN12 58 16 gitA pHSgltA 30 44 hisG pCB3 43 84 uncA pDJKI 59 17 galK pKM2 31 45 araFG pWH54 44 87 polA pCJ1 60 17 X XcI857 24 48 adaC pCS70 45 89 metj pMAD4 61 20 rpsI4 pJS200 32 48 ompC pMY150 46 89 rplK pNF1344 62 21 ompF pLF4 33 51 dsdC pAC131 47 91 malB pMB3 63 25 umuC,D pSK621 34 53 hisS pSE411 48 92 lexA pRB160 64 28 trp pKB5 35 55 givA pGS27 49 92 pIsB pVLI 65 28 top pJW249 36 57 pheA pKB45 50 94 ampC pNU81 66 29 trkE pUE 37 58 sri XpsrlC 51 94 frd pNU31 67
61 thyA pBTAH 52 96 pyrB pPyrB3 68
*Refers to locations in kilobases on Bouche's (69) 470-kb physical map of the E. coli terminus region.
14-50 SCIENCE, VOL. 236
particular rare site is used to probe a blot of a PFG-separated digest generated with the same enzyrme, the probe will overlap two adjacent large DNA fragments. Thus it will hybridize to both of them and demonstrate that these two fragments must be adjacent in the genome. This approach provides information on the physical map regardless of preexisting genetic information. A screening of Genbank revealed two sequenced E. coli genes, Ips (16) and gap (17), which contain Not I sites. A DNA clone containing the Ips gene was available as a linking probe. One linking probe, between fragments L and S, was obtained (18) bv screening an E. coli genomic library for clones containing Not I sites.
The last method used for mapping the E. coli genome was the analvsis of partial Not I digests, by hybridization with cloned probes. The upper end of the separation range of PFG lies consider- ably above the size of most Not I fragments of the E. coli genome. Furthermore, the dependence of mobility on molecular size is almost linear in PFG, compared with the logarithmic dependence in conventional gel electrophoresis. These factors make the analysis of partial digests by PFG convenient. Schemes for optimizing the application of partial digests have been described (1, 5). We have used variants of these schemes to place a few Not I fragments that
could not be ordered anv other way. One example of an informative partial digest is shown in Fig. 6.
Partial digests were effective in locating the smallest Not I fragments. Most of these were not revealed directly bv hybridization with cloned probes or known genome rearrangements. This is understandable since the small size of the fragments makes them unlikely targets for either of these approaches. What proved espe- ciallv useful was eluting the small DNA fragments from PFG fractionations selected to optimize separations in the 10- to 100-kb size range. The eluted bands were isotopicallv labeled and used as probes to analyze Not I partial digests. Thus, each small band potentially reveals the identity of its neighbors. The eluted small bands could also be used as probes to analyze total Sfi I digests. The known map position of many of the Sfi I fragments would then reveal the location of the small Not I band.
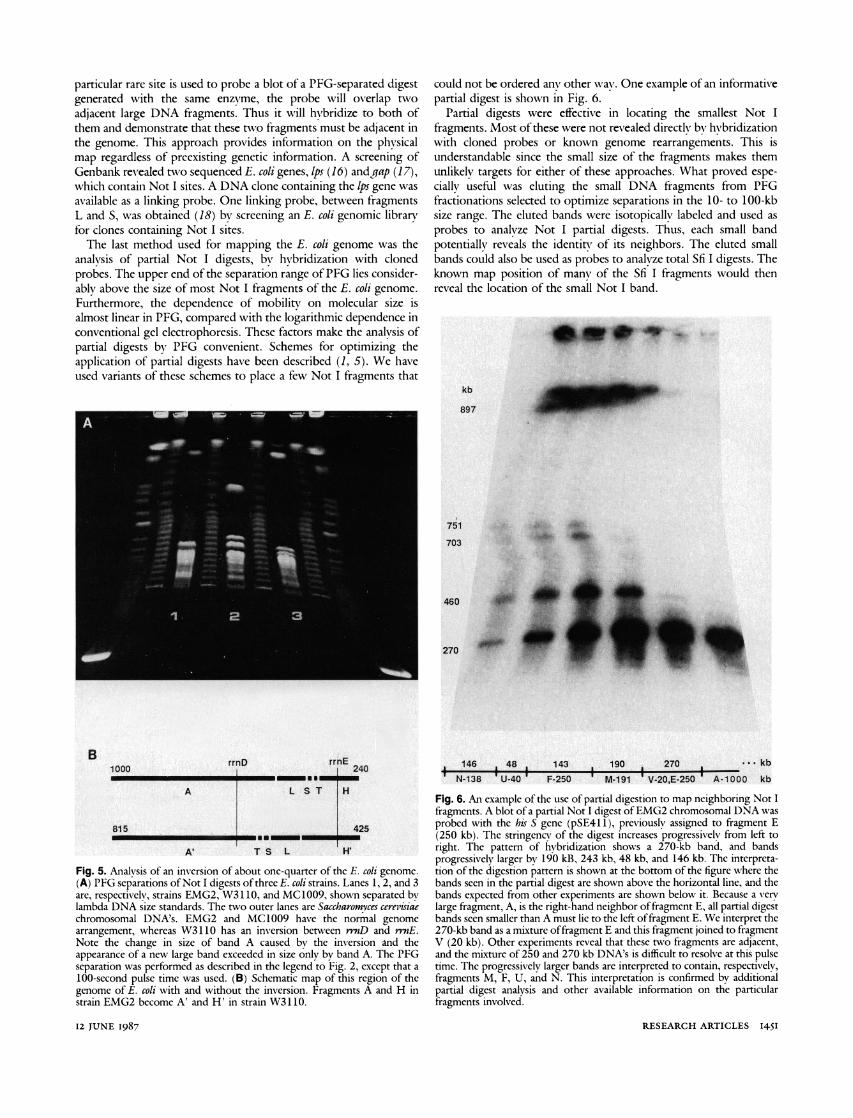
B 1000 rrnD rrnE 240
A L S T H
815 425 U U - -
A' TS L H'
Fig. 5. Analvsis of an inversion of about one-quarter of the E. coli genome. (A) PFG separations of Not I digests of three E. coli strains. Lanes 1, 2, and 3 are, respectively, strains EMG2, W3 110, and MC 1009, show.n separated by lambda DNA size standards. The two outer lanes are Saccharomvces cerevisiae chromosomal DNA's. EMG2 and MC1009 have the normal genome arrangement, whereas W3110 has an inversion between rnD and rrnE. Note the change in size of band A caused bv the inversion and the appearance of a new large band exceeded in size only bv band A. The PFG separation was performed as described in the legend to Fig. 2, except that a 100-second pulse time was used. (B) Schematic map of this region of the genome of E. coli with and without the inversion. Fragments A and H in strain EMG2 become A' and H' in strain W3110.
kb
897
*: . ....: .
751 : W
703
* .
.. . .
....;._
460
270
146 48 143 190 270 kb
N-138 U-40 F-250 M-191 V-20,E-250 A-1000 kb
Fig. 6. An example of the use of partial digestion to map neighboring Not I fragments. A blot of a partial Not I digest of EMG2 chromosomal DNA was probed with the his S gene (pSE41 1), previously assigned to fragment E (250 kb). The stringencv of the digest increases progressively from left to right. The pattern of hybridization shows a 270-kb band, and bands progressively larger by 190 kB, 243 kb, 48 kb, and 146 kb. The interpreta- tion of the digestion pattern is shown at the bottom of the figure where the bands seen in the partial digest are shown above the horizontal line, and the bands expected from other experiments are shown below it. Because a very large fragment, A, is the right-hand neighbor of fragment E, all partial digest bands seen smaller than A must lie to the left of fragment E. We interpret the 270-kb band as a mixture of fragment E and this fragment joined to fragment V (20 kb). Other experiments reveal that these two fragments are adjacent, and the mixture of 250 and 270 kb DNA's is difficult to resolve at this pulse time. The progressively larger bands are interpreted to contain, respectively, fragments M, F, U, and N. This interpretation is confirmed by additional partial digest analysis and other available information on the particular fragments involved.
12 JUNE 1987 RESEARCH ARTICLES 1451
The methods described above revealed the location of all 22 Not I fragments visible in ethidium bromide-stained PFG separations. There remained the possibility that additional tiny Not I fragments might exist that were too small to be detected, since the sensitivity of ethidium bromide staining is proportional to size. Two approaches were used to examine this possibility. The simplest was overloading gels with ten times as much DNA to enhance direct ethidium bromide visualization of any small fragment. This yielded inconsis- tent results. To achieve even greater sensitivity, and bypass any possible artifacts due to high DNA concentrations, we end-labeled total Not I digests of E. coli DNA with 32p prior to PFG analysis. This revealed no unexpected small DNA bands. However, neither of
these approaches would have revealed Not I fragments so small that they would have eluted from the agarose gel in our sample preparation and handling procedures. The possibility that such bands exist will have to be tested by other methods such as cloning the bands directly into an appropriate vector.
Comparison of the genetic and physical maps. A summary of the physical map of the E. coli genome is presented (Figs. 7 and 8) along with a simplified version of the existing genetic map (8). The data in Figs. 7 and 8 confirm the assignment of almost all of the individual Not I fragments. With the benefit of hindsight, we can say that the task of determining the E. coli physical map could have been simplified by relying much more extensively on the partial digestion results. The only region of the map that still requires additional conclusive evidence is that comprising S and T. Analysis of this region is complicated because the two fragments are similar in size and a specific probe is available for only one of these, arbitrarily assigned as fragment S.
The agreement between the physical map and the genetic map is excellent. There is no case where the order of two genes or fragments is inexplicably inconsistent between the two maps. Sever- al probes of the more than 50 examined did not give consistent results. In two cases, additional PFG bands besides the one expected were seen. These probably arise either from cross-hybridization or from the common artifact of cloning two unrelated fragments. In one case, the band hybridized by a probe made no sense whatsoever, and we assume the identity of the plasmid was incorrect since consistent results were obtained from several other cloned probes in the same genetic neighborhood. None of these data are included in the map since the cause of the discrepancy was not fully determined.
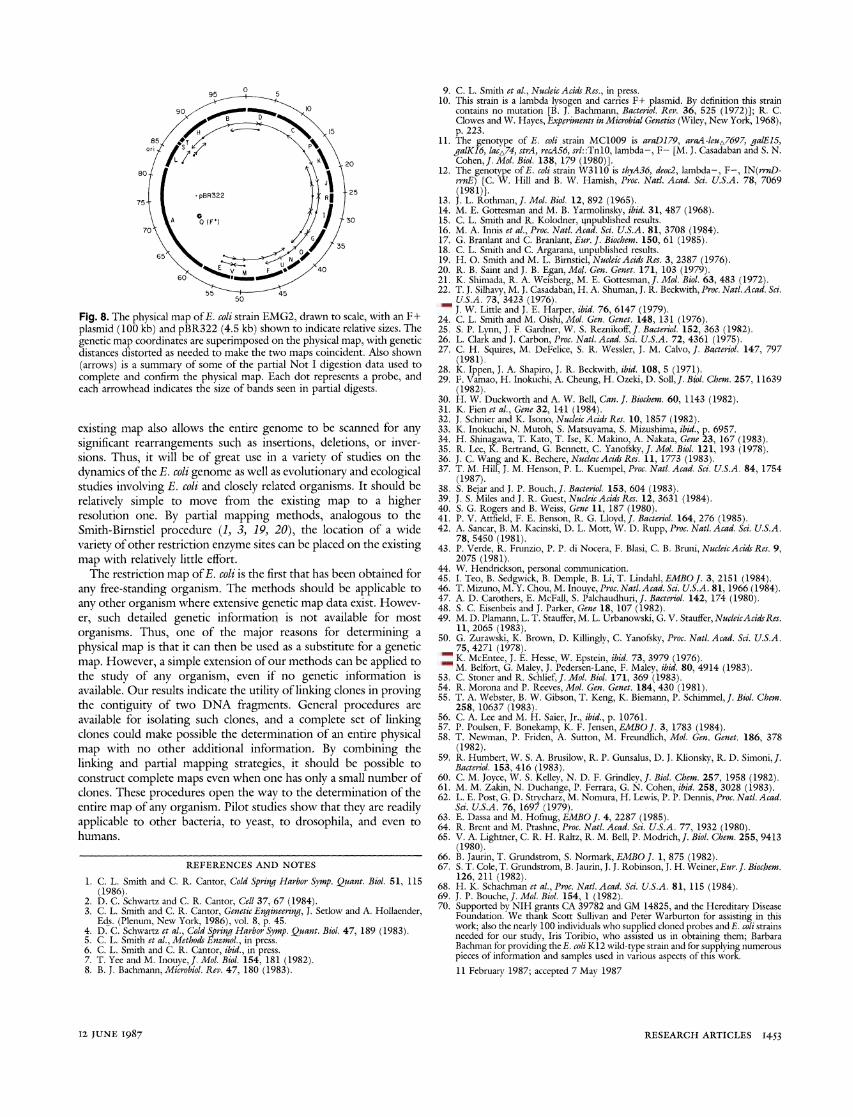
Along with consistency in fragment and gene order, our results show consistency in relative distances, as is indicated in Fig. 8 where the physical map is drawn with a linear scale and the genetic map is distorted to conform to the physical map. At the present resolution, the distortion required to superimpose the two maps is relatively little. On average there will be 46 kb of DNA per minute of the genetic map. The actual values for particular Not I fragments range from 61 kb per minute to 38 kb per minute. Thus the distances determined physically are consistent with relative distances mea- sured by genetic techniques such as recombination and cotransduc- tion. Hot spots for genetic rearrangement in E. coli are apparently spread uniformly enough throughout the genome so that the genetic map is closely proportional to actual length along the chromosomal DNA. Regions of the genome sparse in genetic markers do not seem to be sites with unusual properties. They most likely just contain genes for which no phenotype has yet been detected. It will be interesting to see whether these conclusions are maintained once higher resolution physical map data are available.
The existing E. coli map is still at relatively low resolution. However, it immediately allows the rough chromosomal position of any cloned DNA piece to be determined by Southern blotting. Thus the rough map position of any DNA sequence can be determined without the need for any known or measurable phenotype. The
Kb thr B- 360
0 Ora, /e,, D-275
/oc
10 C -360
gItAginS P- 100 attAkgo
20 ompF - K_1<-205
J - 210
urnuC - 95 top trP R9
30 trkEI - 230 p i 9 S -9L
furn A G- 245 Xth_ ___
gooow 0- 106 40 ruv uvr C ~N - 130
h/so U- 40 aroF.G F - 250 odoC
50 dsdA M- 191 hisS v \20 g/yA
phe A- E-250 sri
60 thyA- aroE
to/C
70 A 1000
80 mtlA
I/VS L-203 uncA
po/A S- 43 po/4 _ _t - 43 retL
90 rpIK H-24 ma/B, IexA 240
frd, omp C pyr? B -360
100 thr~ _
Ft 1 -O--4 Qo-.100
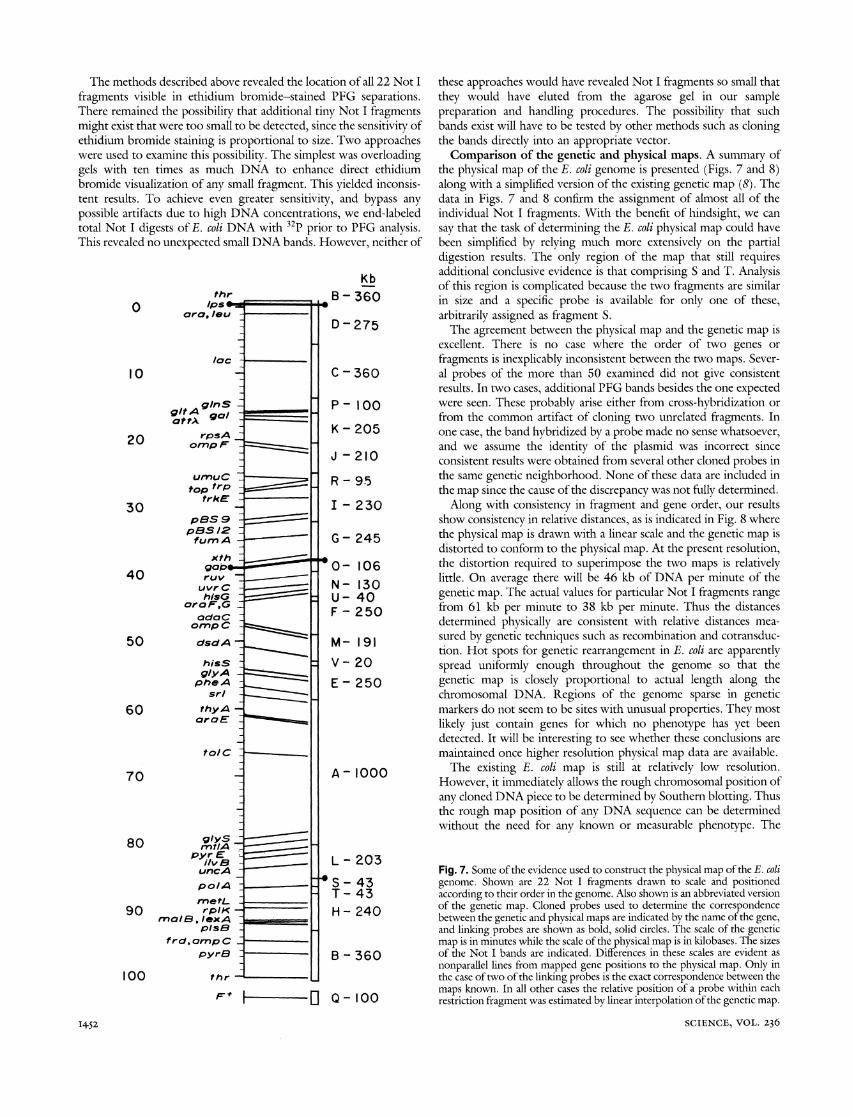
Fig. 7. Some of the evidence used to construct the physical map of the E. coli genome. Shown are 22 Not I fragments drawn to scale and positioned according to their order in the genome. Also shown is an abbreviated version of the genetic map. Cloned probes used to determine the correspondence between the genetic and physical maps are indicated by the name of the gene, and linking probes are shown as bold, solid circles. The scale of the genetic map is in minutes while the scale of the physical map is in kilobases. The sizes of the Not I bands are indicated. Differences in these scales are evident as nonparallel lines from mapped gene positions to the physical map. Only in the case of two of the linking probes is the exact correspondence between the maps known. In all other cases the relative position of a probe within each restriction fragment was estimated by linear interpolation of the genetic map.
1452 SCIENCE, VOL. 236
55 45~~~~~~~~~~1 85~~~~5
Fig. 8. The physical map of E. coli strain EMG2, drawn to scale, with an F+ plasmid (100 kb) and pBR322 (4.5 kb) shown to indicate relative sizes. The genetic map coordinates are superimposed on the physical map, with genetic distances distorted as needed to make the two maps coincident. Also shown (arrows) is a summary of some of the partial Not I digestion data used to complete and confirm the physical map. Each dot represents a probe, and each arrowhead indicates the size of bands seen in partial digests.
existing map also allows the entire genome to be scanned for any significant rearrangements such as insertions, deletions, or inver- sions. Thus, it will be of great use in a variety of studies on the dynamics of the E. coli genome as well as evolutionary and ecological studies involving E. coli and closely related organisms. It should be relatively simple to move from the existing map to a higher resolution one. By partial mapping methods, analogous to the Smith-Birnstiel procedure (1, 3, 19, 20), the location of a wide variety of other restriction enzyme sites can be placed on the existing map with relatively little effort.
The restriction map of E. coli is the first that has been obtained for any free-standing organism. The methods should be applicable to any other organism where extensive genetic map data exist. Howev- er, such detailed genetic information is not available for most organisms. Thus, one of the major reasons for determining a physical map is that it can then be used as a substitute for a genetic map. However, a simple extension of our methods can be applied to the study of any organism, even if no genetic information is available. Our results indicate the utility of linking clones in proving the contiguity of two DNA fragments. General procedures are available for isolating such clones, and a complete set of linking clones could make possible the determination of an entire physical map with no other additional information. By combining the linking and partial mapping strategies, it should be possible to construct complete maps even when one has only a small number of clones. These procedures open the way to the determination of the entire map of any organism. Pilot studies show that they are readily applicable to other bacteria, to yeast, to drosophila, and even to humans.
REFERENCES AND NOTES
1. C. L. Smith and C. R. Cantor, Cold Spring Harbor Svmp. Quant. Biol. 51, 115 (1986).
2. D. C. Schwartz and C. R. Cantor, Cell 37, 67 (1984). 3. C. L. Smith and C. R. Cantor, Genetic Engineering, J. Setlow and A. Hollaender,
Eds. (Plenum, New York, 1986), vol. 8, p. 45. 4. D. C. Schwartz et al., Cold Spring Harbor Symp. Quant. Biol. 47, 189 (1983). 5. C. L. Smith et al., Methods Enzmol., in press. 6. C. L. Smith and C. R. Cantor, ibid., in press. 7. T. Yee and M. Inouye, J. Mol. Biol. 154, 181 (1982). 8. B. J. Bachmann, Microbiol. Rev. 47, 180 (1983).
9. C. L. Smith et al., Nucleic Acids Res., in press. 10. This strain is a lambda lysogen and carries F+ plasmid. By definition this strain
contains no mutation [B. J. Bachmann, Bacteriol. Rev. 36, 525 (1972)]; R. C. Clowes and W. Hayes, Exptriments in Microbial Genetics (Wiley, New York, 1968), p. 223.
11. The genotype of E. coli strain MC1009 is araD179, aracA-leuA7697, galE15, galK16, lacZ74, strA, recA56, srl::TnlO, lambda-, F- [M. J. Casadaban and S. N. Cohen,J. Mol. Biol. 138, 179 (1980)].
12. The genotype of E. coli strain W3110 is thyA36, deoc2, lambda-, F-, IN(mniD- rrnE) [C. W. Hill and B. W. Hamish, Proc. Natl. Acad. Sci. U.S.A. 78, 7069 (1981)].
13. J. L. Rothman,J. Mol. Biol. 12, 892 (1965). 14. M. E. Gottesman and M. B. Yarmolinsky, ibid. 31, 487 (1968). 15. C. L. Smith and R. Kolodner, unpublished results. 16. M. A. Innis et al., Proc. Natl. Acad. Sci. U.S.A. 81, 3708 (1984). 17. G. Branlant and C. Branlant, Eur. J. Biochem. 150, 61 (1985). 18. C. L. Smith and C. Argarana, unpublished results. 19. H. 0. Smith and M. L. Birnstiel, NucleicAcids Res. 3, 2387 (1976). 20. R. B. Saint and J. B. Egan, Mol. Gen. Genet. 171, 103 (1979). 21. K. Shimada, R. A. Weisberg, M. E. Gottesman,J. Mol. Biol. 63, 483 (1972). 22. T. J. Silhavy, M. J. Casadaban, H. A. Shuman, J. R. Beckwith, Proc. Natl. Acad. Sci.
U.S.A. 73, 3423 (1976). 23. J. W. Little and J. E. Harper, ibid. 76, 6147 (1979). 24. C. L. Smith and M. Oishi, Mol. Gen. Genet. 148, 131 (1976). 25. S. P. Lynn, J. F. Gardner, W. S. Reznikoff,J. Baceriol. 152, 363 (1982). 26. L. Clark and J. Carbon, Proc. Natl. Acad. Sci. U.S.A. 72, 4361 (1975). 27. C. H. Squires, M. DeFelice, S. R. Wessler, J. M. Calvo, J. Btqcteriol. 147, 797
(1981). 28. K. Ippen, J. A. Shapiro, J. R. Beckwith, ibid. 108, 5 (1971). 29. F. Vamao, H. Inokuchi, A. Cheung, H. Ozeki, D. Soll,J. Biol. Chem. 257, 11639
(1982). 30. H. W. Duckworth and A. W. Bell, Can. J. Biochem. 60, 1143 (1982). 31. K. Fien et al., Gene 32, 141 (1984). 32. J. Schiier and K. Isono, NucleicAcids Res. 10, 1857 (1982). 33. K. Inokuchi, N. Mutoh, S. Matsuyama, S. Mizushima, ibid., p. 6957. 34. H. Shinagawa, T. Kato, T. Ise, K. Makino, A. Nakata, Gene 23, 167 (1983). 35. R. Lee, K. Bertrand, G. Bennett, C. Yanofsky,J. Mol. Biol. 121, 193 (1978). 36. J. C. Wang and K. Bechere, NucleicAcidsRes. 11, 1773 (1983). 37. T. M. Hill, J. M. Henson, P. L. Kuempel, Proc. Natl. Acad. Sci. U.S.A. 84, 1754
(1987). 38. S. Bejar and J. P. Bouch,J. Bacteriol. 153, 604 (1983). 39. J. S. Miles and J. R. Guest, Nucleic Acids Res. 12, 3631 (1984). 40. S. G. Rogers and B. Weiss, Gene 11, 187 (1980). 41. P. V. Attfield, F. E. Benson, R. G. Lloyd,J. Bacteriol. 164, 276 (1985). 42. A. Sancar, B. M. Kacinski, D. L. Mott, W. D. Rupp, Proc. Natl. Acad. Sci. U.S.A.
78, 5450 (1981). 43. P. Verde, R. Frunzio, P. P. di Nocera, F. Blasi, C. B. Bruni, NucleicAcids Res. 9,
2075 (1981). 44. W. Hendrickson, personal communication. 45. I. Teo, B. Sedgwick, B. Demple, B. Li, T. Lindahl, EMBOJ. 3, 2151 (1984). 46. T. Mizuno, M. Y. Chou, M. Inouye, Proc. Natl.Acad. Sci. U.S.A. 81, 1966 (1984). 47. A. D. Carothers, E. McFall, S. Palchaudhuri,J. Bacteriol. 142, 174 (1980). 48. S. C. Eisenbeis and J. Parker, Gene 18, 107 (1982). 49. M. D. Plamann, L. T. Stauffer, M. L. Urbanowski, G. V. Stauffer, NucleicAcidsRes.
11, 2065 (1983), 50. G. Zurawski, K. Brown, D. Killingly, C. Yanofsky, Proc. Natl. Acad. Sci. U.S.A.
75, 4271 (1978). 51. K. McEntee, J. E. Hesse, W. Epstein, ibid. 73, 3979 (1976). 52. M. Belfort, G. Maley, J. Pedersen-Lane, F. Maley, ibid. 80, 4914 (1983). 53. C. Stoner and R. Schlief,J. Mol. Biol. 171, 369 (1983). 54. R. Morona and P. Reeves, Mol. Gen. Genet. 184, 430 (1981). 55. T. A. Webster, B. W. Gibson, T. Keng, K. Biemann, P. Schimmel,J. Biol. Chem.
258, 10637 (1983). 56. C. A. Lee and M. H. Saier, Jr., ibid., p. 10761. 57. P. Poulsen, F. Bonekamp, K. F. Jensen, EMBOJ. 3, 1783 (1984). 58. T. Newman, P. Friden, A. Sutton, M. Freundlich, Mol. Gen, Genet. 186, 378
(1982). 59. R. Humbert, W. S. A. Brusilow, R. P. Gunsalus, D. J. Klionsky, R. D. Simoni,J.
Bacteriol. 153, 416 (1983). 60. C. M. Joyce, W. S. Kelley, N. D. F. Grindley,J. Biol. Chem. 257, 1958 (1982). 61. M. M. Zakin, N. Duchange, P. Ferrara, G. N. Cohen, ibid. 258, 3028 (1983). 62. L. E. Post, G. D. Strycharz, M. Nomura, H. Lewis, P. P. Dennis, Proc. Natl. Acad.
Sci. U.S.A. 76, 1697 (1979). 63. E. Dassa and M. Hofnug, EMBOJ. 4, 2287 (1985). 64. R. Brent and M. Ptashne, Proc. Natl. Acad. Sci. U.S.A. 77, 1932 (1980). 65. V. A. Lightner, C. R. H. Raltz, R. M. Bell, P. Modrich,J. Biol. Chem. 255, 9413
(1980). 66. B. Jaurin, T. Grundstrom, S. Normark, EMBO J. 1, 875 (1982). 67. S. T. Cole, T. Grundstrom, B. Jaurin, J. J. Robinson, J. H. Weiner, Eur. J. Biochem.
126, 211 (1982). 68. H. K. Schachman et al., Proc. Natl. Acad. Sci. U.S.A. 81, 115 (1984). 69. J. P. Bouche, J. Mol. Biol. 154, 1 (1982). 70. Supported by NIH grants CA 39782 and GM 14825, and the Hereditary Disease
Foundation. We thank Scott Sullivan and Peter Warburton for assisting in this work; also the nearly 100 individuals who supplied cloned probes and E. coli strains needed for our study, Iris Toribio, who assisted us in obtaining them; Barbara Bachman for providing the E. coli K12 wild- type strain and for supplying numerous pieces of information and samples used in various aspects of this work.
11 Februarv 1987; accepted 7 May 1987
12 JUNE 1987 RESEARCH ARTICLES 1453