Embed Size (px)
Citation preview
Ac
MSa
b
c
d
a
ARRAA
KPSAMM
1
tmdtet
aceami(
0d
Sensors and Actuators B 156 (2011) 433–443
Contents lists available at ScienceDirect
Sensors and Actuators B: Chemical
journa l homepage: www.e lsev ier .com/ locate /snb
photopatternable superparamagnetic nanocomposite: Materialharacterization and fabrication of microstructures
. Sutera,∗, O. Ergenemanb, J. Zürchera, C. Moitzi c, S. Panéb, T. Rudind,.E. Pratsinisd, B.J. Nelsonb, C. Hierolda
Micro and Nanosystems, ETH Zürich, Tannenstrasse 3, 8092 Zürich, SwitzerlandMulti-Scale Robotics Lab, Institute of Robotics and Intelligent Systems, ETH Zürich, Tannenstrasse 3, 8092 Zürich, SwitzerlandAdolphe Merkle Institute, University of Fribourg, Rte de l’Ancienne Papeterie, P.O. Box 209, 1723 Marly, SwitzerlandParticle Technology Laboratory, ETH Zürich, Sonneggstrasse 3, 8092 Zürich, Switzerland
r t i c l e i n f o
rticle history:eceived 14 March 2011eceived in revised form 19 April 2011ccepted 23 April 2011vailable online 28 April 2011
eywords:hotopatternable magnetic compositeuperparamagnetic magnetite particlesgglomerates in polymer composite
a b s t r a c t
A superparamagnetic nanocomposite obtained by dispersing superparamagnetic magnetite nanopar-ticles in the epoxy SU-8 is used to fabricate microstructures by photolithography. The dispersion ofthe nanoparticles and the level of agglomerations are analyzed by optical microscopy, TEM (transmis-sion electron microscope), SAXS (small-angle X-ray scattering), XDC (X-ray disc centrifuge) and XRD(X-ray diffraction). Two different phosphate-based dispersing agents are compared. In order to obtaina high-quality nanocomposite, the influence of particle concentration 1–10 vol.% (4–32 wt.%) on com-posite fabrication steps such as spin coating and UV exposure are systematically analyzed. Features withnarrow widths (down to 1.3 �m) are obtained for composites with 5 vol.% particle concentration. Mechan-ical, magnetic and wetting properties of the nanocomposites are characterized. These nanocomposites
−1
agnetic microcantileversagnetic nanocompositeexhibit superparamagnetic properties with a saturation magnetization up to 27.9 kA m for10 vol.%. Allnanocomposites show no differences in surface polarity with respect to pure SU-8, and exhibit a mod-erate hydrophobic behavior (advancing dynamic contact angles approximately 81◦). Microcantileverswith particle concentrations of 0–5 vol.% were successfully fabricated and were used to determine thedynamic Young’s modulus of the composite. A slight increase of the Young’s modulus with increasedparticle concentration from 4.1 GPa (pure SU-8) up to 5.1 GPa (for 5 vol.%) was observed.
. Introduction
Advances in material integration and micro and nano fabricationechnologies have enabled new directions of research and develop-
ent for BioMEMS and BioNEMS devices [1]. The performance of aevice interacting with biological systems requires a proper selec-ion of materials in terms of their physiochemical properties. Forxample, chemical stability, biocompatibility, and ease of biofunc-ionalization of the constituent materials are of importance.
Polymer composite materials have been highly successful inchieving different physical and chemical properties [2], as theombination of inorganic particles and polymer matrices canxpand desirable material properties for new sensors, actuatorsnd other devices [3,4]. The dispersion of superparamagnetic
agnetite nanoparticles in the epoxy SU-8 creates the possibil-ty of manufacturing photopatternable magnetic nanocompositesFig. 1). Magnetic microstructures for remote actuation can be
∗ Corresponding author. Tel.: +41 44 632 55 36; fax: +41 44 632 14 62.E-mail address: [email protected] (M. Suter).
925-4005/$ – see front matter © 2011 Elsevier B.V. All rights reserved.oi:10.1016/j.snb.2011.04.078
© 2011 Elsevier B.V. All rights reserved.
fabricated by conventional spin coating and photolithographytechniques. These microstructures are potential candidates forinterfacing biological systems.
Photosensitive polymers have been modified and improvedby adding an inorganic material like silica nanoparticles [5,6] tochange the refractive index of the material or silver nanoparti-cles to increase conductivity [7]. Using a photosensitive polymerin combination with magnetic particles has been reported for thefabrication of microstructures with feature widths larger than 5 �mby conventional photolithography using ferromagnetic particles[8,9]. However, when further device miniaturization is desiredthe processing of composite materials that contain particles dis-persed in a matrix becomes a challenge. Distribution of particlesmust be homogeneous within the matrix and agglomerates mustbe avoided in order to maintain homogenous material proper-ties (e.g., magnetic, electrical, mechanical properties) across themicrodevice and within the process batch. Characterization of
particle dispersion in a composite used for microstructures iscrucial. Several factors influence the agglomeration of particles:interatomic and intermolecular attractive forces favor the forma-tion of agglomerates, and this tendency is even more prominent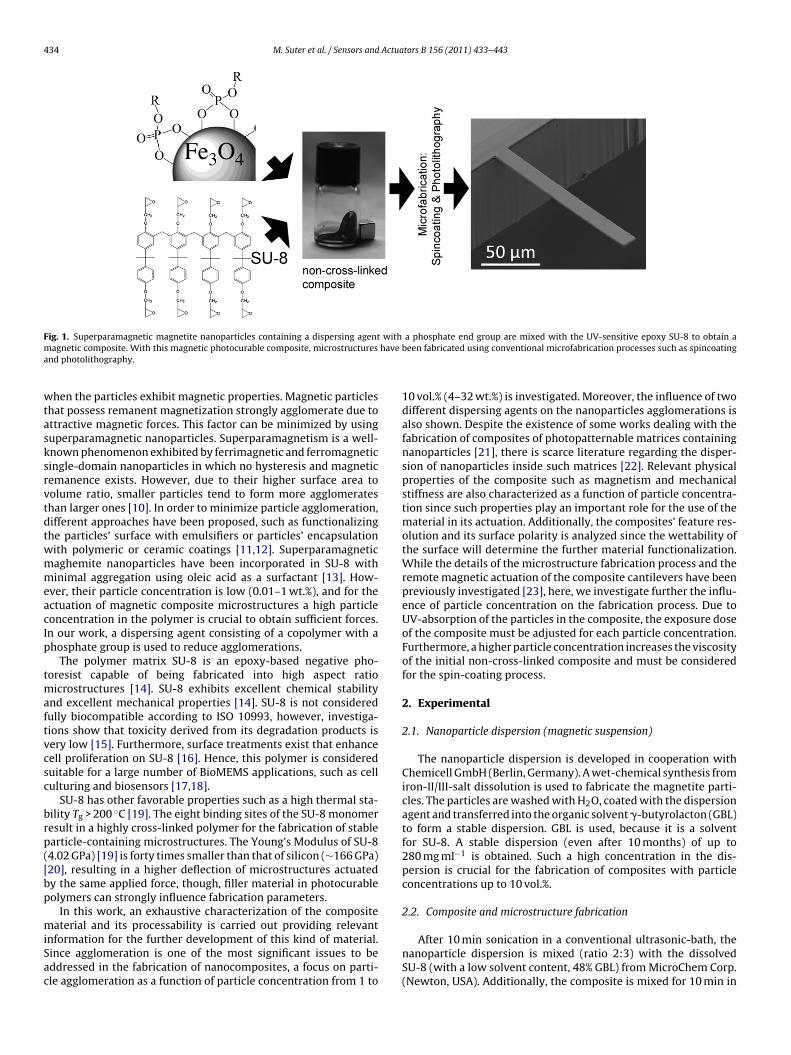
434 M. Suter et al. / Sensors and Actuators B 156 (2011) 433–443
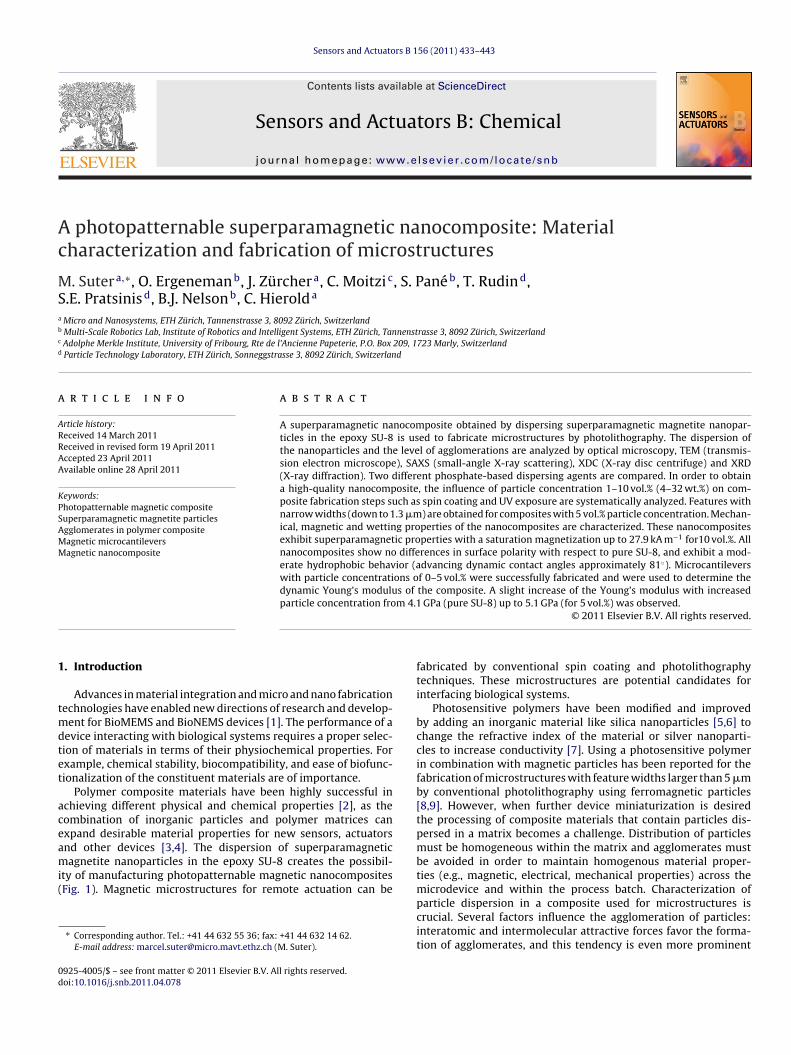
Fig. 1. Superparamagnetic magnetite nanoparticles containing a dispersing agent with a phosphate end group are mixed with the UV-sensitive epoxy SU-8 to obtain am havea
wtasksrvtdtwmmeacIp
tmaftvcsc
brp([bp
miSac
agnetic composite. With this magnetic photocurable composite, microstructuresnd photolithography.
hen the particles exhibit magnetic properties. Magnetic particleshat possess remanent magnetization strongly agglomerate due tottractive magnetic forces. This factor can be minimized by usinguperparamagnetic nanoparticles. Superparamagnetism is a well-nown phenomenon exhibited by ferrimagnetic and ferromagneticingle-domain nanoparticles in which no hysteresis and magneticemanence exists. However, due to their higher surface area toolume ratio, smaller particles tend to form more agglomerateshan larger ones [10]. In order to minimize particle agglomeration,ifferent approaches have been proposed, such as functionalizinghe particles’ surface with emulsifiers or particles’ encapsulationith polymeric or ceramic coatings [11,12]. Superparamagneticaghemite nanoparticles have been incorporated in SU-8 withinimal aggregation using oleic acid as a surfactant [13]. How-
ver, their particle concentration is low (0.01–1 wt.%), and for thectuation of magnetic composite microstructures a high particleoncentration in the polymer is crucial to obtain sufficient forces.n our work, a dispersing agent consisting of a copolymer with ahosphate group is used to reduce agglomerations.
The polymer matrix SU-8 is an epoxy-based negative pho-oresist capable of being fabricated into high aspect ratio
icrostructures [14]. SU-8 exhibits excellent chemical stabilitynd excellent mechanical properties [14]. SU-8 is not consideredully biocompatible according to ISO 10993, however, investiga-ions show that toxicity derived from its degradation products isery low [15]. Furthermore, surface treatments exist that enhanceell proliferation on SU-8 [16]. Hence, this polymer is considereduitable for a large number of BioMEMS applications, such as cellulturing and biosensors [17,18].
SU-8 has other favorable properties such as a high thermal sta-ility Tg > 200 ◦C [19]. The eight binding sites of the SU-8 monomeresult in a highly cross-linked polymer for the fabrication of stablearticle-containing microstructures. The Young’s Modulus of SU-84.02 GPa) [19] is forty times smaller than that of silicon (∼166 GPa)20], resulting in a higher deflection of microstructures actuatedy the same applied force, though, filler material in photocurableolymers can strongly influence fabrication parameters.
In this work, an exhaustive characterization of the compositeaterial and its processability is carried out providing relevant
nformation for the further development of this kind of material.ince agglomeration is one of the most significant issues to beddressed in the fabrication of nanocomposites, a focus on parti-le agglomeration as a function of particle concentration from 1 to
been fabricated using conventional microfabrication processes such as spincoating
10 vol.% (4–32 wt.%) is investigated. Moreover, the influence of twodifferent dispersing agents on the nanoparticles agglomerations isalso shown. Despite the existence of some works dealing with thefabrication of composites of photopatternable matrices containingnanoparticles [21], there is scarce literature regarding the disper-sion of nanoparticles inside such matrices [22]. Relevant physicalproperties of the composite such as magnetism and mechanicalstiffness are also characterized as a function of particle concentra-tion since such properties play an important role for the use of thematerial in its actuation. Additionally, the composites’ feature res-olution and its surface polarity is analyzed since the wettability ofthe surface will determine the further material functionalization.While the details of the microstructure fabrication process and theremote magnetic actuation of the composite cantilevers have beenpreviously investigated [23], here, we investigate further the influ-ence of particle concentration on the fabrication process. Due toUV-absorption of the particles in the composite, the exposure doseof the composite must be adjusted for each particle concentration.Furthermore, a higher particle concentration increases the viscosityof the initial non-cross-linked composite and must be consideredfor the spin-coating process.
2. Experimental
2.1. Nanoparticle dispersion (magnetic suspension)
The nanoparticle dispersion is developed in cooperation withChemicell GmbH (Berlin, Germany). A wet-chemical synthesis fromiron-II/III-salt dissolution is used to fabricate the magnetite parti-cles. The particles are washed with H2O, coated with the dispersionagent and transferred into the organic solvent �-butyrolacton (GBL)to form a stable dispersion. GBL is used, because it is a solventfor SU-8. A stable dispersion (even after 10 months) of up to280 mg ml−1 is obtained. Such a high concentration in the dis-persion is crucial for the fabrication of composites with particleconcentrations up to 10 vol.%.
2.2. Composite and microstructure fabrication
After 10 min sonication in a conventional ultrasonic-bath, thenanoparticle dispersion is mixed (ratio 2:3) with the dissolvedSU-8 (with a low solvent content, 48% GBL) from MicroChem Corp.(Newton, USA). Additionally, the composite is mixed for 10 min in
Actua
aFTSpd
2
mfidoGbo
2
Rtglatobabtwaoq
q
wib(C
2
f(tDt[T
2
i(21H
M. Suter et al. / Sensors and
planetary mixer (dual asymmetric centrifugal mixer, DAC 150VZ, Hausschild) with an initial 2 min speed ramp (0–3000 rpm).he composite is treated by ultrasonic sound (Vibracell VCX 600onics & Materials Inc.) for 20 min and then spin-coated onto a sup-ort glass wafer. The microfabrication process has been previouslyetailed [23].
.3. TEM images
The particle diameter and the agglomerate diameter are deter-ined from several TEM images (Philips CM12 with a tungsten
lament at 100 kV) using the software ImageJ 1.42q. Grinding andimple-grinding (Gatan 656) are used to prepare thin film slicesf the composite. With the precision ion polishing system (PIPS)atan 691 a hole is etched in the sample by two focused argon ioneams. At the edge of the hole the probe is thin enough for TEMbservation.
.4. SAXS measurements
The SAXS equipment consists of a S-MAX3000 instrument fromigaku Innovative Technologies (Auburn Hills, MI, USA). The radia-ion is produced by a high-intensity micro-focus sealed tube X-rayenerator (Rigaku MicroMax-002+) with a copper anode (wave-ength 0.154 nm). A pair of multilayer reflectors is used to producemonochromatic beam which is collimated by a three pinhole sys-
em. In the fully evacuated camera the sample is placed at a distancef 1525 mm from the detector. The diameter of the incident X-rayeam at the sample position is approximately 0.8 mm. The samplebsorption is measured by a photodiode which is mounted on theeam-stop. The scattered intensity is detected by a fully integratedwo-dimensional multi-wire proportional counter (Rigaku Triton)hich makes highly sensitive measurements from isotropic and
nisotropic materials possible. The diameter of the sensitive areaf the detector is 200 mm. The range of accessible scattering vectorswhich is defined as
=(
4�
�
)sin
(�
2
)(1)
ith � being the X-ray wavelength and � being the scattering angle,s 0.07 < q < 4.5 nm−1. For the model fitting approach to calculate thei-lognormal distribution of homogeneous spheres program SASfitby Joachim Kohlbrecher and Ingo Bressler, Paul Scherrer Institute,H) was used.
.4.1. XRD measurementsXRD measurements are taken from particles, which were dried
rom the initial particle dispersion in a vacuum oven under N2100 ◦C at 20 mbar) to avoid changes in the structure of the par-icles. XRD patterns are recorded from three probes with a Bruker8 Advance diffractometer (40 kV, 40 mA, CuK�) at 2� = 10–80◦. By
he fundamental parameter approach with the Rietveld refinement24], crystallite sizes of Fe3O4 (ICSD 028664) are obtained usingOPAS 3.0 (Bruker).
.5. XDC measurements
The hydrodynamic diameter of the initial particle dispersions measured with a Brookhaven Instrument X-ray disc centrifuge
3000 rpm, 300 min, 22 ◦C). 1.2 ml particle dispersion is diluted with3.8 ml GBL and sonicated in a conventional ultrasonic-bath for0 min. To ensure solvent compatibility a polycarbonathomolite-911 disc is used for the XDC measurements.tors B 156 (2011) 433–443 435
2.6. Magnetic measurements
The magnetic characteristics of the nanoparticles and compos-ite structures are obtained by measuring their M–H loops. Themagnetic characterization of the nanoparticles was done using avibrating sample magnetometer (VSM) (Micromag 3900, PrincetonMeasurement Corporation). The nanoparticles are weighed using amicrobalance prior to the measurement. The composite structuresare measured using an alternating gradient magnetometer (AGM)(Micromag 2900, Princeton Measurement Corporation) due to itshigher sensitivity. Films of composite are prepared with knowndimensions for the magnetic measurements.
2.6.1. Viscosity and layer thickness measurementsA prototype of a rod-type sensor for viscosity measurement AST-
100 from Brookfield (Middleboro, MA, USA), developed at Instituteof Mechanical Systems, ETH Zurich is used. Due to the low samplevolume the accuracy of the measurements are ± 20%. The layerthicknesses of the different spin-coated and patterned compositesare determined from 4 to 7 measurements, using a profilometerTencor P10 from KLA-Tencor Corporation (San Jose, USA).
2.7. UV-transmittance measurement and surface investigation
The spectra of the transmittance of composite layers with dif-ferent particle concentrations (1, 2, 3, 5 and 10 vol.%) have beenmeasured. The measured thicknesses of the samples are shown inTable 2. To analyze the light transmittance with a UV/VIS spec-trometer (Cary 500, Varian) exposed composite areas have beenreleased from the substrate and placed on fused silica glass sup-ports. Fused silica has a transmittance of 90% above 200 nm and,therefore, well suitable as a substrate for transmittance measure-ments. The wavelength dependant absorption of the fused silicasubstrate was eliminated by a background measurement. The topand bottom surfaces of microcantilevers with 5 and 10 vol.% areobserved by secondary electron microscope (SEM) (FEI Quanta 200FEG).
2.8. Pattern transfer in the composite
The widths of the fabricated structures and mask patterns havebeen measured on three different probes using a Leica DM4000optical microscope calibrated with a 70 �m circular standard sam-ple.
2.9. Contact angle measurements
Dynamic contact angle measurements were performed ona Krüss DSA 100 (Krüss, Germany). For dynamic contact angle(advancing (�a) and receding (�r)) measurements the drop vol-ume was increased and decreased with a speed of 15 �L min−1.This leads to low-rate contact angle measurements with advanc-ing contact-line speeds below 0.012 mm s−1. Receding contact-linespeeds are slightly higher on strongly pinning surfaces at around0.03 mm s−1. For the advancing drop, one movie with 100 framesand, for the receding drop, one movie with 250 frames wasrecorded.
2.9.1. Dynamic Young’s modulusThe cantilevers are actuated by thermal noise under vacuum
pressure (4.6 − 22 × 10−3 Pa). The vibrations are measured by aLaser-Doppler-Vibrometer (Polytec GmbH, MSA-500). The signal
is transformed into the frequency domain by the means of FastFourier Transformation. In order to minimize noise, the frequencyspectra are averaged over 300 measurements. White noise and 1/fnoise are eliminated and the square amplitude frequency spectra
436 M. Suter et al. / Sensors and Actuators B 156 (2011) 433–443
F e contM ter > 5c nder
aitsi
�
w�t
3
3
idp(mttttPsdd5mtWsgm
is(
ig. 2. Light microscope images in transmission mode of a polymerized compositagnetite particles are coated by diphosphate and form agglomerates (mean diame
ontaining a copolymer with a phosphate group, agglomerates are no long visible u
re fitted by a Lorentzian curve shape. The length L of the cantileverss measured with an optical light microscope Leica DM4000. Thehickness h is determined by a profilometer Tencore P10. The den-ity of the composite is assumed to be a perfect dispersion of thencorporated nanoparticles in the SU-8:
= ��Fe3O4 + (1 − �)�SU-8, (2)
here �Fe3O4 is the density of Fe3O4 nanoparticles (5180 kg m−3),SU-8 the density of SU-8 (1190 kg m−3), and � is the volume frac-
ion of the nanoparticles in the composite.
. Results and discussion
.1. Dispersion
To achieve homogenous mechanical and magnetic propertiesn the composite microstructures, the nanoparticles must be wellispersed within the host matrix. Hence, the use of a proper dis-ersing agent is critical. Despite the high number of possibilitiessurfactants, polymers, complexing agents), the proper dispersant
ust fulfill important requirements such as a strong attachmento the nanoparticle surface and an optimal chemical affinity ofhe surfactant with the surrounding matrix. The importance ofhe particle functionalization is illustrated in Fig. 2. In this work,wo different phosphate-containing dispersing agents are used.hosphate groups are known to adsorb strongly onto magnetiteurfaces [25]. However, the presence of such functional groupsoes not guarantee dispersion stability. Using diphosphate as aispersant, relatively large magnetite agglomerates greater than�m in size can be observed under an optical microscope afterixing (Fig. 2(a)). Such a composite would result in microstruc-
ures with rough surfaces and non-uniform mechanical properties.hen magnetite nanoparticles are functionalized with a disper-
ant consisting of a linear copolymer containing a phosphateroup, agglomerates are no longer observed (Fig. 2(b)) by opticalicroscopy.
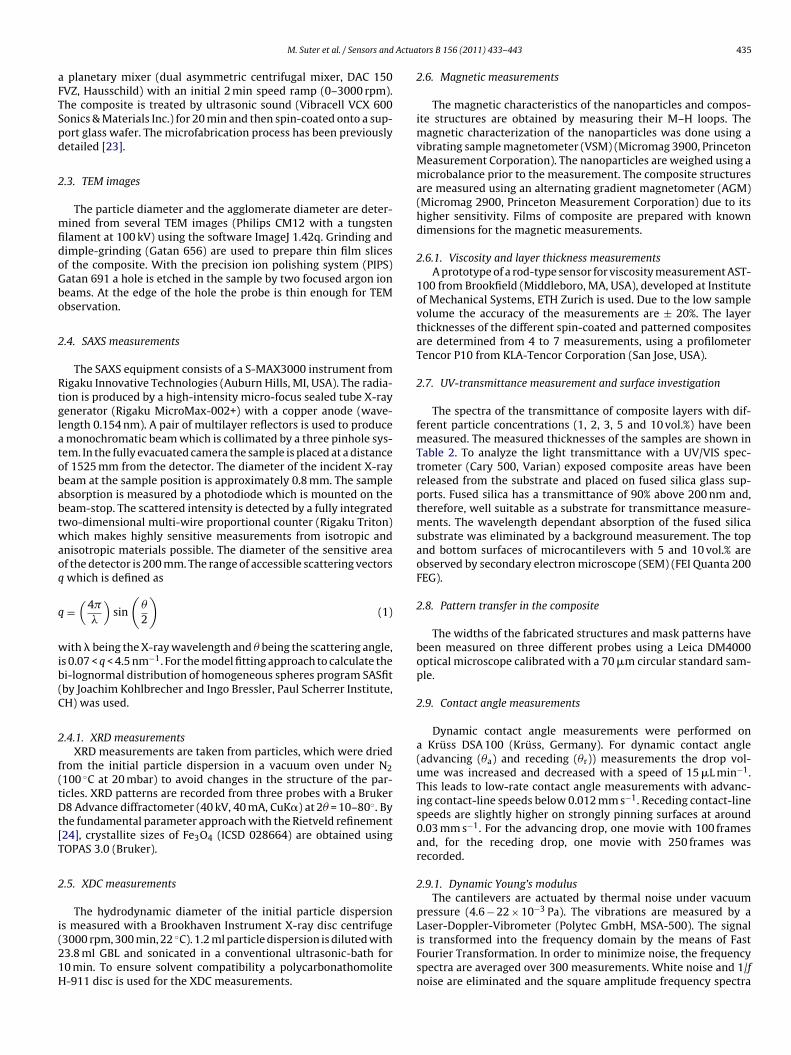
Further investigation of the composite dispersion with TEMmages was performed. Fig. 3 shows a TEM image of the cross-ection of a composite layer containing 3 vol.% (12 wt.%) and 5 vol.%18 wt.%) magnetite particles. In Fig. 4, a close up view of the com-
aining 2 vol.% (8 wt.%) Fe3O4 particles with a film thickness of 1.75 ± 0.15 �m. (a)�m) in the polymer. (b) If the magnetic particles are coated with a dispersant agent
light microscopy.
posite is depicted. A clear dispersion of Fe3O4 particles in the SU-8matrix with a low level of agglomeration can be observed. Theagglomerate diameter distribution of a composite with 5 vol.% par-ticle concentration is measured from TEM images (366 counts) andshown in Fig. 5(a). The agglomerate’s average count diameter is43.5 ± 20.4 nm.
The particle diameter distribution measured from TEM imagesis depicted in Fig. 5(b). The particles’ average count diameter is11.4 ± 3.4 nm (800 particles measured). From a two-dimensionalTEM image, it is difficult to estimate the agglomerate sizes becausethe particles and agglomerates can overlap within the ∼100 nmthick slice.
In order to quantitatively determine the size distribution ofparticles and agglomerates, small angle X-ray scattering (SAXS)measurements were performed. Composite films with a typicalthickness between 1.54 �m and 2.23 �m were measured using atransmission geometry with a measurement time of 1 h. The scat-tered intensities were azimuthally averaged and corrected for thesample absorption (the raw intensities were divided by the sampletransmission). Small differences in sample geometry were takeninto account by dividing the scattering curve with the thickness ofthe sample at the position of the X-ray beam. Background scatter-ing corresponding to the polymer matrix was taken into accountby subtracting the scattering of a sample that did not containparticles. Finally, the scattering curves were normalized by theFe3O4 concentration, since particle count density must be consid-ered. Fig. 6 shows characteristic curves that provide informationon the agglomeration state of the particles for different particleconcentrations in the composite. The SAXS curves show two dis-tinct slopes indicating the presence of two particle/agglomeratessizes. The SAXS curves for samples, containing 1–10 vol.% of Fe3O4,overlap, indicating that the agglomeration states of particles in thecomposite are independent of the particle concentration. Becauseof the higher scattered intensity, the noise of the SAXS curve islower for increasing particle concentration. At the same time thescattering of the X-ray at very small angles is significantly sup-
pressed at Fe3O4 concentrations of 5 and 10 wt.%. This is due toparticle interactions which cannot be neglected at these concen-trations. Small angle X-ray scattering does not provide informationon the nature of the interaction but can distinguish between repul-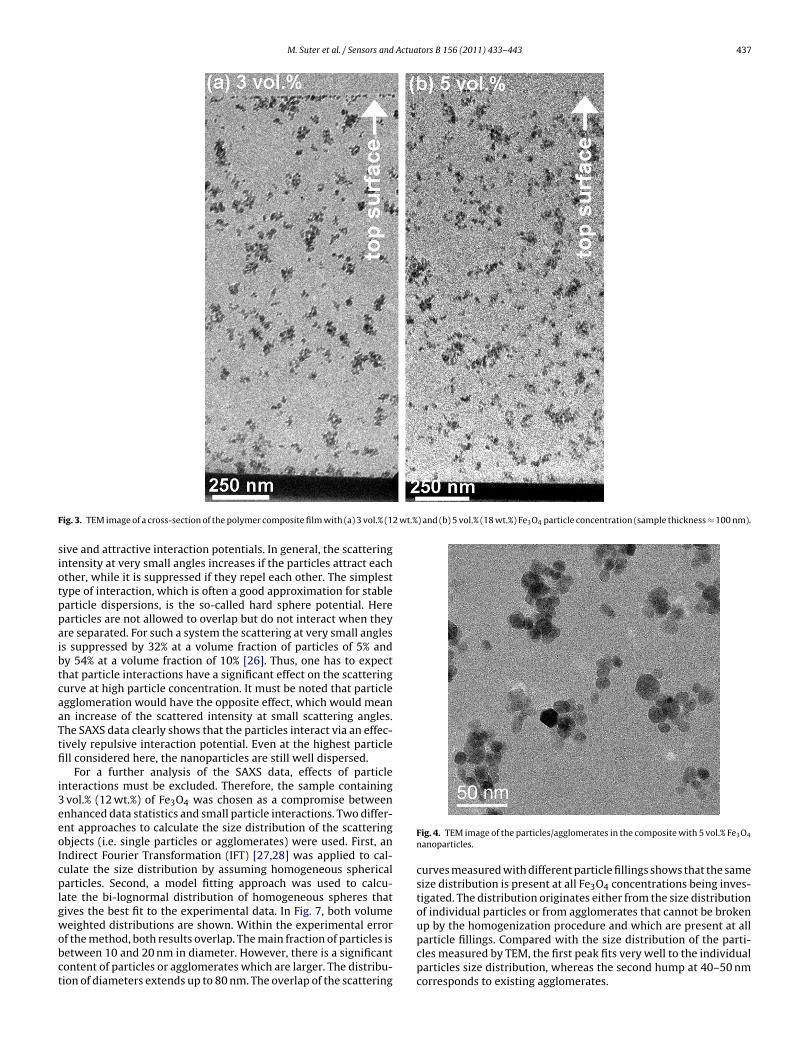
M. Suter et al. / Sensors and Actuators B 156 (2011) 433–443 437
F 2 wt.%) and (b) 5 vol.% (18 wt.%) Fe3O4 particle concentration (sample thickness ≈ 100 nm).
siotppaibtcaaTtfi
i3eeoIcplgwobct
ig. 3. TEM image of a cross-section of the polymer composite film with (a) 3 vol.% (1
ive and attractive interaction potentials. In general, the scatteringntensity at very small angles increases if the particles attract eachther, while it is suppressed if they repel each other. The simplestype of interaction, which is often a good approximation for stablearticle dispersions, is the so-called hard sphere potential. Herearticles are not allowed to overlap but do not interact when theyre separated. For such a system the scattering at very small angless suppressed by 32% at a volume fraction of particles of 5% andy 54% at a volume fraction of 10% [26]. Thus, one has to expecthat particle interactions have a significant effect on the scatteringurve at high particle concentration. It must be noted that particlegglomeration would have the opposite effect, which would meann increase of the scattered intensity at small scattering angles.he SAXS data clearly shows that the particles interact via an effec-ively repulsive interaction potential. Even at the highest particlell considered here, the nanoparticles are still well dispersed.
For a further analysis of the SAXS data, effects of particlenteractions must be excluded. Therefore, the sample containingvol.% (12 wt.%) of Fe3O4 was chosen as a compromise betweennhanced data statistics and small particle interactions. Two differ-nt approaches to calculate the size distribution of the scatteringbjects (i.e. single particles or agglomerates) were used. First, anndirect Fourier Transformation (IFT) [27,28] was applied to cal-ulate the size distribution by assuming homogeneous sphericalarticles. Second, a model fitting approach was used to calcu-
ate the bi-lognormal distribution of homogeneous spheres thatives the best fit to the experimental data. In Fig. 7, both volumeeighted distributions are shown. Within the experimental error
f the method, both results overlap. The main fraction of particles isetween 10 and 20 nm in diameter. However, there is a significantontent of particles or agglomerates which are larger. The distribu-ion of diameters extends up to 80 nm. The overlap of the scattering
Fig. 4. TEM image of the particles/agglomerates in the composite with 5 vol.% Fe3O4
nanoparticles.
curves measured with different particle fillings shows that the samesize distribution is present at all Fe3O4 concentrations being inves-tigated. The distribution originates either from the size distributionof individual particles or from agglomerates that cannot be brokenup by the homogenization procedure and which are present at all
particle fillings. Compared with the size distribution of the parti-cles measured by TEM, the first peak fits very well to the individualparticles size distribution, whereas the second hump at 40–50 nmcorresponds to existing agglomerates.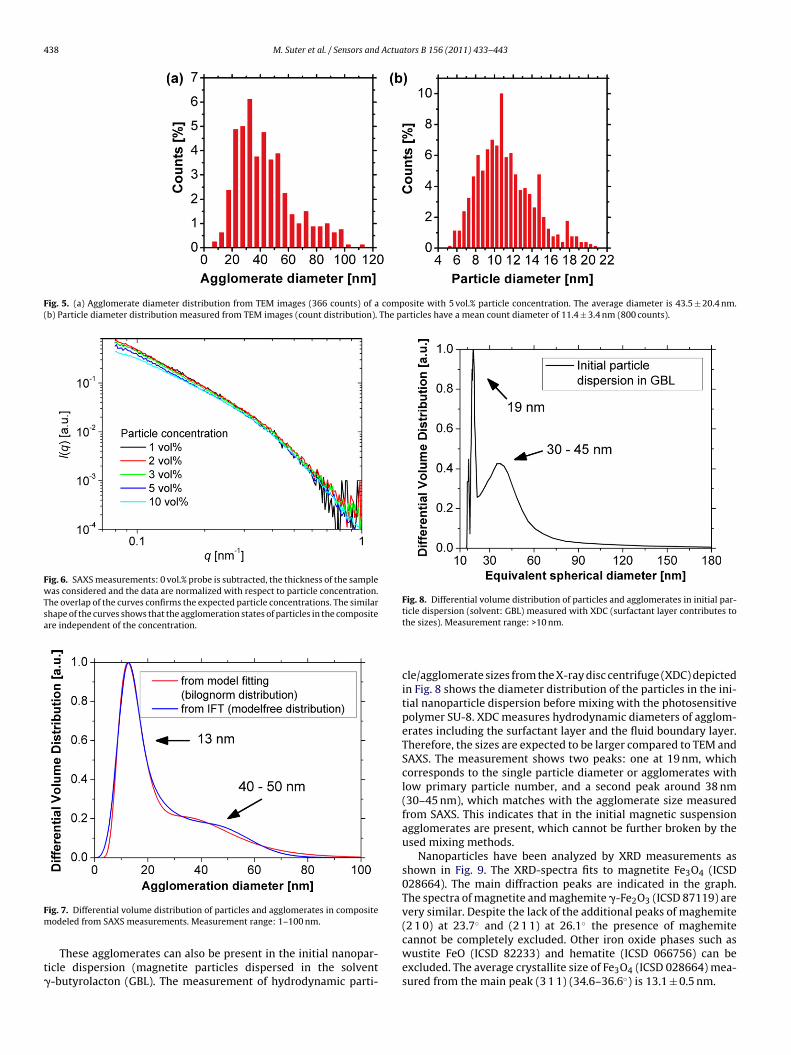
438 M. Suter et al. / Sensors and Actuators B 156 (2011) 433–443
Fig. 5. (a) Agglomerate diameter distribution from TEM images (366 counts) of a composite with 5 vol.% particle concentration. The average diameter is 43.5 ± 20.4 nm.(b) Particle diameter distribution measured from TEM images (count distribution). The particles have a mean count diameter of 11.4 ± 3.4 nm (800 counts).
Fig. 6. SAXS measurements: 0 vol.% probe is subtracted, the thickness of the samplewas considered and the data are normalized with respect to particle concentration.The overlap of the curves confirms the expected particle concentrations. The similarshape of the curves shows that the agglomeration states of particles in the compositeare independent of the concentration.
Fm
t�
Fig. 8. Differential volume distribution of particles and agglomerates in initial par-ticle dispersion (solvent: GBL) measured with XDC (surfactant layer contributes to
ig. 7. Differential volume distribution of particles and agglomerates in compositeodeled from SAXS measurements. Measurement range: 1–100 nm.
These agglomerates can also be present in the initial nanopar-icle dispersion (magnetite particles dispersed in the solvent-butyrolacton (GBL). The measurement of hydrodynamic parti-
the sizes). Measurement range: >10 nm.
cle/agglomerate sizes from the X-ray disc centrifuge (XDC) depictedin Fig. 8 shows the diameter distribution of the particles in the ini-tial nanoparticle dispersion before mixing with the photosensitivepolymer SU-8. XDC measures hydrodynamic diameters of agglom-erates including the surfactant layer and the fluid boundary layer.Therefore, the sizes are expected to be larger compared to TEM andSAXS. The measurement shows two peaks: one at 19 nm, whichcorresponds to the single particle diameter or agglomerates withlow primary particle number, and a second peak around 38 nm(30–45 nm), which matches with the agglomerate size measuredfrom SAXS. This indicates that in the initial magnetic suspensionagglomerates are present, which cannot be further broken by theused mixing methods.
Nanoparticles have been analyzed by XRD measurements asshown in Fig. 9. The XRD-spectra fits to magnetite Fe3O4 (ICSD028664). The main diffraction peaks are indicated in the graph.The spectra of magnetite and maghemite �-Fe2O3 (ICSD 87119) arevery similar. Despite the lack of the additional peaks of maghemite(2 1 0) at 23.7◦ and (2 1 1) at 26.1◦ the presence of maghemitecannot be completely excluded. Other iron oxide phases such aswustite FeO (ICSD 82233) and hematite (ICSD 066756) can be
excluded. The average crystallite size of Fe3O4 (ICSD 028664) mea-sured from the main peak (3 1 1) (34.6–36.6◦) is 13.1 ± 0.5 nm.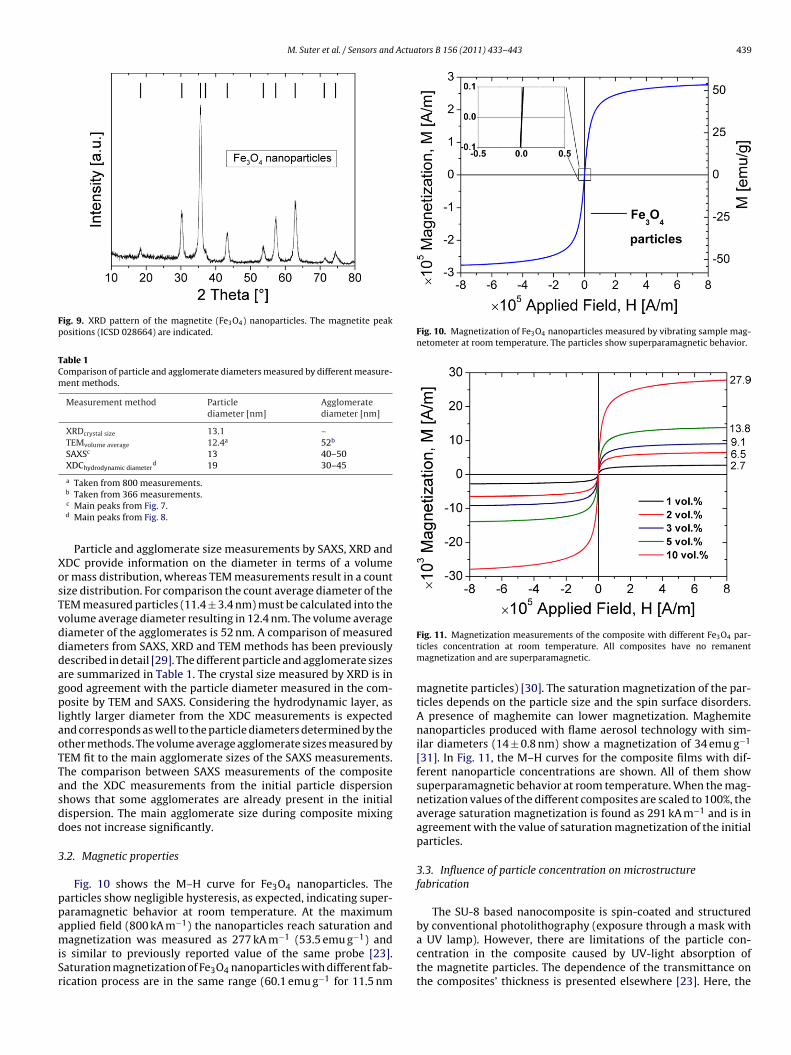
M. Suter et al. / Sensors and Actuators B 156 (2011) 433–443 439
Fig. 9. XRD pattern of the magnetite (Fe3O4) nanoparticles. The magnetite peakpositions (ICSD 028664) are indicated.
Table 1Comparison of particle and agglomerate diameters measured by different measure-ment methods.
Measurement method Particlediameter [nm]
Agglomeratediameter [nm]
XRDcrystal size 13.1 –TEMvolume average 12.4a 52b
SAXSc 13 40–50XDChydrodynamic diameter
d 19 30–45
a Taken from 800 measurements.
XosTvdddagplaoTTasdd
3
ppamiSr
Fig. 10. Magnetization of Fe3O4 nanoparticles measured by vibrating sample mag-netometer at room temperature. The particles show superparamagnetic behavior.
b Taken from 366 measurements.c Main peaks from Fig. 7.d Main peaks from Fig. 8.
Particle and agglomerate size measurements by SAXS, XRD andDC provide information on the diameter in terms of a volumer mass distribution, whereas TEM measurements result in a countize distribution. For comparison the count average diameter of theEM measured particles (11.4 ± 3.4 nm) must be calculated into theolume average diameter resulting in 12.4 nm. The volume averageiameter of the agglomerates is 52 nm. A comparison of measurediameters from SAXS, XRD and TEM methods has been previouslyescribed in detail [29]. The different particle and agglomerate sizesre summarized in Table 1. The crystal size measured by XRD is inood agreement with the particle diameter measured in the com-osite by TEM and SAXS. Considering the hydrodynamic layer, as
ightly larger diameter from the XDC measurements is expectednd corresponds as well to the particle diameters determined by thether methods. The volume average agglomerate sizes measured byEM fit to the main agglomerate sizes of the SAXS measurements.he comparison between SAXS measurements of the compositend the XDC measurements from the initial particle dispersionhows that some agglomerates are already present in the initialispersion. The main agglomerate size during composite mixingoes not increase significantly.
.2. Magnetic properties
Fig. 10 shows the M–H curve for Fe3O4 nanoparticles. Thearticles show negligible hysteresis, as expected, indicating super-aramagnetic behavior at room temperature. At the maximumpplied field (800 kA m−1) the nanoparticles reach saturation and
agnetization was measured as 277 kA m−1 (53.5 emu g−1) ands similar to previously reported value of the same probe [23].aturation magnetization of Fe3O4 nanoparticles with different fab-ication process are in the same range (60.1 emu g−1 for 11.5 nm
Fig. 11. Magnetization measurements of the composite with different Fe3O4 par-ticles concentration at room temperature. All composites have no remanentmagnetization and are superparamagnetic.
magnetite particles) [30]. The saturation magnetization of the par-ticles depends on the particle size and the spin surface disorders.A presence of maghemite can lower magnetization. Maghemitenanoparticles produced with flame aerosol technology with sim-ilar diameters (14 ± 0.8 nm) show a magnetization of 34 emu g−1
[31]. In Fig. 11, the M–H curves for the composite films with dif-ferent nanoparticle concentrations are shown. All of them showsuperparamagnetic behavior at room temperature. When the mag-netization values of the different composites are scaled to 100%, theaverage saturation magnetization is found as 291 kA m−1 and is inagreement with the value of saturation magnetization of the initialparticles.
3.3. Influence of particle concentration on microstructurefabrication
The SU-8 based nanocomposite is spin-coated and structuredby conventional photolithography (exposure through a mask with
a UV lamp). However, there are limitations of the particle con-centration in the composite caused by UV-light absorption ofthe magnetite particles. The dependence of the transmittance onthe composites’ thickness is presented elsewhere [23]. Here, the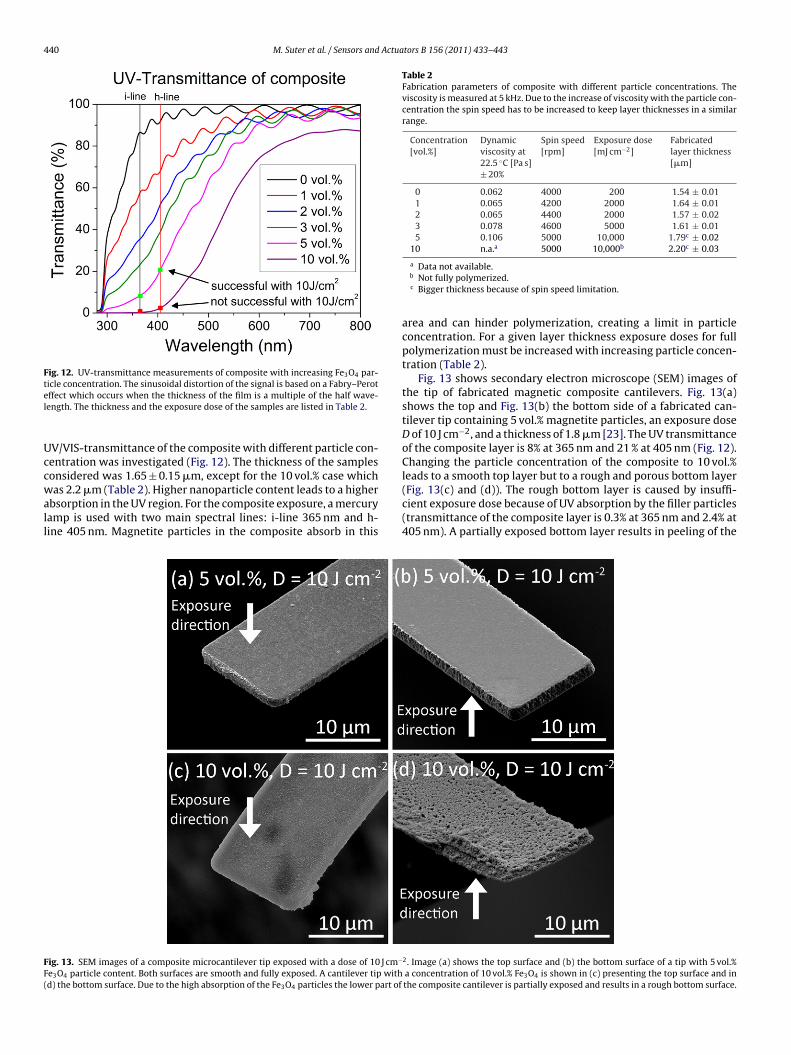
440 M. Suter et al. / Sensors and Actuators B 156 (2011) 433–443
Fig. 12. UV-transmittance measurements of composite with increasing Fe3O4 par-ticle concentration. The sinusoidal distortion of the signal is based on a Fabry–Perotel
Uccwall
Table 2Fabrication parameters of composite with different particle concentrations. Theviscosity is measured at 5 kHz. Due to the increase of viscosity with the particle con-centration the spin speed has to be increased to keep layer thicknesses in a similarrange.
Concentration[vol.%]
Dynamicviscosity at22.5 ◦C [Pa s]± 20%
Spin speed[rpm]
Exposure dose[mJ cm−2]
Fabricatedlayer thickness[�m]
0 0.062 4000 200 1.54 ± 0.011 0.065 4200 2000 1.64 ± 0.012 0.065 4400 2000 1.57 ± 0.023 0.078 4600 5000 1.61 ± 0.015 0.106 5000 10,000 1.79c ± 0.02
10 n.a.a 5000 10,000b 2.20c ± 0.03
a
(Fig. 13(c) and (d)). The rough bottom layer is caused by insuffi-
FF(
ffect which occurs when the thickness of the film is a multiple of the half wave-ength. The thickness and the exposure dose of the samples are listed in Table 2.
V/VIS-transmittance of the composite with different particle con-entration was investigated (Fig. 12). The thickness of the samplesonsidered was 1.65 ± 0.15 �m, except for the 10 vol.% case whichas 2.2 �m (Table 2). Higher nanoparticle content leads to a higher
bsorption in the UV region. For the composite exposure, a mercuryamp is used with two main spectral lines: i-line 365 nm and h-ine 405 nm. Magnetite particles in the composite absorb in this
ig. 13. SEM images of a composite microcantilever tip exposed with a dose of 10 J cm−
e3O4 particle content. Both surfaces are smooth and fully exposed. A cantilever tip withd) the bottom surface. Due to the high absorption of the Fe3O4 particles the lower part of
Data not available.b Not fully polymerized.c Bigger thickness because of spin speed limitation.
area and can hinder polymerization, creating a limit in particleconcentration. For a given layer thickness exposure doses for fullpolymerization must be increased with increasing particle concen-tration (Table 2).
Fig. 13 shows secondary electron microscope (SEM) images ofthe tip of fabricated magnetic composite cantilevers. Fig. 13(a)shows the top and Fig. 13(b) the bottom side of a fabricated can-tilever tip containing 5 vol.% magnetite particles, an exposure doseD of 10 J cm−2, and a thickness of 1.8 �m [23]. The UV transmittanceof the composite layer is 8% at 365 nm and 21 % at 405 nm (Fig. 12).Changing the particle concentration of the composite to 10 vol.%leads to a smooth top layer but to a rough and porous bottom layer
cient exposure dose because of UV absorption by the filler particles(transmittance of the composite layer is 0.3% at 365 nm and 2.4% at405 nm). A partially exposed bottom layer results in peeling of the
2. Image (a) shows the top surface and (b) the bottom surface of a tip with 5 vol.%a concentration of 10 vol.% Fe3O4 is shown in (c) presenting the top surface and inthe composite cantilever is partially exposed and results in a rough bottom surface.
M. Suter et al. / Sensors and Actuators B 156 (2011) 433–443 441
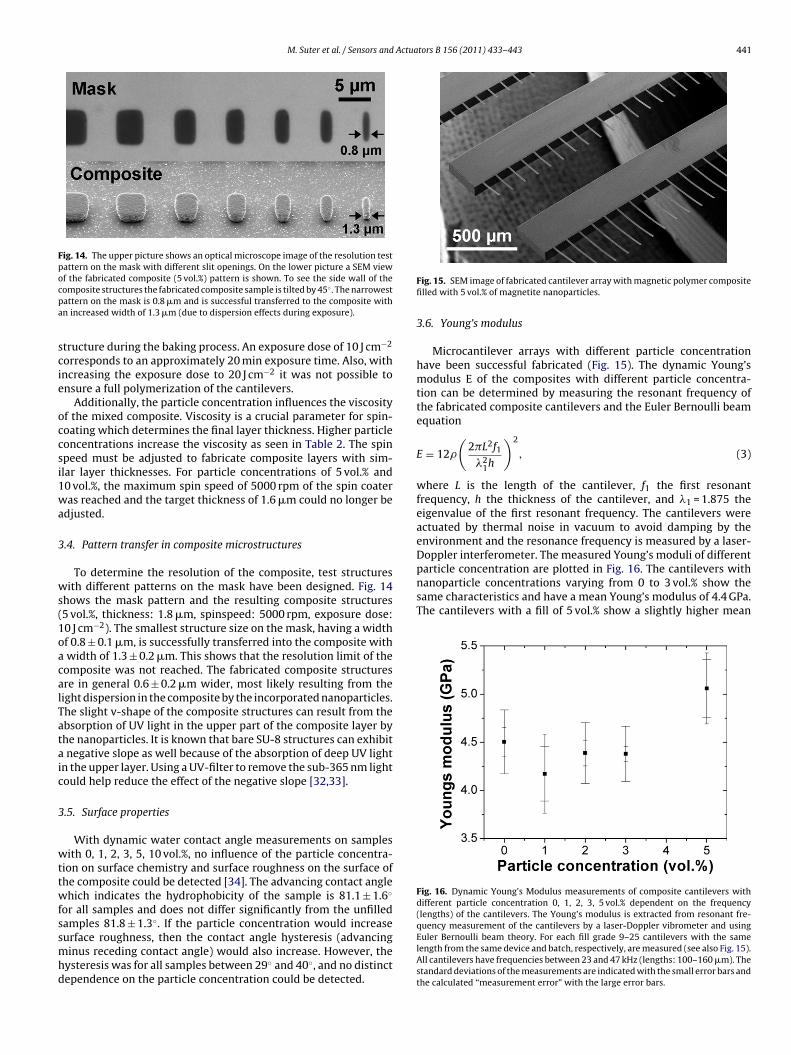
Fig. 14. The upper picture shows an optical microscope image of the resolution testpattern on the mask with different slit openings. On the lower picture a SEM viewof the fabricated composite (5 vol.%) pattern is shown. To see the side wall of thec ◦
pa
scie
occsi1wa
3
ws(1oacalTataic
3
wttwfssmhd
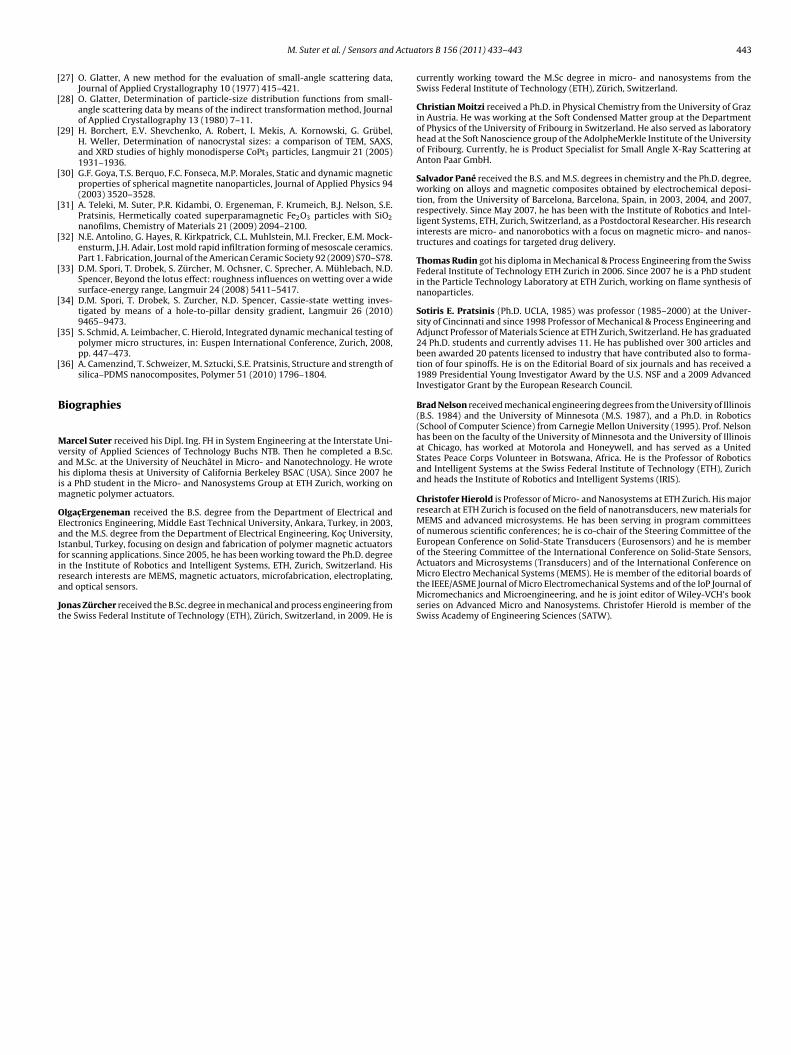
particle concentration are plotted in Fig. 16. The cantilevers withnanoparticle concentrations varying from 0 to 3 vol.% show thesame characteristics and have a mean Young’s modulus of 4.4 GPa.The cantilevers with a fill of 5 vol.% show a slightly higher mean
Fig. 16. Dynamic Young’s Modulus measurements of composite cantilevers withdifferent particle concentration 0, 1, 2, 3, 5 vol.% dependent on the frequency(lengths) of the cantilevers. The Young’s modulus is extracted from resonant fre-quency measurement of the cantilevers by a laser-Doppler vibrometer and using
omposite structures the fabricated composite sample is tilted by 45 . The narrowestattern on the mask is 0.8 �m and is successful transferred to the composite withn increased width of 1.3 �m (due to dispersion effects during exposure).
tructure during the baking process. An exposure dose of 10 J cm−2
orresponds to an approximately 20 min exposure time. Also, withncreasing the exposure dose to 20 J cm−2 it was not possible tonsure a full polymerization of the cantilevers.
Additionally, the particle concentration influences the viscosityf the mixed composite. Viscosity is a crucial parameter for spin-oating which determines the final layer thickness. Higher particleoncentrations increase the viscosity as seen in Table 2. The spinpeed must be adjusted to fabricate composite layers with sim-lar layer thicknesses. For particle concentrations of 5 vol.% and0 vol.%, the maximum spin speed of 5000 rpm of the spin coateras reached and the target thickness of 1.6 �m could no longer be
djusted.
.4. Pattern transfer in composite microstructures
To determine the resolution of the composite, test structuresith different patterns on the mask have been designed. Fig. 14
hows the mask pattern and the resulting composite structures5 vol.%, thickness: 1.8 �m, spinspeed: 5000 rpm, exposure dose:0 J cm−2). The smallest structure size on the mask, having a widthf 0.8 ± 0.1 �m, is successfully transferred into the composite withwidth of 1.3 ± 0.2 �m. This shows that the resolution limit of the
omposite was not reached. The fabricated composite structuresre in general 0.6 ± 0.2 �m wider, most likely resulting from theight dispersion in the composite by the incorporated nanoparticles.he slight v-shape of the composite structures can result from thebsorption of UV light in the upper part of the composite layer byhe nanoparticles. It is known that bare SU-8 structures can exhibitnegative slope as well because of the absorption of deep UV light
n the upper layer. Using a UV-filter to remove the sub-365 nm lightould help reduce the effect of the negative slope [32,33].
.5. Surface properties
With dynamic water contact angle measurements on samplesith 0, 1, 2, 3, 5, 10 vol.%, no influence of the particle concentra-
ion on surface chemistry and surface roughness on the surface ofhe composite could be detected [34]. The advancing contact anglehich indicates the hydrophobicity of the sample is 81.1 ± 1.6◦
or all samples and does not differ significantly from the unfilledamples 81.8 ± 1.3◦. If the particle concentration would increase
urface roughness, then the contact angle hysteresis (advancinginus receding contact angle) would also increase. However, theysteresis was for all samples between 29◦ and 40◦, and no distinctependence on the particle concentration could be detected.
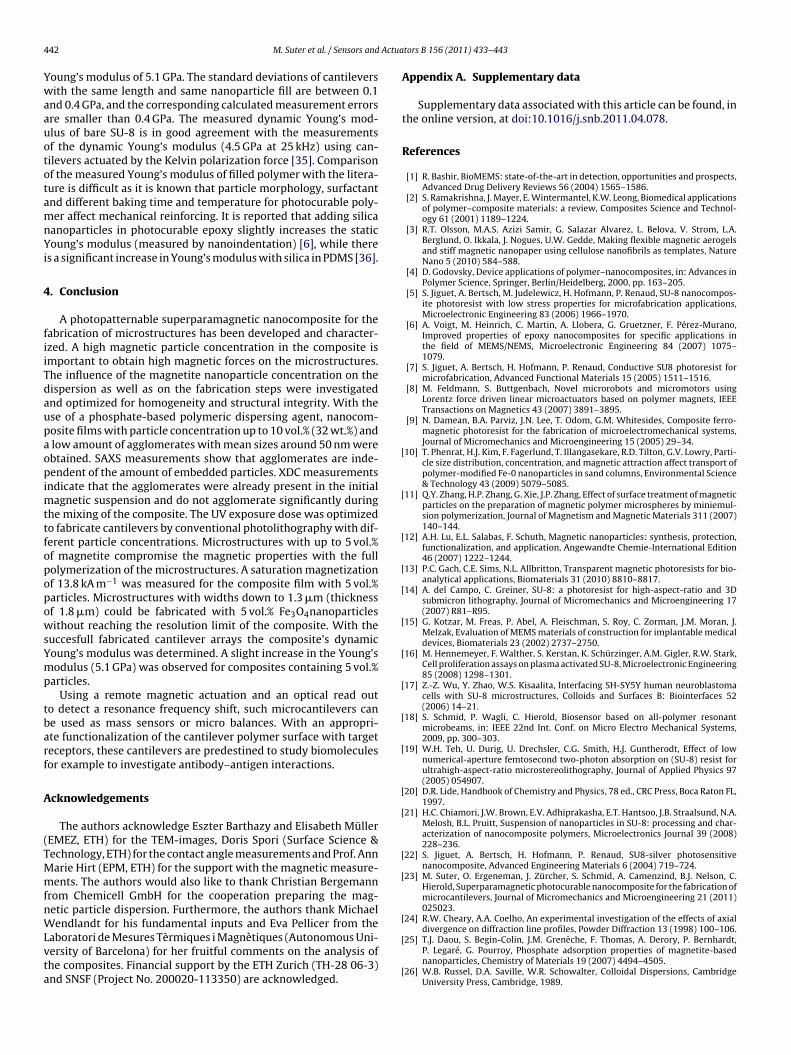
Fig. 15. SEM image of fabricated cantilever array with magnetic polymer compositefilled with 5 vol.% of magnetite nanoparticles.
3.6. Young’s modulus
Microcantilever arrays with different particle concentrationhave been successful fabricated (Fig. 15). The dynamic Young’smodulus E of the composites with different particle concentra-tion can be determined by measuring the resonant frequency ofthe fabricated composite cantilevers and the Euler Bernoulli beamequation
E = 12�
(2�L2f1
�21h
)2
, (3)
where L is the length of the cantilever, f1 the first resonantfrequency, h the thickness of the cantilever, and �1 = 1.875 theeigenvalue of the first resonant frequency. The cantilevers wereactuated by thermal noise in vacuum to avoid damping by theenvironment and the resonance frequency is measured by a laser-Doppler interferometer. The measured Young’s moduli of different
Euler Bernoulli beam theory. For each fill grade 9–25 cantilevers with the samelength from the same device and batch, respectively, are measured (see also Fig. 15).All cantilevers have frequencies between 23 and 47 kHz (lengths: 100–160 �m). Thestandard deviations of the measurements are indicated with the small error bars andthe calculated “measurement error” with the large error bars.
4 Actua
YwaauototamnYi
4
fiiTdaupaopimttfopopowsYmp
tbarf
A
(TMmfnWLvta
[
[
[
[
[
[
[
[
[
[
[
[
[
[
[
42 M. Suter et al. / Sensors and
oung’s modulus of 5.1 GPa. The standard deviations of cantileversith the same length and same nanoparticle fill are between 0.1
nd 0.4 GPa, and the corresponding calculated measurement errorsre smaller than 0.4 GPa. The measured dynamic Young’s mod-lus of bare SU-8 is in good agreement with the measurementsf the dynamic Young’s modulus (4.5 GPa at 25 kHz) using can-ilevers actuated by the Kelvin polarization force [35]. Comparisonf the measured Young’s modulus of filled polymer with the litera-ure is difficult as it is known that particle morphology, surfactantnd different baking time and temperature for photocurable poly-er affect mechanical reinforcing. It is reported that adding silica
anoparticles in photocurable epoxy slightly increases the staticoung’s modulus (measured by nanoindentation) [6], while there
s a significant increase in Young’s modulus with silica in PDMS [36].
. Conclusion
A photopatternable superparamagnetic nanocomposite for theabrication of microstructures has been developed and character-zed. A high magnetic particle concentration in the composite ismportant to obtain high magnetic forces on the microstructures.he influence of the magnetite nanoparticle concentration on theispersion as well as on the fabrication steps were investigatednd optimized for homogeneity and structural integrity. With these of a phosphate-based polymeric dispersing agent, nanocom-osite films with particle concentration up to 10 vol.% (32 wt.%) andlow amount of agglomerates with mean sizes around 50 nm werebtained. SAXS measurements show that agglomerates are inde-endent of the amount of embedded particles. XDC measurements
ndicate that the agglomerates were already present in the initialagnetic suspension and do not agglomerate significantly during
he mixing of the composite. The UV exposure dose was optimizedo fabricate cantilevers by conventional photolithography with dif-erent particle concentrations. Microstructures with up to 5 vol.%f magnetite compromise the magnetic properties with the fullolymerization of the microstructures. A saturation magnetizationf 13.8 kA m−1 was measured for the composite film with 5 vol.%articles. Microstructures with widths down to 1.3 �m (thicknessf 1.8 �m) could be fabricated with 5 vol.% Fe3O4nanoparticlesithout reaching the resolution limit of the composite. With the
uccesfull fabricated cantilever arrays the composite’s dynamicoung’s modulus was determined. A slight increase in the Young’sodulus (5.1 GPa) was observed for composites containing 5 vol.%
articles.Using a remote magnetic actuation and an optical read out
o detect a resonance frequency shift, such microcantilevers cane used as mass sensors or micro balances. With an appropri-te functionalization of the cantilever polymer surface with targeteceptors, these cantilevers are predestined to study biomoleculesor example to investigate antibody–antigen interactions.
cknowledgements
The authors acknowledge Eszter Barthazy and Elisabeth MüllerEMEZ, ETH) for the TEM-images, Doris Spori (Surface Science &echnology, ETH) for the contact angle measurements and Prof. Annarie Hirt (EPM, ETH) for the support with the magnetic measure-ents. The authors would also like to thank Christian Bergemann
rom Chemicell GmbH for the cooperation preparing the mag-etic particle dispersion. Furthermore, the authors thank Michaelendlandt for his fundamental inputs and Eva Pellicer from the
aboratori de Mesures Tèrmiques i Magnètiques (Autonomous Uni-ersity of Barcelona) for her fruitful comments on the analysis ofhe composites. Financial support by the ETH Zurich (TH-28 06-3)nd SNSF (Project No. 200020-113350) are acknowledged.
[
[
tors B 156 (2011) 433–443
Appendix A. Supplementary data
Supplementary data associated with this article can be found, inthe online version, at doi:10.1016/j.snb.2011.04.078.
References
[1] R. Bashir, BioMEMS: state-of-the-art in detection, opportunities and prospects,Advanced Drug Delivery Reviews 56 (2004) 1565–1586.
[2] S. Ramakrishna, J. Mayer, E. Wintermantel, K.W. Leong, Biomedical applicationsof polymer–composite materials: a review, Composites Science and Technol-ogy 61 (2001) 1189–1224.
[3] R.T. Olsson, M.A.S. Azizi Samir, G. Salazar Alvarez, L. Belova, V. Strom, L.A.Berglund, O. Ikkala, J. Nogues, U.W. Gedde, Making flexible magnetic aerogelsand stiff magnetic nanopaper using cellulose nanofibrils as templates, NatureNano 5 (2010) 584–588.
[4] D. Godovsky, Device applications of polymer–nanocomposites, in: Advances inPolymer Science, Springer, Berlin/Heidelberg, 2000, pp. 163–205.
[5] S. Jiguet, A. Bertsch, M. Judelewicz, H. Hofmann, P. Renaud, SU-8 nanocompos-ite photoresist with low stress properties for microfabrication applications,Microelectronic Engineering 83 (2006) 1966–1970.
[6] A. Voigt, M. Heinrich, C. Martin, A. Llobera, G. Gruetzner, F. Pérez-Murano,Improved properties of epoxy nanocomposites for specific applications inthe field of MEMS/NEMS, Microelectronic Engineering 84 (2007) 1075–1079.
[7] S. Jiguet, A. Bertsch, H. Hofmann, P. Renaud, Conductive SU8 photoresist formicrofabrication, Advanced Functional Materials 15 (2005) 1511–1516.
[8] M. Feldmann, S. Buttgenbach, Novel microrobots and micromotors usingLorentz force driven linear microactuators based on polymer magnets, IEEETransactions on Magnetics 43 (2007) 3891–3895.
[9] N. Damean, B.A. Parviz, J.N. Lee, T. Odom, G.M. Whitesides, Composite ferro-magnetic photoresist for the fabrication of microelectromechanical systems,Journal of Micromechanics and Microengineering 15 (2005) 29–34.
10] T. Phenrat, H.J. Kim, F. Fagerlund, T. Illangasekare, R.D. Tilton, G.V. Lowry, Parti-cle size distribution, concentration, and magnetic attraction affect transport ofpolymer-modified Fe-0 nanoparticles in sand columns, Environmental Science& Technology 43 (2009) 5079–5085.
11] Q.Y. Zhang, H.P. Zhang, G. Xie, J.P. Zhang, Effect of surface treatment of magneticparticles on the preparation of magnetic polymer microspheres by miniemul-sion polymerization, Journal of Magnetism and Magnetic Materials 311 (2007)140–144.
12] A.H. Lu, E.L. Salabas, F. Schuth, Magnetic nanoparticles: synthesis, protection,functionalization, and application, Angewandte Chemie-International Edition46 (2007) 1222–1244.
13] P.C. Gach, C.E. Sims, N.L. Allbritton, Transparent magnetic photoresists for bio-analytical applications, Biomaterials 31 (2010) 8810–8817.
14] A. del Campo, C. Greiner, SU-8: a photoresist for high-aspect-ratio and 3Dsubmicron lithography, Journal of Micromechanics and Microengineering 17(2007) R81–R95.
15] G. Kotzar, M. Freas, P. Abel, A. Fleischman, S. Roy, C. Zorman, J.M. Moran, J.Melzak, Evaluation of MEMS materials of construction for implantable medicaldevices, Biomaterials 23 (2002) 2737–2750.
16] M. Hennemeyer, F. Walther, S. Kerstan, K. Schürzinger, A.M. Gigler, R.W. Stark,Cell proliferation assays on plasma activated SU-8, Microelectronic Engineering85 (2008) 1298–1301.
17] Z.-Z. Wu, Y. Zhao, W.S. Kisaalita, Interfacing SH-SY5Y human neuroblastomacells with SU-8 microstructures, Colloids and Surfaces B: Biointerfaces 52(2006) 14–21.
18] S. Schmid, P. Wagli, C. Hierold, Biosensor based on all-polymer resonantmicrobeams, in: IEEE 22nd Int. Conf. on Micro Electro Mechanical Systems,2009, pp. 300–303.
19] W.H. Teh, U. Durig, U. Drechsler, C.G. Smith, H.J. Guntherodt, Effect of lownumerical-aperture femtosecond two-photon absorption on (SU-8) resist forultrahigh-aspect-ratio microstereolithography, Journal of Applied Physics 97(2005) 054907.
20] D.R. Lide, Handbook of Chemistry and Physics, 78 ed., CRC Press, Boca Raton FL,1997.
21] H.C. Chiamori, J.W. Brown, E.V. Adhiprakasha, E.T. Hantsoo, J.B. Straalsund, N.A.Melosh, B.L. Pruitt, Suspension of nanoparticles in SU-8: processing and char-acterization of nanocomposite polymers, Microelectronics Journal 39 (2008)228–236.
22] S. Jiguet, A. Bertsch, H. Hofmann, P. Renaud, SU8-silver photosensitivenanocomposite, Advanced Engineering Materials 6 (2004) 719–724.
23] M. Suter, O. Ergeneman, J. Zürcher, S. Schmid, A. Camenzind, B.J. Nelson, C.Hierold, Superparamagnetic photocurable nanocomposite for the fabrication ofmicrocantilevers, Journal of Micromechanics and Microengineering 21 (2011)025023.
24] R.W. Cheary, A.A. Coelho, An experimental investigation of the effects of axialdivergence on diffraction line profiles, Powder Diffraction 13 (1998) 100–106.
25] T.J. Daou, S. Begin-Colin, J.M. Grenèche, F. Thomas, A. Derory, P. Bernhardt,P. Legaré, G. Pourroy, Phosphate adsorption properties of magnetite-basednanoparticles, Chemistry of Materials 19 (2007) 4494–4505.
26] W.B. Russel, D.A. Saville, W.R. Schowalter, Colloidal Dispersions, CambridgeUniversity Press, Cambridge, 1989.
Actua
[
[
[
[
[
[
[
[
[
[
B
Mvahim
OEaIfira
Jt
M. Suter et al. / Sensors and
27] O. Glatter, A new method for the evaluation of small-angle scattering data,Journal of Applied Crystallography 10 (1977) 415–421.
28] O. Glatter, Determination of particle-size distribution functions from small-angle scattering data by means of the indirect transformation method, Journalof Applied Crystallography 13 (1980) 7–11.
29] H. Borchert, E.V. Shevchenko, A. Robert, I. Mekis, A. Kornowski, G. Grübel,H. Weller, Determination of nanocrystal sizes: a comparison of TEM, SAXS,and XRD studies of highly monodisperse CoPt3 particles, Langmuir 21 (2005)1931–1936.
30] G.F. Goya, T.S. Berquo, F.C. Fonseca, M.P. Morales, Static and dynamic magneticproperties of spherical magnetite nanoparticles, Journal of Applied Physics 94(2003) 3520–3528.
31] A. Teleki, M. Suter, P.R. Kidambi, O. Ergeneman, F. Krumeich, B.J. Nelson, S.E.Pratsinis, Hermetically coated superparamagnetic Fe2O3 particles with SiO2
nanofilms, Chemistry of Materials 21 (2009) 2094–2100.32] N.E. Antolino, G. Hayes, R. Kirkpatrick, C.L. Muhlstein, M.I. Frecker, E.M. Mock-
ensturm, J.H. Adair, Lost mold rapid infiltration forming of mesoscale ceramics.Part 1. Fabrication, Journal of the American Ceramic Society 92 (2009) S70–S78.
33] D.M. Spori, T. Drobek, S. Zürcher, M. Ochsner, C. Sprecher, A. Mühlebach, N.D.Spencer, Beyond the lotus effect: roughness influences on wetting over a widesurface-energy range, Langmuir 24 (2008) 5411–5417.
34] D.M. Spori, T. Drobek, S. Zurcher, N.D. Spencer, Cassie-state wetting inves-tigated by means of a hole-to-pillar density gradient, Langmuir 26 (2010)9465–9473.
35] S. Schmid, A. Leimbacher, C. Hierold, Integrated dynamic mechanical testing ofpolymer micro structures, in: Euspen International Conference, Zurich, 2008,pp. 447–473.
36] A. Camenzind, T. Schweizer, M. Sztucki, S.E. Pratsinis, Structure and strength ofsilica–PDMS nanocomposites, Polymer 51 (2010) 1796–1804.
iographies
arcel Suter received his Dipl. Ing. FH in System Engineering at the Interstate Uni-ersity of Applied Sciences of Technology Buchs NTB. Then he completed a B.Sc.nd M.Sc. at the University of Neuchâtel in Micro- and Nanotechnology. He wroteis diploma thesis at University of California Berkeley BSAC (USA). Since 2007 he
s a PhD student in the Micro- and Nanosystems Group at ETH Zurich, working onagnetic polymer actuators.
lgacErgeneman received the B.S. degree from the Department of Electrical andlectronics Engineering, Middle East Technical University, Ankara, Turkey, in 2003,nd the M.S. degree from the Department of Electrical Engineering, Koc University,stanbul, Turkey, focusing on design and fabrication of polymer magnetic actuatorsor scanning applications. Since 2005, he has been working toward the Ph.D. degreen the Institute of Robotics and Intelligent Systems, ETH, Zurich, Switzerland. His
esearch interests are MEMS, magnetic actuators, microfabrication, electroplating,nd optical sensors.onas Zürcher received the B.Sc. degree in mechanical and process engineering fromhe Swiss Federal Institute of Technology (ETH), Zürich, Switzerland, in 2009. He is
tors B 156 (2011) 433–443 443
currently working toward the M.Sc degree in micro- and nanosystems from theSwiss Federal Institute of Technology (ETH), Zürich, Switzerland.
Christian Moitzi received a Ph.D. in Physical Chemistry from the University of Grazin Austria. He was working at the Soft Condensed Matter group at the Departmentof Physics of the University of Fribourg in Switzerland. He also served as laboratoryhead at the Soft Nanoscience group of the AdolpheMerkle Institute of the Universityof Fribourg. Currently, he is Product Specialist for Small Angle X-Ray Scattering atAnton Paar GmbH.
Salvador Pané received the B.S. and M.S. degrees in chemistry and the Ph.D. degree,working on alloys and magnetic composites obtained by electrochemical deposi-tion, from the University of Barcelona, Barcelona, Spain, in 2003, 2004, and 2007,respectively. Since May 2007, he has been with the Institute of Robotics and Intel-ligent Systems, ETH, Zurich, Switzerland, as a Postdoctoral Researcher. His researchinterests are micro- and nanorobotics with a focus on magnetic micro- and nanos-tructures and coatings for targeted drug delivery.
Thomas Rudin got his diploma in Mechanical & Process Engineering from the SwissFederal Institute of Technology ETH Zurich in 2006. Since 2007 he is a PhD studentin the Particle Technology Laboratory at ETH Zurich, working on flame synthesis ofnanoparticles.
Sotiris E. Pratsinis (Ph.D. UCLA, 1985) was professor (1985–2000) at the Univer-sity of Cincinnati and since 1998 Professor of Mechanical & Process Engineering andAdjunct Professor of Materials Science at ETH Zurich, Switzerland. He has graduated24 Ph.D. students and currently advises 11. He has published over 300 articles andbeen awarded 20 patents licensed to industry that have contributed also to forma-tion of four spinoffs. He is on the Editorial Board of six journals and has received a1989 Presidential Young Investigator Award by the U.S. NSF and a 2009 AdvancedInvestigator Grant by the European Research Council.
Brad Nelson received mechanical engineering degrees from the University of Illinois(B.S. 1984) and the University of Minnesota (M.S. 1987), and a Ph.D. in Robotics(School of Computer Science) from Carnegie Mellon University (1995). Prof. Nelsonhas been on the faculty of the University of Minnesota and the University of Illinoisat Chicago, has worked at Motorola and Honeywell, and has served as a UnitedStates Peace Corps Volunteer in Botswana, Africa. He is the Professor of Roboticsand Intelligent Systems at the Swiss Federal Institute of Technology (ETH), Zurichand heads the Institute of Robotics and Intelligent Systems (IRIS).
Christofer Hierold is Professor of Micro- and Nanosystems at ETH Zurich. His majorresearch at ETH Zurich is focused on the field of nanotransducers, new materials forMEMS and advanced microsystems. He has been serving in program committeesof numerous scientific conferences; he is co-chair of the Steering Committee of theEuropean Conference on Solid-State Transducers (Eurosensors) and he is memberof the Steering Committee of the International Conference on Solid-State Sensors,Actuators and Microsystems (Transducers) and of the International Conference on
Micro Electro Mechanical Systems (MEMS). He is member of the editorial boards ofthe IEEE/ASME Journal of Micro Electromechanical Systems and of the IoP Journal ofMicromechanics and Microengineering, and he is joint editor of Wiley-VCH’s bookseries on Advanced Micro and Nanosystems. Christofer Hierold is member of theSwiss Academy of Engineering Sciences (SATW).


![Nanocomposite [5]](https://img.pdfslide.us/doc/110x75/577c7ecf1a28abe054a26499/nanocomposite-5.jpg)
