Embed Size (px)
Citation preview
A Perspective on Florida’s Large-
Scale Wetland Treatment Systems
for Phosphorus Removal
Thomas A. DeBusk1 and William F. DeBusk2
1DB Environmental, Inc. 2Water Resources Group, LLC
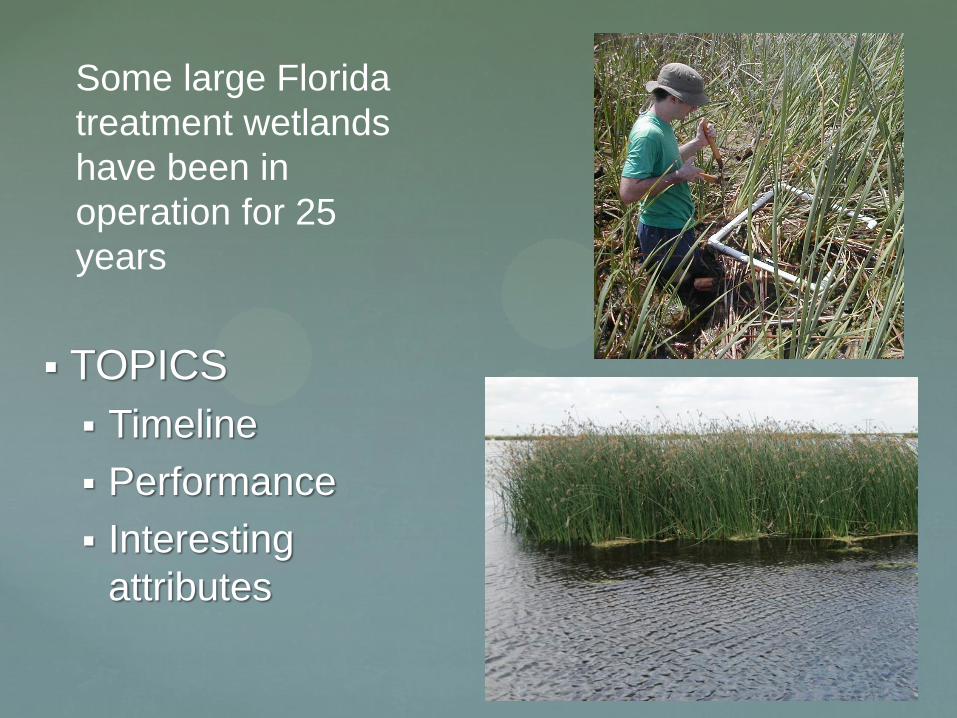
Some large Florida
treatment wetlands
have been in
operation for 25
years
TOPICS
Timeline
Performance
Interesting
attributes
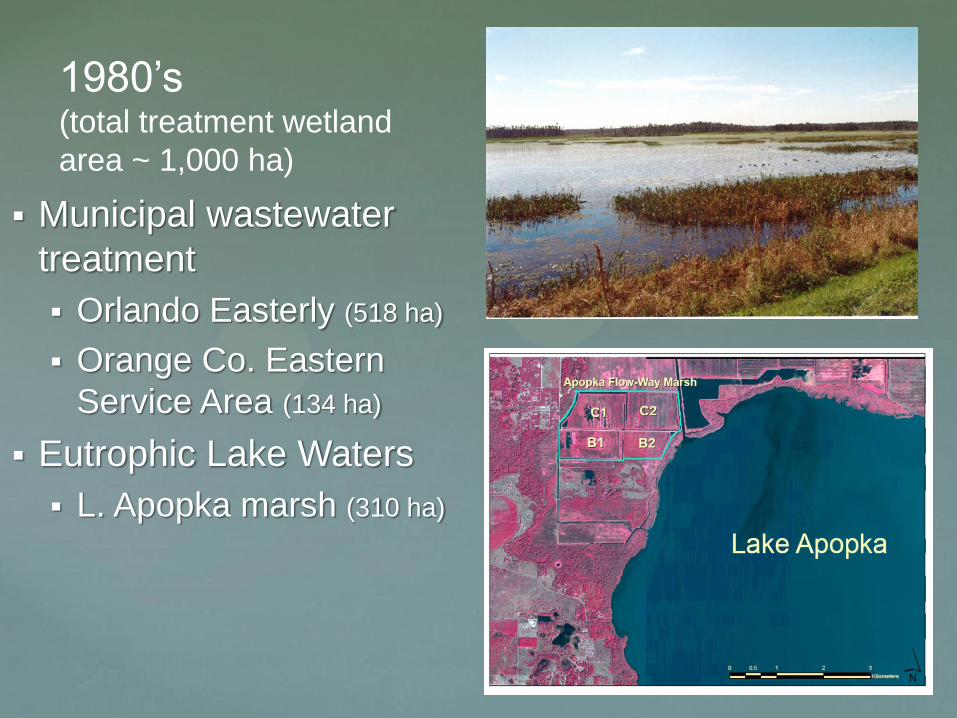
1980’s (total treatment wetland
area ~ 1,000 ha)
Municipal wastewater
treatment
Orlando Easterly (518 ha)
Orange Co. Eastern
Service Area (134 ha)
Eutrophic Lake Waters
L. Apopka marsh (310 ha)
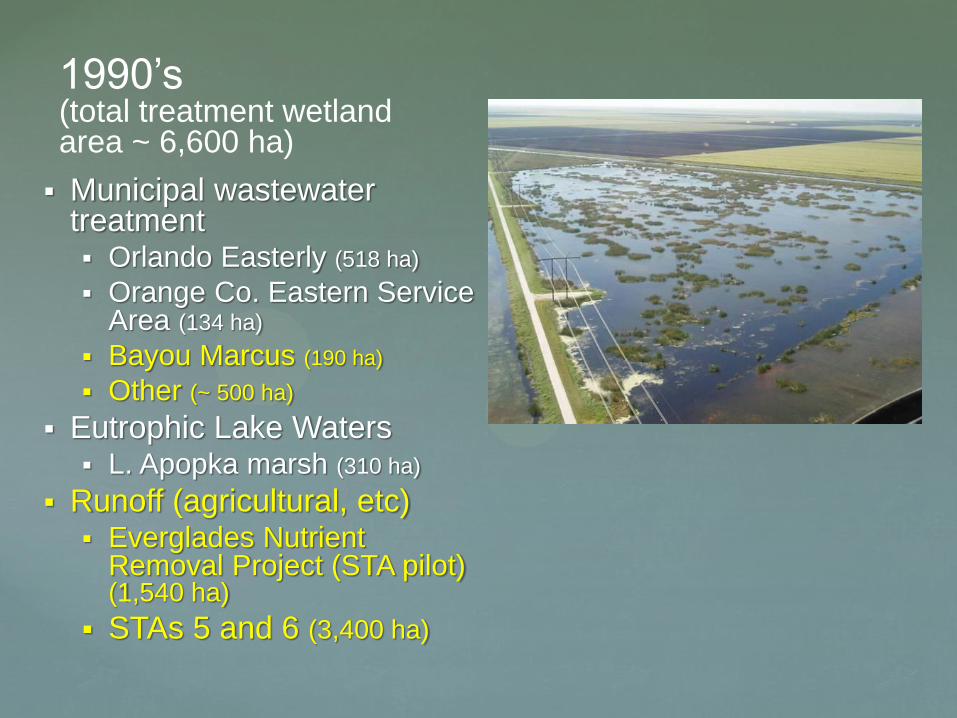
Municipal wastewater treatment Orlando Easterly (518 ha)
Orange Co. Eastern Service Area (134 ha)
Bayou Marcus (190 ha)
Other (~ 500 ha)
Eutrophic Lake Waters L. Apopka marsh (310 ha)
Runoff (agricultural, etc) Everglades Nutrient
Removal Project (STA pilot) (1,540 ha)
STAs 5 and 6 (3,400 ha)
1990’s (total treatment wetland area ~ 6,600 ha)
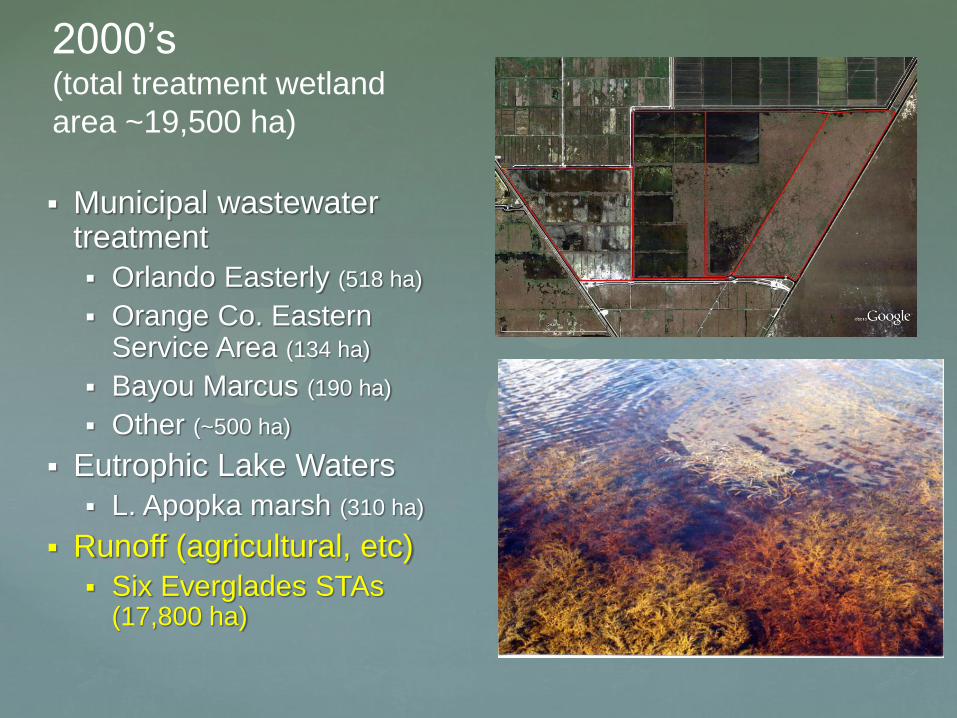
2000’s (total treatment wetland
area ~19,500 ha)
Municipal wastewater treatment
Orlando Easterly (518 ha)
Orange Co. Eastern Service Area (134 ha)
Bayou Marcus (190 ha)
Other (~500 ha)
Eutrophic Lake Waters
L. Apopka marsh (310 ha)
Runoff (agricultural, etc)
Six Everglades STAs (17,800 ha)
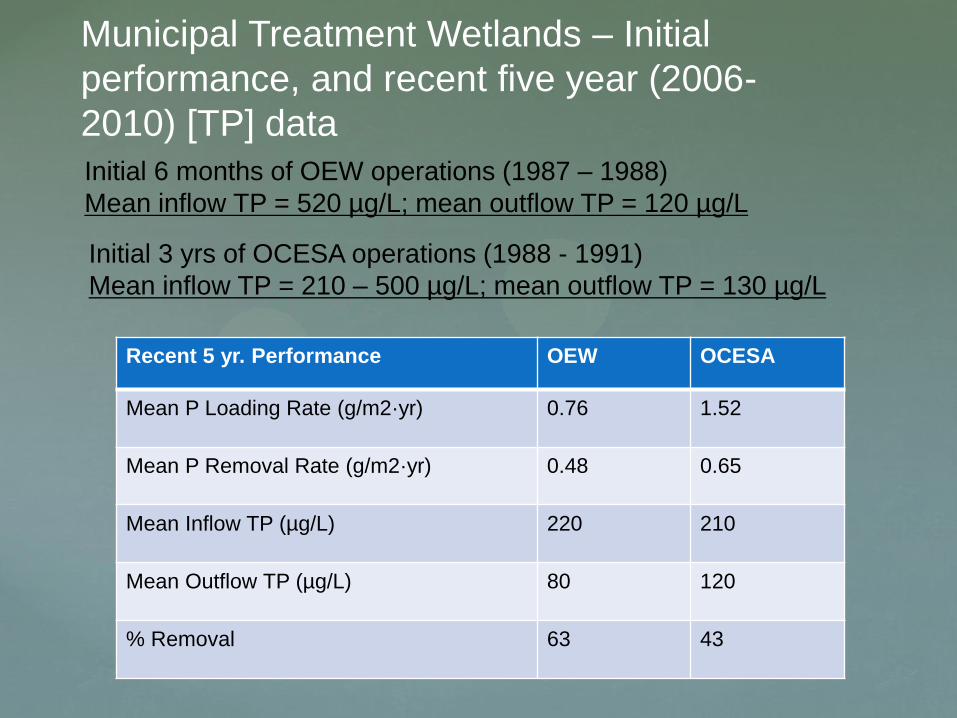
Municipal Treatment Wetlands – Initial
performance, and recent five year (2006-
2010) [TP] data
Recent 5 yr. Performance OEW OCESA
Mean P Loading Rate (g/m2·yr) 0.76 1.52
Mean P Removal Rate (g/m2·yr) 0.48 0.65
Mean Inflow TP (µg/L) 220 210
Mean Outflow TP (µg/L) 80 120
% Removal 63 43
Initial 6 months of OEW operations (1987 – 1988)
Mean inflow TP = 520 µg/L; mean outflow TP = 120 µg/L
Initial 3 yrs of OCESA operations (1988 - 1991)
Mean inflow TP = 210 – 500 µg/L; mean outflow TP = 130 µg/L
2
1
11
12
15
3
4
5
6
7
8
9
10
13
14
17
16B
16A
L
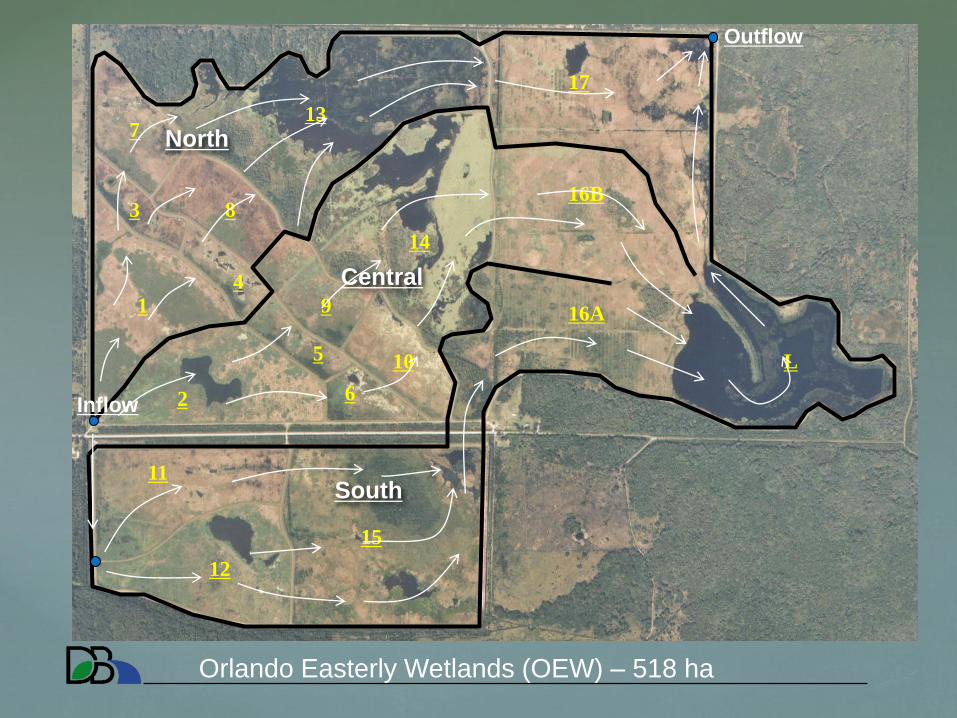
Inflow
Outflow
North
Central
South
Orlando Easterly Wetlands (OEW) – 518 ha
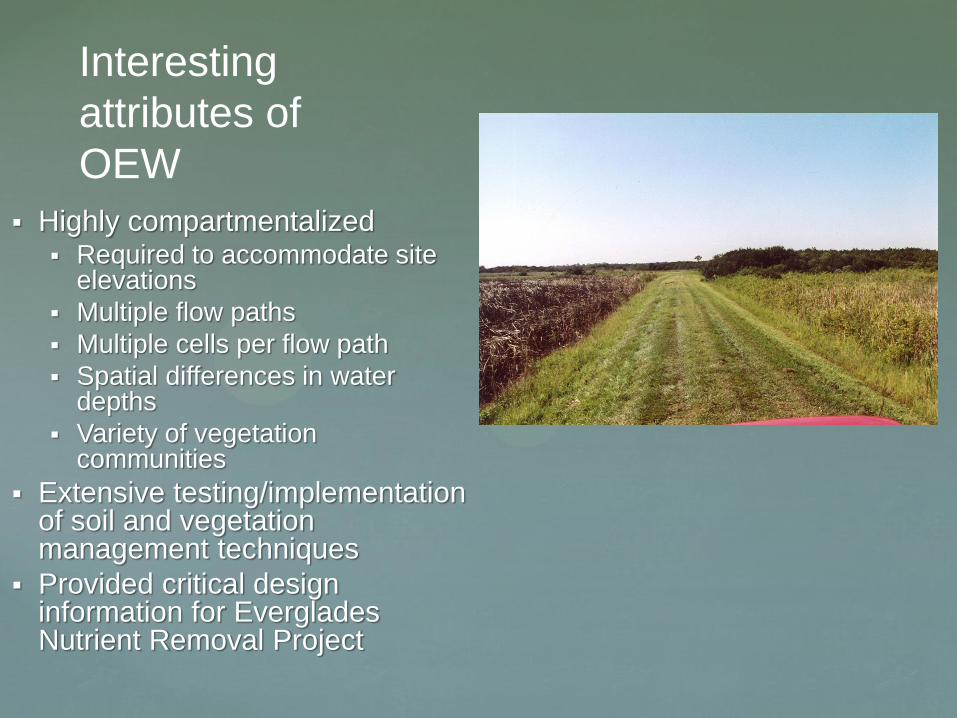
Interesting
attributes of
OEW
Highly compartmentalized Required to accommodate site
elevations
Multiple flow paths
Multiple cells per flow path
Spatial differences in water depths
Variety of vegetation communities
Extensive testing/implementation of soil and vegetation management techniques
Provided critical design information for Everglades Nutrient Removal Project
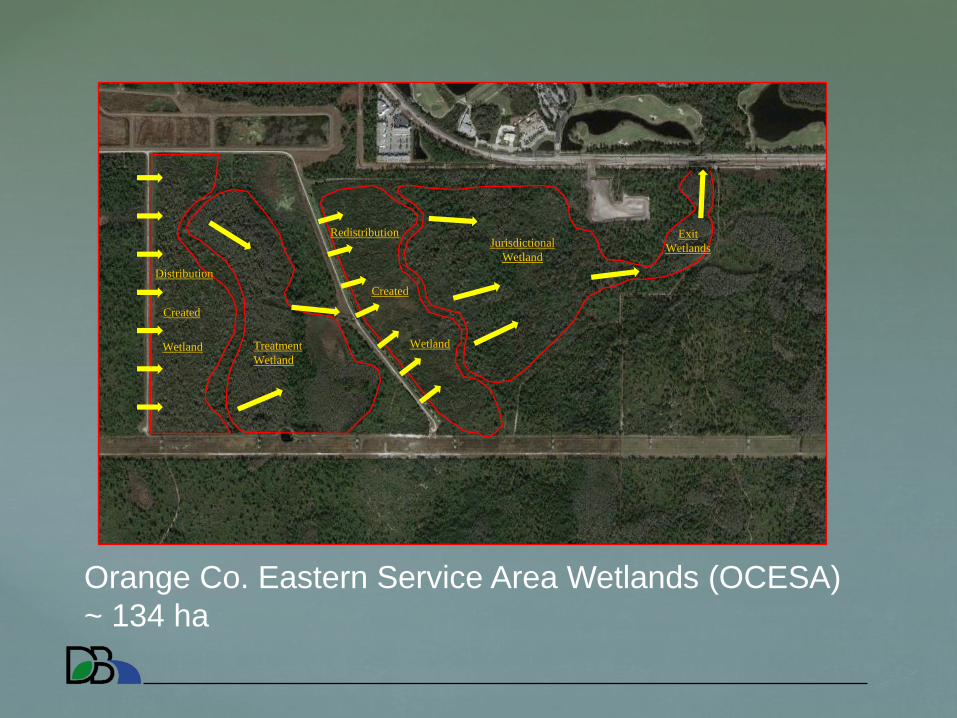
Jurisdictional
Wetland
Exit
Wetlands
Redistribution
Treatment
Wetland
Created
Wetland
Distribution
Created
Wetland
Orange Co. Eastern Service Area Wetlands (OCESA)
~ 134 ha
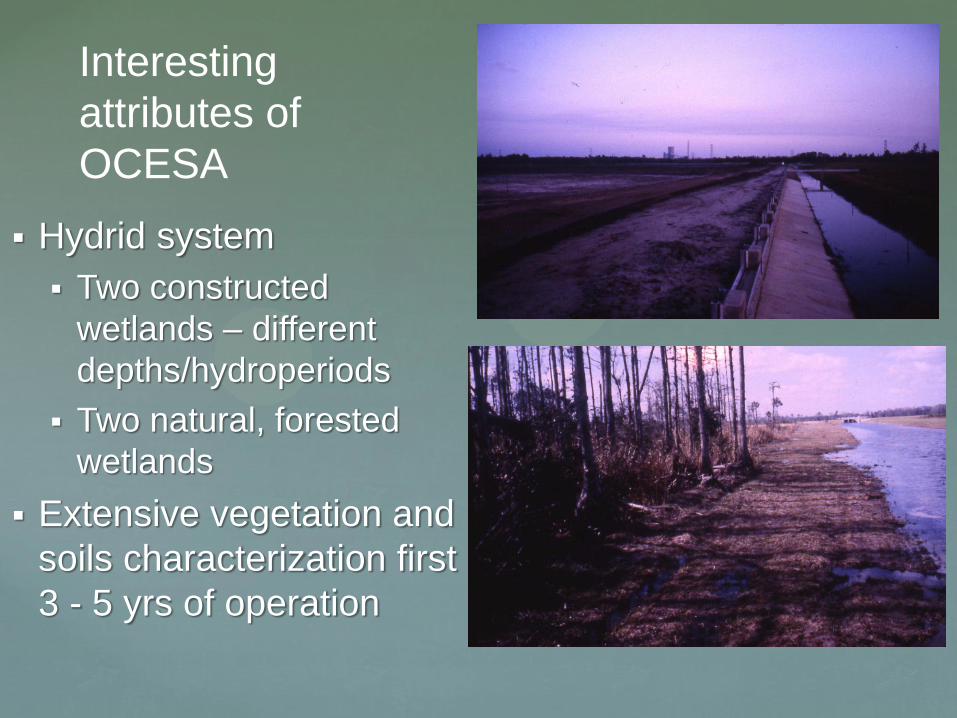
Interesting
attributes of
OCESA
Hydrid system
Two constructed
wetlands – different
depths/hydroperiods
Two natural, forested
wetlands
Extensive vegetation and
soils characterization first
3 - 5 yrs of operation
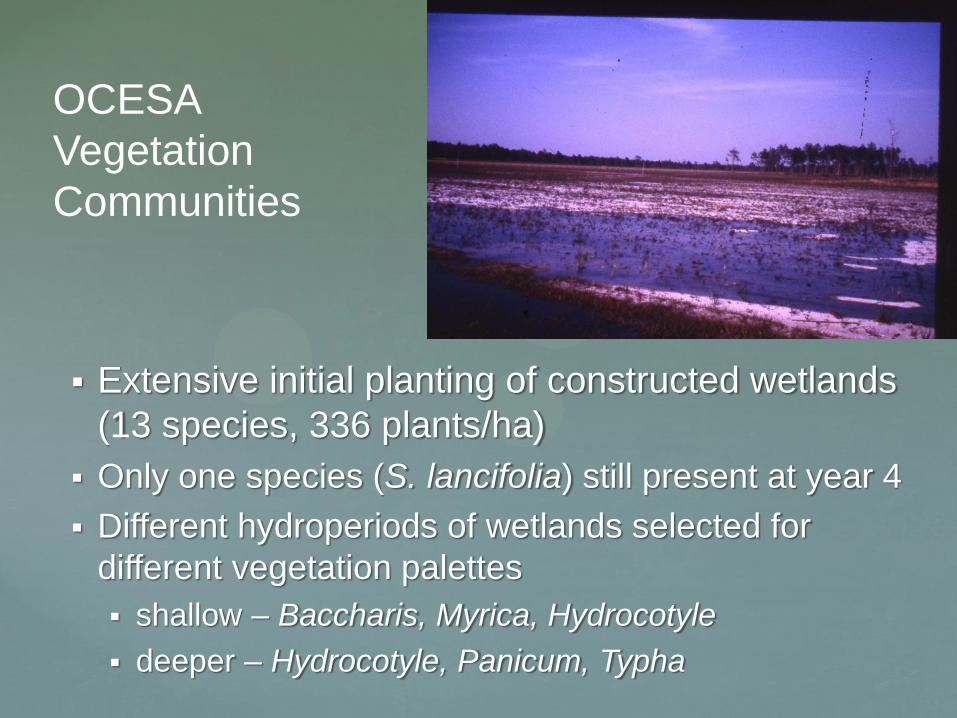
OCESA
Vegetation
Communities
Extensive initial planting of constructed wetlands
(13 species, 336 plants/ha)
Only one species (S. lancifolia) still present at year 4
Different hydroperiods of wetlands selected for
different vegetation palettes
shallow – Baccharis, Myrica, Hydrocotyle
deeper – Hydrocotyle, Panicum, Typha
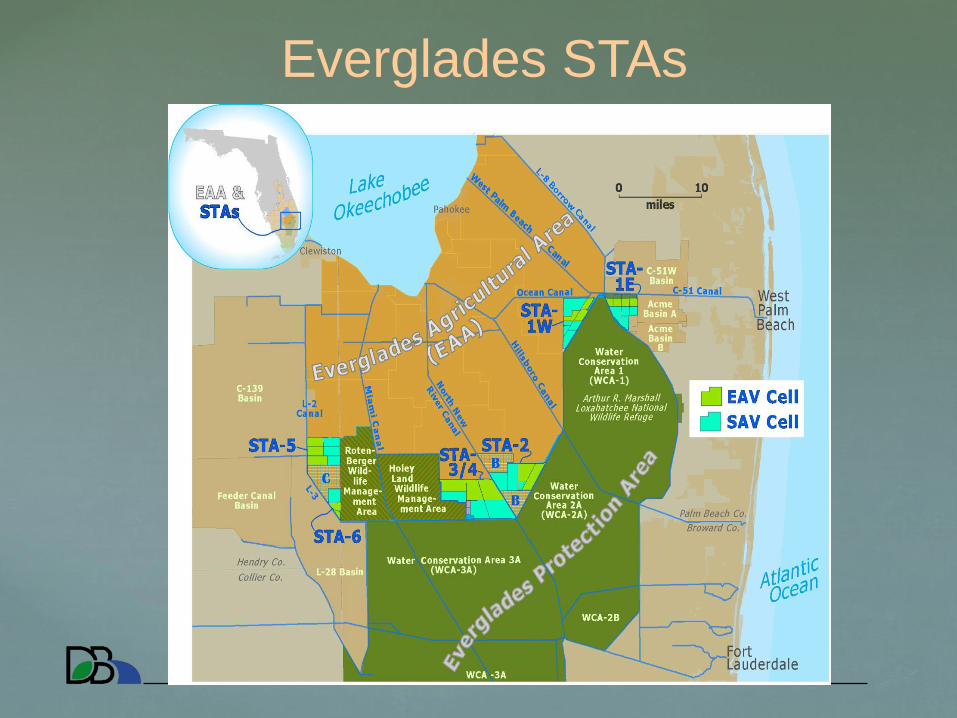
Everglades STAs
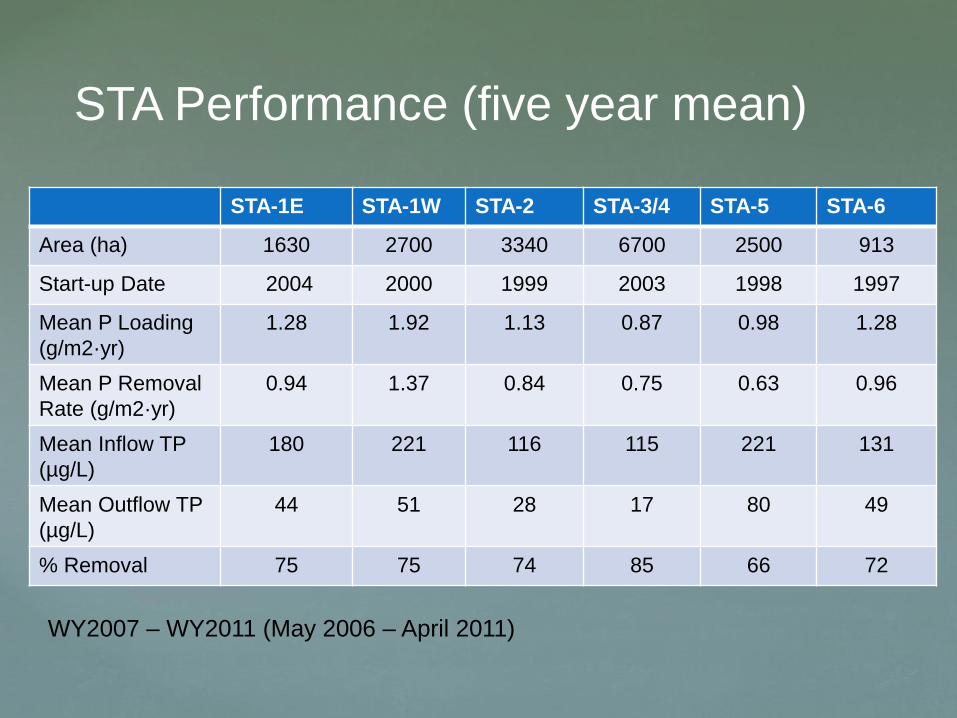
STA Performance (five year mean)
STA-1E STA-1W STA-2 STA-3/4 STA-5 STA-6
Area (ha) 1630 2700 3340 6700 2500 913
Start-up Date 2004 2000 1999 2003 1998 1997
Mean P Loading
(g/m2·yr)
1.28 1.92 1.13 0.87 0.98 1.28
Mean P Removal
Rate (g/m2·yr)
0.94 1.37 0.84 0.75 0.63 0.96
Mean Inflow TP
(µg/L)
180 221 116 115 221 131
Mean Outflow TP
(µg/L)
44 51 28 17 80 49
% Removal 75 75 74 85 66 72
WY2007 – WY2011 (May 2006 – April 2011)
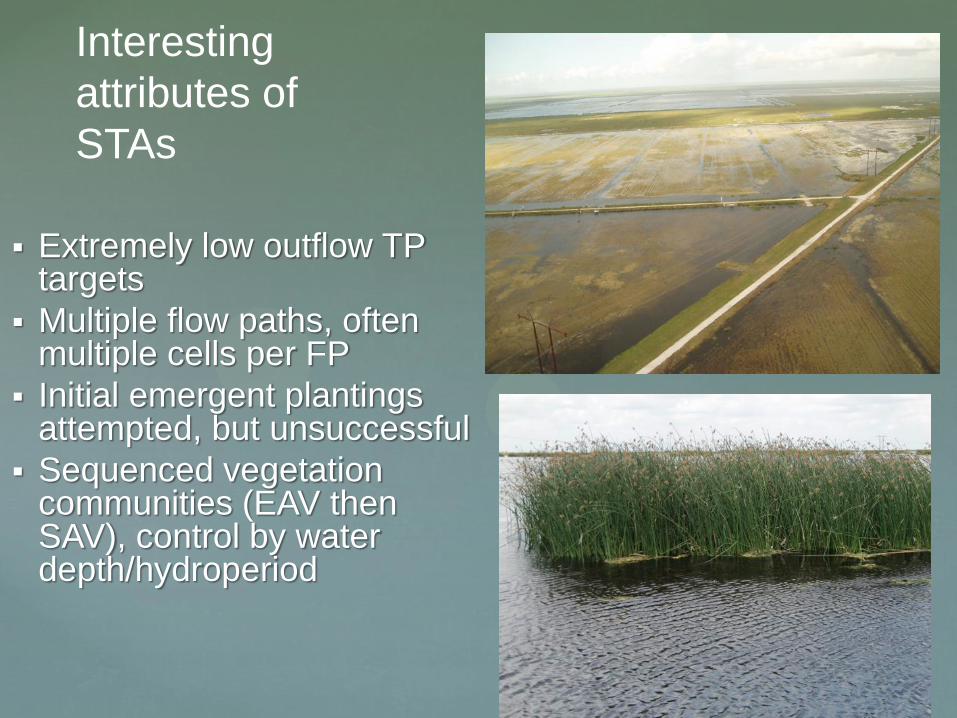
Interesting
attributes of
STAs
Extremely low outflow TP targets
Multiple flow paths, often multiple cells per FP
Initial emergent plantings attempted, but unsuccessful
Sequenced vegetation communities (EAV then SAV), control by water depth/hydroperiod
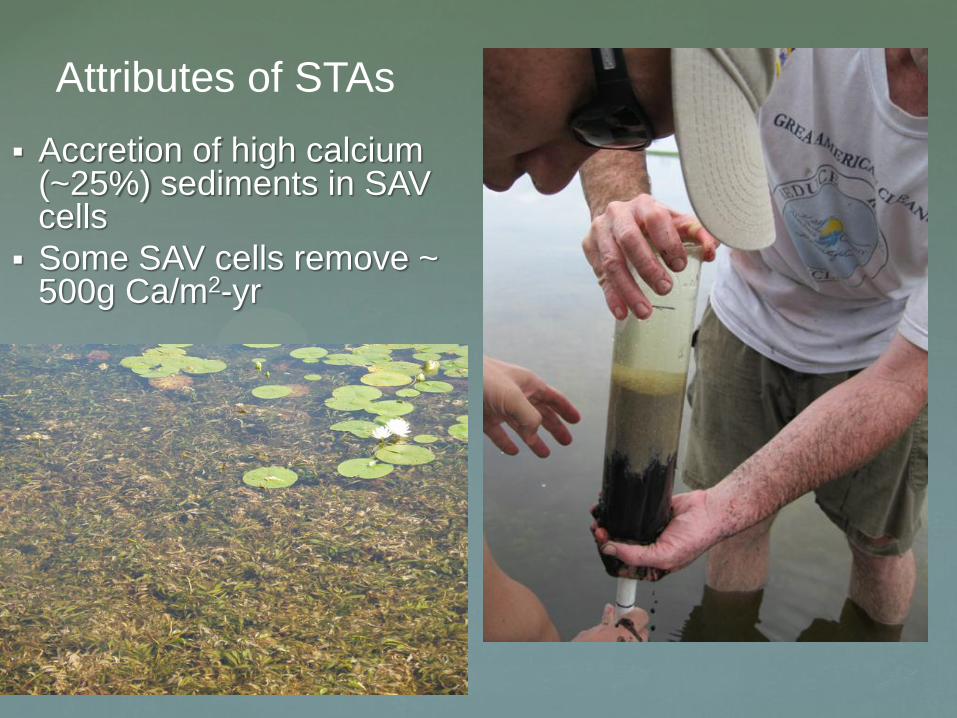
Attributes of STAs
Accretion of high calcium (~25%) sediments in SAV cells
Some SAV cells remove ~ 500g Ca/m2-yr
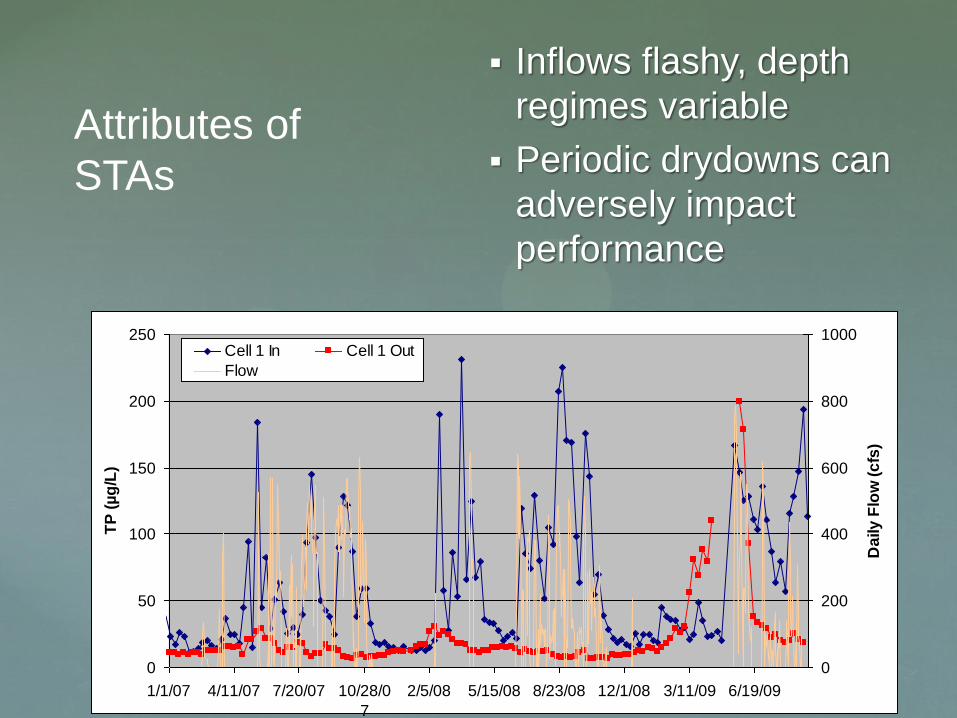
Attributes of
STAs
Inflows flashy, depth
regimes variable
Periodic drydowns can
adversely impact
performance
0
50
100
150
200
250
1/1/07 4/11/07 7/20/07 10/28/0
7
2/5/08 5/15/08 8/23/08 12/1/08 3/11/09 6/19/09
TP
(µ
g/L
)
0
200
400
600
800
1000
Da
ily
Flo
w (
cfs
)
Cell 1 In Cell 1 Out
Flow
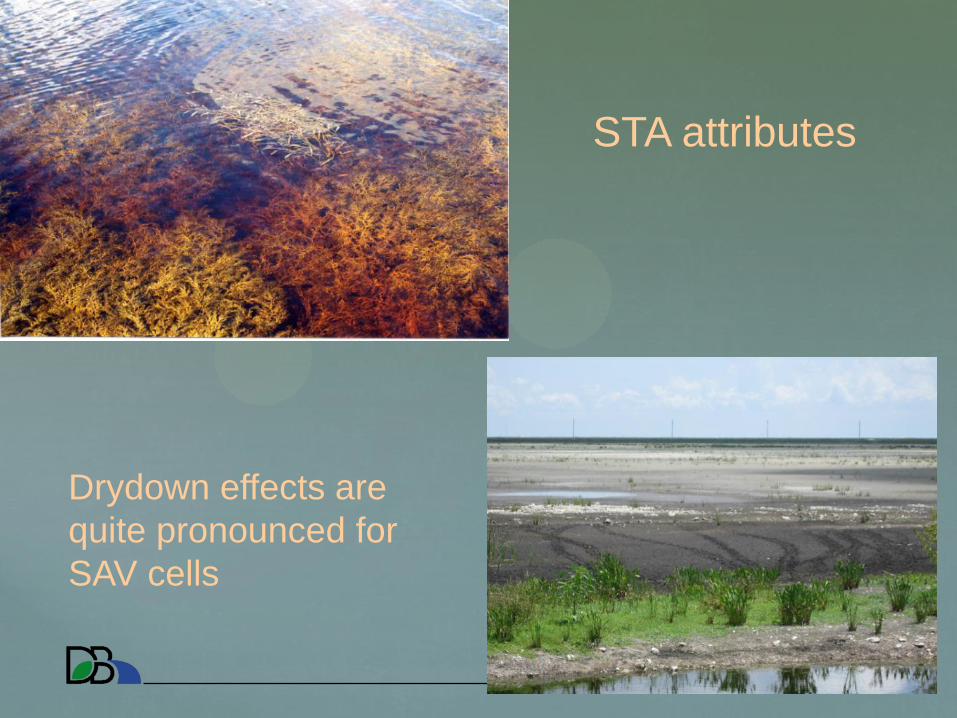
STA attributes
Drydown effects are
quite pronounced for
SAV cells
Images courtesy of SFWMD.
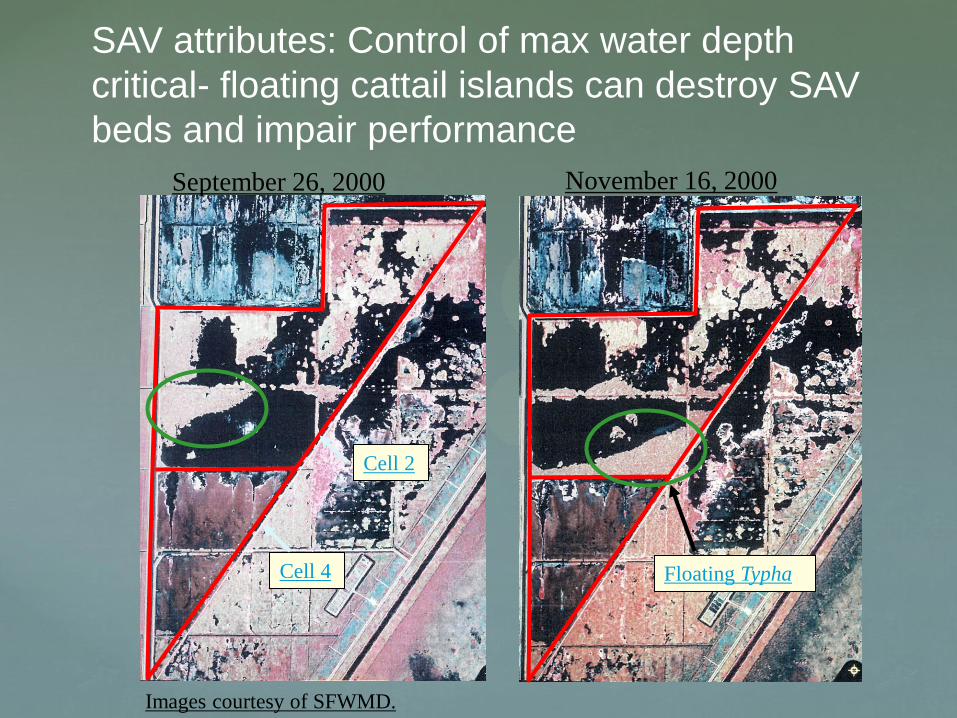
September 26, 2000 November 16, 2000
Cell 2
Cell 4 Floating Typha
SAV attributes: Control of max water depth
critical- floating cattail islands can destroy SAV
beds and impair performance
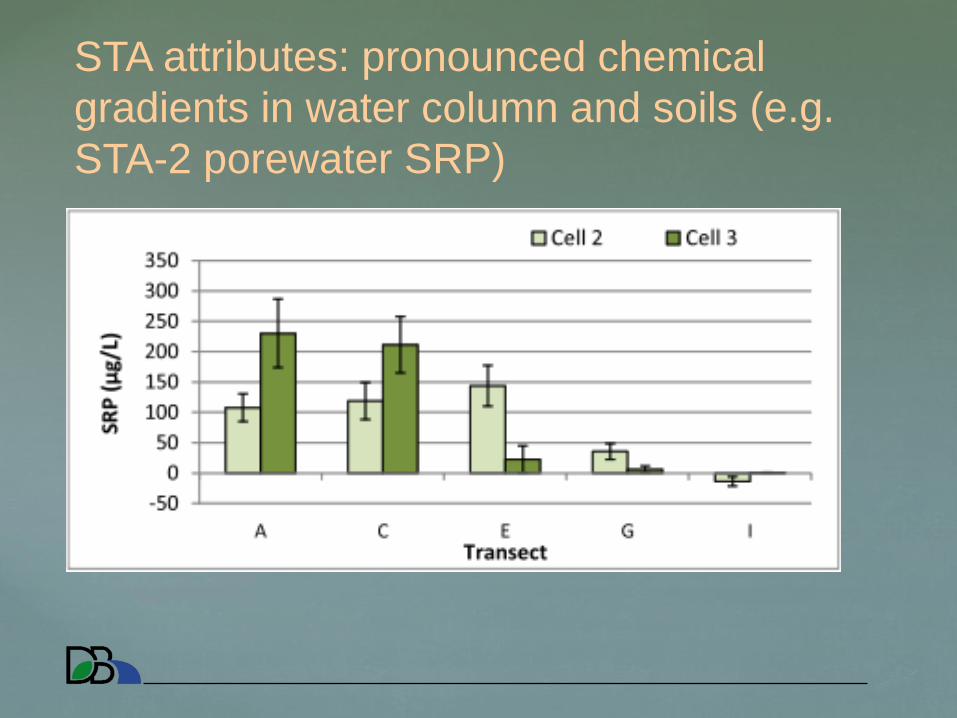
STA attributes: pronounced chemical
gradients in water column and soils (e.g.
STA-2 porewater SRP)
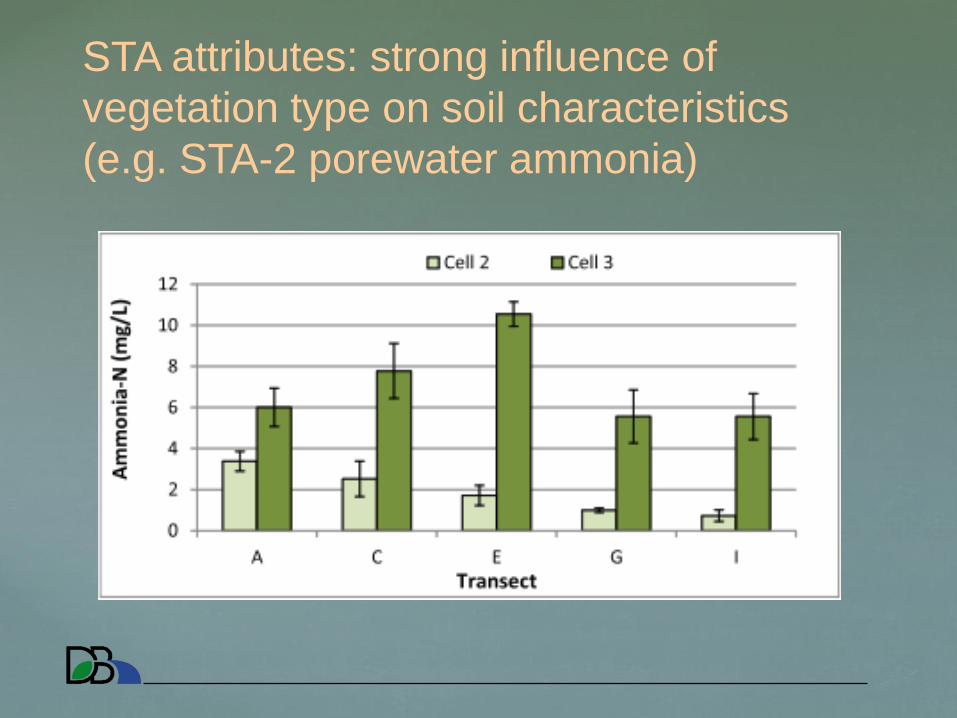
STA attributes: strong influence of
vegetation type on soil characteristics
(e.g. STA-2 porewater ammonia)
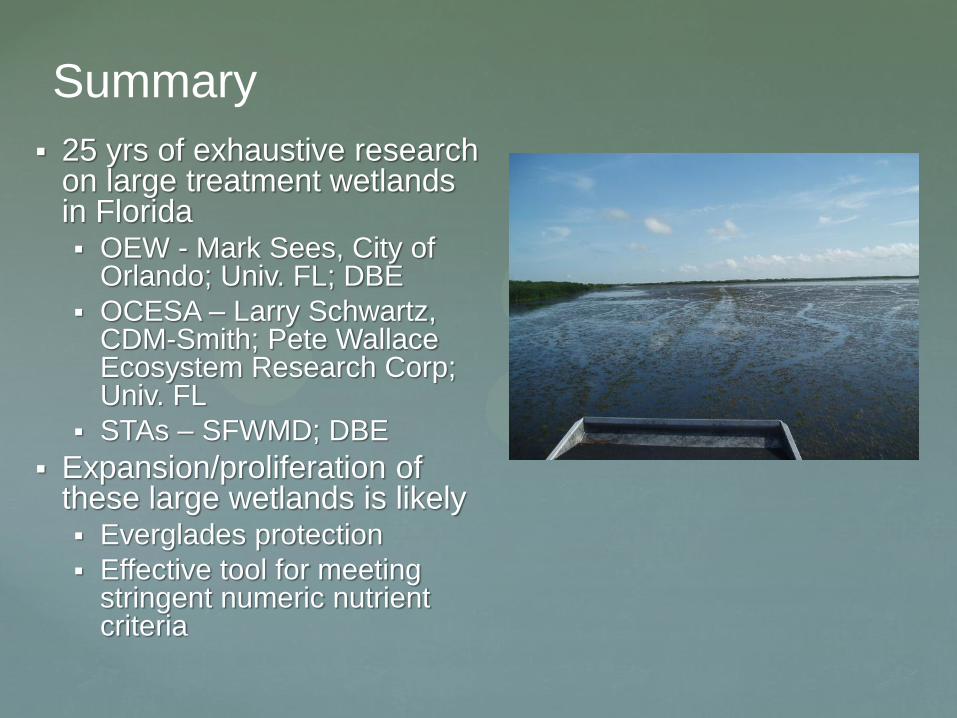
Summary
25 yrs of exhaustive research on large treatment wetlands in Florida OEW - Mark Sees, City of
Orlando; Univ. FL; DBE
OCESA – Larry Schwartz, CDM-Smith; Pete Wallace Ecosystem Research Corp; Univ. FL
STAs – SFWMD; DBE
Expansion/proliferation of these large wetlands is likely Everglades protection
Effective tool for meeting stringent numeric nutrient criteria