Embed Size (px)
Citation preview
A Perspective on Deals in 2014
26th Annual Tulane Corporate Law Institute
Goldman, Sachs & Co.
March 2014

2
This presentation has been prepared by the Investment Banking Division of Goldman Sachs and is not a product of Goldman Sachs Global Investment Research. It should not be used as a basis for trading in the securities or loans of any companies named herein or for any other investment decision. This presentation does not constitute an offer to sell the securities or loans of any companies named herein or a solicitation of proxies or votes and should not be construed as consisting of investment advice.
This presentation has been prepared and is based on information obtained by us from publicly available sources. In preparing this presentation, we have applied certain assumptions, have performed no due diligence, and have relied upon and assumed, without assuming any responsibility for independent verification, the accuracy and completeness of all financial, legal, regulatory, tax, accounting and other information provided to, discussed with or reviewed by us. We assume no liability for any such information. This presentation is necessarily based on economic, monetary, market and other conditions as in effect on, and the information made available to us as of, the dates indicated herein and we assume no responsibility for updating or revising this presentation. Goldman Sachs does not provide accounting, tax, or legal advice.

3
Agenda
I. The Backdrop
II. Is the Market Getting Better?
III. Okay, But We’ve Seen This Before…
IV. Why? What Has Changed?
V. Is the Recovery Durable?
The Backdrop

5
$1,999
$2,432$2,519 $2,549
$2,409
2009 2010 2011 2012 2013
Glo
bal
M&
A V
olu
me
($b
n)
Global M&A Volumes Have Not Grown Since the Financial Crisis…
Source: Thomson Reuters
CAGR (2010-2013)
= (0.3)%
CAGR(2009-2013)
= 4.8%
6
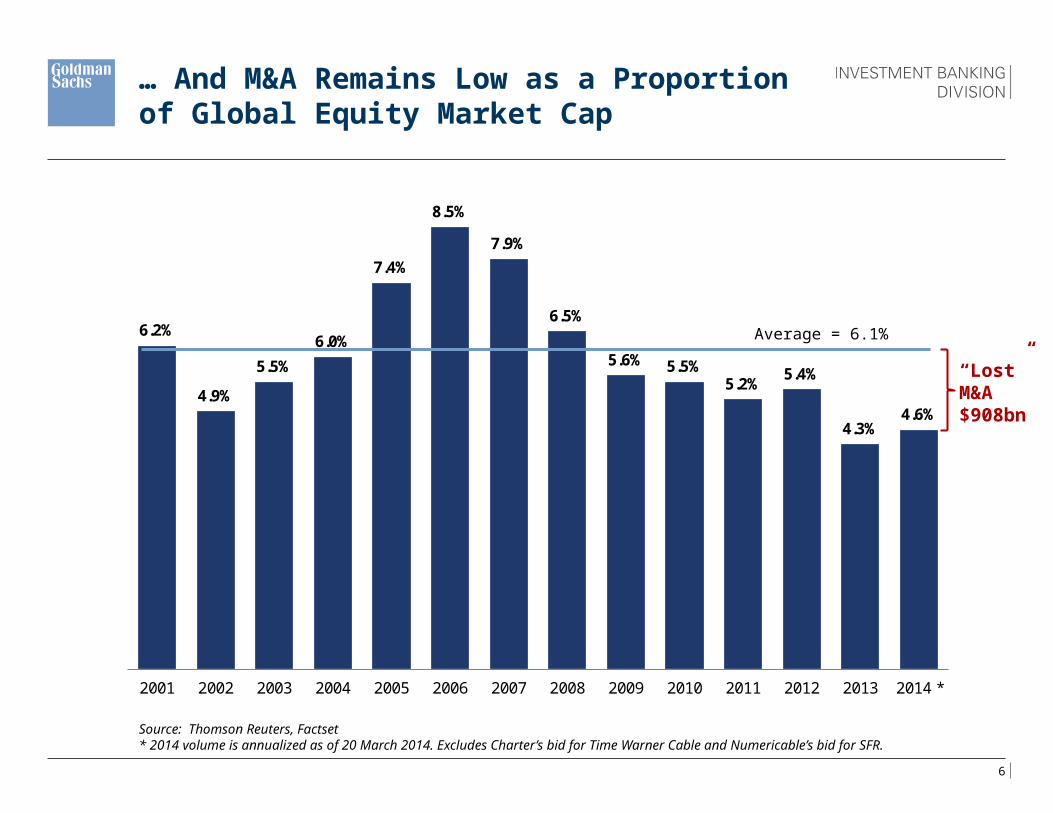
6.2%
4.9%
5.5%
6.0%
7.4%
8.5%
7.9%
6.5%
5.6% 5.5%5.2%
5.4%
4.3%4.6%
2001 2002 2003 2004 2005 2006 2007 2008 2009 2010 2011 2012 2013 2014 *
… And M&A Remains Low as a Proportion of Global Equity Market Cap
Source: Thomson Reuters, Factset* 2014 volume is annualized as of 20 March 2014. Excludes Charter’s bid for Time Warner Cable and Numericable’s bid for SFR.
“Lost” M&A $908bn
Average = 6.1%

7
2009 2010 2011 2012 2013
$754 $787 $964 $933 $1,042
$618 $716
$751 $846 $641
$626
$929 $805 $770
$726 $1,999
$2,432 $2,519 $2,549
$2,409
US M&A Volume EMEA Rest of World
An
no
un
ce
d M
&A
Vo
lum
e (
$b
n)
U.S. M&A Has Been the Biggest Contributor to Volume and Growth…
Source: Thomson Reuters
2009-2013 CAGR
3.7%
0.9%
8.4%

8
… Driven By a Faster Recovery of U.S. GDP and Strong Fixed Investment…
% Change in GDP (YoY)
% Change in Fixed Investment (YoY)
Source: GS Research; Region Aggregate Nominal GDP (PPP) Weighted
2009 2010 2011 2012 2013 2014 2015E(5.0)%(4.0)%(3.0)%(2.0)%(1.0)%0.0 %1.0 %2.0 %3.0 %4.0 %
(2.8)%
2.5 %1.8 %
2.8 %1.9 %
2.8 %3.2 %
(4.2)%
2.0 %1.7 %
(0.3)%
0.1 %
1.6 % 1.8 %
2009 2010 2011 2012 2013 2014 2015E(20.0)%
(15.0)%
(10.0)%
(5.0)%
0.0 %
5.0 %
10.0 %
(16.7)%
1.5 %
6.2 %8.3 %
4.3 %6.4 % 7.9 %
(12.5)%
0.1 % 1.6 %
(2.7)% (2.3)%
2.7 % 2.9 %
USA Europe

9
European Corporates Still Rely Heavily on Bank Funding
France Portugal Germany Italy Greece Spain US0 %
10 %
20 %
30 %
40 %
50 %
60 %
70 %
80 %
90 %
100 %
Bond-Market Funding Bank Loans

10
… And European Banks Are Still in Recovery Mode
Source: Bloomberg
Nov-2009 Jul-2010 Apr-2011 Jan-2012 Oct-2012 Jun-2013 Mar-201440%
60%
80%
100%
120%
140%
160%
180% S&P 500 Banks Index Stoxx Europe 600 Banks
Daily from 02-Nov-2009 to 24-Mar-2014
Ind
exed
Pri
ce
79.1%
(2.5)%

11
Cross-Border M&A Has Been a Remarkably Stable Contributor to M&A Activity
Strategic Cross-Border M&A Cross-Border M&A by Industry – 2009-2014 YTD
Cross-Border M&A by Industry – 2013-2014 YTD
Source: Thomson Reuters. 2014 YTD as of 20 March 2014. Total volume excludes Charter’s bid for Time Warner Cable and Numericable’s bid for SFR. Analysis is for deals >$250 million.
* 2014 volume is annualized as of run rate on 20 March 2014.
Natural Resources
32%
Technology, Media & Telecom
17%
Industrial14%
Consumer Retail13%
Financial Institutions10%
Healthcare9%
Real Estate5%
Technology, Media & Telecom
22%
Natural Resources
21%
Industrial15%
Consumer Retail12%
Healthcare12%
Financial Institutions
9%
Real Estate8%
53%
60% 64%66%
64%
84%47%
40%36%
34%
36%
16%
25%
35%
31% 33%
28%
33%
2009 2010 2011 2012 2013 2014*
% o
f T
ota
l M&
A
An
no
un
ced
M&
A V
olu
me
($b
n)
Cross-Region Intra-Region % of Total M&A
$404
$693
$638
$686
$551
$765
12
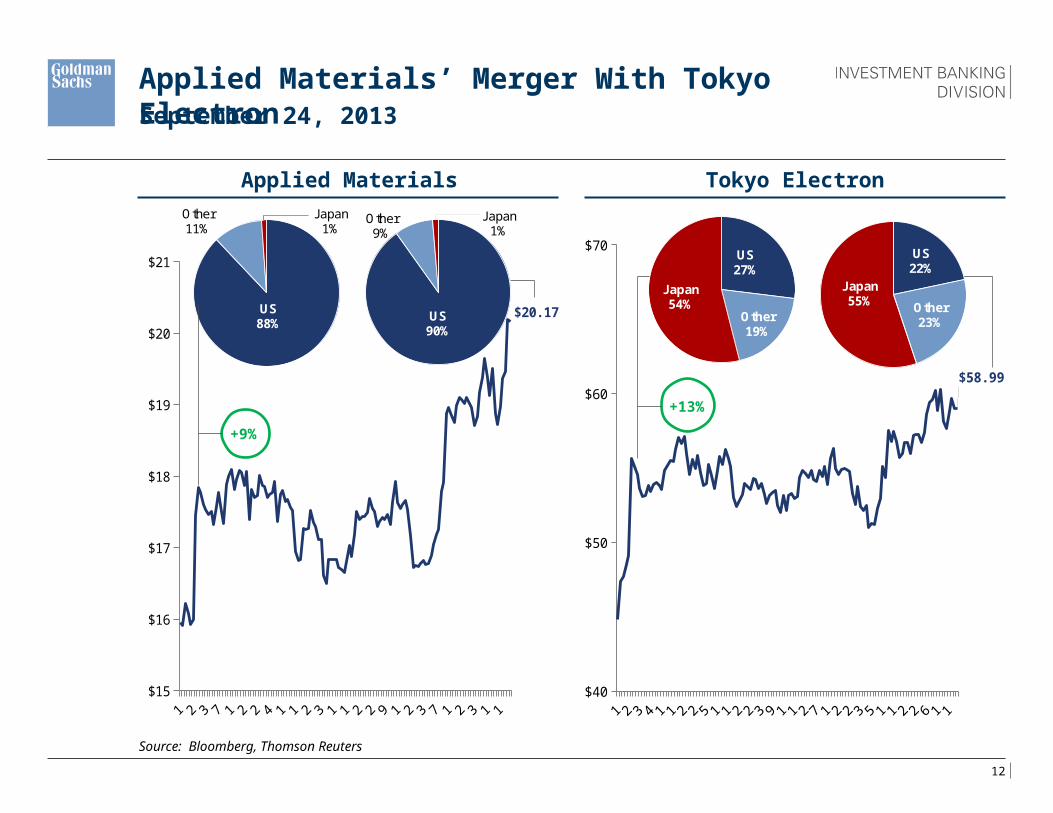
US27%
Other19%
Japan54%
Sep-2013 Dec-2013 Mar-2014$40
$50
$60
$70
$58.99
US22%
Other23%
Japan55%
Sep-2013 Dec-2013 Mar-2014$15
$16
$17
$18
$19
$20
$21
$20.17
Applied Materials’ Merger With Tokyo Electron
Applied Materials Tokyo Electron
Source: Bloomberg, Thomson Reuters
+9%
+13%
US90%
Other9%
Japan1%
US88%
Other11%
Japan1%
September 24, 2013

13
M&A Mix by Industry
2009-2012 2013-2014 YTD
Source: Thomson Reuters. 2014 YTD as of 20 March 2014. Volume excludes Charter’s bid for Time Warner Cable and Numericable’s bid for SFR.
Natural Resources29%
Financial Institutions16%
Technology, Media & Telecom
16%
Industrial11%
Consumer Retail10%
Real Estate9%
Healthcare9%
Technology, Media & Telecom
26%
Natural Resources20%
Real Estate15%
Consumer Retail12%
Industrial10%
Financial Institutions
9%
Healthcare9%
TMT and Natural Resources Are Going Through Significant Structural Changes

14
While Broad Financial Sponsor Activity is Growing, “Pure” LBO Activity Remains at 5% of Volume
Financial Sponsors Activity (ex IPOs) LBO Activity
Source: Thomson Reuters. 2014 YTD as of 20 March 2014. Total volume excludes Charter’s bid for Time Warner Cable and Numericable’s bid for SFR.
34%
45%32%
21%
43%
36%
66%
55%68%
79%
57%
64%
2%
6% 6% 5%
7%
6%
2009 2010 2011 2012 2013 2014YTD
% o
f T
ota
l M&
A
An
no
un
ced
M&
A V
olu
me
($b
n)
Public Company Target Other % of Total M&A
$45
$134$140 $138
$176
$38
42%
35%
42%34%
48%
47%
14%
17%
15% 22%
16%
25%
44%
49%
43%44%
36%
28%
12%
20%
23%24%
25%26%
2009 2010 2011 2012 2013 2014YTD
% o
f T
ota
l M&
A
An
no
un
ced
M&
A V
olu
me
($b
n)
Sponsor as Seller Secondary Sponsor Sales
Sponsor as Buyer % of Total M&A
$231
$491
$576$604 $606
$170

15
Divestitures and Spin-Offs Are Almost Half of M&A Activity, Largely Driven by Activist Pressure…
Annual Divestiture Activity
Source: Thomson Reuters. 2014 YTD as of 20 March 2014. Total volume excludes Charter’s bid for Time Warner Cable and Numericable’s bid for SFR. * 2014 volume is annualized as of run rate on 20 March 2014.
Recent Significant Divestitures / Spin-offs
$683
$1,045
$913
$1,177
$1,063
$967
34%
43%
36%
46%44%
35%
2009 2010 2011 2012 2013 2014*
Div
est
itu
res
as
% o
f To
tal M
&A
Div
est
itu
re V
olu
me
($
bn
)
Divestitures % of Total M&A

16
… Which Has Intensified as Their Funding Has Grown
Source: HFR Global Hedge Fund Industry Report
$36.2
$46.8
$50.9
$65.5
$93.1
2009 2010 2011 2012 2013
AU
M (
$b
illi
on
)

17
Activism May Be the New Form of Hostile M&A
Source: Thomson Reuters, Factset. 2014 is annualized based on totals as of 20 March 2014.
2009 2010 2011 2012 2013 2014 Annualized-100%
0%
100%
200%
300%
400%
500%
600%
0%
163%
0%
565%
Global Hostile Volume ($bn) Activism Situations (#)
Ind
exed
Val
ue

18
… Although Deal Jump Activity Has Been Active
Source: Thomson Reuters
Year Target Initial Topping Jurisdiction IndustryAmt ($bn)
Winning Bidder
2014 Time Warner Cable Charter Communications Comcast Corp US Media $70.7 Pending
2012 Sprint Nextel Softbank DISH Network US Telecom 37.8 Initial
2013 DellSilver Lake, Management
Blackstone / Carl Icahn
US Technology 22.9 Initial
2014 SFR (Vivendi) Bouygues Telecom Numericable Gp Europe Telecom 18.1 Pending
2012 Clearwire Sprint Nextel DISH Network US Telecom 9.9 Initial
2013 Tele2 Russia Holding VTBA1 Investment / Investor Group
Europe Telecom 4.2 Initial
2013Commonwealth Ppty Office Fund
GPT DEXUS Ppty, CPPIB Australia Real Estate 3.5 Topping
2013 Rede Energia COPEL, Energisa Energisa Latin America Nat Res 2.0 Initial
2014 Amcol International Imerys Minerals Technologies US Nat Res 1.7 Topping
2013Block BC-10, Parque das Conchas
Sinochem BC-10 Petroleo Ltda Latin America Nat Res 1.5 Topping
2013 The Men’s Wearhouse Jos A Bank Clothiers N/A US Retail 1.5Pac-Man
Successful
Total $173.8
Bidders

Is the Market Getting Better?

20
$490
$647
$566
$847
$502 $525
$711$671
$599
Q1 12 Q2 12 Q3 12 Q4 12 Q1 13 Q2 13 Q3 13 Q4 13 Q1 14
Glo
bal
M&
A V
olu
me
($b
n)
$684*
M&A Volumes Have Improved over the Last Three Quarters…
* Estimated quarterly total for Q1 2014 based on volumes as of 20 March 2014.Source: Thomson Reuters. Global volume excludes Charter’s bid for Time Warner Cable and Numericable’s bid for SFR. 2014 YTD as of 20 March 2014.

21
…With 2014 M&A Volumes Outpacing the Same Period In the Prior Two Years…
Source: Thomson Reuters. 2014 as of March 20, 2014. Excludes Charter’s bid for Time Warner Cable and Numericable’s bid for SFR.
$429$457
$641
$420$439
$599
2009 YTD 2010 YTD 2011 YTD 2012 YTD 2013 YTD 2014 YTD
Glo
ba
l M&
A V
olu
me
($
bn
)

22
Global U.S. Only
Source: Thomson Reuters, as of March 25.* 2014 YTD volume excludes Charter’s bid for Time Warner Cable ($62.6 billion)** 2014 YTD volume excludes Numericable’s bid for SFR ($16.3 billion)
Significant Year on Year Gains 2013-2014
YTD
($ in billions) 2014 2013 % change y-o-y
Total M&A Volume *,** $623 $458 36 %
Strategic Cross-Border 223 107 108
Divestitures & Spinoffs ** 218 201 8
Hostile M&A 73 36 101
LBO 43 73 (41)
YTD
Number of Deals over: 2014 2013 % change y-o-y
$500mm *,** 208 155 34 %
$1bn *,** 111 82 35
$5bn *,** 16 7 129
$10bn *,** 8 4 100
YTD
($ in billions) 2014 2013 % change y-o-y
Total M&A Volume * $295 $223 32 %
Strategic Cross-Border 74 19 280
Divestitures & Spinoffs 75 81 (8)
Hostile M&A 69 28 148
LBO 30 60 (50)
YTD
Number of Deals over: 2014 2013 % change y-o-y
$500mm * 83 67 24 %
$1bn * 47 38 24
$5bn * 6 6 0
$10bn * 4 4 0

23
A Shift from Tactical M&A to Strategic M&A…
Source: Thomson Reuters
Technology, Media & Telecom
Consumer / Retail
Healthcare
Industrials
Acquiror Target Size ($bn)
Investor Group Dell $19.3
Verizon Communications
Verizon Wireless 130.3
Comcast NBC Universal 14.7
Investor Group HJ Heinz $27.3
Investor Group Neiman Marcus 6.0
Thermo Fisher Scientific
Life Technologies
$15.4
Valeant Pharmaceuticals
Bausch + Lomb 11.6
Fiat Chrysler $4.4
Koch Industries Molex 6.7
2013Financing / "Clean-Up" Transaction
Acquiror Target Size ($bn)
ComcastTime Warner Cable
$70.7
Facebook WhatsApp 19.5
Suntory Beam $15.7
AB Acquisitions Safeway 9.2
Actavis plc Forest Labs $23.3
McKesson Celesio 7.0
AMEC Foster Wheeler $2.8
Verso Paper NewPage 4.3
2014Strategic Transaction

24
52% 54% 59%
42% 42%
74%
27%29%
11%
24%
39%
10%1%
3%
2% 8%
2%5%
1%
8%
6% 2%
9% 5%
2%
5%
10%23%
5% 3%17% 13%
2% 2% 2%
2009 2010 2011 2012 2013 2014
% o
f $
Vo
lum
e o
f $1
bn
+ D
eals
Corporate / Corporate Divestiture - Corporate Buyer Divestiture - LBO BuyerPublic to Private Spinoff Other
… Which is A Marked Shift in Tone
Source: Thomson Reuters. U.S. targeted deals >$1 billion. Other includes negotiated share repurchases and rescues. Analysis for 2014 as of 20 March 2014.

25
Corporate Leaders are More Confident…
Source: Factset
Q3 2012 Q4 2012 Q1 2013 Q2 2013 Q3 2013 Q4 201340
45
50
55
60
65
CEO Confid...
Above 50 = Positive
Below 50 = Negative

26
…The Impact of Share Buybacks is Less Pronounced…
Note: Buyback yield is defined as shares repurchased divided by shares outstanding at the beginning of the period.Source: GS Research
2.2%
2.8%
0%
1.0%
2.0%
3.0%
4.0%
5.0%
6.0%
1992 1994 1996 1998 2000 2002 2004 2006 2008 2010 2012 2014
S&
P 5
00
Tra
ilin
g 1
2-m
on
th Y
ield
Dividend Yield
Buyback Yield

27
As Interest Rates Rise, Companies Are Accelerating M&A Projects
Source: Bloomberg and Thomson Reuters
Jan-1983 Jan-1987 Jan-1991 Jan-1995 Jan-1999 Jan-2003 Jan-2007 Jan-20110%
2%
4%
6%
8%
10%
12%
14%
16%
$0
$50
$100
$150
$200
$250
10Y US Treasury Rate US M&A Volume ($bn 3mo Moving Avg.)
10 Y
ear
US
Tre
asu
ry R
ate
(Co
nst
ant
Mat
uri
ty)
US
An
no
un
ced M
&A
Vo
lum
e ($bn
)

Okay, But We’ve Seen This Before…
… How Is the Market Different Today?

29
Series1
(1.3)%(1.9)%
0.3 % 0.3 %
1.8 %
3.1 %3.6 %
5.2 %
Ind
exed
Sto
ck
Pri
ce R
eacti
on
There Has Been A Demonstrable Shift Toward Shareholder Support of M&A…
One-Day Indexed Stock Price Reaction for Buyers
One-Week Indexed Stock Price Reaction for Buyers
Note: Stock Price reaction relative to the S&P 500. Deals with transaction value greater than $1,000mm with a US public acquiror.Source: Bloomberg, Thomson Reuters, Capital IQ
2008 2009 2010 2011 2012 2013 1H 2013 2H 2014 YTD
Series1
(1.7)% (1.7)%
(0.1)%
0.0 %
2.0 %
3.6 %4.1 %
4.7 %
Ind
exed
Sto
ck
Pri
ce R
eacti
on
2008 2009 2010 2011 2012 2013 1H 2013 2H 2014 YTD

30
…Which Started to Accelerate in Q3 2013…
Source: Bloomberg, Thomson Reuters, Capital IQ. Deals with transaction value greater than $1,000mm with a US public acquiror.
Proportion of Deals with Positive Acquiror One Day Stock Price Reactions
Series1
50.0 %
54.2 %
69.6 %
75.0 %73.3 %
Pro
po
rtio
n o
f D
ea
ls w
ith
Po
sit
ive
On
e D
ay
Sto
ck
Pri
ce
Re
ac
tio
ns
Q1 2013 Q2 2013 Q3 2013 Q4 2013 2014 YTD

31
…Driven by Investor Sentiment Regarding EPS Impact…
Source: Thomson Reuters, Company disclosure. Deals with transaction value greater than $1,000mm with a US public acquiror.¹ Includes deals announced as dilutive or accretive in years after FY1.² Deals that are announced as immediately accretive or accretive in FY1.
Dilutive Transactions1
2009-2010 2013-2014 YTD
Accretive Transactions2
2009-2010 2013-2014 YTD
Series1(6.0)%
(4.0)%
(2.0)%
0.0 %
2.0 %
4.0 %
6.0 %
-3.9
0.70.2 %
5.4 %
Ac
qu
iro
r S
toc
k P
ric
e R
ea
cti
on
On
e D
ay
P
os
t-A
nn
ou
nc
em
en
t

32
(40)% (30)% (20)% (10)% 0% 10% 20%
(15)%
(10)%
(5)%
0%
5%
10%
15%
Acquiror One Day Post Announcement Share Price Reaction
FY
2 A
cc
reti
on
…And Clear Evidence That Investors Believe in the Value of EPS Accretion Again…
2009-2010 2013-2014 YTD
Source: Thomson Reuters, IBES, Company’s disclosures. Deals with transaction value greater than $1,000mm with a US public acquiror.Notes: (1) FY2 accretion represents FY2 expected accretion disclosed by the acquiror when available, or is otherwise FY2 EPS IBES estimate immediately post close (or 6 months post announcement when close has not yet occurred) relative to FY2 EPS IBES estimate immediately pre-announcement.
R² = 0.1015
(30)% (20)% (10)% 0% 10% 20% 30% 40%
(10)%
(5)%
0%
5%
10%
15%
20%
25%
30%
Acquiror One Day Post Announcement Share Price Reaction
FY
2 A
cc
reti
on
R² = 0.428

33
Devon /GeoSouthern
Advance AutoParts
PackagingCorp / Boise
Actavis /Warner Chilcott
SalixPharmaceuticals
/ Santarus
Scientific GameCorp / WMSIndustries
0.0% 17.5% 35.0% 52.5% 70.0%
5.0%
16.6%
10.8%
1.3%
15.0%
5.5%
20.0%
20.0%
23.2%
30.0%
31.1%
108.3%
FY2 Accretion Acquiror Stock Price Reaction at Announcement
… Strong Projected Earnings Are Driving Stock Prices Higher…
Significant cost and tax synergies (96% of target’s EBITDA)
Strong strategic rationale, significant revenue synergies
Operational synergies and tax benefits totally more than $400mm (~30% of target’s EBITDA)
Strong consolidation rationale and significant synergies (~35% of target’s EBITDA)
Strategic rationale and significant synergies (~70% of target’s EBITDA)
Use of leverage to finance growth, market focus on execution of forward growth plans
Notes: (1) FY2 accretion represents FY2 expected accretion disclosed by the acquiror when available, or is otherwise FY2 EPS IBES estimate immediately post close (or 6 months post announcement when close has not yet occurred) relative to FY2 EPS IBES estimate immediately pre-announcement.
(2) Stock price reaction one day post announcement is relative to the undisturbed date.Source: Thomson Reuters, Capital IQ
Key Drivers
100.0% 120.0%
34
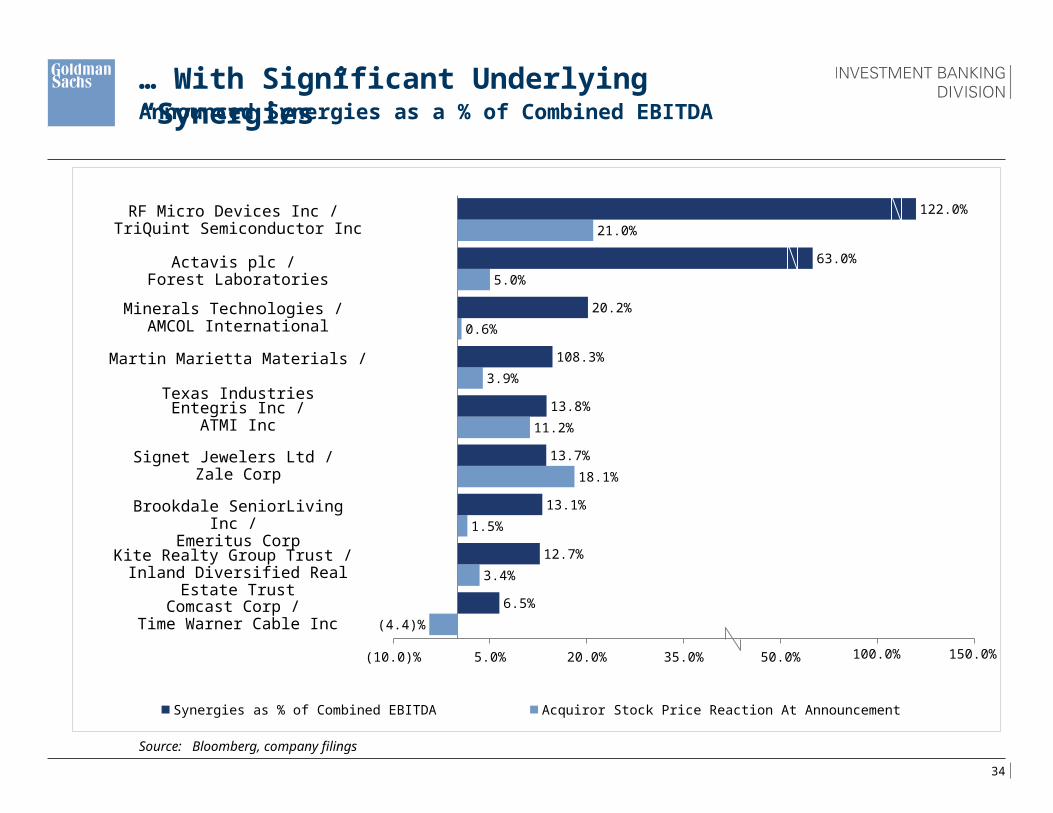
… With Significant Underlying “Synergies”Announced Synergies as a % of Combined EBITDA
Source: Bloomberg, company filings
(10.0)% 5.0% 20.0% 35.0% 50.0% 65.0% 80.0%
(4.4)%
3.4%
1.5%
18.1%
11.2%
3.9%
0.6%
5.0%
21.0%
6.5%
12.7%
13.1%
13.7%
13.8%
108.3%
20.2%
63.0%
122.0%
Synergies as % of Combined EBITDA Acquiror Stock Price Reaction At Announcement
100.0% 150.0%
RF Micro Devices Inc / TriQuint Semiconductor Inc
Actavis plc / Forest Laboratories
Minerals Technologies / AMCOL International
Martin Marietta Materials / Texas Industries
Entegris Inc /ATMI Inc
Signet Jewelers Ltd / Zale Corp
Brookdale SeniorLiving Inc / Emeritus Corp
Kite Realty Group Trust / Inland Diversified Real Estate Trust
Comcast Corp / Time Warner Cable Inc

35
18-Feb-2014 25-Feb-2014 4-Mar-2014$75
$80
$85
$90
$95
$100$99.04
Clo
sin
g P
ric
e (
US
D)
… Illustrated by Signet’s Acquisition of Zale…
Source: Bloomberg, company filings
41% premium Investors expect deal to be dilutive due to
the high premium Announces synergies of $100mm,
representing 143% of the target’s EBITDA
+18%
+25%
February 19, 2014

36
However, Reaction Has Varied by Sector…
Note: Includes deals from 2013 and 2014 YTD with a transaction value of $1,000mm or greater and a US public acquiror.Source: Capital IQ, Thomson Reuters
6.5% 6.3%
7.3%
6.4%
7.6%
9.3%
3.9%
5.1%5.4%
3.0% 3.0%
5.6%
2.0%
1.1%
2.7%
0.5% 0.7%
2.4%
(1.6)% (1.5)%
(2.3)%
(4.0)%
(2.0)%
-
2.0%
4.0%
6.0%
8.0%
10.0%
One Day One Week One Month
Acq
uir
or
Sto
ck P
ric
e R
eact
ion
Consumer Retail Industrials Healthcare TMT Real Estate Energy and Power Financials

37
10-Mar-2014 12-Mar-2014 14-Mar-2014 16-Mar-2014$21.1
$21.5
$22.0
$22.4
$22.8
$23.2
$23.6
$22.42
Ac
qu
iro
r C
los
ing
Pri
ce
(U
SD
)
And Investors Can Still Be CautiousEnergy XXI’s Acquisition of EPL Oil & Gas March 12, 2014
Source: Bloomberg, company filings
-7%
Energy XXI announces the acquisition of EPL Oil & Gas for $2.2 bn
Transaction was announced as additive to EPS Investors were expecting share repurchases

Why? What Has Changed?
… Positive Investor Sentiment Has Been the Missing Piece

39
4,401
4,279
4,171
4,102
4,180
3,950
4,000
4,050
4,100
4,150
4,200
4,250
4,300
4,350
4,400
4,450
2009 2010 2011 2012 2013
# o
f D
om
es
tic
Co
mp
an
ies
Lis
ted
on
NY
SE
an
d
Na
sd
aq
Source: World Federation of Exchanges
CAGR = (1.3)%
There Are Fewer Opportunities to Invest in the Public Markets…

40
… And There Are Record Inflows Into Equity Mutual Funds…
Source: Strategic Insight Simfunds
$(40)
$(149)
$ 44
$ 405
$ 462
$(200)
$(100)
$ 0
$ 100
$ 200
$ 300
$ 400
$ 500
2009 2010 2011 2012 2013
Ne
t N
ew
Flo
ws
($
bn
)

41
… Which Is Helping the US and European IPO Markets…
US IPOs Year to Date
US IPOs by Industry (2013-2014 YTD)
European IPOs Year to Date
European IPOs by Industry (2013-2014 YTD)
Source: Dealogic and Thomson Reuters; YTD as of March 19. Industry mix based on dollar volume.
$3.5
$6.8$8.627 25
45
0
10
20
30
40
50
0
2
4
6
8
10
12
14
16
2012 YTD 2013 YTD 2014 YTD
# o
f IP
Os
$ V
ol
($b
n)
Deal Value ($bn) # of Deals
$0.7
$3.1
$13.7
1915
30
0
10
20
30
40
50
0
2
4
6
8
10
12
14
16
2012 YTD 2013 YTD 2014 YTD
# o
f IP
Os
$ V
ol
($b
n)
Deal Value ($bn) # of Deals
CRG, 4 %
FIG, 48 %
HC, 10 %IND, 5 %
NR, 14 %
RE, 8 %
TMT, 11 %
CRG, 7 %
FIG, 32 %
HC, 0 %
IND, 23 %
NR, 11%
RE, 13 %
TMT, 14 %

42
$(197.8)
$(316.9)
$(111.1)
$ 180.0 $ 173.6
$(0.1)
$(350.0)
$(250.0)
$(150.0)
$(50.0)
$ 50.0
$ 150.0
$ 250.0
$ 350.0
2009 2010 2011 2012 2013 2014 YTD
Investors Are Turning to “Active” Funds Again…
Flows to Passive Funds ($bn)
Flows to Active Funds ($bn)
Source: Strategic Insight Simfunds, 2014 YTD as of Feb-14
$ 157.6 $ 168.1 $ 155.2 $ 225.2
$ 288.7
$ 46.5
$(350.0)
$(250.0)
$(150.0)
$(50.0)
$ 50.0
$ 150.0
$ 250.0
$ 350.0
2009 2010 2011 2012 2013 2014 YTD

43
… And “Active” Fund Managers Need to Create Alpha and Generate Superior Returns
Cumulative Average Returns to Passive Funds (%)
Cumulative Average Returns to Active Funds (%)
Note: Returns are net of feesSource: Strategic Insight Simfunds
2009 2010 2011 2012 2013 2014 YTD(5.0)%
0.0%
5.0%
10.0%
15.0%
20.0%
25.0%
30.0% 28.5%
13.3%
(4.9)%
12.3%
18.5%
1.4%
2009 2010 2011 2012 2013 2014 YTD(5.0)%
0.0%
5.0%
10.0%
15.0%
20.0%
25.0%
30.0% 26.8%
12.3%
(1.5)%
11.5%15.3%
1.6%

44
Which is Driving Some Investors Into Deal Stocks to Create Alpha…
Source: Thomson Reuters, Bloomberg, Deals with transaction value of $2,000mm or greater, with a US public acquiror.
At Announcement
3.5x
5.4x5.7x
6.4x
2010 2011 2013 2014 YTD
Mu
ltip
le t
o A
cqu
iro
r P
re-A
nn
ou
nce
men
t 3
Mo
nth
A
DT
V

45
… And Some Targets To Trade Through Offer Prices...Acquiror One Week Gross Arbitrage Spread
Source: Thomson Reuters, Capital IQ
0.2%
0.3%
0.3%
2.6%
3.2%
5.8%
8.4%
0.0% 2.0% 4.0% 6.0% 8.0% 10.0%
Zale / Signet Jewelers
Santarus / Salix Pharmaceuticals
CEC Entertainment / Apollo Global Management
ArthroCare Corp / Smith & Nephew
Celesio AG / McKesson Corp
Sirius XM / Liberty Media
AMCOL International / Minerals Technologies
Acquiror One Week Gross Arbitrage Spread
46
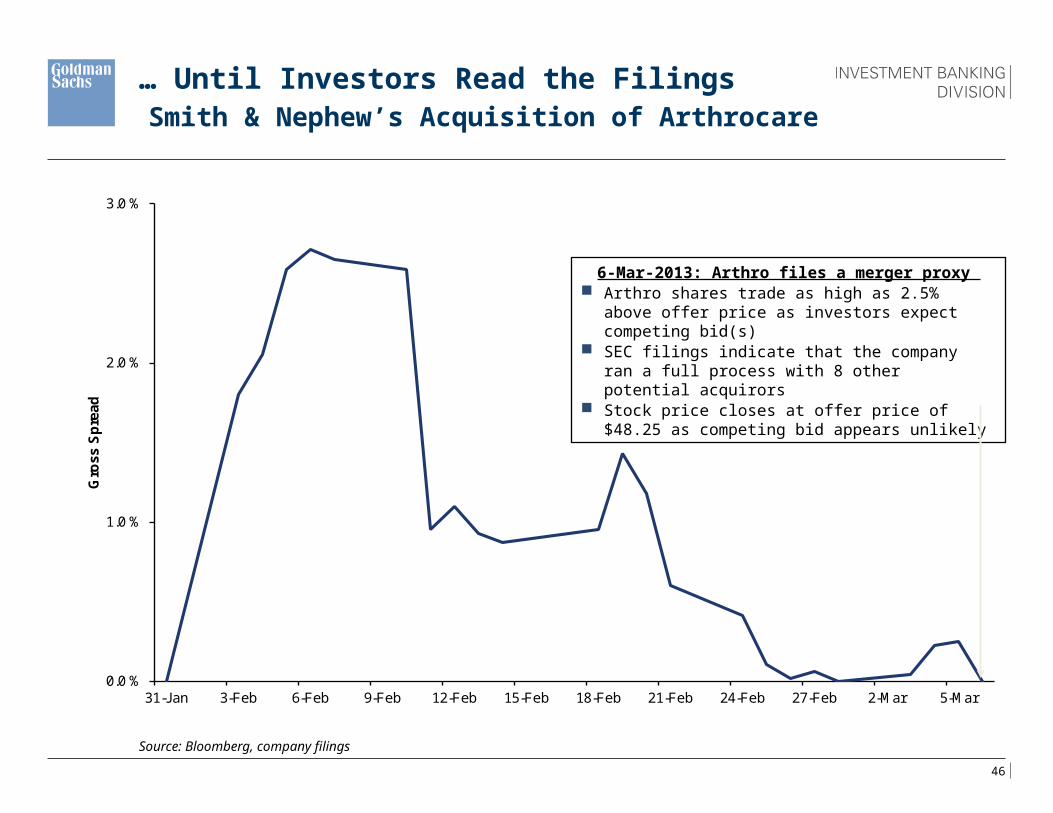
Source: Bloomberg, company filings
0.0 %
1.0 %
2.0 %
3.0 %
31-Jan 3-Feb 6-Feb 9-Feb 12-Feb 15-Feb 18-Feb 21-Feb 24-Feb 27-Feb 2-Mar 5-Mar
Gro
ss S
pre
ad
6-Mar-2013: Arthro files a merger proxy Arthro shares trade as high as 2.5% above offer price
as investors expect competing bid(s) SEC filings indicate that the company ran a full process
with 8 other potential acquirors Stock price closes at offer price of $48.25 as
competing bid appears unlikely
… Until Investors Read the FilingsSmith & Nephew’s Acquisition of Arthrocare

Is the Recovery Durable?

48
Investors Are Strongly Encouraging Companies to Invest and Grow to Fill the Growth Gap
Source: Bloomberg
66%
46%
14%
(10)%
0%
10%
20%
30%
40%
50%
60%
70%
Sep-11 Feb-12 Jun-12 Oct-12 Feb-13 Jun-13 Oct-13 Mar-14
Cu
mu
lati
ve G
row
th S
ince
30-S
ep-2
011
S&P 500 Increase FY1 PE Increase Earnings Increase
PE MultipleExpansion

49
2013 Global M&A Additional M&A Volume if USReturns to 10-year Average of
Market Cap
Additional M&A Volume if Asia &Europe Return to 10-year Average
Proportion to US Volume
2013 + "Return to Normal"
2407
$253
655
$3,315
An
no
un
ce
d M
&A
Vo
lum
e (
$b
n)
What if M&A Activity Approached Historic Levels of Relative Volumes?
Source: Thomson Reuters and FactSet
+11%
+27%
+38%

50
Shuanghui Intl / Smithfield Foods
Glencore Intl / Xstrata
CITIC / AsiaInfo-Linkage
AT&T / T-Mobile
United Parcel Service / TNT Express
Deutsche Borse / NYSE Euronext
Anheuser-Busch InBev / Grupo Modelo
AMR Corp / US Airways
Silver Lake / Dell
McKesson / Celesio
Boise / PCA
Shanghui Intl / Smithfield Foods
Coca-Cola / China Huiyuan Juice
BHP Billiton / Potash Corp
BAE Systems / EADS
Shareholders
GovernmentRegulators
But… There Are Plenty of Headwinds

51
0
500
1,000
1,500
2,000
2,500
3,000
3,500
4,000
4,500
1985 1989 1993 1997 2001 2005 2009 2013
Glo
ba
l M&
A V
olu
me
($
bn
)
The Long Term View of M&A Market is Volatile… But Upward Trending
Source: Thomson Reuters
CAGR 9%