Embed Size (px)
Citation preview
Copyright @ 2008 The North American Menopause Society. Unauthorized reproduction of this article is prohibited.
Menopause: The Journal of The North American Menopause SocietyVol. 15, No. 5, pp. 1023/1026DOI: 10.1097/gme.0b013e31817f3e4d* 2008 by The North American Menopause Society
PERSONAL PERSPECTIVE
A personal perspective on fracture risk assessment tools
Bruce Ettinger, MD
AbstractThe World Health Organization and the Foundation for Osteoporosis Research and Education have each
recently posted fracture risk assessment tools on Web sites. To be most useful, these tools need to provide risk datain a form that is easily used by clinicians as they discuss treatment options with their patients. This article critiquesthese two tools and offers clinicians suggestions for key elements that should be included in fracture risk reports.Reports based on risk assessment tools need to provide data in a meaningful form that patients can easily grasp.Much more than risk numbers are needed, and, ideally, fracture risk tools should be integrated into bonedensitometry reporting or placed into comprehensive, user-friendly, decision aids.
Key Words: Fracture Y Risk assessment Y Osteoporosis Y Risk counseling.
Creators of risk models expend considerable effortmaking appropriate assumptions, determining accu-rate calculations, carefully considering complex
variables that create the Bblack box^ that we, as clinicians,never see. Although clinicians may be curious about whatgoes into making a new risk model and that model`sstrengths and limitations, we are most concerned aboutwhether we can use it as a tool to improve the way in whichwe practice. A good tool should be appropriate to the job,should allow us to do that job better, and should make ourwork easier. In this light, let me share my perspective on tworecently posted Web-based fracture tools, the World HealthOrganization`s FRAX (http://www.shef.ac.uk/FRAX) and theFoundation for Osteoporosis and Education`s FRC (http://riskcalculator.fore.org).
When do we need fracture risk tools? It would beappropriate to estimate fracture risk whenever bone densitytest results need to be explained. Fracture risk could also beincluded in general risk counseling, even if bone density hasnot been assessed. Certainly, risk data should be providedwhen counseling patients about the decision to take a drug toreduce the risks of osteoporotic fractures. These same riskdata help providers determine whether to prescribe a drug toreduce risk and how enthusiastic we should be in recom-mending treatment.
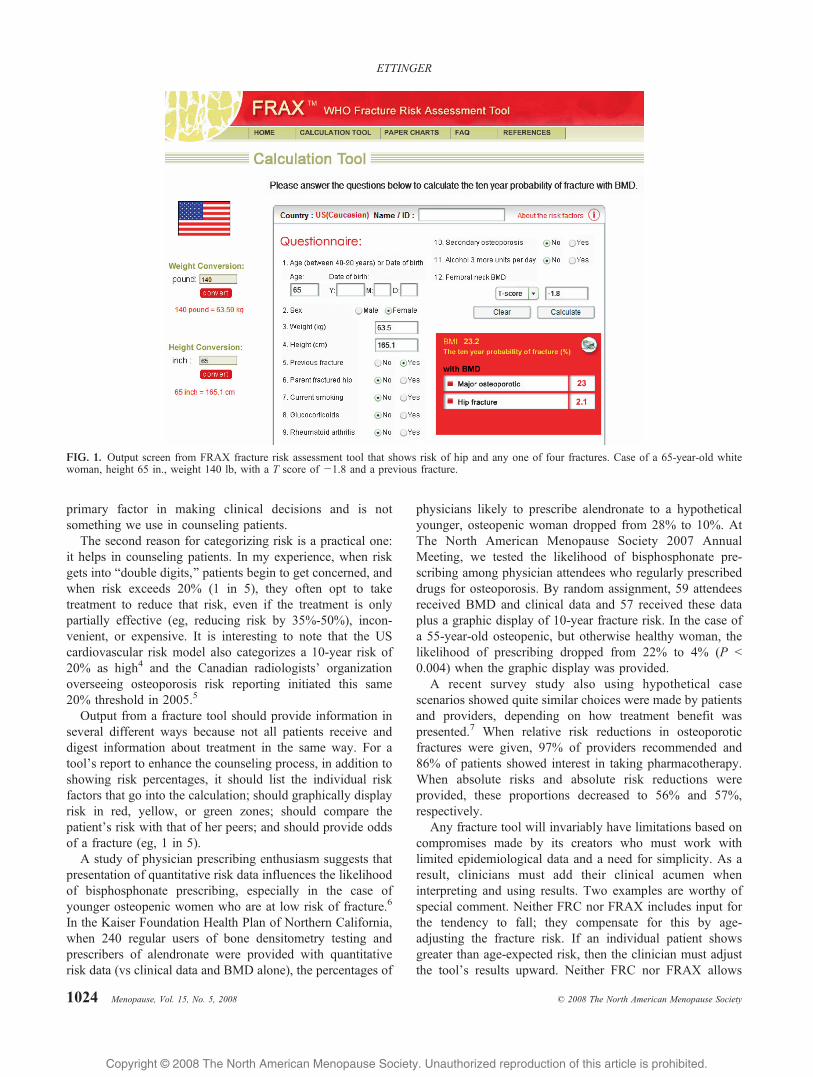
Both the FRAX (Fig. 1) and the FRC (Fig. 2) tools alloweasy entry of bone mineral density (BMD) results and severalclinical risk factors. Using FRAX, you can enter either hip Tscore or hip Z score, whereas FRC asks for hip T score only(converting T to Z internally). FRAX, being an internationalmodel, requires input of height and weight in meters andkilograms, but offers a conversion sidebar. Both toolsprovide options to calculate fracture risks for men as wellas women and for four ethnicities (white, Hispanic, Asian,and black).
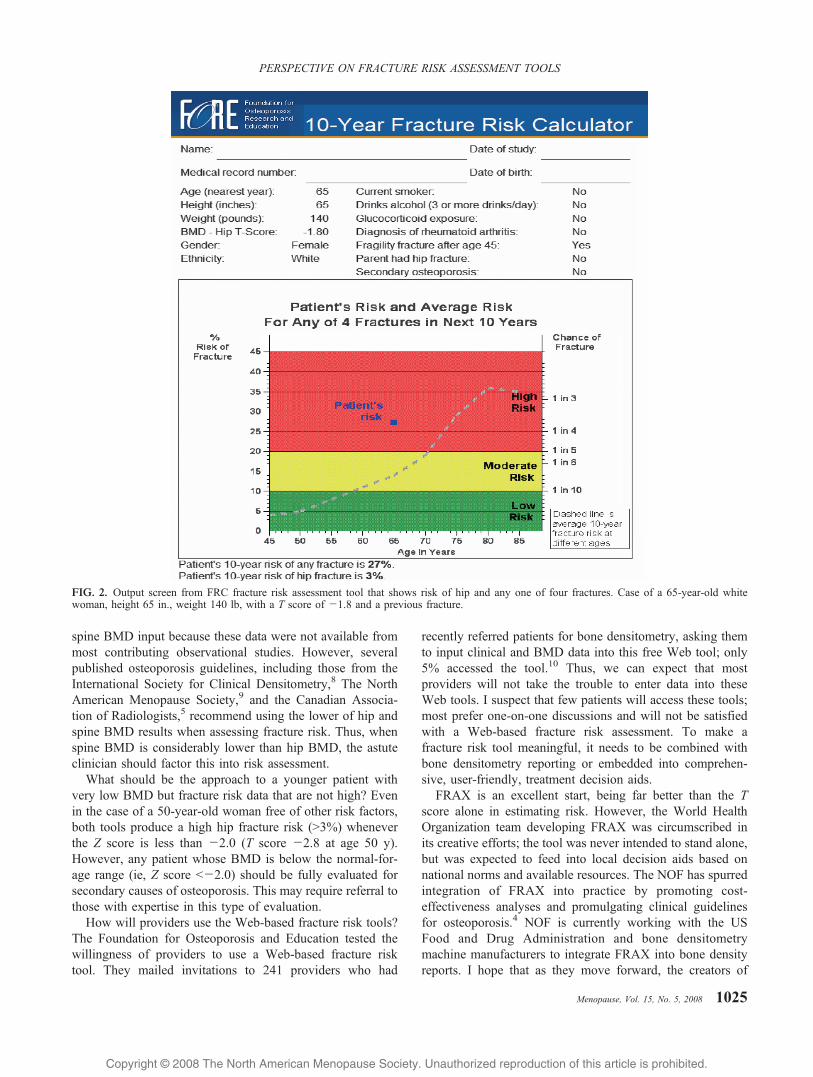
Once the input data are submitted, both tools quicklyproduce the estimated risk of hip fracture alone and the riskof any one of four osteoporotic fractures (hip, wrist, upperhumerus, and clinically apparent spine fractures). Both toolsexpress the risks as 10-year percentages and both allowprinting of both input variables and risk results. The FRCshows the patient`s risk graphically, superimposed on theaverage risk for the same gender and ethnicity. Additionally,only the FRC tool categorizes risk as low, medium, and high.
Several lines of reasoning support the concept of catego-rizing risk. The first is cost-effectiveness. Recently, theNational Osteoporosis Foundation (NOF) sponsored updatesof its US cost-effectiveness analysis for osteoporosis treat-ment.1,2 These analyses are based on a 35% risk reductionfrom treatment and use rates obtained from the US version ofFRAX to calculate cost-effectiveness. The conclusions havebeen used to update the NOF`s prevention and treatmentguidelines.3 These analyses and guidelines support thefollowing thresholds for cost-effective treatment: 20% 10-year risk for any one of four fractures and 3% 10-year risk forhip fracture alone. Thus, we can assign high risk to estimatesabove these thresholds.
Cost-effectiveness remains an important guideline forgood stewardship of resources and for determining appro-priate groups to target for treatment. However, it is not the
Received April 7, 2008; revised and accepted May 8, 2008.
From the University of California, San Francisco, San Francisco, CA.
Financial disclosure: Dr. Ettinger has received honoraria for lectures orconsultation fees from the following entities involved with osteoporosis:Berlex, Eli Lilly, Foundation for Osteoporosis Research and Education,GlaxoSmithKline, The North American Menopause Society, Organon,Proctor & Gamble, and Tethys Biosciences.
Address correspondence to: Bruce Ettinger, MD, 156 Lombard Street#13, San Francisco, CA 94111. E-mail: [email protected]
Menopause, Vol. 15, No. 5, 2008 1023
Copyright @ 2008 The North American Menopause Society. Unauthorized reproduction of this article is prohibited.
primary factor in making clinical decisions and is notsomething we use in counseling patients.
The second reason for categorizing risk is a practical one:it helps in counseling patients. In my experience, when riskgets into Bdouble digits,^ patients begin to get concerned, andwhen risk exceeds 20% (1 in 5), they often opt to taketreatment to reduce that risk, even if the treatment is onlypartially effective (eg, reducing risk by 35%/50%), incon-venient, or expensive. It is interesting to note that the UScardiovascular risk model also categorizes a 10-year risk of20% as high4 and the Canadian radiologists` organizationoverseeing osteoporosis risk reporting initiated this same20% threshold in 2005.5
Output from a fracture tool should provide information inseveral different ways because not all patients receive anddigest information about treatment in the same way. For atool`s report to enhance the counseling process, in addition toshowing risk percentages, it should list the individual riskfactors that go into the calculation; should graphically displayrisk in red, yellow, or green zones; should compare thepatient`s risk with that of her peers; and should provide oddsof a fracture (eg, 1 in 5).
A study of physician prescribing enthusiasm suggests thatpresentation of quantitative risk data influences the likelihoodof bisphosphonate prescribing, especially in the case ofyounger osteopenic women who are at low risk of fracture.6
In the Kaiser Foundation Health Plan of Northern California,when 240 regular users of bone densitometry testing andprescribers of alendronate were provided with quantitativerisk data (vs clinical data and BMD alone), the percentages of
physicians likely to prescribe alendronate to a hypotheticalyounger, osteopenic woman dropped from 28% to 10%. AtThe North American Menopause Society 2007 AnnualMeeting, we tested the likelihood of bisphosphonate pre-scribing among physician attendees who regularly prescribeddrugs for osteoporosis. By random assignment, 59 attendeesreceived BMD and clinical data and 57 received these dataplus a graphic display of 10-year fracture risk. In the case ofa 55-year-old osteopenic, but otherwise healthy woman, thelikelihood of prescribing dropped from 22% to 4% (P G0.004) when the graphic display was provided.
A recent survey study also using hypothetical casescenarios showed quite similar choices were made by patientsand providers, depending on how treatment benefit waspresented.7 When relative risk reductions in osteoporoticfractures were given, 97% of providers recommended and86% of patients showed interest in taking pharmacotherapy.When absolute risks and absolute risk reductions wereprovided, these proportions decreased to 56% and 57%,respectively.
Any fracture tool will invariably have limitations based oncompromises made by its creators who must work withlimited epidemiological data and a need for simplicity. As aresult, clinicians must add their clinical acumen wheninterpreting and using results. Two examples are worthy ofspecial comment. Neither FRC nor FRAX includes input forthe tendency to fall; they compensate for this by age-adjusting the fracture risk. If an individual patient showsgreater than age-expected risk, then the clinician must adjustthe tool`s results upward. Neither FRC nor FRAX allows
FIG. 1. Output screen from FRAX fracture risk assessment tool that shows risk of hip and any one of four fractures. Case of a 65-year-old whitewoman, height 65 in., weight 140 lb, with a T score of j1.8 and a previous fracture.
1024 Menopause, Vol. 15, No. 5, 2008 * 2008 The North American Menopause Society
ETTINGER
Copyright @ 2008 The North American Menopause Society. Unauthorized reproduction of this article is prohibited.
spine BMD input because these data were not available frommost contributing observational studies. However, severalpublished osteoporosis guidelines, including those from theInternational Society for Clinical Densitometry,8 The NorthAmerican Menopause Society,9 and the Canadian Associa-tion of Radiologists,5 recommend using the lower of hip andspine BMD results when assessing fracture risk. Thus, whenspine BMD is considerably lower than hip BMD, the astuteclinician should factor this into risk assessment.
What should be the approach to a younger patient withvery low BMD but fracture risk data that are not high? Evenin the case of a 50-year-old woman free of other risk factors,both tools produce a high hip fracture risk (93%) wheneverthe Z score is less than j2.0 (T score j2.8 at age 50 y).However, any patient whose BMD is below the normal-for-age range (ie, Z score Gj2.0) should be fully evaluated forsecondary causes of osteoporosis. This may require referral tothose with expertise in this type of evaluation.
How will providers use the Web-based fracture risk tools?The Foundation for Osteoporosis and Education tested thewillingness of providers to use a Web-based fracture risktool. They mailed invitations to 241 providers who had
recently referred patients for bone densitometry, asking themto input clinical and BMD data into this free Web tool; only5% accessed the tool.10 Thus, we can expect that mostproviders will not take the trouble to enter data into theseWeb tools. I suspect that few patients will access these tools;most prefer one-on-one discussions and will not be satisfiedwith a Web-based fracture risk assessment. To make afracture risk tool meaningful, it needs to be combined withbone densitometry reporting or embedded into comprehen-sive, user-friendly, treatment decision aids.
FRAX is an excellent start, being far better than the Tscore alone in estimating risk. However, the World HealthOrganization team developing FRAX was circumscribed inits creative efforts; the tool was never intended to stand alone,but was expected to feed into local decision aids based onnational norms and available resources. The NOF has spurredintegration of FRAX into practice by promoting cost-effectiveness analyses and promulgating clinical guidelinesfor osteoporosis.4 NOF is currently working with the USFood and Drug Administration and bone densitometrymachine manufacturers to integrate FRAX into bone densityreports. I hope that as they move forward, the creators of
FIG. 2. Output screen from FRC fracture risk assessment tool that shows risk of hip and any one of four fractures. Case of a 65-year-old whitewoman, height 65 in., weight 140 lb, with a T score of j1.8 and a previous fracture.
Menopause, Vol. 15, No. 5, 2008 1025
PERSPECTIVE ON FRACTURE RISK ASSESSMENT TOOLS
Copyright @ 2008 The North American Menopause Society. Unauthorized reproduction of this article is prohibited.
these new Btools of our trade^ will consider how to makethem easy for providers to use and meaningful to ourpatients. FRAX and FRC may be better than the tools thatwe have had up to now, but they are likely to sit on thecyberspace shelf until they are integrated into user-friendlyvehicles. Most importantly, those who create and implementthese new applications need to know that to do the best job ofosteoporosis risk assessment and counseling, clinicians needmore than numbers.
REFERENCES
1. Tosteson ANA, Melton LJ II, Dawson-Hughes B, et al. Cost-effectiveosteoporosis treatment thresholds: the United States perspective.Osteoporos Int 2008;19:437/447.
2. Dawson-Hughes B, Tosteson ANA, Melton LJ II, et al. Implications ofabsolute fracture risk assessment for osteoporosis practice guidelines inthe USA. Osteoporos Int 2008;19:449/458.
3. Clinicians Guide to the Prevention and Treatment of Osteoporosis.Available at: http://nof.org/professionals/Clinicians_Guide.htm.Accessed April 2, 2008.
4. Expert Panel on Detection, Evaluation, and Treatment of High BloodCholesterol in Adults. Executive summary of the third report of theNational Cholesterol Education Program (NCEP) Expert Panel onDetection, Evaluation, and Treatment of High Blood Cholesterol inAdults (Adult Treatment Panel III). JAMA 2001;285:2486-2497.
5. Siminoski K, Leslie WD, Frame H, et al. Recommendations for bonemineral density reporting in Canada. Can Assoc Radiol J 2005;56:178/188.
6. Ettinger B, Hillier TA, Pressman AR, Che M, Hanley DA. Simplecomputer model for calculating 5-year osteoporotic fracture risk inpostmenopausal women. J Women’s Health 2005;14:159/171.
7. Sinsky CA, Foreman-Hoffman V, Cram P. The impact of expression oftreatment efficacy and out-of-pocket expenses on patient and physicianinterest in osteoporosis treatment: implications for pay-for-performanceprograms. J Gen Intern Med 2007;23:164/168.
8. Lewiecki EM, Watts NB, McClung MR, et al. Official positions of theInternational Society for Clinical Densitometry. J Clin Endocrinol Metab2004;89:3651/3655.
9. The North American Menopause Society. Management of osteoporosisin postmenopausal women: 2006 position statement of The NorthAmerican Menopause Society. Menopause 2006;13:340/367.
10. Ettinger B, Gross C, Cody K, Walker R. Use of a web-based fracturerisk assessment tool [Abstract]. Presented at 29th Annual Meeting ofAmerican Bone and Mineral Society, Honolulu, HI, September 2007.
1026 Menopause, Vol. 15, No. 5, 2008 * 2008 The North American Menopause Society
ETTINGER