Embed Size (px)
Citation preview

The Journal of the American Nutraceutical Association
Vol. 10, No. 2, 2007 www.ana-jana.org
A Peer-Reviewed Journal on Nutraceuticals and Nutrition ISSN-1521-4524
IN THIS EDITION
• JAMA’s “Anti”– Antioxidant Study• Integrative Treatment Modalities in Cancer Care:The Good, the
Bad, and the Ugly• Eight Keys for Preventing Osteoporosis and Building Bone Strength• The Health Benefits of Vitamin D• Integrative Approaches to the Prevention and Treatment of
Diabetes• Flavonoids in Cocoa and Chocolate: Protection from
Cardiovascular Disease?• Vitamin C Supplementation for Treating Hypercholesterolemia:A
Meta-Analysis of 16 Randomized Controlled Trials• Comparison of the Absorption, Brain and Prostate Distribution,
and Elimination of CaNa2 EDTA of Rectal Chelation Suppositoriesto Intravenous Administration
Contact us for [email protected] • www.transferpoint.com
Toll Free: 877-407-3999Tel: 803-561-0342 • Fax: 803-561-9497
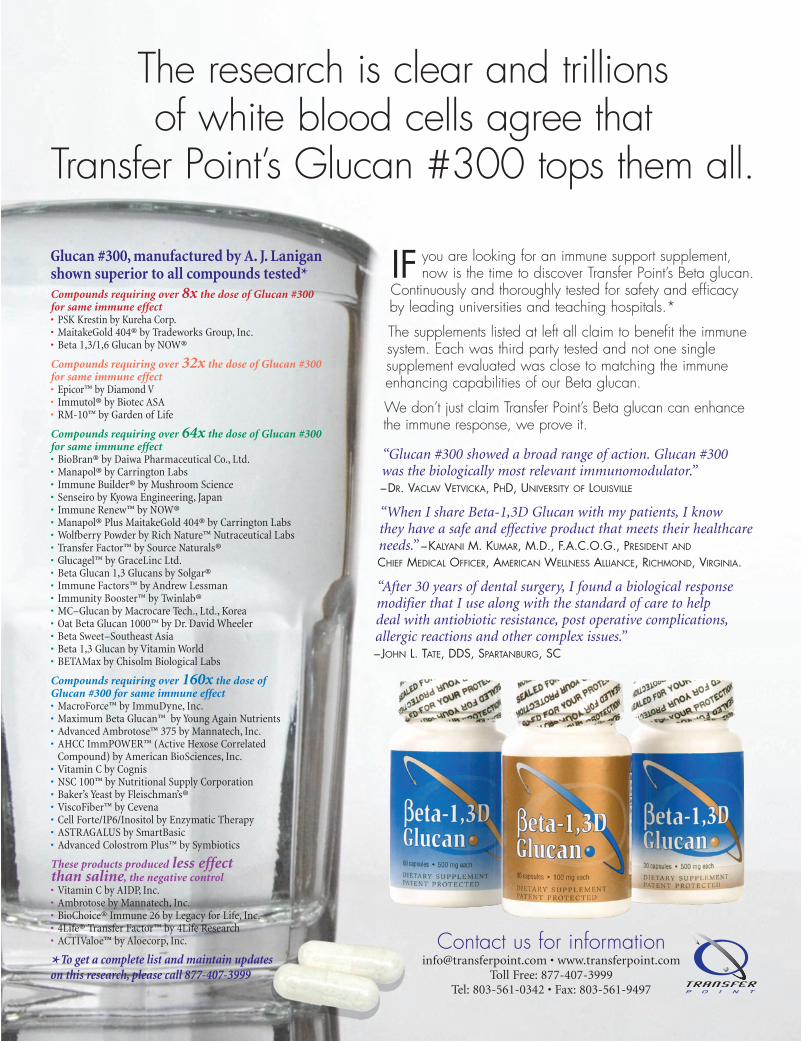
The research is clear and trillions of white blood cells agree that
Transfer Point’s Glucan #300 tops them all.
“Glucan #300 showed a broad range of action. Glucan #300 was the biologically most relevant immunomodulator.”–DR. VACLAV VETVICKA, PHD, UNIVERSITY OF LOUISVILLE
“When I share Beta-1,3D Glucan with my patients, I know they have a safe and effective product that meets their healthcareneeds.” –KALYANI M. KUMAR, M.D., F.A.C.O.G., PRESIDENT AND
CHIEF MEDICAL OFFICER, AMERICAN WELLNESS ALLIANCE, RICHMOND, VIRGINIA.
“After 30 years of dental surgery, I found a biological responsemodifier that I use along with the standard of care to help deal with antiobiotic resistance, post operative complications,allergic reactions and other complex issues.”– JOHN L. TATE, DDS, SPARTANBURG, SC
IF you are looking for an immune support supplement,now is the time to discover Transfer Point’s Beta glucan.
Continuously and thoroughly tested for safety and efficacyby leading universities and teaching hospitals.*
The supplements listed at left all claim to benefit the immunesystem. Each was third party tested and not one single supplement evaluated was close to matching the immuneenhancing capabilities of our Beta glucan.
We don’t just claim Transfer Point’s Beta glucan can enhancethe immune response, we prove it.
Glucan #300, manufactured by A. J. Laniganshown superior to all compounds tested*Compounds requiring over 8x the dose of Glucan #300 for same immune effect• PSK Krestin by Kureha Corp.• MaitakeGold 404® by Tradeworks Group, Inc.• Beta 1,3/1,6 Glucan by NOW®
Compounds requiring over 32x the dose of Glucan #300 for same immune effect• Epicor™ by Diamond V• Immutol® by Biotec ASA• RM-10™ by Garden of Life
Compounds requiring over 64x the dose of Glucan #300 for same immune effect• BioBran® by Daiwa Pharmaceutical Co., Ltd.• Manapol® by Carrington Labs• Immune Builder® by Mushroom Science• Senseiro by Kyowa Engineering, Japan• Immune Renew™ by NOW® • Manapol® Plus MaitakeGold 404® by Carrington Labs• Wolfberry Powder by Rich Nature™ Nutraceutical Labs• Transfer Factor™ by Source Naturals®• Glucagel™ by GraceLinc Ltd.• Beta Glucan 1,3 Glucans by Solgar®• Immune Factors™ by Andrew Lessman• Immunity Booster™ by Twinlab®• MC–Glucan by Macrocare Tech., Ltd., Korea• Oat Beta Glucan 1000™ by Dr. David Wheeler• Beta Sweet–Southeast Asia• Beta 1,3 Glucan by Vitamin World• BETAMax by Chisolm Biological Labs
Compounds requiring over 160x the dose ofGlucan #300 for same immune effect• MacroForce™ by ImmuDyne, Inc.• Maximum Beta Glucan™ by Young Again Nutrients• Advanced Ambrotose™ 375 by Mannatech, Inc.• AHCC ImmPOWER™ (Active Hexose Correlated
Compound) by American BioSciences, Inc.• Vitamin C by Cognis• NSC 100™ by Nutritional Supply Corporation• Baker’s Yeast by Fleischman’s®• ViscoFiber™ by Cevena• Cell Forte/IP6/Inositol by Enzymatic Therapy • ASTRAGALUS by SmartBasic• Advanced Colostrom Plus™ by Symbiotics
These products produced less effect than saline, the negative control• Vitamin C by AIDP, Inc.• Ambrotose by Mannatech, Inc.• BioChoice® Immune 26 by Legacy for Life, Inc.• 4Life® Transfer Factor™ by 4Life Research• ACTIValoe™ by Aloecorp, Inc.
* To get a complete list and maintain updates on this research, please call 877-407-3999

IF YOU
DON’T KNOW THE
POSSIBLE SIDE
EFFECTS OF MIXING
HERBS, DRUGS, AND
VITAMINS, YOU’RE
PUTTING YOURSELF
AND YOUR PATIENTS
AT RISK
IF YOU
DON’T KNOW THE
POSSIBLE SIDE
EFFECTS OF MIXING
HERBS, DRUGS, AND
VITAMINS, YOU’RE
PUTTING YOURSELF
AND YOUR PATIENTS
AT RISK
Now Available From theAmerican Nutraceutical Association Online Store
www.ana-jana.org
• Taking Echinacea and Tylenol together can severely damage the liver?
• Taking St. John’s Wort for depression while on birth control pills can lead tobreakthrough bleeding and unplanned pregnancy?
• Drinking green tea for an upset stomach can lead to false-positive results onsome tests for cancer?
Did You Know That...
THE ESSENTIAL HERB - DRUG - VITAMIN INTERACTION GUIDE to learn how hundreds of common supplements and herbs interact with popular medicines and what you can do to protect yourself. Designed so you can instantly locate and understand exactly what you need to know,
this book is an invaluable resource for taking herbs and vitamins safely.
Order your copy today from the American Nutraceutical Association for only $18.95 (plus s/h)
online at www.ana-jana.org, or call the ANA customer service department – 800-566-3622
Read
Name________________________________________________________________________________________________________________
Address______________________________________________________________________________________________________________
City________________________________________________________State_____________________Zip______________________________
Phone____________________________Fax______________________________E-mail______________________________________________
Please check your profession: ❑ Physician ❑ Pharmacist ❑ Nurse ❑ Registered Dietician ❑ Other ____________
Total amount enclosed ____________________ Make checks payable to ANA ❑ Please charge my credit card:
Card Number__________________________________________________________________ Exp. Date__________________
Signature________________________________________________________________ Date_____________________________
ORDER THE ENTIRE SET…OR INDIVIDUAL CDS
Individual CDs when purchased in addition to a complete set: 1-25 CDs, $10.95 ea. Individual CDs (purchased alone—not with a complete set, includes speakers presentation slides): 1-10 CDs – $25.00 ea.
Please send me _______ set(s) of the Nutraceuticals & Medicine Conference CDs.
Check or indicate quantity of the following individual CDs you wish to order:
Shipping & Handling Under $60 – $8.95 $61-$100 – $9.95 $100 and Over – $10.95
Fill out the following, and fax, mail, or phone: American Nutraceutical Association 5120 Selkirk Drive, Suite 100, Birmingham, AL 35242 (800) 566-3622, outside USA (205) 338-1750 Fax (205) 991-9302 Website: www. Ana-Jana.org
Entire Conference CD Set and Speakers Slides: (ANA Member Price) .........................................................................................$79.95(Non-ANA Member Price) ........................................................................................$89.95
____
____
____
____
AMERICAN NUTRACEUTICAL ASSOCIATION’S
Nutraceuticals & Medicine Conference, SPRING 2007CD-SET
Eight Keys for Preventing Osteoporosis and Building Bone Strength - Susan E. Brown, PhD, CNS, Director, The OsteoporosisEducation Project, East Syracuse, NY. Dr. Brown directs both the Nutrition Education and Consulting Service (NECS) and The OsteoporosisEducation Project in Syracuse, New York. NECS provides nutrition consulting, education and research services for the Central New York area.Dr. Brown is also a research associate, Anthropology Department, Syracuse University.
The Health Benefits of Probiotics and Their Importance in Disease Prevention: Guidelines for the Clinical Practice - Kelly A.Tappenden, PhD, RD, Associate Professor of Nutrition and GI Physiology, Department of Food Science and Human Nutrition, University ofIllinois at Urbana-Champaign, IL. Dr.Tappenden’s research program is directed at achieving a greater understanding of the regulation of smallintestinal function and health by various nutrients and gastrointestinal-specific peptides.
Integrative Approaches to the Management and Prevention of Diabetes Mellitus: Guidelines for the Clinical Practice - JayUdani, MD, CPI, Assistant Clinical Professor, UCLA /Geffen School of Medicine, Medical Director, Northridge Hospital Integrative MedicineProgram, and Medical Director, Medicus Research, Northridge, California. Jay Udani, MD, is the Medical Director of the Integrative MedicineProgram at Northridge Hospital and Assistant Clinical Professor at the UCLA /Geffen School of Medicine. Dr. Udani, a board certified Internist,was the Chief Resident of Internal Medicine at Cedars-Sinai Medical Center, and was the first Fellow in Integrative Medicine at Cedars Sinai.
Exploring Factors Related to Childhood and Adolescent Obesity: Guidelines for the Clinical Practice - Susan L. Johnson, PhD,Associate Professor, Department of Pediatrics, Director, The Children's Eating Laboratory, University of Colorado Health Sciences Center,Denver, CO. Dr. Johnson is an early childhood nutritionist in the Department of Pediatrics, UCHSC, and practices clinically at The Children’sHospital of Denver. She teaches courses in the UCDHSC School of Nursing and the UCDHSC School of Medicine regarding nutrition andfeeding of children, as well as nutrition and obesity in children and adults.

The American Nutraceutical Association PresentsThe DSHEA Home Study
Certification Course
• Recommended for nutraceutical companies, distributors, and health care professionals• Protect yourself and your business by learning what is permissible under DSHEA• Learn from leading Washington, D.C. attorneys the proper way to present third party
educational materials as allowed by the Dietary Supplement Health and Education Act • Become officially certified by The American Nutraceutical Association• Gain increased credibility and professionalism with your certification• Learn how to properly hold educational meetings on nutraceutical products
DSHEA Certification Program - The ANA offers this DSHEA Certification Course and test to nutraceutical marketing and salerepresentatives. A certificate of proficiency will be issued to those persons who score 80% or higher on the accompanying testwhich must be taken after completing the home study course and watching the video that comes with the course. Cost for thecourse is $59.95. This includes the course materials, 2-hour video, grading of your test and issuance of course certificate.
I wish to order _______DSHEA course(s) at $59.95. Shipping and handling: $8.95 for USA. $12.95 for Canada
Are you associated with a nutraceutical company? _____ yes _____ no
Name of company __________________________________________________________________________________________
Ship To:
Name:____________________________________________________________________________________________________
Address:__________________________________________________________________________________________________
City:_______________________________________________________________ State:_______________ Zip:______________
Phone:______________________ FAX:______________________Email:_____________________________________________
Method of Payment: _____ Check _____Visa _____ MC _____ AmEx _____Discover
Card Number:____________________________ Exp Date:__________Name on Card:___________________________________
Signature:_________________________________________________________________________ Date:___________________
To Order: FAX or mail this order form to: American Nutraceutical Association5120 Selkirk Drive, Suite 100 Birmingham, AL 35242
Toll Free Customer Service: (800) 566-3622Phone: (205) 980-5710 FAX: (205) 991-9302
www.ana-jana.org
To order the DSHEA Home Study Certification Course• Phone the ANA customer service department 800-566-3622, 8 AM to 5 PM (CST)
• Go to the ANA website: www.ana-jana.org• Complete the form below and fax to 205-991-9302, or mail to the address below
Now Available on CD

Contents – JANA Vol. 10, No.2, 2007
E D I T O R I A L
C O N F E R E N C E R E P O R T
C O M M E N T A R Y
To order reprints of articles, or additional copies of JANA:Allen Montgomery, RPh
5120 Selkirk Drive, Suite 100, Birmingham,AL 35242Phone 205-980-5710 Fax 205-991-9302
E-mail: [email protected] Website: www.ana-jana.org
Journal of the American Nutraceutical Association
EDITORIAL STAFF
EDITOR-IN-CHIEFMark Houston, MD
ASSOCIATE EDITORSBernd Wollschlaeger, MDBarry Fox, PhD
TECHNICAL EDITORJane LaelTerri Erickson
ART DIRECTOR Gary Bostany
EDITORIAL BOARDJordan R.Asher, MD, MsMM, SCHEthan Basch, MD, MPhilJan Basile, MDRussell Blaylock, MDHyla Cass, MDLisa Colodny, PharmD, BCNSPLoren Cordain, PhDJeanette Dunn, EdD, RN, CNSBrent Eagan, MDChristopher M. Foley, MDMichael Glade, PhDClare M. Hasler, PhD, MBARobert Krueger, PhDDaniel T. Lackland, PhDGarth L. Nicolson, PhDMark J.S. Miller, PhDRobert Rountree, MDDiana Schwarzbein, MDCatherine Ulbricht, PharmDWalter Willett, MD, DrPHBernd Wollschlaeger, MD
_____________________________
American Nutraceutical Association5120 Selkirk Drive, Suite 100Birmingham,AL 35242Phone: (205) 980-5710 Fax: (205) 991-9302Website: www.Ana-Jana.org
CEO & PUBLISHERAllen Montgomery, RPh
ANA is an alliance of healthcare professionals withinterest in nutraceutical science, technology, mar-keting and production. It was established to devel-op and provide educational materials and continu-ing education programs for healthcare profession-als on nutraceutical technology and science.
_____________________________
The Journal of the American Nutraceutical Association(ISSN-1521-4524) is published three times annuallyby the American Nutraceutical Association (ANA).Send all inquiries, letters, and submissions to theANA Editorial Department at 5120 Selkirk Drive,Suite 100, Birmingham, AL 35242. Contents ©2007 ANA,all rights reserved.Printed in the UnitedStates of America. Reproduction in whole or partis not permitted without written permission. It isthe responsibility of every practitioner to evaluatethe appropriateness of a particular opinion in thecontext of actual clinical situations. Authors, edi-tors, and the publisher cannot be held responsiblefor any typographical or other errors found in thisjournal. Neither the editors nor the publisherassume responsibility for the opinions expressedby the authors.
JAMA’s “Anti”– Antioxidant Study ............................................1Mark Houston, MD, MS, Nadine Taylor, MS, RD
Integrative Treatment Modalities in Cancer Care: ..................... 3The Good, the Bad, and the UglyBernd Wollschlaeger, MD, FAAFP
R E S E A R C H U P D A T E
Glucosamine-Like Supplement Inhibits Multiple ...................... 5Sclerosis, Type 1 Diabetes
Eight Keys for Preventing Osteoporosis and ............................ 6Building Bone StrengthSusan E. Brown, PhD, CNS
The Health Benefits of Vitamin D .............................................. 14Bruce W. Hollis, PhD
Integrative Approaches to the Prevention ............................... 20and Treatment of DiabetesJay Udani, MD
Flavonoids in Cocoa and Chocolate ........................................ 25Protection from Cardiovascular Disease?Prof. Dr. Helmut Sies
JANA Case Report ..................................................................... 29Seth Baum, MD, FACC
O R I G I N A L R E S E A R C H
M E T A - A N A L Y S I S A R T I C L E
Comparison of the Absorption, Brain and .............................. 38Prostate Distribution, and Elimination of CaNa2 EDTA of Rectal Chelation Suppositories to Intravenous Administration
Rita Ellithorpe, MD, Paul Mazur, PhD, Glenwood Gum, PhD,Gerry Button, BS, Julian Le, BS, Ernest H. Pfadenhauer, MS,Robert A. Settineri, MS, Garth Nicolson, PhD
R E V I E W A R T I C L E
C A S E R E P O R T
Vitamin C Supplementation for Treating................................... 30Hypercholesterolemia: A Meta-Analysis of 16 Randomized Controlled TrialsMarc P. McRae, MSc, DC, FACN

JANA Vol. 10, No. 2, 2007 1
E D I T O R I A L
JAMA’s “Anti”- Antioxidant Study
Mark Houston, MD, MS* Associate Clinical Professor of Medicine, Vanderbilt University School of Medicine
Director, Hypertension Institute, Nashville TennesseeEditor-in-Chief, JANA
Nadine Taylor, MS, RD Chair, Women’s Health Advisory Council,
American Nutraceutical AssociationAssociate Editor, JANA
Like millions of health-conscious Americans, we weretroubled (although not exactly panicked) by the meta-analy-sis published in the February, 2007 edition of the Journal ofthe American Medical Association, proclaiming that antiox-idants were not only ineffective at reducing mortality, but(in the case of vitamins A and E) might actually increase it!1
Our first instinct was to be suspicious: a wealth of scientif-ic evidence shows that antioxidants are vitally importantdisease fighters, immune boosters and promoters of goodhealth. And as we looked more closely at the study, wefound that our instincts were correct. The study used flawedpremises to produce a flawed finding.
How did these researchers arrive at their startling con-clusion? If you studied statistics, you may remember yourprofessor cautioning you that, “If you torture the data longenough, they’ll confess to anything.” In other words, if you“cherry pick” the studies you use so that you can include thefavorable ones and exclude the unfavorable ones, if youdefine “biased” and “unbiased” studies according to yourown rules, if you combine the data from wildly differingkinds of studies in the same data pool and otherwise “mas-sage” the data, you can make your study “prove” whateveryou want it to prove.
Such is the case with the JAMA meta-analysis which,by definition, offers nothing new and is just a “re-hash” offindings taken from previous studies. One of its most glar-ing flaws occurs right up front, with the selection of studies.The team of Danish researchers who authored the analysiscollected studies of the effects of five antioxidants – beta-carotene, vitamins A, C and E and selenium – on the deathrates of healthy and unhealthy subjects. Yet anyone attempt-ing to make a statement about antioxidants and mortalityneeds to include a great many other powerful and well-researched antioxidants, such as alpha-lipoic acid, carni-tine, ginkgo biloba, grape seed extract, EGCG, lutein,lycopene and co-enzyme Q10, among others. Why limit thefocus to these five?
Then, from an original pool of 815 studies, theresearchers excluded a whopping 747 of them (91.5%) forone reason or another, leaving just 8% on which to basetheir conclusions. Of the excluded studies, 405 were reject-ed simply because none of the participants in these studieshad died. But how can the researchers possibly prove thatantioxidants have no effect on mortality if they’ve eliminat-ed almost half of the studies in the data pool specificallybecause there was no mortality?
But just for argument’s sake, let’s imagine for amoment that they were right in eliminating the 747 studiesand whittling the data pool down to just 68 studies. Themeta-analysis would still be fatally flawed, as the includedstudies were far too diverse in subject, dosage, length andmethods to be able to produce a credible conclusion.
For example, several different antioxidants were usedin these studies, some singly, some in various combinations,
* Correspondence:Mark Houston, MD, MSHypertension Institute4230 Harding Road, Suite 400Nashville, Tennessee 37205Phone: (615) 297-2700 Fax:(615) 467-0365E-mail: [email protected]

JANA Vol. 10, No. 2, 2007 2
and some as parts of groups that included still other sub-stances, such as lutein or zinc. How could the researcherspossibly determine which element or combination of ele-ments (if any) was responsible for the results?
The studies also involved differing forms of the supple-ments. In all cases, synthetic versions of the antioxidantswere used, despite the fact that the synthetics behave differ-ently in the body than the natural versions and don’t includeall the “parts” of a nutrient’s natural spectrum. For example,the vitamin E studies used synthetic alpha-tocopherol, eventhough it is well-established that the natural forms of the vit-amin are much better absorbed and retained. And while thestudies of the effects of synthetic vitamin E have often pro-duced disappointing results, emerging evidence suggeststhat one of the natural forms, gamma-tocopherol, may havegreater antioxidant and anti-inflammatory abilities than anyother form of E. Yet the researchers only included studies ofsynthetic E. Similarly, synthetic versions of beta-carotenewere used, even though this form has been shown to increasethe risk of coronary heart disease, as well as lung cancer insmokers. However, no evidence implicates the natural formsof the vitamin in the development of these diseases.
Dosages and treatment times also ran the gamut frommoderate amounts of antioxidants taken over a period ofyears, to (in one case) a huge dose of 200,000 IU vitamin Etaken for just a single day. What conscientious conclusioncan be drawn from such diverse data? Was the increased
mortality risk the result of taking too much of an antioxi-dant? Too little? Or neither?
But perhaps the biggest flaw of all in the JAMA studylies in the merging of studies of healthy people with those ofunhealthy people to come up with an overall mortality risk.The study population makes a huge difference in the out-come. Combining these two groups automatically skews theresults, as the risk of death in the chronically ill is inherent-ly much higher than it is in healthy people. Plus, no one hasever claimed that antioxidants can prevent death in thosewho are seriously ill. Lumping together the death rates fromboth of these groups to come up with a link between antiox-idant use and the risk of mortality is simply bad science.
Professor Balz Frei, Director of the Linus PaulingInstitute at Oregon State University, may have summed itup best when he said: “All the new study really demon-strates is a bias toward identifying studies or research thatshow harm caused by antioxidants, and selective removal ofresearch that shows benefits.”
REFERENCES
1. Bjelakovic G, Nikolova D, Gluud LL, et al. Mortality inrandomized trials of antioxidant supplements for primaryand secondary prevention: systematic review and meta-analysis. JAMA. 2007;297(8):842-57.
The Journal of the American Nutraceutical Association (JANA)
To subscribe: Phone 800-566-3622
(outside the USA, 205-833-1750),or visit www.ana-jana.org
SUBSCRIBE TO THE
LEADING JOURNAL ONNUTRACEUTICAL SCIENCE
TODAY!

JANA Vol. 10, No. 2, 2007 3
C O M M E N T A R Y
Integrative Treatment Modalities in Cancer Care: The Good, the Bad, and the Ugly
Bernd Wollschlaeger, MD, FAAFP*Associate Editor of the Journal of the American Nutraceutical Association
“The plural of anecdote is not evidence.” (Mark Twain)
The use of complementary and alternative medicine(CAM) is typically higher among cancer patients than thegeneral population. According to a recently completedstudy presented at the Society for Integrative OncologyThird International Conference (Abstract F065), 71% of allcancer patients use dietary supplements, 53% do not seekthe advice of health care professionals about their use and23% of the dietary supplements used are known to haveadverse interactions with certain medications.
At the same conference, researchers from the Dana-Farber Cancer Institute reported (Abstract F075) that 77%of all breast cancer patients use some form of CAM!
Its is important to emphasize that 60% of all breast can-cer patients surveyed reported their first CAM use beforetheir diagnosis.
As a family physician, I integrate alternative and com-plementary treatment modalities into my clinical practice,
and often encounter patients suffering from various formsof cancer who are desperately seeking “the cure” for theirdisease. Most of them are clearly interested in CAM modal-ities and are seeking my guidance in applying those modal-ities in the management of their cancer care. Most of themreport that their oncologist is either uninformed about therational application of CAM modalities in cancer care, orrejects CAM altogether.
These patients are then left alone in their decisionabout what CAM modalities to use. The overwhelmingmajority utilize “Dr. Internet” in the search for more infor-mation and guidance.
Unfortunately, many supplement marketers heavilypromote their products for use by cancer patients by usinghigh-pressure sales tactics spiked with testimonials. Peoplewho claim to be cancer survivors swear that product X hascured their disease and they are now cancer-free. As aresult, desperate cancer patients are spending tens of thou-sands of dollars for supplements that are either useless oroutright dangerous for the management or treatment oftheir disease.
As patient advocates and proponents of integrativemedicine, we should reject the boiler-room tactics ofunscrupulous dietary supplement “cowboys” who prey onthe vulnerability of cancer patients. Instead, we should offerguidance for rational CAM use and seek to coordinate theapplication of CAM modalities with our patients’ oncolo-gists. This requires detailed and intimate knowledge of theproducts used, their efficacy, pharmacology and safety.
* Correspondence:Bernd Wollschlaeger, MD, FAAFPAventura Family Health Center16899 NE 15th Ave.North Miami Beach, FL 33162-2914Phone: 305-342-2522E-mail: [email protected]

JANA Vol. 10, No. 2, 2007 4
Physicians need to convey to patients that promisingresults from cell culture and animal studies do not neces-sarily translate into clinical application. Furthermore, theresults of epidemiological studies need to be validated byeither carefully designed case-control studies or prospec-tive, double-blind randomized controlled trials.
Case-control studies involve patients who already havea disease or other condition. Researchers look back to seeif these patients have characteristics that differ from thosewho don’t have the disease. Case-control studies are valu-able investigative tools, but caution should be exercisedunless other more robust evidence confirms their results.
A prime example of a successful case-control studywas the demonstration of the link between tobacco smokingand lung cancer. On the other hand, several case-control
CAM and Cancer: How Can I Use Research News?
1. Soy Consumption in Childhood May Decrease Breast Cancer Risk:
Study method: Case-control analysis of 1,500 Asian-American Women, ages 20-55, interviewed about diet and
lifestyle, 597 breast cancer cases and 966 controls.
Results: Women who ate the most soy-based foods during ages 5-11 reduced risk of breast cancer by 58%.
Limitations: No prospective data of large population study available; variables are not controlled and can there-
fore falsely suggest causality.
Source: National Cancer Institute, Abstract B163 AACR, Frontiers in Cancer Prevention Research.
2. Grape Seed Extract Found to Suppress Hormone Induced Cancer: A Natural Aromatase Inhibitor?
Study method: Seven fruit juices tested in breast cancer cell culture assays.
Results: Grape seed extract contains compounds (procyanidin B dimers) with inhibitory effect on breast cancer
cell growth (ability to inhibit human aromatase in cell assay).
Limitations: Cell-culture assay ONLY! Phase I trial required (ongoing) to test effect of grape seed extracts in
healthy women with no history of breast cancer (primary endpoint: level of estrogen suppression as measured by
pre- and post-treatment changes).
Source: Third International Conference of the Society for Integrative Oncology, (Poster C021).
studies identified a link between combined hormonereplacement therapy (HRT) and reductions in incidence ofcoronary heart disease (CHD) in women. Based on thisdata, the consensus arose that HRT was protective againstCHD. Larger follow-up studies involving whole popula-tions (Women’s Health Initiative) contradicted these results.
Such large clinical trials are necessary to assess theefficacy and safety of CAM in cancer patients, and we musteducate health care professionals about the advantages andlimitations of CAM among cancer patient populations.
Our readers deserve professional advice and guidancewhen considering the use of CAM, therefore, JAMA willcontinue to publish peer-reviewed articles reflecting evi-dence-based management approaches that contain the lat-est, most objective information available.

5JANA Vol. 10, No. 2, 2007
R E S E A R C H U P D A T E
Glucosamine-Like Supplement Inhibits Multiple Sclerosis, Type 1 Diabetes
Metabolic therapy study at UC Irvine shows promise for treating autoimmune diseases.
A glucosamine-like dietary supplement has been foundto suppress the damaging autoimmune response seen inmultiple sclerosis and type-1 diabetes mellitus, according toUniversity of California, Irvine health sciences researchers.
In studies on mice, Dr. Michael Demetriou and col-leagues with the UC Irvine Center for Immunology foundthat N-acetylglucosamine (GlcNAc), which is similar butmore effective than the widely available glucosamine, inhib-ited the growth and function of abnormal T-cells that incor-rectly direct the immune system to attack specific tissues inthe body, such as brain myelin in MS and insulin-producingcells of the pancreas in diabetes. Study results appear on theonline version of the Journal of Biological Chemistry.
“This finding shows the potential of using a dietarysupplement to help treat autoimmune diseases,” saidDemetriou, an assistant professor of neurology, and micro-biology and molecular genetics. “Most importantly, weunderstand how this sugar-based supplement inhibits thecells that attack the body, making metabolic therapy a ratio-nal approach to prevent or treat these debilitating diseases.”
The UC Irvine study defines how metabolic therapywith the sugar GlcNAc and other related nutrients modifiesthe growth and autoimmune activitiy of T-cells. Virtually allproteins on the surface of cells, including T-cells, are mod-ified with complex sugars of variable lengths and composi-tion. Recent studies have shown that changes in these sug-ars are often associated with T-cell hyperactivity andautoimmune disease.
In mouse models of both MS and type 1 diabetes,Demetriou and colleages found that GlcNAc prevented thishyperactivity and autoimmune response by increasing sugarmodifications to the T-cell proteins. This therapy normal-ized T-cell function and prevented development of paralysisin MS and high blood glucose levels in type 1 diabetes.
This study comes on the heels of others showing thepotential of GlcNAc in humans. One previous clinical studyreported that 8 of 12 children with treatment-resistantautoimmune inflammatory bowel disease improved signifi-cantly following two years of treatment with GlcNAc. Nosignificant adverse side effects were noted.
“Together, these findings identify metabolic therapyusing dietary supplements such as GlcNAc as potentialtreatments for autoimmune diseases.” Demetriou said.“Excitement for this treatment strategy stems from thenovel mechanism for affecting T-cell function and autoim-munity and the availability and simplicity of its use.However, additional studies in humans will be required toassess the full potential of this therapeutic approach.”
Autoimmune diseases such as MS and type 1 diabetesmellitus result from poorly understood interactions betweeninherited genetic risk and environmental exposure. MSresults in neurological dysfunction, while uncontrolledblood glucose in type 1 diabetes can lead to damage of mul-tiple organs.
Ani Grigorian, Sung-Uk Lee, Wenqiang Tian, I-JuChen and Guoyan Gao of UC Irvine and RichardMendelsohn and James W. Dennis of the Samuel LunenfeldResearch Institute in Toronto participated in the study,which was funded by the National Institutes of Health, theNational Multiple Sclerosis Society, the Juvenile DiabetesResearch Foundation, the Wadsworth Foundation and theCanadian Institutes for Health Research.
For more information on this study, Contact: Tom Vasich
University of California - Irvine
6 JANA Vol. 10, No. 2, 2007
C O N F E R E N C E R E P O R T
Eight Keys for Preventing Osteoporosis andBuilding Bone Strength
Proceedings Report from the American Nutraceutical Association’s Spring 2007 CMEConference in Long Beach, California, March 24, 2007
Susan E. Brown, PhD, CNS, Director, The Osteoporosis Education Project, East Syracuse, New York
Dr. Brown directs both the Nutrition Education and Consulting Service (NECS), and The Osteoporosis Education Projectin Syracuse, New York. NECS provides nutrition consulting, education, and research services for the Central New Yorkarea. The Osteoporosis Education Project is a non-profit, public-interest research and education organization with themission of exploring the human potential for bone health regeneration. Dr. Brown is also a research associate,Anthropology Department, Syracuse University. The following report was prepared from her presentation by JANAAssociate Editor Barry Fox, PhD.
INTRODUCTION
According to the National Osteoporosis Foundation, anestimated 10 million Americans have osteoporosis, andsome 34 million more are at increased risk of developingthe disease. At the American Nutraceutical Association’sconvention in Long Beach, California, Dr. Brown presentedher eight key steps for preventing osteoporosis and buildingbone strength.
Key 1. Focus on Bone Strength, Not Just Bone MineralDensity
Measuring bone mineral density (BMD) provides inter-esting and useful information, but BMD in and of itselfdoes not indicate bone strength or predict fracture risk. Asosteoporosis expert Robert Heaney, MD, noted,1 “low bonemass probably accounts for less than half of all osteoporot-ic fractures.” Approximately 50% of bone fractures occur inpeople who do not have significantly low BMD.
A number of factors play a role in bone strength,including the bone’s geometry, microarchitecture, and mate-rial properties. (See Figure 1)
Rather than focusing on BMD, think in terms of a rangeof factors that contribute to the risk of fracture, including:
Key 2. Envision a Total Load of Bone-Weakening Factors• History – previous fracture or a family history of hip fracture• Weight – being underweight, thin, or experiencing weight loss
with aging• Diet – a history of dieting• Medications – use of steroids, anticonvulsants, and certain
other drugs• Exercise – lack of exercise• Muscle mass – little muscle mass• Irregular periods or early menopause
• Advanced age
• Propensity towards falling
• Bone status – ongoing bone loss, high bone turnover• Nutrient status – vitamin D deficiency
The Study of Osteoporotic Fractures Research Groupexamined numerous risk factors for fracture and reportedtheir findings in the New England Journal of Medicine in1995.2 The authors of this paper found that hip fracture riskwas 17 times greater among the 15% of the women whohad 5 or more risk factors – exclusive of bone density –than the 47% of the women who had two or fewer risk fac-tors (see Figure 3).

JANA Vol. 10, No. 2, 2007
Those most likely to suffer a bone fracture had severalrisk factors, as well as low BMD—but not just low BMD.The risk factors included maternal history of hip fracture,factures of any kind after the age of 50, previous hyperthy-roidism, being tall at age 25, having fair or poor health, tak-ing long-acting benzodiaepines or anticonvulsant drugs,ingesting large amounts of caffeine, and spending fourhours a day or less on one’s feet.
Key 3. Maximizing the 19 Key Bone-Building Nutrients
Calcium is the nutrient most people think of when dis-cussing bone health, and, indeed, this mineral is vital tobone health. Yet the typical diet provides only about 600 mgper day. This is less than the RDA of 800-1,200 mg for adultwomen, and far less than the therapeutic dose, which rangesfrom 1,000-1,500 mg.
But just as measuring bone mineral density alone isn’tthe best way to determine the risk of bone fracture, empha-sizing only calcium intake/status isn’t the best way to buildbones. That’s because a number of nutrients work in concertto improve bone strength. There are, in fact, 19 key bone-building nutrients, including calcium, vitamin D, vitamin K,vitamin A, vitamin C, vitamin B12, vitamin B6, folic acid,magnesium, phosphorus, potassium, fluoride, silica, zinc,protein, manganese, copper, boron, and iron.
Vitamin D
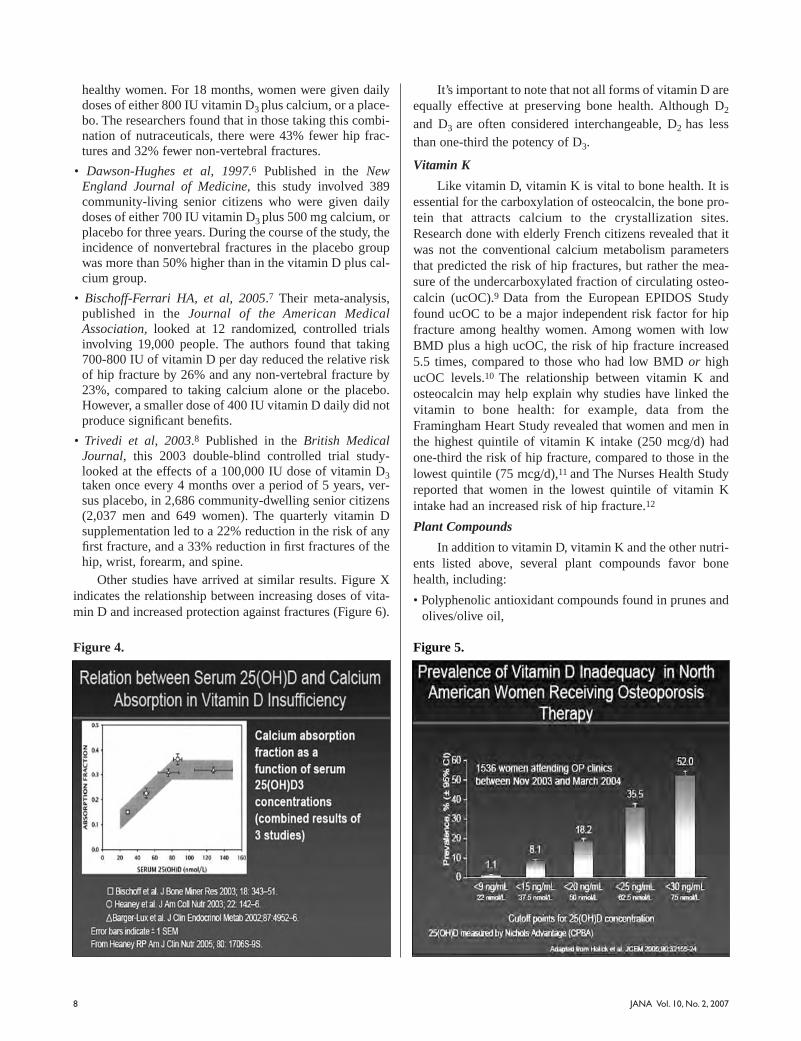
One of the most important of the 19 is vitamin D, as theabsorption of calcium depends on its presence. When vita-min D levels are low, calcium absorption can decrease by asmuch as 65%. So trying to build strong bones by givingpatients higher and higher amounts of calcium is uselessunless there is also a sufficient amount of vitamin D. Figure4 shows how calcium absorption increases as vitamin D(serum 25(OH)D) concentrations rise.
In 2003, Heaney et al established that healthy post-menopausal women with serum 25(OH)D levels averaging86.5 nmol/L had calcium absorption efficiencies that were65% greater than those with mean 25(OH)D levels of 50.1nmol/L.3 While both of these levels are within the normalreference range, the former obviously encourages a bettercalcium status than the latter (Figure 4).
Unfortunately, vitamin D deficiency is widespread: Fullyhalf of adults in the US and Europe, and up to two-thirds ofpostmenopausal women, are vitamin-D-deficient (Figure 5).
Numerous studies have examined the effects of vita-min D on fracture risk. These include:
• Papadimitropoulos E, et al, 2002.4 The authors of this meta-analysis examined clinical trials using varying doses of vita-min D, and concluded that vitamin D reduced the risk of ver-tebral fractures by 37% and non-vertebral fractures by 23%.
• Chapuy MC, et al, 1992.5 This clinical trial published inthe New England Journal of Medicine involved 3,270
Bone Strength
Bone Turnover
Structural properties• Geometry
-Size-Shape
• Microarchitecture-Trabecular architecture- Corticoal thickness/porosity
Material properties• Mineral
-Mineral-to-matrix ratio-Crystal size
• Collagen-Type-Cross links
• Microdamage/microfracture
Figure 1. Bone quality framework.
Figure 2. Bone-depleting total load.
Figure 3. Annual risk of hip fracture according to the numberof risk factors and the age-specific calcaneal bone density.
7
8 JANA Vol. 10, No. 2, 2007
healthy women. For 18 months, women were given dailydoses of either 800 IU vitamin D3 plus calcium, or a place-bo. The researchers found that in those taking this combi-nation of nutraceuticals, there were 43% fewer hip frac-tures and 32% fewer non-vertebral fractures.
• Dawson-Hughes et al, 1997.6 Published in the NewEngland Journal of Medicine, this study involved 389community-living senior citizens who were given dailydoses of either 700 IU vitamin D3 plus 500 mg calcium, orplacebo for three years. During the course of the study, theincidence of nonvertebral fractures in the placebo groupwas more than 50% higher than in the vitamin D plus cal-cium group.
• Bischoff-Ferrari HA, et al, 2005.7 Their meta-analysis,published in the Journal of the American MedicalAssociation, looked at 12 randomized, controlled trialsinvolving 19,000 people. The authors found that taking700-800 IU of vitamin D per day reduced the relative riskof hip fracture by 26% and any non-vertebral fracture by23%, compared to taking calcium alone or the placebo.However, a smaller dose of 400 IU vitamin D daily did notproduce significant benefits.
• Trivedi et al, 2003.8 Published in the British MedicalJournal, this 2003 double-blind controlled trial study-looked at the effects of a 100,000 IU dose of vitamin D3taken once every 4 months over a period of 5 years, ver-sus placebo, in 2,686 community-dwelling senior citizens(2,037 men and 649 women). The quarterly vitamin Dsupplementation led to a 22% reduction in the risk of anyfirst fracture, and a 33% reduction in first fractures of thehip, wrist, forearm, and spine.
Other studies have arrived at similar results. Figure Xindicates the relationship between increasing doses of vita-min D and increased protection against fractures (Figure 6).
It’s important to note that not all forms of vitamin D areequally effective at preserving bone health. Although D2
and D3 are often considered interchangeable, D2 has lessthan one-third the potency of D3.
Vitamin K
Like vitamin D, vitamin K is vital to bone health. It isessential for the carboxylation of osteocalcin, the bone pro-tein that attracts calcium to the crystallization sites.Research done with elderly French citizens revealed that itwas not the conventional calcium metabolism parametersthat predicted the risk of hip fractures, but rather the mea-sure of the undercarboxylated fraction of circulating osteo-calcin (ucOC).9 Data from the European EPIDOS Studyfound ucOC to be a major independent risk factor for hipfracture among healthy women. Among women with lowBMD plus a high ucOC, the risk of hip fracture increased5.5 times, compared to those who had low BMD or highucOC levels.10 The relationship between vitamin K andosteocalcin may help explain why studies have linked thevitamin to bone health: for example, data from theFramingham Heart Study revealed that women and men inthe highest quintile of vitamin K intake (250 mcg/d) hadone-third the risk of hip fracture, compared to those in thelowest quintile (75 mcg/d),11 and The Nurses Health Studyreported that women in the lowest quintile of vitamin Kintake had an increased risk of hip fracture.12
Plant Compounds
In addition to vitamin D, vitamin K and the other nutri-ents listed above, several plant compounds favor bonehealth, including:
• Polyphenolic antioxidant compounds found in prunes andolives/olive oil,
Figure 4. Figure 5.
9JANA Vol. 10, No. 2, 2007
• Fibers such as the fructan inulin, which is fermented bycertain bacteria in the intestine, thus producing the moreacidic environment that favors calcium absorption,
• The MK-7 (menaquinone-7) found in fermented soy(natto) and some cheeses,
• Isoflavones in soy, other beans, clover, flax, licorice, andother foods, and
• Omega-3 fatty acids.
Key 4. Develop an Alkaline Diet
Human bone has several obvious structural functions: itprovides rigidity, levers for muscles, and organ protection.But it also has several critical metabolic functions, servingas a blood cell incubator, ensuring blood calcium home-ostasis, and protecting the systemic acid-base balance. Theidea that the skeleton contributes to the preservation of thebody’s pH and the defense against acid-base disorders isover 100 years old. Today we understand that bone is agigantic alkali buffer exchange column. In fact, bone andthe hydration shell around the bones are loaded with alkalibuffer compounds, containing 80% of the body’s carbonateand citrate, 53-80% of the magnesium, 35% of the sodium,and 0.1-0.2% of the potassium.
The bone will sacrifice its structural functions to sup-port the body’s metabolic functions. Several studies haveshown that as net acid excretion (NEA) increases, bone for-mation slows down and bone resorption, urinary calciumloss and PTH are increased, as the bone minerals take on therole of alkali buffers. This is the body’s normal acid-basehomeostatic response to an acid load. Unfortunately, con-temporary diets are typically net acid producers, triggeringlow-grade systemic metabolic acidosis even in healthyadults, leading to a reduction in bone mineral content.
The best way to handle this problem is to neutralize theacid load. Research indicates that neutralizing metabolicacidosis can lead to:13
• decreased blood acidity• decreased kidney calcium excretion• improved calcium and phosphorus balances• decreased urinary nitrogen wasting (enough to prevent con-
tinued muscle loss and restore previously accrued deficits)• decreased bone resorption• increased bone formation
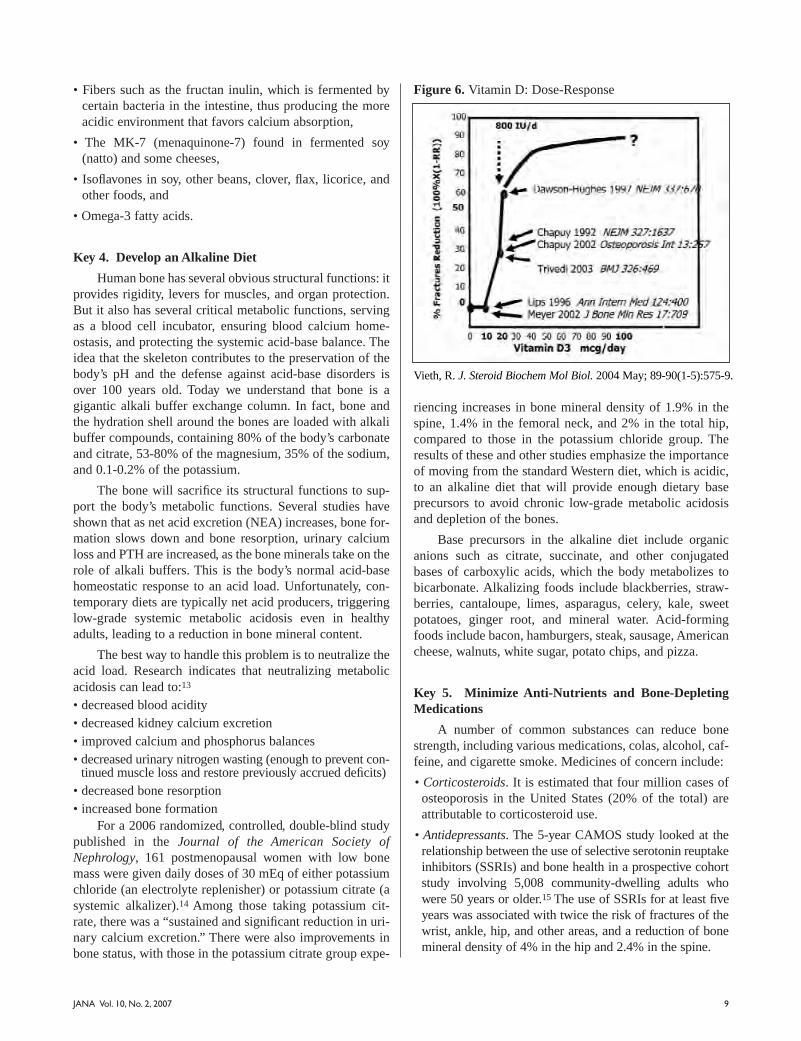
For a 2006 randomized, controlled, double-blind studypublished in the Journal of the American Society ofNephrology, 161 postmenopausal women with low bonemass were given daily doses of 30 mEq of either potassiumchloride (an electrolyte replenisher) or potassium citrate (asystemic alkalizer).14 Among those taking potassium cit-rate, there was a “sustained and significant reduction in uri-nary calcium excretion.” There were also improvements inbone status, with those in the potassium citrate group expe-
riencing increases in bone mineral density of 1.9% in thespine, 1.4% in the femoral neck, and 2% in the total hip,compared to those in the potassium chloride group. Theresults of these and other studies emphasize the importanceof moving from the standard Western diet, which is acidic,to an alkaline diet that will provide enough dietary baseprecursors to avoid chronic low-grade metabolic acidosisand depletion of the bones.
Base precursors in the alkaline diet include organicanions such as citrate, succinate, and other conjugatedbases of carboxylic acids, which the body metabolizes tobicarbonate. Alkalizing foods include blackberries, straw-berries, cantaloupe, limes, asparagus, celery, kale, sweetpotatoes, ginger root, and mineral water. Acid-formingfoods include bacon, hamburgers, steak, sausage, Americancheese, walnuts, white sugar, potato chips, and pizza.
Key 5. Minimize Anti-Nutrients and Bone-DepletingMedications
A number of common substances can reduce bonestrength, including various medications, colas, alcohol, caf-feine, and cigarette smoke. Medicines of concern include:
• Corticosteroids. It is estimated that four million cases ofosteoporosis in the United States (20% of the total) areattributable to corticosteroid use.
• Antidepressants. The 5-year CAMOS study looked at therelationship between the use of selective serotonin reuptakeinhibitors (SSRIs) and bone health in a prospective cohortstudy involving 5,008 community-dwelling adults whowere 50 years or older.15 The use of SSRIs for at least fiveyears was associated with twice the risk of fractures of thewrist, ankle, hip, and other areas, and a reduction of bonemineral density of 4% in the hip and 2.4% in the spine.
Figure 6. Vitamin D: Dose-Response
Vieth, R. J. Steroid Biochem Mol Biol. 2004 May; 89-90(1-5):575-9.
JANA Vol. 10, No. 2, 200710
• Proton pump inhibitors (PPIs). The results of a nestedcase-control study of 13,556 people with hip fractures and135,386 controls were published in the Journal of theAmerican Medical Association in 2006.16 Those takinghigh doses of PPIs for more than a year were 2.6 timesmore likely to fracture a hip, compared to non-users.Taking modest doses of PPIs regularly for 1 to 4 yearsincreased the risk of hip fracture 1.2 to 1.6 times.
Key 6. Exercise Into Bone Health
Exercise has long been recognized as an importantbeneficial factor in bone health. Studies that support thisidea include:
• 1999 Osteoporosis International meta-analysis. Thismeta-analysis reviewed 25 randomized and non-random-ized controlled trials on the effect of exercise training onbone mass.17 The weighted overall treatment effects forthe randomized controlled trials consistently showed that“exercise training programs prevented or reversed almost1% of bone loss per year” in the lumbar spine and femoralneck of both pre-and postmenopausal women.
• 2002 Journal of the American Medical Associationprospective analysis. Data from 61,200 postmenopausalUS nurses was analyzed in this 12-year observationalstudy.18 The women who exercised the most—equivalentto either an hour a day of walking or three hours of jog-ging per week—had a 55% reduction in hip fracture risk.Even those who exercised less than this received somebenefits. Compared to mostly sedentary women, thosewho walked slightly over 30 minutes per day had a 40%reduction in hip fracture risk.
Surprisingly, it’s not just aerobic exercises that helpmaintain bone health. A 1984 Mayo Clinic study looking atwomen with histories of spinal fracture found that doingsimple back strengthening exercises over the course of yearscould reduce the incidence of new spinal fractures by morethan two-thirds.19
Key 7. Consider the Nutrient-Related PharmacologicalTherapies
Should bone strength fall, you may want to consider theuse of certain nutrients that can aid in rebuilding bonestrength as part of your over-all treatment.
Vitamin K2 (menaquinone) has important bone-pre-serving properties. A systemic review and meta-analysis ofthe effects of vitamin K (in the forms of phytonadione andmenaquinone) on fracture reduction was published in theArchives of Internal Medicine in 2006.20 Seven randomizedcontrolled trials using menaquinone were included: sixusing 45 mg/day, and one using 15 mg/day. The researchersfound that use of menaquinone produced a 77% reduction
in hip fractures, 60% reduction in vertebral fractures, and81% reduction in all non-vertebral fractures.
Strontium, a naturally-occurring mineral present inwater and food found in trace amounts in the human skele-ton, promotes bone formation and decreases bone resorp-tion. Two meta-analyses of strontium, using 3 and 4 ran-domized controlled trials respectively, found a reduction invertebral fractures of 37% and 40%, and a reduction in non-vertebral fractures of 14% and 16%.21
Key 8. Seek to Identify and Remedy the UnderlyingCauses of Bone Loss and Bone Fragility on anIndividual Basis
People vary greatly, and what will harm one person’sbone health may not be particularly detrimental to someoneelse’s. However, certain items can be viewed as universalrisk factors for poor bone health. These include advancingage, smoking, diet, lack of exercise, exposure to sunlight,being underweight, use of certain medicines, family histo-ry of fracture, previous bone trauma, and post-menopausalstatus in women.
In addition to the assessment of a patient’s osteoporo-sis risk, certain tests can be helpful. These include tests forsecondary causes of bone weakness, such as:
• vitamin D status using the 25(OH)D test
• 24-hour urine calcium excretion test
• parathyroid hormone
• ionized calcium
• thyroid hormone
It’s also helpful to monitor bone changes and the suc-cess of the treatment program. The DEXA bone density andtests of bone resorption markers (N-telopeptides with theOsteomark NTx and deoxypyridinium links with the Dpd)are useful.
For More Information
Dr. Brown has posted information about osteoporosison the Osteoporosis Education Project Website at
www.betterbones.com. The Osteoporosis EducationProject is a non-profit organization dedicated to research-ing and increasing awareness of nutritional and lifestyle
factors influencing bone health.
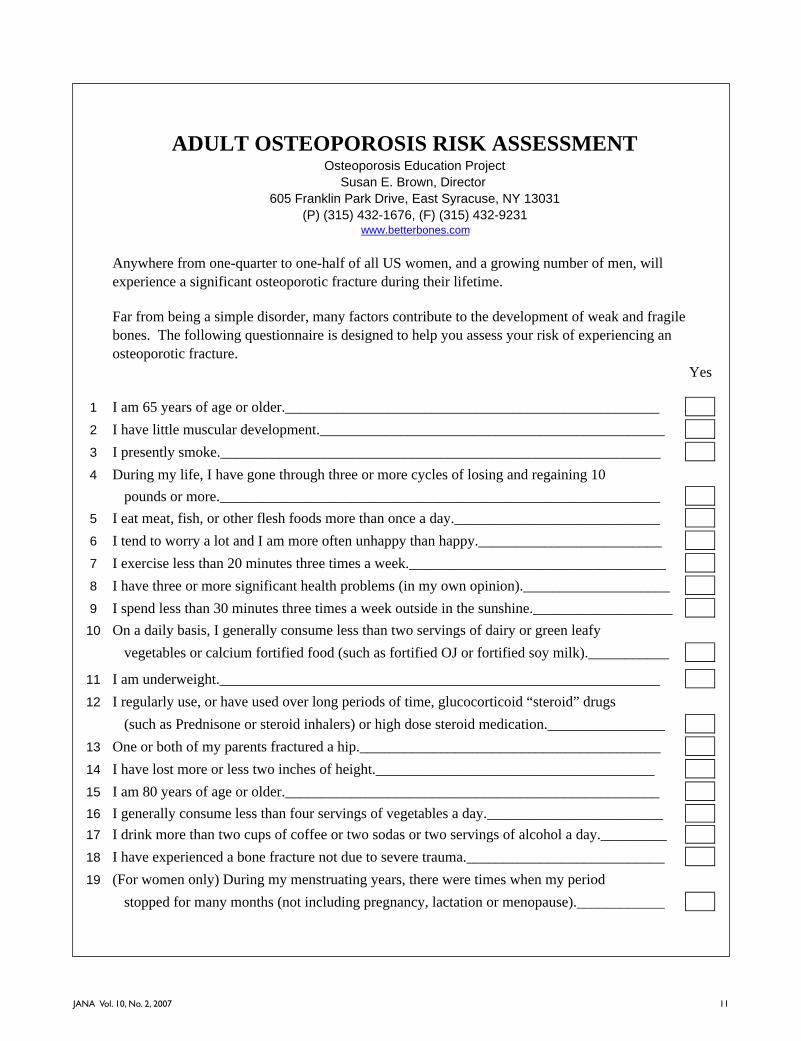
ADULT OSTEOPOROSIS RISK ASSESSMENTOsteoporosis Education Project
Susan E. Brown, Director
605 Franklin Park Drive, East Syracuse, NY 13031
(P) (315) 432-1676, (F) (315) 432-9231www.betterbones.com
Anywhere from one-quarter to one-half of all US women, and a growing number of men, will
experience a significant osteoporotic fracture during their lifetime.
Far from being a simple disorder, many factors contribute to the development of weak and fragile
bones. The following questionnaire is designed to help you assess your risk of experiencing an
osteoporotic fracture.
Yes
1 I am 65 years of age or older.___________________________________________________
2 I have little muscular development._______________________________________________
3 I presently smoke.____________________________________________________________
4 During my life, I have gone through three or more cycles of losing and regaining 10
pounds or more.____________________________________________________________
5 I eat meat, fish, or other flesh foods more than once a day.____________________________
6 I tend to worry a lot and I am more often unhappy than happy._________________________
7 I exercise less than 20 minutes three times a week.___________________________________
8 I have three or more significant health problems (in my own opinion).____________________
9 I spend less than 30 minutes three times a week outside in the sunshine.___________________
10 On a daily basis, I generally consume less than two servings of dairy or green leafy
vegetables or calcium fortified food (such as fortified OJ or fortified soy milk).___________
11 I am underweight.____________________________________________________________
12 I regularly use, or have used over long periods of time, glucocorticoid “steroid” drugs
(such as Prednisone or steroid inhalers) or high dose steroid medication.________________
13 One or both of my parents fractured a hip._________________________________________
14 I have lost more or less two inches of height.______________________________________
15 I am 80 years of age or older.___________________________________________________
16 I generally consume less than four servings of vegetables a day.________________________
17 I drink more than two cups of coffee or two sodas or two servings of alcohol a day._________
18 I have experienced a bone fracture not due to severe trauma.___________________________
19 (For women only) During my menstruating years, there were times when my period
stopped for many months (not including pregnancy, lactation or menopause).____________
11JANA Vol. 10, No. 2, 2007
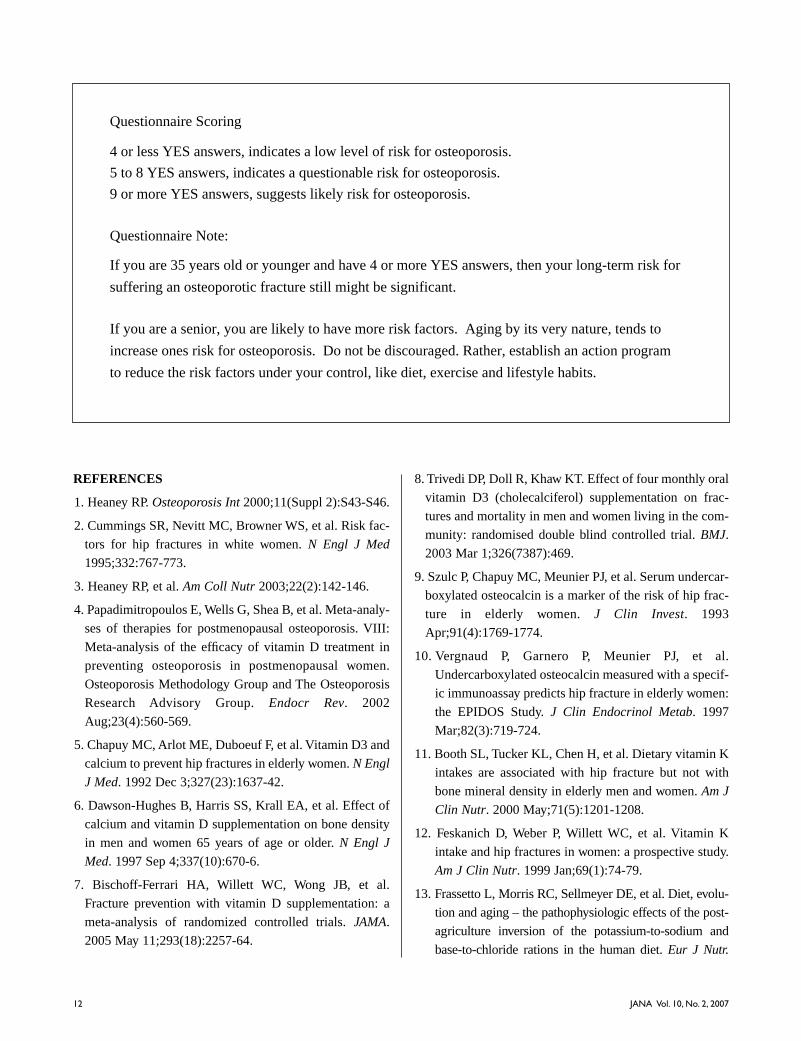
Questionnaire Scoring
4 or less YES answers, indicates a low level of risk for osteoporosis.
5 to 8 YES answers, indicates a questionable risk for osteoporosis.
9 or more YES answers, suggests likely risk for osteoporosis.
Questionnaire Note:
If you are 35 years old or younger and have 4 or more YES answers, then your long-term risk for
suffering an osteoporotic fracture still might be significant.
If you are a senior, you are likely to have more risk factors. Aging by its very nature, tends to
increase ones risk for osteoporosis. Do not be discouraged. Rather, establish an action program
to reduce the risk factors under your control, like diet, exercise and lifestyle habits.
REFERENCES
1. Heaney RP. Osteoporosis Int 2000;11(Suppl 2):S43-S46.
2. Cummings SR, Nevitt MC, Browner WS, et al. Risk fac-
tors for hip fractures in white women. N Engl J Med
1995;332:767-773.
3. Heaney RP, et al. Am Coll Nutr 2003;22(2):142-146.
4. Papadimitropoulos E, Wells G, Shea B, et al. Meta-analy-
ses of therapies for postmenopausal osteoporosis. VIII:
Meta-analysis of the efficacy of vitamin D treatment in
preventing osteoporosis in postmenopausal women.
Osteoporosis Methodology Group and The Osteoporosis
Research Advisory Group. Endocr Rev. 2002
Aug;23(4):560-569.
5. Chapuy MC, Arlot ME, Duboeuf F, et al. Vitamin D3 and
calcium to prevent hip fractures in elderly women. N Engl
J Med. 1992 Dec 3;327(23):1637-42.
6. Dawson-Hughes B, Harris SS, Krall EA, et al. Effect of
calcium and vitamin D supplementation on bone density
in men and women 65 years of age or older. N Engl J
Med. 1997 Sep 4;337(10):670-6.
7. Bischoff-Ferrari HA, Willett WC, Wong JB, et al.
Fracture prevention with vitamin D supplementation: a
meta-analysis of randomized controlled trials. JAMA.
2005 May 11;293(18):2257-64.
8. Trivedi DP, Doll R, Khaw KT. Effect of four monthly oral
vitamin D3 (cholecalciferol) supplementation on frac-
tures and mortality in men and women living in the com-
munity: randomised double blind controlled trial. BMJ.
2003 Mar 1;326(7387):469.
9. Szulc P, Chapuy MC, Meunier PJ, et al. Serum undercar-
boxylated osteocalcin is a marker of the risk of hip frac-
ture in elderly women. J Clin Invest. 1993
Apr;91(4):1769-1774.
10. Vergnaud P, Garnero P, Meunier PJ, et al.
Undercarboxylated osteocalcin measured with a specif-
ic immunoassay predicts hip fracture in elderly women:
the EPIDOS Study. J Clin Endocrinol Metab. 1997
Mar;82(3):719-724.
11. Booth SL, Tucker KL, Chen H, et al. Dietary vitamin K
intakes are associated with hip fracture but not with
bone mineral density in elderly men and women. Am J
Clin Nutr. 2000 May;71(5):1201-1208.
12. Feskanich D, Weber P, Willett WC, et al. Vitamin K
intake and hip fractures in women: a prospective study.
Am J Clin Nutr. 1999 Jan;69(1):74-79.
13. Frassetto L, Morris RC, Sellmeyer DE, et al. Diet, evolu-
tion and aging – the pathophysiologic effects of the post-
agriculture inversion of the potassium-to-sodium and
base-to-chloride rations in the human diet. Eur J Nutr.
12 JANA Vol. 10, No. 2, 2007
13JANA Vol. 10, No. 2, 2007
2001;40(5):200-2013, and 2) Sebastian A, Harris ST,
Ottaway J, et al. Improved mineral balance and skeletal
metabolism in postmenopausal women treated with
potassium bicarbonate. NEJM. 1994;330(25):1776-1781.
14. Jehle S, Zanetti A, Muser J, et al. Partial neutralization
of the acidogenic Western diet with potassium citrate
increases bone mass in postmenopausal women with
osteopenia. J Am Soc Nephrol. 2006;17(11):3213-3222.
Epub 2006 Oct 11.
15. Richards JB, Papaioannou A, Adachi JD, et al. Effect of
selective serotonin reuptake inhibitors on the risk of
fracture. Arch Intern Med. 2007;167(2):188-194.
16. Yang YX, Lewis JD, Epstein S, et al. Long-term proton
pump inhibitor therapy and risk of hip fracture. JAMA.
2006;296(24):2947-2953.
17. Wolff I, van Croonenborg JJ, Kemper HC, et al. The effect
of exercise training programs on bone mass: a meta-
analysis of published controlled trials in pre and post-
menopausal women. Osteoporos Int. 1999;9(1):1-12.
18. Feskanich D, Willett W, Colditz G. Walking and leisure-
time activity and risk of hip fracture in postmenopausal
women. JAMA. 2002;288(18):2300-2306.
19. Sinaki M, Mikkelsen BA. Postmenopausal spinal osteo-
porosis: flexion versus extension exercises. Arch Phys
Med Rehabil. 1984;65(10):593-596.
20. Cockayne S, Adamson J, Lanham-New S, Vitamin K
and the prevention of fractures: systematic review and
meta-analysis of randomized controlled trials. Arch
Intern Med. 2006;166(12):1256-1261.
20. Stevenson M, et al. Health Technol Assess.
2007;11(4):1-134; O’Donnell S, et al. Cochrane
Database Syst Rev. 2006;18(4):CD005326.
14 JANA Vol. 10, No. 2, 2007
INTRODUCTION
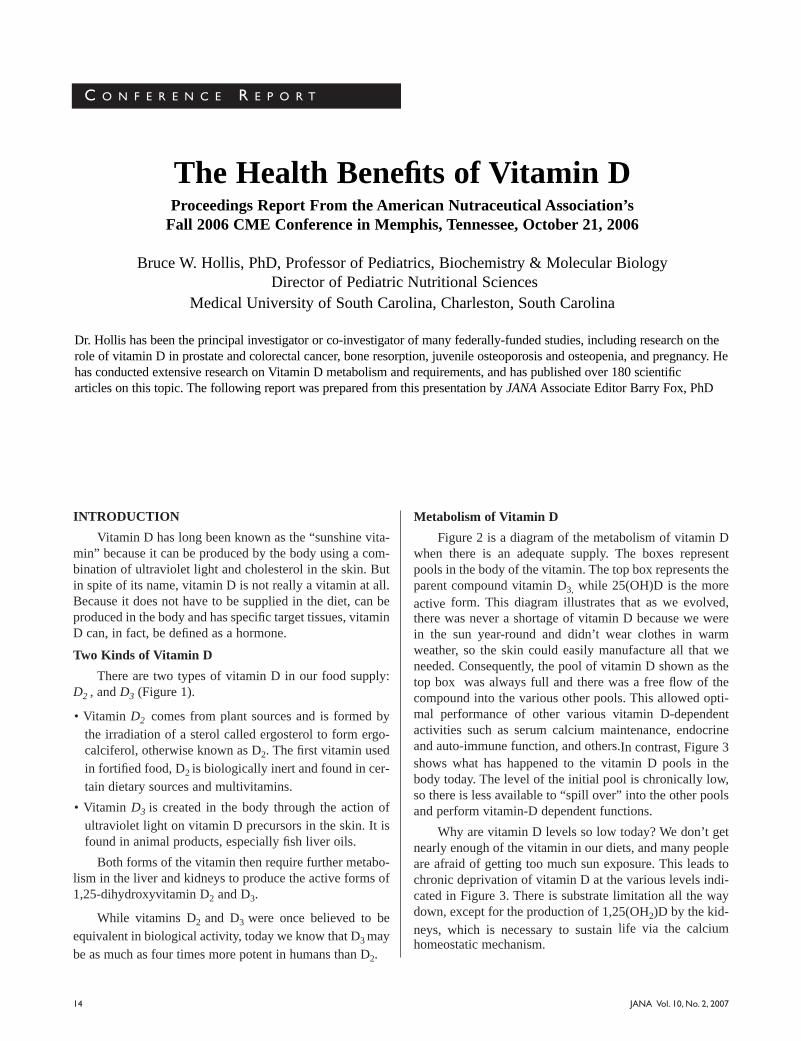
Vitamin D has long been known as the “sunshine vita-min” because it can be produced by the body using a com-bination of ultraviolet light and cholesterol in the skin. Butin spite of its name, vitamin D is not really a vitamin at all.Because it does not have to be supplied in the diet, can beproduced in the body and has specific target tissues, vitaminD can, in fact, be defined as a hormone.
Two Kinds of Vitamin D
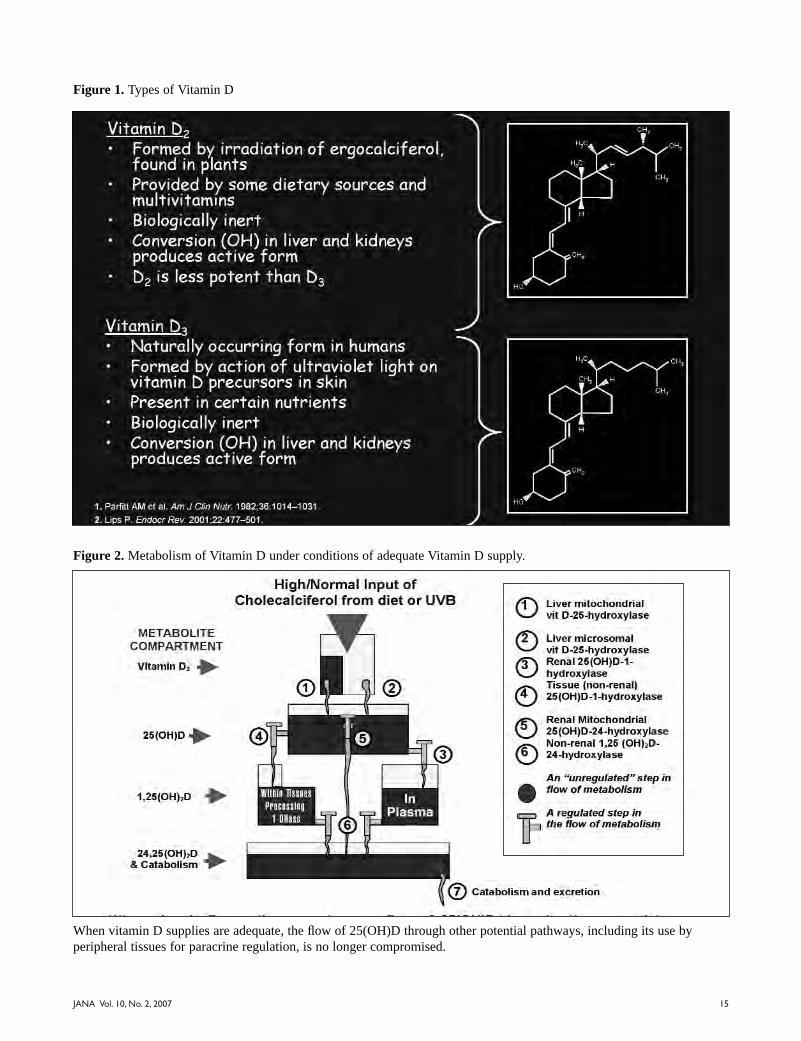
There are two types of vitamin D in our food supply:D2 , and D3 (Figure 1).
• Vitamin D2 comes from plant sources and is formed bythe irradiation of a sterol called ergosterol to form ergo-calciferol, otherwise known as D2. The first vitamin usedin fortified food, D2 is biologically inert and found in cer-tain dietary sources and multivitamins.
• Vitamin D3 is created in the body through the action ofultraviolet light on vitamin D precursors in the skin. It isfound in animal products, especially fish liver oils.
Both forms of the vitamin then require further metabo-lism in the liver and kidneys to produce the active forms of1,25-dihydroxyvitamin D2 and D3.
While vitamins D2 and D3 were once believed to beequivalent in biological activity, today we know that D3 maybe as much as four times more potent in humans than D2.
Metabolism of Vitamin D
Figure 2 is a diagram of the metabolism of vitamin Dwhen there is an adequate supply. The boxes representpools in the body of the vitamin. The top box represents theparent compound vitamin D3, while 25(OH)D is the moreactive form. This diagram illustrates that as we evolved,there was never a shortage of vitamin D because we werein the sun year-round and didn’t wear clothes in warmweather, so the skin could easily manufacture all that weneeded. Consequently, the pool of vitamin D shown as thetop box was always full and there was a free flow of thecompound into the various other pools. This allowed opti-mal performance of other various vitamin D-dependentactivities such as serum calcium maintenance, endocrineand auto-immune function, and others.In contrast, Figure 3shows what has happened to the vitamin D pools in thebody today. The level of the initial pool is chronically low,so there is less available to “spill over” into the other poolsand perform vitamin-D dependent functions.
Why are vitamin D levels so low today? We don’t getnearly enough of the vitamin in our diets, and many peopleare afraid of getting too much sun exposure. This leads tochronic deprivation of vitamin D at the various levels indi-cated in Figure 3. There is substrate limitation all the waydown, except for the production of 1,25(OH2)D by the kid-neys, which is necessary to sustain life via the calciumhomeostatic mechanism.
C O N F E R E N C E R E P O R T
The Health Benefits of Vitamin DProceedings Report From the American Nutraceutical Association’s
Fall 2006 CME Conference in Memphis, Tennessee, October 21, 2006
Bruce W. Hollis, PhD, Professor of Pediatrics, Biochemistry & Molecular BiologyDirector of Pediatric Nutritional Sciences
Medical University of South Carolina, Charleston, South Carolina
Dr. Hollis has been the principal investigator or co-investigator of many federally-funded studies, including research on therole of vitamin D in prostate and colorectal cancer, bone resorption, juvenile osteoporosis and osteopenia, and pregnancy. Hehas conducted extensive research on Vitamin D metabolism and requirements, and has published over 180 scientific articles on this topic. The following report was prepared from this presentation by JANA Associate Editor Barry Fox, PhD
JANA Vol. 10, No. 2, 2007 15
Figure 1. Types of Vitamin D
Figure 2. Metabolism of Vitamin D under conditions of adequate Vitamin D supply.
When vitamin D supplies are adequate, the flow of 25(OH)D through other potential pathways, including its use byperipheral tissues for paracrine regulation, is no longer compromised.

JANA Vol. 10, No. 2, 2007 16
The vitamin D endocrine system is the only steroidendocrine system in the body that is almost always limitedby substrate availability. This is due to an individual’s loca-tion (northern latitudes provide less UVB exposure),lifestyle (amount of sun exposure), race (darker skins man-ufacture less vitamin D), and other factors. Without suffi-cient vitamin D, there is limited conversion to 25(OH)D,and ultimately to the hormonal form 1,25(OH)2D at extra-renal sites, which is a key problem. The most obvious con-sequence is the failure to absorb calcium and mineralize thebone, coupled with calcium resorption from the bone, lead-ing to bone loss or malformation.
How Much Sun Do You Need?
With the exception of oily fish, food is not a naturallygood source of vitamin D. Luckily, we’ve got the sun. Buthow much solar exposure is needed to synthesize adequateamounts of endogenous vitamin D? Dr. Hollis and his col-laborators studied this question using in vivo experiments onmedical students. The volunteers were put into a syntheticUV environment normally used to treat dermatological dis-eases. This allowed researchers to control UV exposuretimes and to quantitate the energy of exposure. After expo-sure to UV rays, the first significant rise in vitamin D pro-duced in the skin and released into the bloodstream occurred
at 18 mJ/cm2. This took about 90 seconds. It was followedby an exponential increase as exposure time increased. Butthere are a few confounding factors.
Latitude: From a practical standpoint, in most ofNorth America there are three or four months in the winter-time when the energy of the sun isn’t sufficient to makeeven one molecule of vitamin D (Figure 6). The problemgets worse the farther north one lives. A person living inBoston, for example, could stand outside naked all ofNovember, December and January, yet still not make anyvitamin D as the intensity of the sun simply isn’t sufficientat that latitude during that time of the year.
Race: Another way of measuring vitamin D based ona minimal erythemal dose (MED) of UVB, which is definedas the minimum dose of radiation necessary to produce sun-burn. One MED for a typical Caucasian would equal about10-12 minutes of intense sunlight in Memphis, Tennessee,in the summertime. In a light-skinned person, just a singleMED will release approximately 20,000 IU vitamin D3 intothe circulation within 24 hours. Thus, the body has a hugecapacity to make and release vitamin D.However, in thosewith very dark skin, the exposure time for a MED couldincrease by 10-fold, meaning that these people would needabout 10 hours of sun exposure to produce the same amountof vitamin D (Figure 7).
Figure 3. Metabolism of Vitamin D under conditions of low Vitamin D supply.
The vessels represent metabolic compartments, stages in the metabolism of vitamin D. The height of the shaded portion ofeach vessel represents the relative concentration of each metabolite indicated in the figure.
Liver mitochondrial vit D-25-hydroxylase
Liver microsomal vit D-25-hydroxylase
Renal 25(OH)D-1-hydroxylase
Tissue (non-renal)25(OH)D-1-hydroxylase
Renal Mitochondrial 25(OH)D-24-hydroxylase
Non-renal 1,25 (OH)2D-24-hydroxylase
An "unregulated" step inflow of metabolism
1
2
3
4
5
6
7
Legend
JANA Vol. 10, No. 2, 2007 17
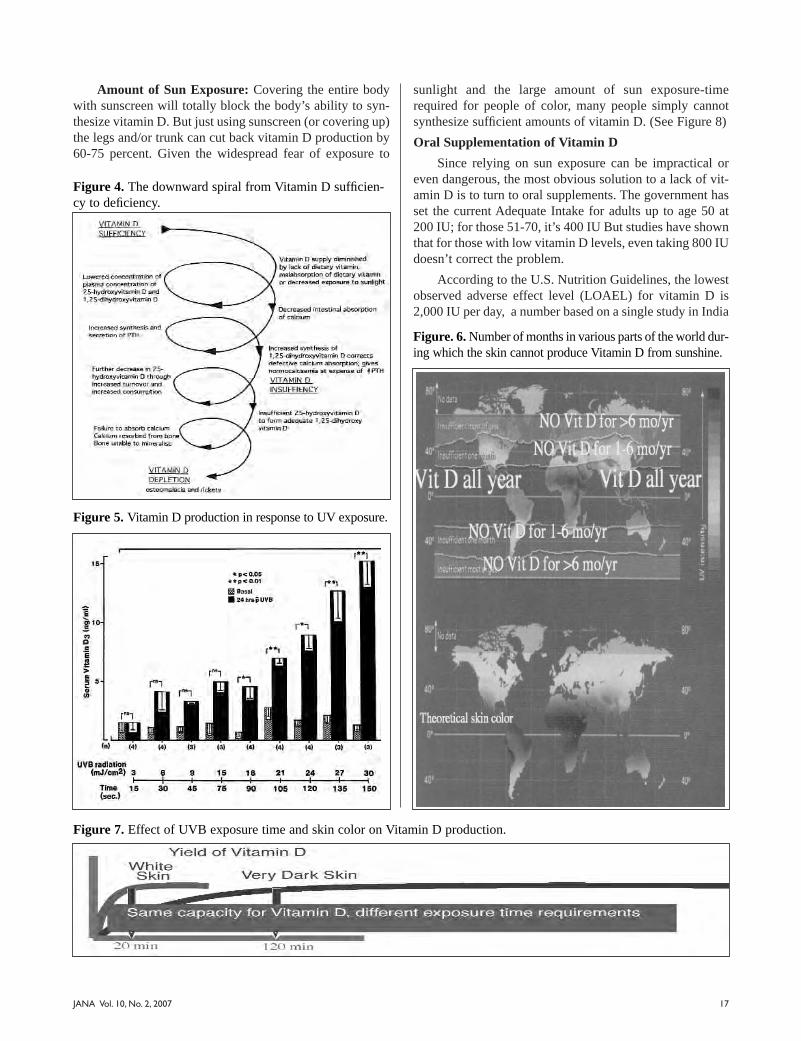
Amount of Sun Exposure: Covering the entire bodywith sunscreen will totally block the body’s ability to syn-thesize vitamin D. But just using sunscreen (or covering up)the legs and/or trunk can cut back vitamin D production by60-75 percent. Given the widespread fear of exposure to
sunlight and the large amount of sun exposure-timerequired for people of color, many people simply cannotsynthesize sufficient amounts of vitamin D. (See Figure 8)
Oral Supplementation of Vitamin D
Since relying on sun exposure can be impractical oreven dangerous, the most obvious solution to a lack of vit-amin D is to turn to oral supplements. The government hasset the current Adequate Intake for adults up to age 50 at200 IU; for those 51-70, it’s 400 IU But studies have shownthat for those with low vitamin D levels, even taking 800 IUdoesn’t correct the problem.
According to the U.S. Nutrition Guidelines, the lowestobserved adverse effect level (LOAEL) for vitamin D is2,000 IU per day, a number based on a single study in India
Figure 4. The downward spiral from Vitamin D sufficien-cy to deficiency.
Figure 5. Vitamin D production in response to UV exposure.
Figure. 6. Number of months in various parts of the world dur-ing which the skin cannot produce Vitamin D from sunshine.
Figure 7. Effect of UVB exposure time and skin color on Vitamin D production.

18 JANA Vol. 10, No. 2, 2007
of 6 patients. Yet a study of MS patients found vitamin Dtoxicity didn’t occur until doses reached 40,000 IU per day,and health-promoting effects often began at 2,000 IU orhigher levels. Obviously, the government is much morefocused on the possible toxicity of vitamin D than its poten-tial to ward off chronic diseases. Thus the Adequate Intake,the Recommended Intakes and Tolerable Upper Limitsremain very low.
Optimal Levels of Circulating 25(OH)D
While government recommendations appear to beaimed solely at preventing and treating rickets, what’s ofgreater importance is the circulating level of the active formof the vitamin, 25(OH)D. How high should these levels befor optimal health? To answer this question, let’s go back intime to find out what these levels were in our ancestors.Figure 9 shows the levels of 25(OH)D our ancestors and theaverage person today:
• Old world primates currently living in Africa – 140nmol/L
• Humans with full body exposure to sunshine (lifeguardsand field workers) – 135 nmol/L
• What is considered “normal” today – 40 nmol/L
• Blood levels when taking 1,000 IU/day – 70 nmol/L
• Northern people taking 4,000 IU/day – 100 nmol/L
Biomarkers Affected By Vitamin D Deficiency
When 25(OH)D levels fall too low, secondary parahy-perthyroidism sets in, which negatively impacts the skeletalsystem. The bone mineral density drops and intestinal cal-cium absorption declines. There is also impairment in mus-cle function and strength, affecting mobility. Conversely,when taking 5,000 IU of vitamin D per day, bone mineraldensity rises sharply in Caucasian men and women underthe age of 50, and moderately in Black and HispanicAmericans (See Figure 10).
But bone density is just one of the factors influenced byvitamin D. Studies have shown an inverse relationship
Figure 9. Vitamin D status in primates, early humans, and today.
Figure 8. Vitamin D production in skin that is completely,partially, or not covered by sunscreen or clothing.
Sources, include Cosman, Osteoporosis Int. 2000; Fuleihan, NEJM. 1999; Scharla, Osteoporosis Int. 1998; Vieth, AJCN. 1999, 2000
19JANA Vol. 10, No. 2, 2007
between 25(OH)D levels and plasma glucose levels.Vitamin D also spurs the action of the innate immune sys-tem, as seen in Niels Ryberg Finsens’ Nobel-Prize-winningwork on the ability of UV light to ease lupus vulgaris. In1994, a brief study done in India demonstrated that respira-tory infections in children with elevated alkaline phos-phatase levels were eliminated by supplementing them with60,000 IU vitamin D per week for 6 weeks.Hypovitaminosis D is also a risk-modifying factor for adiverse range of disorders, including multiple sclerosis,increased cancer rates (13 types), type 1 diabetes andschizophrenia.
Optimal and Sub-Optimal Levels of CirculatingVitamin D
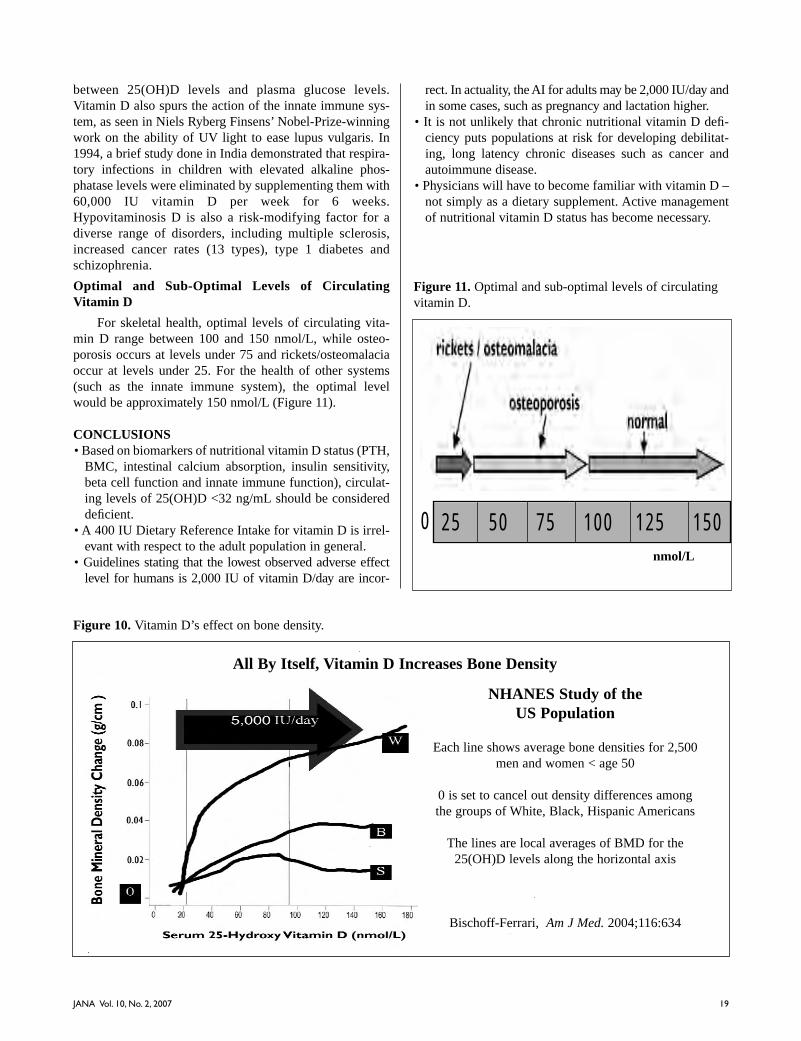
For skeletal health, optimal levels of circulating vita-min D range between 100 and 150 nmol/L, while osteo-porosis occurs at levels under 75 and rickets/osteomalaciaoccur at levels under 25. For the health of other systems(such as the innate immune system), the optimal levelwould be approximately 150 nmol/L (Figure 11).
CONCLUSIONS• Based on biomarkers of nutritional vitamin D status (PTH,
BMC, intestinal calcium absorption, insulin sensitivity,beta cell function and innate immune function), circulat-ing levels of 25(OH)D <32 ng/mL should be considereddeficient.
• A 400 IU Dietary Reference Intake for vitamin D is irrel-evant with respect to the adult population in general.
• Guidelines stating that the lowest observed adverse effectlevel for humans is 2,000 IU of vitamin D/day are incor-
rect. In actuality, the AI for adults may be 2,000 IU/day andin some cases, such as pregnancy and lactation higher.
• It is not unlikely that chronic nutritional vitamin D defi-ciency puts populations at risk for developing debilitat-ing, long latency chronic diseases such as cancer andautoimmune disease.
• Physicians will have to become familiar with vitamin D –not simply as a dietary supplement. Active managementof nutritional vitamin D status has become necessary.
Figure 10. Vitamin D’s effect on bone density.
NHANES Study of the US Population
Each line shows average bone densities for 2,500men and women < age 50
0 is set to cancel out density differences amongthe groups of White, Black, Hispanic Americans
The lines are local averages of BMD for the25(OH)D levels along the horizontal axis
Bischoff-Ferrari, Am J Med. 2004;116:634
All By Itself, Vitamin D Increases Bone Density
Figure 11. Optimal and sub-optimal levels of circulatingvitamin D.
25 50 75 100 125 1500nmol/L

JANA Vol. 10, No. 2, 200720
C O N F E R E N C E R E P O R T
Integrative Approaches to the Prevention andTreatment of Diabetes
Proceedings Report from the American Nutraceutical Association’s Spring 2007 CMEConference in Long Beach, California, March 24, 2007
Jay Udani, MD, Medical Director, Northridge Hospital Integrative Medicine ProgramAssistant Clinical Professor, UCLA School of Medicine
Jay Udani, MD, is the Medical Director of the Integrative Medicine Program at Northridge Hospital and AssistantClinical Professor at the UCLA / Geffen School of Medicine. Dr. Udani is a board certified Internist who was the ChiefResident of Internal Medicine at Cedars-Sinai Medical Center, and was the first Fellow in Integrative Medicine at CedarsSinai. He has published over 30 book chapters and articles on Integrative Medicine in many prestigious medical journalsincluding the Journal of the American Medical Association (JAMA). Dr. Udani is also the recipient of the AMA NationalAchievement Award, and the Harvard Medical School Research Fellowship Award. JANA Associate Editor, NadineTaylor, MS, RD, prepared this report on Dr. Udani’s talk at the conference.
INTRODUCTION
Diabetes mellitus (DM) is a common and growingproblem in the United States, affecting some 6.5 percent ofAmericans, up from 5.5 percent in 2001. Currently, thereare 12 million diagnosed cases of diabetes in the U.S., withan additional 5.2 million undiagnosed, and 1.3 million newcases appearing each year. As the fifth leading cause ofdeath in America and a major risk factor for retinopathy,renal disease, neuropathy, cardiovascular disease, stroke,and short term memory loss, diabetes is a formidableenemy. It comes in two forms: type 1, stemming from thefailure of the beta cells in the pancreas to produce sufficientinsulin; and type 2, occurring when the body produces suf-ficient amounts of insulin, but the insulin is ineffective andallows blood glucose to rise to dangerous levels.
THE DEVELOPMENT OF DIABETES
It is well known that obesity is associated with anincreased risk for type 2 diabetes. But obesity alone is nei-ther sufficient nor necessary for the development of the dis-ease. Not all overweight people become diabetic, yet a cer-tain percentage of normal weight or underweight people dodevelop DM. So how does fat figure into the equation?
White Adipose Tissue – The Forgotten Organ
White adipose tissue (WAT) is more than just “bellyfat;” it’s an active endocrine, intracrine and paracrine organ.Besides its more obvious functions in the maintenance ofbody weight, lipid storage and the release of free fattyacids, white adipose tissue also releases various hormones,cytokines and growth factors called “adipokines,” whichinfluence lipid metabolism, insulin sensitivity, the alterna-tive complement system, vascular homeostasis, blood pres-sure control and the regulation of energy balance.
Some of the adipokines (the cytokines and certaingrowth factors) also promote inflammation, a factor linkedto insulin resistance, metabolic syndrome and DM.However, one adipokine, known as adiponectin, has just theopposite effect. It lowers inflammation and increases insulinsensitivity, while modulating glucose and fat metabolism ininsulin-sensitive tissues, and stimulating the oxidation offatty acids in skeletal muscle. This translates to lower levelsof triglycerides, blood glucose, C-reactive protein, fibrino-gen, endothelial dysfunction and intra-abdominal fat.
When “Bad”Adipokines Take Over
Unfortunately, in cases of obesity, the “bad” (inflam-matory) adipokines get the upper hand. In obese adipose

21JANA Vol. 10, No. 2, 2007
tissue, fat cells increase in size until they burst, a phenome-non that spurs chronic activation of the innate immune sys-tem and the infiltration of macrophages. Production of theinflammation-producing adipokines increases, while pro-duction of beneficial adiponectin decreases, along with itsanti-inflammatory, blood glucose-regulating and endotheli-um-protective effects. Inflammation may also result fromhypoxia in the expanding fat cells, which can’t create newblood vessels fast enough to supply their needs. Because ofthese and other factors, most obese people exist in a chron-ic state of low-grade inflammation.
INFLAMMATION AND DIABETES
Researchers believe that chronic activation of theinnate immune system and the resulting inflammation con-tribute to insulin resistance and metabolic syndrome,although the exact mechanisms have not been established.However, certain markers of inflammation are linked toincreased insulin resistance and/or diabetes, including inter-leukin-6 (IL-6) and C-reactive protein (CRP). This link wasillustrated in a cohort study in which researchers followednearly 28,000 women, free of DM at baseline, to see whodeveloped diagnosed type 2 diabetes over a 4-year period.1
Compared to those with the lowest levels of these inflam-matory markers, those who had the highest levels of IL-6had twice the risk of developing diabetes, while those withthe highest levels of CRP quadrupled their risk.
The link between inflammation and diabetes becomesmore obvious as we look closer at CRP, a major inflamma-tory marker. CRP rises in the presence of a high glycemicload index, is independently associated with hyperinsuline-mia in nondiabetic women, and is elevated in women withincreased total and abdominal adiposity.
The Role of Oxidative Stress in Diabetes
Oxidative stress is defined as the chronic and/orincreased production of reactive oxygen or nitrogen mole-cules within the body, or a lowered capacity to eliminatethem. Hyperglycemia, the hallmark of DM, causes a releaseof reactive oxygen species (ROS) in the adipocytes. Thisrelease of ROS dysregulates the production of the adipocy-tokines (adiponectin, PAI-1, IL-6, and monocyte chemotac-tic protein-1), which promotes inflammation. However, theprocess appears to be reversible. In studies of obese mice,when levels of ROS were decreased, the adipocytokinesnormalized and DM and hyperlipidemia improved.2 In gen-eral, diabetic patients show higher levels of oxidative stress,especially those who have developed neuropathy.3
ALTERNATIVE WAYS TO PREVENT AND TREATDIABETES
The importance of controlling DM and, if possible, pre-venting it from getting a foothold in the first place, can
RISK OF DIABETES
• People born in the year 2000 have a 1 in 3 lifetimerisk of getting diabetes
• Life expectancy- If diagnosed at age 40- Men lose 11.6 years of their lives- Women lose 14.3 years of their lives
Venkat Narayan, KM, MD, JAMA. 2003.
RISK OF DIABETES
• 85% risk of retinopathy• 25-50% risk of renal disease• 60-70% neuropathy• 2-4X more likely to develop cardiovascular disease
and/or stroke• Increased risk of short term memory loss (due to
glycemic damage to hippocampus)American Diabetes Association, 2003.
ADIPOSE IS AN ENDOCRINE, INTRACRINE, AND PARACRINE ORGAN
• Body weight homeostasis (Lipid storage and releaseof free fatty acids)
• Inflammation• Coagulation• Fibrinolysis• Insulin resistance• Diabetes• Atherosclerosis
Lau DC, et. al. Am J Physiol Heart Circ Physiol. May 2005.
ADIPONECTIN: Modulates glucose and fatmetabolism in insulin sensitive tissues
• Expressed in abdominal perigonadal fat (not sub-Q)• Insulin sensitizing
- Activates PPAR- Increases fatty acid oxidation
• Positive correlation- HDL
• Negative correlation- Triglycerides- Apolipoprotein B-100- C-reactive protein- Fibrinogen- Endothelial dysfunction- Intra-abdominal fat
• Inflammatory correlation separate from HbA1c• Same for obese and non-obese

22 JANA Vol. 10, No. 2, 2007
hardly be overstated. And while medication is a must forsome diabetics, a great many are interested in using com-plementary or alternative medicine (CAM) in addition to orin place of standard medical treatments. One study showedthat diabetic patients were 1.6 times more likely to useCAM than those without diabetes, especially when theywere older than 65 or more highly educated.4 The most pop-ular current therapies are nutritional advice anddiet/lifestyle changes, spiritual healing, herbal remedies,massage therapy and meditation training.
The immediate goals of diabetes treatment are to elim-inate hyperglycemia and stabilize the blood sugar. In manycases, diet, weight loss and exercise can meet these goalsjust as effectively as medication. But additional goals forboth the prevention and treatment of DM should includecontrolling inflammation, raising adiponectin levels andreducing oxidative stress, all of which respond to alternativeor complementary methods.
Stabilizing Blood Sugar Levels
One non-drug method of controlling blood sugar levelsis through consumption of a low-glycemic index (GI) diet,which by itself may lower the risk of diabetes by 25-50%. Theglycemic index is used to help control the amount of glucosereleased into the blood at any given time (the glycemic load)and the resulting insulin response. Studies have shown that,compared to a high GI diet, consuming a low GI diet canreduce the risk of becoming diabetic by 37%.5 Low GI dietshave also been found to increase insulin sensitivity by 50%,6
reduce the risk of coronary heart disease by 277% inwomen,7 and significantly reduce cholesterol, LDL andtriglyceride levels in hyperlipidemic patients.8 Also, short-term studies indicate that, compared to a high GI diet, a lowGI diet may delay the return of hunger and reduce energyintake,9 making it useful as a weight loss tool.
Decreasing Inflammation
Chronic low-level inflammation most likely plays a rolein insulin resistance, glucose intolerance and type 2 diabetes.In fact, elevated levels of IL-6 and CRP can predict the devel-opment of the disease.10 In animals, calming the inflammato-ry response has been shown to increase insulin sensitivity.And in humans, the improved glucose tolerance seen withstatin or thiazolidinedione use is believed to be related to
their anti-inflammatory properties.11 For these and other rea-sons, quelling chronic inflammation is a sound idea.
There are many anti-inflammatory nutraceuticals, butbest-known and most widely used is fish oil. Althoughsome people avoid fish oil because they worry about ingest-ing toxic metals, molecularly-distilled fish oil is free ofsuch contaminants. Evening primrose oil and borage oil arealso used to quell inflammation, as are the anti-inflammato-ry herbs/supplements boswellia, bromelain, cat’s claw, gin-ger, prickly pear cactus, quercetin and turmeric (curcumin).
Raising Adiponectin Levels
Peroxisome proliferator-activated receptors (PPARs)help control lipid and glucose metabolism and inflamma-tion. PPAR-gamma agonists are widely used in the treat-ment of type 2 diabetes, as they improve the sensitivity ofinsulin receptors and have anti-inflammatory effects on theliver, adipose and vascular tissues. They also increaseadiponectin levels by as much as three times.
Natural substances that act as PPAR-gamma agonistsinclude punica grantum flower, banaba water leaf extract,Korean red ginseng, mulberry leaf extract, bitter melonseed oil, turmeric and conjugated linoleic acid (althoughthe T10c12 isomer has the opposite effect and actuallydecreases insulin sensitivity). PPARs are also activated byseveral isoprenols, which are common components ofherbal plants, including the farnesol and geranylgeraniolfound in herbs and fruits.12
Reducing Oxidative Stress
Oxidative stress can lead to the chronic inflammation,insulin resistance and abnormal changes in intracellularsignaling seen in DM. Conversely, supplementation withantioxidants has been shown to confer some benefits in dia-betes. Antioxidants such as vitamin E, alpha-lipoic acid andN-acetylcysteine have a beneficial impact on insulin sensi-tivity.13 In diabetic patients with neuropathy, studies haveshown that treatment with alpha lipoic acid (600 mg/dayi.v.) for 3 weeks significantly improved neuropathic pain.14
And type 1 diabetic patients with retinopathy who received6 grams of vitamin C over a 6-month period showed areduction in the transcapillary escape rate of albumin.15
Lowering Diabetes Risk with Foods
Several foods are also associated with a lower risk ofdeveloping diabetes, including nuts (a 1-ounce servingeaten 5 or more times a week reduced diabetes risk by27%),16 peanut butter (more than 5 oz. per week reducedDM by 21%),17 and whole grains (those consuming themost whole grains had a .79 relative risk of developing DMcompared to those consuming the least).18 Consumption ofpolyunsaturated fats and vegetable fats also reduced DMrisk, while consuming saturated fats and processed meatsincreased it. A study of 910 people followed for 8 yearsfound that drinking caffeinated coffee decreased the risk of
INFLAMMATION AND DIABETES RISKS
• Elevated CRP and/or IL-6 associated with increasedrisk of diabetes
• IL-6 – 2X increased risk • CRP – 4X increased risk • Controlled for insulin resistance risk factors • CRP may be produced by abdominal fat
Pradhan AD, JAMA. 2001.

type 2 diabetes by an amazing 60% in people with or with-out impaired glucose tolerance.19 And while 1-2 alcoholicdrinks per day appears to reduce DM by as much as 40%,more than 2 drinks per day may nearly triple the risk.20
Finally, studies have shown that getting plenty of mag-nesium, which is essential to glucose metabolism, may helpprevent the onset of diabetes and/or diabetes complications.In an 18-year follow-up study of 128,000 people with no dia-betes, CVD, or cancer at baseline, researchers found thatthose with the highest intakes of dietary magnesium wereabout 30% less likely to develop diabetes than those with thelowest intakes.21 The mineral may also benefit pre-diabeticpatients, with studies showing that those with higher bloodlevels of magnesium are less likely to go on to develop thedisease. In those who already have diabetes, supplementingwith magnesium may help prevent diabetic complications.Unfortunately, magnesium deficiency is common in diabet-ics, who may need twice the RDA of 300-350 mg/day.
THE ROLE OF NUTRACEUTICALS IN DIABETESPREVENTION AND TREATMENT
Although there are many drugs on the market that canbe used to help prevent and treat diabetes, there is consider-able need for safe, natural substances that have anti-diabetesaction. Numerous nutraceuticals have demonstrated consid-erable potential in this regard and should be seriously con-sidered as first-line and/or adjunct therapies to any programfor the prevention or treatment of diabetes mellitus.
REFERENCES
1. Pradhan AD, Manson JE, Rifai N, et al. C-reactive pro-tein, interleukin 6 and risk of developing type 2 diabetes.JAMA. 2001;286(3):327-34.
2. Furukawa S, Fujita T, Shimabukuro M, et al. Increasedoxidative stress in obesity and its impact on metabolicsyndrome. J Clin Invest. 2004;114(12):1752-61.
3. Ziegler D, Sohr CG, Nourooz-Zadeh J. Oxidative stressand antioxidant defense in relation to the severity of dia-betic polyneuropathy and cardiovascular autonomic neu-ropathy. Diabetes Care. 2004;27(9):2178-83.
4. Egede LE, Ye X, Zheng D, Silverstein MD. The preva-lence and pattern of complementary and alternative med-icine use in individuals with diabetes. Diabetes Care.2002;25(2):324-29.
5. Salmeron J, Ascherio A, Rimm EB, et al. Dietary fiber,glycemic load and risk of NIDDM in men. DiabetesCare. 1997;20(4):545-50.
6. Brand-Miller J, Hayne S, Petocz P, Colagiuri S. Low-glycemic diets in the mangement of diabetes: a meta-analysis of randomized controlled trials. Diabetes Care.2003;26(8):2261-67.
7. Liu S, Willett WC, Stampfer MJ, et al. A prospectivestudy of dietary glycemic load, carbohydrate intake, andrisk of coronary heart disease in US women. Am J ClinNutr. 2000 Jun;71(6):1455-61
8. Jenkins DJ, Wolever TM, Kalmusky J, et al. Low-glycemic index diet in hyperlipidemia: use of traditionalstarchy foods. Am J Clin Nutr. 1987; 46(1):66-71.
9. Roberts SB. Glycemic index and satiety. Nutr Clin Care.2003; 6(1):20-6.
10. Pradhan AD, Manson JE, Rifai N, et al. C-reactive pro-tein, interleukin 6 and risk of developing type 2 dia-betes. JAMA. 2001;286(3):327-34.
11. Bastard JP, Maachi M, Lagathu C, et al. Recent
OXIDATIVE STRESS IS ACCUMULATED IN ADIPOSE TISSUE
• Production of ROS in adipose tissue of obese miceand in cultured human adipocytes caused dysregu-lated production of of adipocytokines (adiponectin,PAI-1, IL-6, and monocyte chemotactic protein-1).
• When ROS production was decreased, it attenuatedthe production of adipocytokines and improved dia-betes, hyperlipidemia, and hepatic steatosis.
Shigetada Furukawa. Increased oxidative stress in obesityand its impact on metabolic syndrome. Journal of ClinicalInvestigation. 2004.
GLYCEMIC INDEX AND THE RISK OF DM
• 42,759 men followed for 6 years• Low GI Diet reduced the risk of becoming diabetic
by 37%• 65,173 women followed for 6 years• Low GI Diet reduced the risk of becoming Diabetic
by 37%Salmeron J. Diabetes Care. 1997.
• Low GI Diets- Reduced HbA1c by 43%- Increased insulin sensitivity by 50%- Increased glucose disposition index (measure of
ability of beta cells to overcome insulin resistance)by 50% Brand-Miller J. Diabetes Care. 2003.
JANA Vol. 10, No. 2, 2007 23

advances in the relationship between obesity, inflam-mation and insulin resistance. Eur Cytokine Netw.2006;17(1):4-12.
12. Takahashi N, Kawada T, Goto T, et al. Dual action ofisoprenols from herbal medicines on both PPARgammaand PPARalpha in 3T3-L1 adipocytes and HepG2hepatocytes. FEBS Lett. 2002:514(2-3):315-22.
13. Evans JL, Maddux BA, Goldfine ID. The molecularbasis for oxidative stress-induced insulin resistance.Antioxid Redox Signal. 2005;7(7-8):1040-52.
14. Ziegler D, Nowak H, Kempler P, et al. Treatment ofsymptomatic diabetic polyneuropathy with the antioxi-dant alpha-lipoic acid: a meta-analysis. Diabetic Med.2004;21(2):114-21.
15. Juhl B, Klein F, Christiansen JS. Vitamin C treatmentreduces transcapillary escape rate of albumin in type 1diabetes. Eur J Intern Med. 2004;15(7):428-35.
16. Jiang R, Manson JE, Stampfer MJ, et al. Nut and peanutbutter consumption and risk of type 2 diabetes inwomen. JAMA. 2002; 288(20):2554-60.
17. Jiang R, Manson JE, Stampfer MJ, et al. Nut and peanutbutter consumption and risk of type 2 diabetes inwomen. JAMA. 2002; 288(20):2554-60.
18. Meyer KA, Kushi LH, Jacobs DR Jr, et al.Carbohydrates, dietary fiber, and incidence of type 2diabetes in older women. Am J Clin Nutr. 2000;71(4):921-30.
19. Smith B, Wingard DL, Smith TC, et al. Does coffeeconsumption reduce the risk of type 2 diabetes in indi-viduals with impaired glucose? Diabetes Care. 2006;29(11):2385-90.
20. Wei M, Gibbons LW, Mitchell TL, et al. Alcohol intakeand incidence of type 2 diabetes in men. Diabetes Care.2000; 23(1):18-22.
21. Lopez-Ridaura R, Willett WC, Rimm EB, et al.Magnesium intake and risk of type 2 diabetes in menand women. Diabetes Care. 2004;27(1): 134-40.
JANA Vol. 10, No. 2, 2007 24

R E V I E W A R T I C L E
Flavonoids in Cocoa and ChocolateProtection from Cardiovascular Disease?
Prof. Dr. Helmut Sies,* Institute for Biochemistry and Molecular Biology, Heinrich-Heime-University, Dusseldorf, Germany
ABSTRACT
In recent years, an increasing number of studiesdemonstrated a protective effect of flavonoids found incocoa. Epidemiological investigations show that consump-tion of chocolate and cocoa rich in flavonoids is inverselyassociated with the occurrence of cardiovasculardiseases;experimental studies in humans show improve-ment of endothelial function in arteries and of skin micro-circulation. This functional improvement, measured byenhanced vasodilation, correlates with plasma increases inboth the concentration of (-)-epicatechin, the major flavanolcompound found in cocoa, and nitric oxide. The molecularbasis of the epicatechin effect has yet to be fully elucidated.Technological advances in the food industry may lead to thedevelopment of improved products rich in flavonoids.
INTRODUCTION
The discovery of the beneficial health effects of plant-derived flavonoids, a major class of secondary polyphenolicplant metabolites found in abundance in our diets, has arich, multi-millenniahistory. Flavonoids have a beneficialeffect on aspects of inflammation, heart disease, and can-
cer.1,2 The cocoa bean from the cocoa tree (Theobromacacao) is known to contain high amounts of flavanols, asubclass of flavonoids. That these phytochemical con-stituents affect a myriad of physiological conditions relatedto health has been reviewed elsewhere.3 Data from recentepidemiological studies and biomedical and clinical inves-tigations supporting these effects and further informationfrom advances in chemical analysis and food industry tech-nology are discussed below.
Epidemiology: Decreased cardiovascular mortality
Early epidemiological studies indicated an associationbetween decreased cardiovascular disease mortality andconsumption of dietary flavonoids.4 These observationstriggered scientific interest in flavonoids in general, and incocoa as a rich source of flavan-3-ols in particular. Arecent epidemiological study focused on the effects ofcocoa-containing foods. Over a time-frame of 15 years, asignificant inverse association between consumption ofcocoa and blood pressure as well as cardiovascular mortal-ity was demonstrated.5 The study drew on 470 elderly men(average age 72 years ) who were free of chronic diseases atbaseline. Blood pressure was measured initially and 5 years
* Correspondence:Prof. Dr. Helmut SiesHeinrich-Heine-Universität DüsseldorfInstitut für Biochemie und Molekularbiologie IPostfach 101007D-40001 Düsseldorf GermanyE-Mail: [email protected]: http://www.uniklinik-duesseldorf.de/biochemieund-molekularbiologieeins
Figure 1. (-)-Epicatechin
JANA Vol. 10, No. 2, 2007 25
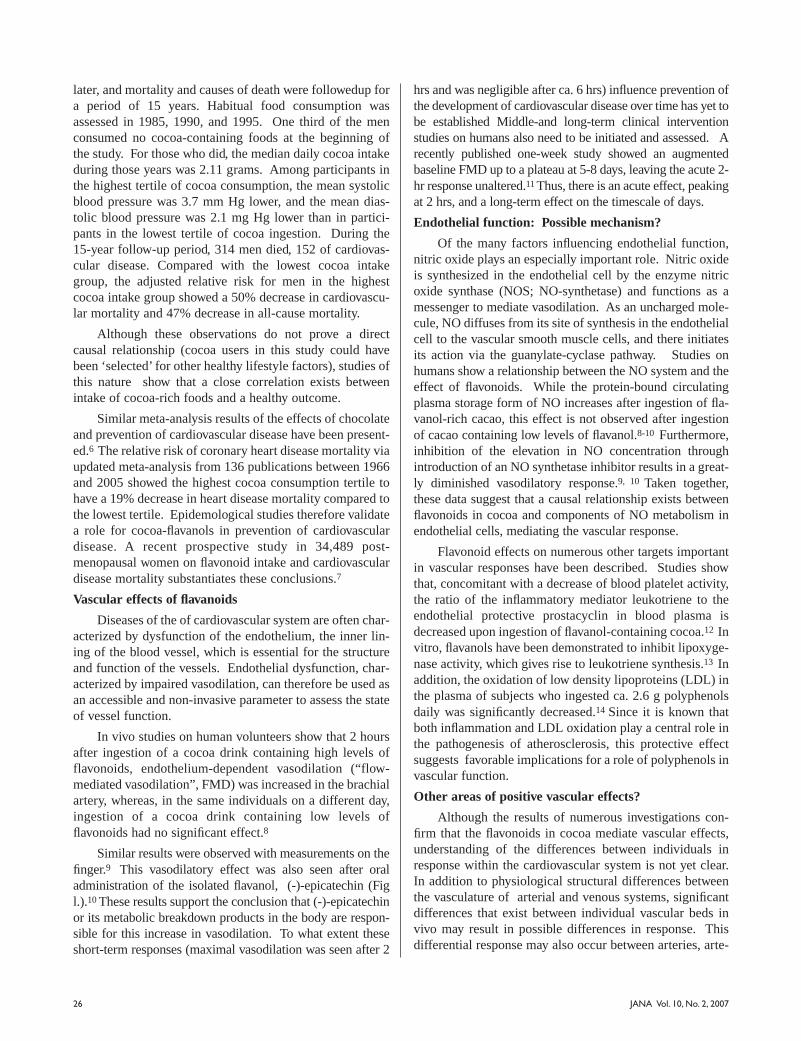
later, and mortality and causes of death were followedup fora period of 15 years. Habitual food consumption wasassessed in 1985, 1990, and 1995. One third of the menconsumed no cocoa-containing foods at the beginning ofthe study. For those who did, the median daily cocoa intakeduring those years was 2.11 grams. Among participants inthe highest tertile of cocoa consumption, the mean systolicblood pressure was 3.7 mm Hg lower, and the mean dias-tolic blood pressure was 2.1 mg Hg lower than in partici-pants in the lowest tertile of cocoa ingestion. During the15-year follow-up period, 314 men died, 152 of cardiovas-cular disease. Compared with the lowest cocoa intakegroup, the adjusted relative risk for men in the highestcocoa intake group showed a 50% decrease in cardiovascu-lar mortality and 47% decrease in all-cause mortality.
Although these observations do not prove a directcausal relationship (cocoa users in this study could havebeen ‘selected’ for other healthy lifestyle factors), studies ofthis nature show that a close correlation exists betweenintake of cocoa-rich foods and a healthy outcome.
Similar meta-analysis results of the effects of chocolateand prevention of cardiovascular disease have been present-ed.6 The relative risk of coronary heart disease mortality viaupdated meta-analysis from 136 publications between 1966and 2005 showed the highest cocoa consumption tertile tohave a 19% decrease in heart disease mortality compared tothe lowest tertile. Epidemological studies therefore validatea role for cocoa-flavanols in prevention of cardiovasculardisease. A recent prospective study in 34,489 post-menopausal women on flavonoid intake and cardiovasculardisease mortality substantiates these conclusions.7
Vascular effects of flavanoids
Diseases of the of cardiovascular system are often char-acterized by dysfunction of the endothelium, the inner lin-ing of the blood vessel, which is essential for the structureand function of the vessels. Endothelial dysfunction, char-acterized by impaired vasodilation, can therefore be used asan accessible and non-invasive parameter to assess the stateof vessel function.
In vivo studies on human volunteers show that 2 hoursafter ingestion of a cocoa drink containing high levels offlavonoids, endothelium-dependent vasodilation (“flow-mediated vasodilation”, FMD) was increased in the brachialartery, whereas, in the same individuals on a different day,ingestion of a cocoa drink containing low levels offlavonoids had no significant effect.8
Similar results were observed with measurements on thefinger.9 This vasodilatory effect was also seen after oraladministration of the isolated flavanol, (-)-epicatechin (Figl.).10 These results support the conclusion that (-)-epicatechinor its metabolic breakdown products in the body are respon-sible for this increase in vasodilation. To what extent theseshort-term responses (maximal vasodilation was seen after 2
hrs and was negligible after ca. 6 hrs) influence prevention ofthe development of cardiovascular disease over time has yet tobe established Middle-and long-term clinical interventionstudies on humans also need to be initiated and assessed. Arecently published one-week study showed an augmentedbaseline FMD up to a plateau at 5-8 days, leaving the acute 2-hr response unaltered.11 Thus, there is an acute effect, peakingat 2 hrs, and a long-term effect on the timescale of days.
Endothelial function: Possible mechanism?
Of the many factors influencing endothelial function,nitric oxide plays an especially important role. Nitric oxideis synthesized in the endothelial cell by the enzyme nitricoxide synthase (NOS; NO-synthetase) and functions as amessenger to mediate vasodilation. As an uncharged mole-cule, NO diffuses from its site of synthesis in the endothelialcell to the vascular smooth muscle cells, and there initiatesits action via the guanylate-cyclase pathway. Studies onhumans show a relationship between the NO system and theeffect of flavonoids. While the protein-bound circulatingplasma storage form of NO increases after ingestion of fla-vanol-rich cacao, this effect is not observed after ingestionof cacao containing low levels of flavanol.8-10 Furthermore,inhibition of the elevation in NO concentration throughintroduction of an NO synthetase inhibitor results in a great-ly diminished vasodilatory response.9, 10 Taken together,these data suggest that a causal relationship exists betweenflavonoids in cocoa and components of NO metabolism inendothelial cells, mediating the vascular response.
Flavonoid effects on numerous other targets importantin vascular responses have been described. Studies showthat, concomitant with a decrease of blood platelet activity,the ratio of the inflammatory mediator leukotriene to theendothelial protective prostacyclin in blood plasma isdecreased upon ingestion of flavanol-containing cocoa.12 Invitro, flavanols have been demonstrated to inhibit lipoxyge-nase activity, which gives rise to leukotriene synthesis.13 Inaddition, the oxidation of low density lipoproteins (LDL) inthe plasma of subjects who ingested ca. 2.6 g polyphenolsdaily was significantly decreased.14 Since it is known thatboth inflammation and LDL oxidation play a central role inthe pathogenesis of atherosclerosis, this protective effectsuggests favorable implications for a role of polyphenols invascular function.
Other areas of positive vascular effects?
Although the results of numerous investigations con-firm that the flavonoids in cocoa mediate vascular effects,understanding of the differences between individuals inresponse within the cardiovascular system is not yet clear.In addition to physiological structural differences betweenthe vasculature of arterial and venous systems, significantdifferences that exist between individual vascular beds invivo may result in possible differences in response. Thisdifferential response may also occur between arteries, arte-
JANA Vol. 10, No. 2, 2007 26

rioles, and the microcirculation. For example, in the skin,the largest organ of the body, ingestion of flavanol-richcocoa over a time-course of weeks shows a significant pos-itive effect in the microcirculation, as exhibited in the cuta-neous as well as in the subcutaneous flow.15 Additionally, aprotective effect against UV damage and an improvement inrelevant cosmetic skin parameters was observed.15 Also,there is a vascular short-term effect in skin at 2 hrs.16
Studies on the effect of flavonoids on coronary arteries, thehealth of which has a direct relationship the prevention ofheart disease, are still necessary. Furthermore, because ofthe important role vessel damage plays in the pathogenesisof stroke, studies involving flavonoid effects on the brainarteries (A. cerebri) are warranted.17
Advances in analysis and in food industry technology
The flavan-3-ol in cacao is found mostly as theoligomer of (-)-epicatechin and its isomer (+)-catechin.Significant advances in the analysis of these substances andof their metabolic products have been made in recentyears.18 After ingestion of cocoa, a vast array of metabolicbreakdown products has been evaluated in the gastrointes-tional tract. These metabolites are mostly produced throughthe activity of the intestinal flora in the small intestine andto a greater degree in the large intestine and are, to a largeextent, taken up in the portal blood.-19 Metabolic modifica-tions, including glucuronidation, methylation, and sulfationthen occur in the liver. In blood plasma, the concentrationof the epicatechin glucuronide is higher than that of freeepicatechin, suggesting that studies of the specific effects ofthe flavan-3-ol metabolites as well as the effects of the phe-nolic acid and the other microbiological breakdown prod-ucts of the flavanols are of interest.
The commercial preparation of chocolate and otherproducts from the cacao bean involves a complex stepwiseprocess, during which an overall decrease in the function ofthe flavan-3-ols may occur. This leads to a significant dif-ference in the content of bioactive flavan-3-ols in differentcocoa products. As a direct result of the increased interestin flavanol rich products, a goal in the food industry is todevelop techniques to achieve products that guarantee highlevels of active flavanol.20
Only positive effects?
The concentrations of (-)-epicatechin and its metabolitesin plasma reach their maximum approximately two hoursafter ingestion. There is very little information about theirconcentration in organs and in subcellular organelles. Alsostill unanswered is the question of the potential health risks ofexcessive flavonoid dietary intake, as well as information onthe potential toxicity from accompanying compounds. In thecase of anthocyanidins, related flavonoid compounds, inhibi-tion of DNA-associated enzymes such as topoisomerase hasbeen shown. At high concentrations, this could lead to DNAstrand breaks and mutations due to unrepaired or misrepaired
DNA damage. 21 Other toxicological aspects, observed athigh flavonoid doses, warrant further study.22
CONCLUSIONS
Flavonoids are found in a wide range of food sources,and their dietary vasoactivity effects are not limited only tococoa and its related products.23 Red grapes (red wine) andgreen tea, for example, are also rich sources of flavonoids,and the comparison between their patterns of flavonoidsand cardiovascular effects and those of cocoa are of inter-est. A comprehensive presentation of the relationshipbetween flavonoids and heart health has recently becomeavailable.24
REFERENCES
1. Middleton E, Kandaswami C, Theoharides TC. Theeffects of plant flavonoids on mammalian cells: impli-cations for inflammation, heart disease, and cancer.Pharmacol Rev. 2000;52:673–751.
2. Dillinger TL, Barriga P, Escárcega S, Jimenez M,Salazar Lowe D, Grivetti LE. Food of the gods: cure forhumanity? A cultural history of the medicinal and ritualuse of chocolate. J Nutr. 2000;130:2057S–2072S.
3. Slayback DL, Waston RR. Bioflavonoids and cardio-vascular health: tea, red wine, cocoa, and Pycnogenol.JANA. 2006;9:16–21.
4. Hertog MGL, Feskens EJM, Hollman PC, Katan MB,Kromhout D. Dietary antioxidant flavonoids and risk ofcoronary heart disease. The Zutphen Elderly study.Lancet. 1993;342:1007–1011.
5. Buijsse B, Feskens EJM, Kok FJ, Kromhout D. Cocoaintake, blood pressure and cardiovascular mortality.Arch Intern Med. 2006;166:411–417.
6. Ding EL, Hutfless SM, Ding X, Girotra S. Chocolateand prevention of cardiovascular disease: a systematicreview. Nutr Metab. 2006;3:2 (doi:10.1186/1743–7075-3-2).
7. Mink PJ, Scrafford CG, Barraj LM, Harnack L, Hong C-P, Nettleton JA, Jacobs Jr DR. Flavonoid intake and car-diovascular disease mortality: a prospective study inpostmenopausal women. Am J Clin Nutr.2007;85:895–909.
8. Heiss C, Dejam A, Kleinbongard P, Schewe T, Sies H,Kelm M. Vascular effects of cocoa rich in flavan-3-ols.J Am Med Assoc (JAMA). 2003;290:1029-1030.
9. Fisher ND, Hughes M, Gerhard-Herman M, HollenbergNK. Flavanol-rich cocoa induces nitric-oxide-depen-dent vasodilation in healthy humans. J Hypertens.2003;21:2281-2286.
10. Schroeter H, Heiss C, Balzer J, Kleinbongard P, Keen
JANA Vol. 10, No. 2, 2007 27
CL, Hollenberg NK, Sies H, Kwik-Uribe C, SchmitzHH, Kelm M. (-)-Epicatechin mediates beneficialeffects of flavanol-rich cocoa on vascular function inhumans. Proc Natl Acad Sci (USA).2006;103:1024–1029.
11. Heiss C, Finis D, Kleinbongard P, Hoffmann A, RassafT, Kelm M, Sies H. Sustained increase in flow-mediat-ed dilation after daily intake of high-flavanol cocoadrink over 1 week. J Cardiovasc Pharmacol2007;49,74–80
12. Schramm DD, Wang JF, Holt RR, Ensusa JL, GonsalvesJL, Lazarus SA, Schmitz HH, German JB, Keen CL.Chocolate procyanidins decrease the leukotriene-prostacyclin ratio in humans and human aorticendothelial cells. Am J Clin Nutr. 2001;73:36–40.
13. Sies H, Schewe T, Heiss C, Kelm M. Cocoa polyphe-nols and inflammatory mediators. Amer J Clin Nutr.2005;81:304S–312S.
14. Osakabe N, Baba S, Yasuda A, Iwamoto T, KamiyamaM, Takizawa T, Itakura H, Kondo K. Daily cocoaintake reduces the susceptibility of low-densitylipoprotein to oxidation as demonstrated in healthyhuman volunteers. Free Rad Res. 2001;34:93–99.
15. Heinrich U, Neukam K, Tronnier H, Sies H, Stahl W.Long-term ingestion of high-flavanol cocoa providesphotoprotection against UV-induced erythema andimproves skin condition in women. J. Nutr.2006;136:1565–1569.
16. Nenkam K, Stahl W, Tronnier H, Sies H, Heinrich U.Consumption of flavanol-rich cocoa acutely increasesmicrocirculation in human skin. Eur J Nutr2007;46,53–56
17. Fisher ND, Sorond NA, Hollenberg NK. Cocoa fla-vanols and brain function. J Cardiovasc Pharmacol.2006;46, Supp 2, 5210–5214
18. Kelm MA, Johnson JC, Robbins RJ, Hammerstone JF,Schmitz HH. High-performance liquid chromatogra-phy separation and purification of cacao (Theobromacacao L.) procyanidins according to degree of poly-merization using a diol stationary phase. J Agric FoodChem. 2006;54:1571–1576.
19. Manach C, Scalbert A, Morand C, Rémésy C,Jiménez_L. Polyphenols: food sources and bioavail-ability. Am J Clin Nutr. 2004;79:727–747.
20. Wollgast J. The contents and effects of polyphenols inchocolate. PhD Dissertation, Faculty of Agriculturaland Nutritional Sciences, Giessen, 2004;1–349.
21. Habermeyer M, Fritz J, Barthelmes HU, ChristensenMO, Larsen MK, Boege F, Marko D. Anthocyanidinsmodulate the activity of human DNA topoisomerases Iand II and affect cellular DNA integrity. Chem ResToxicol. 2005;18:1395–1404.
22. Skibola CF, Smith MT. Potential health impacts ofexcessive flavonoid intake. Free Rad Biol Med.2000;29:375–383.
23. Perez-Vizcaino F, Duarte J, Adriantsitohaina R.Endothelial function and cardiovascular disease:Effects of quercetin and wine polyphenols. Free RadRes. 2006;40:1054–1065
24. Erdman JW, Balentine D, Arab L, Beecher G, Dwyer JT,Harnly J, Hollman P, Keen CL, Mazza G, Messina M,Scalbert A, Vita J, Williamson G, Burrowes J. G.Flavonoids and heart health: proceedings of the ILSINorth America flavonoids workshop, May 31-Jul 1,2005, Washington, DC. J. Nutr. 2007;137:718S–737S
JANA Vol. 10, No. 2, 2007 28
JANA Vol. 10, No. 2, 2007 29
C A S E R E P O R T
JANA Case Report
Seth Baum, MD, FACC*Integrative Heart Care, Boca Raton, Florida
Member, ANA Medical Advisory Board
In the last edition of JANA, Volume 10, No.1, 2007, Dr. Baum wrote an article on preventative cardiology that discussed new testing
modalities that deal with LDL-P, or LDL particle number. As a follow up to his article, Dr. Baum has submitted the following clinical case report.
CASE REPORT
A forty-six-year-old asymptomatic gentleman with ahistory of minimal remote tobacco abuse – greater thantwenty years ago - and a positive family history of ASHD(not premature), but with no history of hypertension, hyper-cholesterolemia or diabetes mellitus, presented for a pre-ventive approach to CV disease. Initial evaluation revealeda normotensive, mildly overweight individual (6’2, 208 lbs)with the following laboratory values: Total Cholesterol 195,LDL-C 110, HDL-C 49, TG 182, LDL-P 2,194, and SmallLDL-P 2037. LDL-P provides a precise measurement ofthe number of LDL particles in the blood. This test is donewith NMR measurements, which obviate the need for bloodseparation techniques and thus diminish the element of“human error.” As there is commonly a huge variation in
LDL particle size and cholesterol content, and as it is theLDL particles themselves that directly enter the arterialintima to cause vascular disease, LDL-P is a better predic-tor of CV events than LDL-C ( the cholesterol content ofthe particles). His “emerging risk factors” revealed:Homocysteine 9.2, Fibrinogen 289, CRP < 0.01, and Lp (a)<5 (PLAC and BNP were not performed). His Framinghamten year risk was calculated to be just 2%. Although hisLDL-C was normal and his Framingham risk was very low,my concern about this man’s very high LDL-P along withhis reluctance to follow my medical recommendations, ledme to suggest a coronary CT angiogram (CCTA). TheCCTA did reveal non-obstructive two vessel CAD (in theLAD and Left Circumflex arteries). Therapeutic lifestylechanges were implemented as well as Vytorin 10/10, ASA81 mg, and EPA/DHA 1,000 mg daily as per AHA guide-lines. His nine month follow up numbers revealed: TotalCholesterol 116, LDL-C 40, HDL-C 68, TG 39, LDL-P 995and small LDL-P 694. He is exercising daily and has lost13 pounds. Without identifying this man’s risk for CADwith LDL-P information, we would not have embarkedupon an aggressive risk reduction strategy. LDL-P was crit-ical in terms of identification and management of this man’spreviously “hidden” coronary artery disease. The CCTAwas also a valuable tool for convincing him of the need foraggressive management of his risks.
* Correspondence:Seth J. Baum, MD, FACC2300 Glades Road, Suite 305EBoca Raton, FL 33431Phone: 561.367.8155 Fax 866.366.1269Email: [email protected]
30 JANA Vol. 10, No. 2, 2007
M E T A - A N A L Y S I S A R T I C L E
Vitamin C Supplementation for TreatingHypercholesterolemia: A Meta-Analysis of 16
Randomized Controlled Trials
Marc P. McRae, MSc, DC, FACN*
Department of Physiology and Biochemistry National University of Health Sciences
Lombard, Illinois
Key Indexing Terms: Vitamin C, ascorbic acid, choles-terol, hypercholesterolemia, meta-analysis
ABSTRACT
Objective
Hypercholesterolemia is an independent risk factorassociated with the high mortality rate of coronary heartdisease. Epidemiological evidence suggests that a dietarydeficiency of vitamin C may cause an elevation in totalserum cholesterol concentrations. However, it remainsunclear whether or not vitamin C supplementation canreduce total serum cholesterol. Therefore, the purpose ofthis study was to provide a comprehensive meta-analysisusing randomized, controlled trials looking at the effect ofvitamin C supplementation on total serum cholesterol inhypercholesterolemic patients.
Methods
Sixteen randomized, controlled trials publishedbetween 1970 and 2006 were identified using Medline and amanual search. From the 16 trials, 18 separate group popu-lations were identified and subsequently divided into 2 sep-arate categories based on their initial baseline total serumcholesterol concentration: Borderline-High (200 to 239mg/dl) and High (greater than 240 mg/dl). Using a randomeffects model, the effect sizes of vitamin C supplementationon total serum cholesterol changes were estimated.
Results
For the Borderline-High cholesterol category, the over-all pooled estimate of the effect of vitamin C supplementa-tion on total serum cholesterol was -7.58 mg/dl (95% CI, -11.62 to -3.55; p<0.05). For the High cholesterol category,the overall pooled estimate of the effect of vitamin C sup-plementation on total serum cholesterol was -17.16 mg/dl(95% CI, -23.37 to -10.95; p<0.01).
Conclusion
Vitamin C supplementation in hypercholesterolemicpatients appears to possess significant but modest effects onreducing total serum cholesterol. The changes in totalserum cholesterol are related to the subject’s initial totalserum concentration, as the effect size observed for theHigh cholesterol category was greater than that observedfor the Borderline-High cholesterol category.
* Correspondence:Marc P. McRae, MSc, DC, FACNAssistant ProfessorDepartment of Physiology and BiochemistryNational University of Health Sciences200 East Roosevelt Rd.Lombard, Illinois 60148Phone: [email protected]

31JANA Vol. 10, No. 2, 2007
INTRODUCTION
Hypercholesterolemia is a primary risk factor leading tocoronary heart disease, the leading cause of premature deathand disability in the United States. The American HeartAssociation estimates that approximately 36.6 millionAmerican adults have total serum cholesterol levels ofgreater than 240 mg/dl.1 Over the past couple of decades, anumber of nutritional compounds have shown some promisein reducing total serum cholesterol concentrations. Onesuch compound is vitamin C. Animal studies have shownthat vitamin C participates in cholesterol metabolism, andthat a marginal vitamin C deficiency increases total serumcholesterol concentration.2 Observational studies usinghuman populations have shown an inverse relationshipbetween vitamin C intake and mortality due to cardiovascu-lar disease.3,4 However, cross-sectional and longitudinalstudies that examine the relationship between total serumcholesterol and vitamin C have shown conflicting and incon-clusive results.5,6 Furthermore, experimental studies havealso shown inconsistent results regarding the ability of vita-min C to reduce total serum cholesterol.7,8 In a review byHoward and Meyers on the effects of vitamin C and its effi-cacy in reducing total serum cholesterol, the authors con-cluded that vitamin C supplementation should not be rec-ommended for use in preventing hypercholesterolemia.9
However, on closer examination, several of the pastexperimental trials have used subjects with initially low tonormal baseline total serum cholesterol concentrations,which explains why some of these experimental studieshave not shown a decrease in total cholesterol with vitaminC supplementation.10 Moreover, a majority of experimentalstudies using only hypercholesterolemic subjects have illus-trated significant decreases in total cholesterol concentra-tions.11 There also exists a strong positive correlationbetween the effectiveness of vitamin C supplementation onreducing total serum cholesterol and the patient’s baselinetotal serum cholesterol level.12 This finding is significant,since there is a strong independent relationship betweentotal serum cholesterol and the long-term risk of coronaryheart disease and cardiovascular death.13
Since no meta-analysis has ever been published inregard to the effect of vitamin C supplementation on hyper-cholesterolemia, it was believed that such an analysis wasnecessary. This is especially true in light of the fact thatuncertainty exists about vitamin C’s efficacy, even thoughmore than a dozen randomized clinical trials have been con-ducted with hypercholesterolemic patients. The purpose ofthis study was to provide a comprehensive meta-analysis ofrandomized controlled trials to investigate the effect of vit-amin C supplementation on total serum cholesterol inpatients with hypercholesterolemia.
METHODS
Selection of Studies
A comprehensive Medline literature search was per-formed to locate relevant randomized controlled trials pub-lished between 1970 through December 2006. The follow-ing headings were combined using the following Booleanoperation (“vitamin C” OR “ascorbic acid” OR “ascor-bate”) AND cholesterol. The search was restricted to keyterms located in the title/abstract, and language was not anexclusion criterion. Also, only full-length original journalarticles were considered, and no attempt was made toinclude abstracts or unpublished studies. A manual searchwas also conducted by using reference lists from originalresearch papers and review articles.
To be included in the meta-analysis, a study had tomeet the following criteria: (1) the study was conductedusing hypercholesterolemic human subjects (total serumcholesterol > 200 mg/dl); (2) study design consisted of, atminimum, single-blind, random allocation of study partici-pants to vitamin C treatment or placebo-controlled groups;(3) vitamin C was given orally with a minimum dose of 500mg/day; (4) the intervention was greater than 3 weeks andless than 24 weeks; (5) the study reported the mean totalserum cholesterol changes in both treatment and controlgroups. The dose and intervention duration cut-offs werechosen based on the observations that 500 mg/day is therequired intake for 95% of the population to achieve a sat-urated plasma vitamin C concentration,14 and that it takes 3to 4 weeks to reach a plasma-steady-state following vitaminC supplementation.15
Sixteen studies met the eligibility criteria and wereincluded in the meta-analysis.7,8,16-29 Although 95 poten-tially relevant studies were identified and screened, 79 trialsdid not meet the eligibility criteria. Major reasons forexclusion of studies were (1) co-intervention with othertherapies (17 trials); (2) non-hypercholesterolemic subjectpopulations (25 trials); (3) using oral doses of vitamin Cless than 500 mg/day (5 trials); (4) a treatment duration ofless than 3 weeks or greater than 24 weeks (5 trials); (5)study populations overlapped with other published studies(1 trial); (6) lack of randomization or use of a placebo con-trolled group (21 trials); and (7) an absence of data to cal-culate the net mean change in total serum cholesterol frombaseline to end of follow-up (5 trials). Figure 1 shows thenumber of studies that were identified and excluded at dif-ferent stages of the selection process.
Data Abstraction and Statistical Analysis
Information on sample size, participant characteristics,study design, vitamin C dosage, duration of intervention,and treatment results were abstracted from the 16 clinicaltrials. From the 16 trials, 18 separate group populationswere identified. Prior to their entry into the meta-analysis,the 18 groups were first divided into 2 separate categories
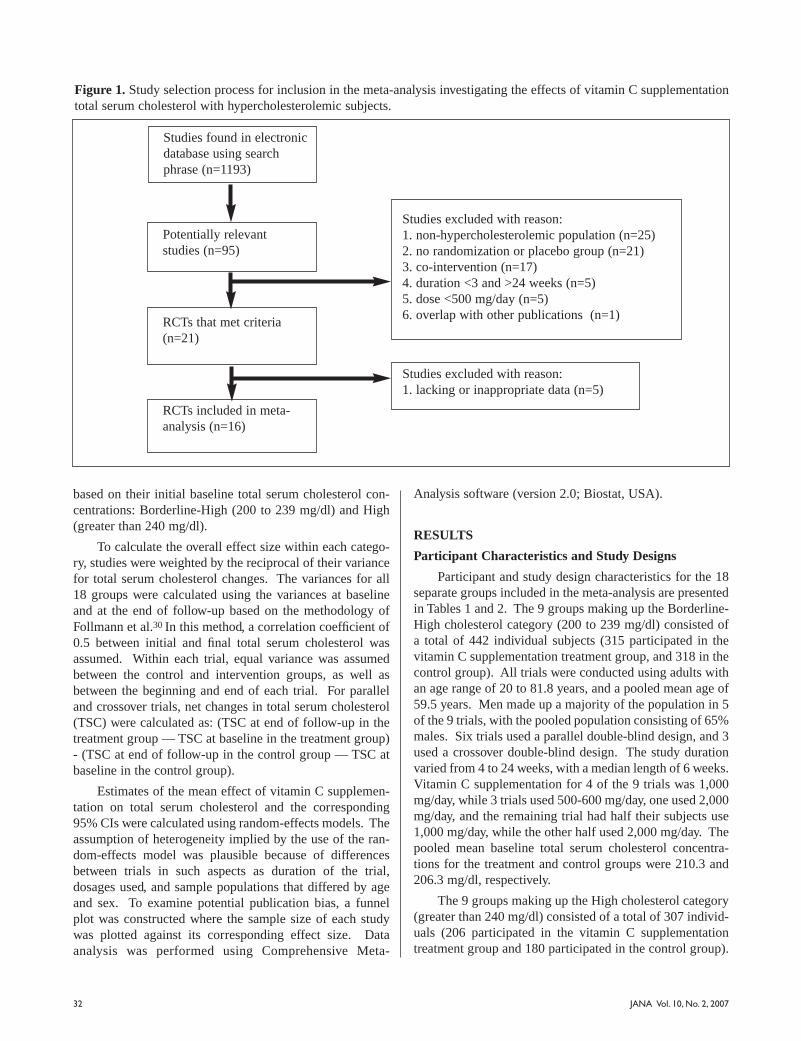
32 JANA Vol. 10, No. 2, 2007
based on their initial baseline total serum cholesterol con-centrations: Borderline-High (200 to 239 mg/dl) and High(greater than 240 mg/dl).
To calculate the overall effect size within each catego-ry, studies were weighted by the reciprocal of their variancefor total serum cholesterol changes. The variances for all18 groups were calculated using the variances at baselineand at the end of follow-up based on the methodology ofFollmann et al.30 In this method, a correlation coefficient of0.5 between initial and final total serum cholesterol wasassumed. Within each trial, equal variance was assumedbetween the control and intervention groups, as well asbetween the beginning and end of each trial. For paralleland crossover trials, net changes in total serum cholesterol(TSC) were calculated as: (TSC at end of follow-up in thetreatment group — TSC at baseline in the treatment group)- (TSC at end of follow-up in the control group — TSC atbaseline in the control group).
Estimates of the mean effect of vitamin C supplemen-tation on total serum cholesterol and the corresponding95% CIs were calculated using random-effects models. Theassumption of heterogeneity implied by the use of the ran-dom-effects model was plausible because of differencesbetween trials in such aspects as duration of the trial,dosages used, and sample populations that differed by ageand sex. To examine potential publication bias, a funnelplot was constructed where the sample size of each studywas plotted against its corresponding effect size. Dataanalysis was performed using Comprehensive Meta-
Analysis software (version 2.0; Biostat, USA).
RESULTS
Participant Characteristics and Study Designs
Participant and study design characteristics for the 18separate groups included in the meta-analysis are presentedin Tables 1 and 2. The 9 groups making up the Borderline-High cholesterol category (200 to 239 mg/dl) consisted ofa total of 442 individual subjects (315 participated in thevitamin C supplementation treatment group, and 318 in thecontrol group). All trials were conducted using adults withan age range of 20 to 81.8 years, and a pooled mean age of59.5 years. Men made up a majority of the population in 5of the 9 trials, with the pooled population consisting of 65%males. Six trials used a parallel double-blind design, and 3used a crossover double-blind design. The study durationvaried from 4 to 24 weeks, with a median length of 6 weeks.Vitamin C supplementation for 4 of the 9 trials was 1,000mg/day, while 3 trials used 500-600 mg/day, one used 2,000mg/day, and the remaining trial had half their subjects use1,000 mg/day, while the other half used 2,000 mg/day. Thepooled mean baseline total serum cholesterol concentra-tions for the treatment and control groups were 210.3 and206.3 mg/dl, respectively.
The 9 groups making up the High cholesterol category(greater than 240 mg/dl) consisted of a total of 307 individ-uals (206 participated in the vitamin C supplementationtreatment group and 180 participated in the control group).
Figure 1. Study selection process for inclusion in the meta-analysis investigating the effects of vitamin C supplementationtotal serum cholesterol with hypercholesterolemic subjects.
Studies found in electronicdatabase using searchphrase (n=1193)
Potentially relevant studies (n=95)
RCTs that met criteria(n=21)
RCTs included in meta-analysis (n=16)
Studies excluded with reason:1. non-hypercholesterolemic population (n=25)2. no randomization or placebo group (n=21)3. co-intervention (n=17)4. duration <3 and >24 weeks (n=5)5. dose <500 mg/day (n=5)6. overlap with other publications (n=1)
Studies excluded with reason:1. lacking or inappropriate data (n=5)

JANA Vol. 10, No. 2, 2007 33
All trials were conducted in adults with an age range of 30to 73 years and a pooled mean age of 52.3 years. Men madeup a majority of the population in 5 of the 9 trials, but thepooled population was only made up of 49% males. Fivetrials used a parallel double-blind design, and 4 used acrossover double-blind design. The study duration variedfrom 3 to 24 weeks, with a median length of 8 weeks.Vitamin C supplementation for 4 of the 9 trials was 500mg/day, while 3 trials used 1,000 mg/day, one used 1,500mg/day and the remaining trial used 2,000 mg/day. Thepooled mean baseline total serum cholesterol concentra-tions for the treatment and control groups were 278.7 and271.1 mg/dl, respectively.
Net Change in Blood Pressure
The mean net changes in total serum cholesterol for bothcategories of hypercholesterolemia after vitamin C supple-mentation are presented in Table 3. In the Borderline-Highcholesterol category, 6 of the 9 trials had an intervention-related trend toward a reduction in total serum cholesterol: 3of these trials showed a statistically significant reduction(p<0.05) in total serum cholesterol when compared to thecontrol group (Figure 2). For the High cholesterol category,a trend toward intervention-related reduction was alsoobserved for 6 of the 9 trials, whereas only 2 of these trialsshowed a statistically significant reduction in total serum cho-lesterol when compared to the control group (Figure 3).
The effect size along with the 95% CIs for each clini-cal trial, as well as the overall effect size on total serum cho-lesterol for both hypercholesterolemic categories, are pre-sented in Figures 2 and 3. For the Borderline-High choles-terol category, the overall pooled estimate of the effect ofvitamin C supplementation on total serum cholesterol was -7.58 mg/dl (95% CI, -11.62 to -3.55; p<0.05). For the Highcholesterol category, the overall pooled estimate was -17.16mg/dl (95% CI, -23.37 to -10.95; p<0.01).
The plot of sample size versus effect size showed a typ-ical “funnel” shape with little variation in effect size forlarge sample studies, and increasing spread of effect sizewith smaller sample sizes. The distribution of effect sizesseen in the individual studies was symmetrically distributedaround the pooled mean effect size for the Borderline-Highcholesterol category, but asymmetrically distributed for theHigh cholesterol category (Figures 2 and 3).
DISCUSSION
This is the first meta-analysis to provide a comprehen-sive examination of the effect of vitamin C supplementationon total serum cholesterol. The analysis was based on 16randomized, controlled clinical trials involving 18 separategroup populations, providing a total of 749 participants.The overall effect size estimates observed from the meta-
Figure 2. Borderline-High cholesterol category’s netchange in total serum cholesterol associated with vitamin Csupplementation in 9 separate trials. The overall effect isweighted by the inverse of the total variance of each trial.
Figure 3. High cholesterol category’s net change in totalserum cholesterol associated with vitamin C supplementa-tion in 9 separate trials. The overall effect is weighted bythe inverse of the total variance of each trial.
Kothari and Jain, 197716
Horsey et al., 198117
Dobson et al., 198419
Aro et al., 198821
Salonen et al., 199123
Munoz et al., 199425
Gokce et al., 199927
Fotherby et al., 200028
Singhal et al., 20018
Overall Effect
Kothari and Jain, 197716
Wahlberg and Walldius, 198218
Bishop et al., 198520
Bishop et al., 198520
Miamianetti et al., 198822
Cerna et al., 199224
Paolisso et al., 199526
Vinson and Jang et al., 20017
Shidfar et al., 200329
Overall Effect

34 JANA Vol. 10, No. 2, 2007
analysis for the Borderline-High and High cholesterol cate-gories were -7.58 mg/dl and -17.16 mg/dl respectively. Withrespect to presenting effect size as a percentage decreasefrom baseline, total serum cholesterol for the Borderline-High cholesterol category fell approximately 3.6%, whilethe High cholesterol category fell 6.2%. Although thesereductions in total serum cholesterol are modest, they couldstill potentially translate to a 4 to 7% reduction in coronaryheart disease risk for the Borderline-High cholesterol cate-gory, and a 10 to 12% reduction in coronary heart diseaserisk for the High cholesterol category.31-33
Vitamin C may be as beneficial when compared toother proposed nutritional supplements for reducing totalserum cholesterol concentrations. Meta-analyses of psylli-um supplementation and soy protein isoflavone supplemen-tation both suggested a reduction in total serum cholesterolof approximately 9.6 mg/dl,34,35 while a meta-analysis ofgarlic supplement studies suggests an even larger effect ontotal serum cholesterol of approximately 15.7 mg/dl,36 aneffect size greater than that observed with the Borderline-High cholesterol category, but less than what was observedin the High cholesterol category. However, one meta-analy-sis using phytosterol/stanol supplementation did observeeffect sizes greater than that observed with vitamin C, aspatients in the phytosterol/stanol study, with baseline totalserum cholesterol levels of 270 mg/dl, had their levels dropby 25 mg/dl.37
In regard to mechanism of action, it has been shown thatdisturbances in serum pro-oxidant-antioxidant balance areconcomitant with higher total serum cholesterol levels,38
which supports evidence suggesting that vitamin C’s hypoc-holesterolemic effects may be due to its antioxidant abili-ty.39,40 Moreover, vitamin C has shown an ability to signifi-cantly reduce lipid peroxide levels8 and inhibit peroxidativemodification of low density lipoproteins (LDL).41
Furthermore, it appears that vitamin C’s protection of LDLfrom peroxidation may preserve the ability of LDL to be rec-ognized by LDL receptors in the liver, and therefore expediteits removal from the blood by LDL-cholesterol catabolicpathways.41,42 However, in two separate instances, thismechanism has been contested, as it was observed that vita-min C did not protect plasma lipids43 or LDL44 from oxida-tion, the reason being that vitamin C is hydrophilic and doesnot bind to lipoproteins.7 But another group countered thispoint by suggesting that vitamin C is able to protect polyun-saturated fatty acids from oxidation, and therefore to limitthe concentration of oxidative byproducts (such as malondi-aldehyde) that function to inhibit normal LDL catabolism.29
In animal models, vitamin C has shown great promisein the prevention of hypercholesterolemia-induced athero-sclerosis.45 Furthermore, the hypocholesterolemic effectthat vitamin C has had on total serum cholesterol supportsthe epidemiological observations that there exists an inverserelationship between vitamin C intake and cardiovascular
disease.11 However, it is important to note that vitamin Cmay have other protective effects with regard to cardiovas-cular disease (for example, reduced blood pressure,28
decreased endothelial dysfunction,27 platelet aggregationinhibition,23 and decreased insulin resistance26) that areindependent of changes in cholesterol levels.
The strength of this meta-analysis would have beenimproved if the role of low density lipoproteins, high densi-ty lipoproteins (HDL), and triglycerides had been investi-gated. However, the data to perform this subgroup analysiswas available for only half of the studies, and therefore notcollectively analyzed since the sample sizes were inevitablyreduced and there was insufficient statistical power to detectsmall significant differences. This is unfortunate, since ithas been observed that HDL cholesterol is elevated by vita-min C supplementation,46 and therefore could have playedout as a particularly important confounder to the overallreduction in total serum cholesterol in this meta-analysis.However, upon further inspection of the studies that hadpublished HDL changes, only one study17 observed a signif-icant increase in HDLs through vitamin C supplementation.
Another major limitation of this study is the pooling ofclinical trials, which includes a considerable amount of het-erogeneity in design and population characteristics.Average subject age varied between 30 and 81 years, and itis known that vitamin C concentration in serum decreaseswith aging, while a concomitant increase in total serumconcentration occurs.47 Differences in age and dietary char-acteristics may result in unevenly matched baseline plasmavitamin C concentrations. In the 9 groups that observedbaseline plasma vitamin C concentrations, the range variedbetween 28 and 74 mol. This may confound both the start-ing baseline total serum cholesterol levels12 as well as theabsorbability of vitamin C supplementation, which isdependent upon initial pre-absorption plasma concentra-tions.15 Also, not having evenly matched baseline totalserum cholesterol concentrations could confound theresults as populations with higher concentrations couldpossibly exhibit a greater hypocholesterolemic effect withvitamin C supplementation. Confounders also includeddifferences between studies with vitamin C supplementa-tion dose (between 500 to 2,000 mg/day) and study duration(between 3 to 24 weeks).
CONCLUSION
In summary, this meta-analysis has shown that supple-mentation with at least 500 mg/day of vitamin C, for a min-imum of 4 weeks, is associated with significantly decreasedtotal serum cholesterol concentrations. The changes in totalserum cholesterol are related to the subject’s initial totalserum concentration, as the effect size observed for theHigh cholesterol group was greater than that observed forthe Borderline-High cholesterol group. Although the
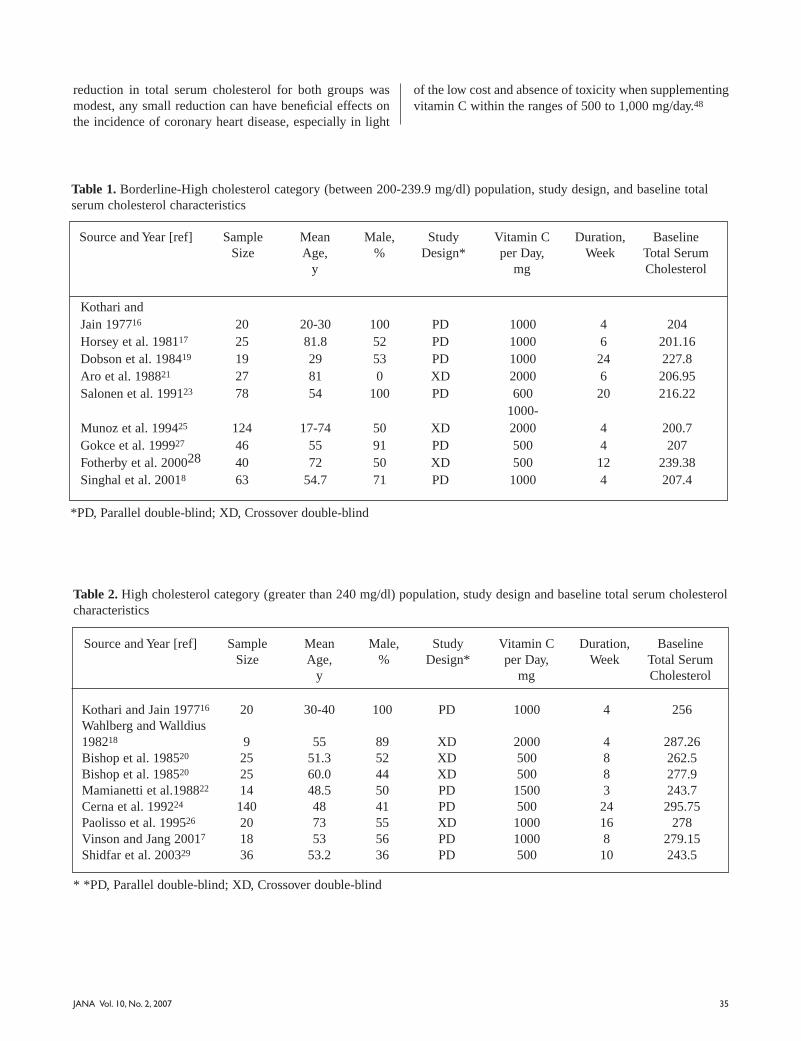
35JANA Vol. 10, No. 2, 2007
reduction in total serum cholesterol for both groups wasmodest, any small reduction can have beneficial effects onthe incidence of coronary heart disease, especially in light
of the low cost and absence of toxicity when supplementingvitamin C within the ranges of 500 to 1,000 mg/day.48
Table 1. Borderline-High cholesterol category (between 200-239.9 mg/dl) population, study design, and baseline totalserum cholesterol characteristics
Source and Year [ref] SampleSize
MeanAge,
y
Male,%
StudyDesign*
Vitamin Cper Day,
mg
Duration,Week
BaselineTotal SerumCholesterol
Kothari and Jain 197716 20 20-30 100 PD 1000 4 204 Horsey et al. 198117 25 81.8 52 PD 1000 6 201.16 Dobson et al. 198419 19 29 53 PD 1000 24 227.8 Aro et al. 198821 27 81 0 XD 2000 6 206.95 Salonen et al. 199123 78 54 100 PD 600 20 216.22
1000-Munoz et al. 199425 124 17-74 50 XD 2000 4 200.7 Gokce et al. 199927 46 55 91 PD 500 4 207 Fotherby et al. 200028 40 72 50 XD 500 12 239.38 Singhal et al. 20018 63 54.7 71 PD 1000 4 207.4
*PD, Parallel double-blind; XD, Crossover double-blind
Source and Year [ref] SampleSize
MeanAge,
y
Male,%
StudyDesign*
Vitamin Cper Day,
mg
Duration,Week
BaselineTotal SerumCholesterol
Kothari and Jain 197716 20 30-40 100 PD 1000 4 256 Wahlberg and Walldius 198218 9 55 89 XD 2000 4 287.26Bishop et al. 198520 25 51.3 52 XD 500 8 262.5 Bishop et al. 198520 25 60.0 44 XD 500 8 277.9Mamianetti et al.198822 14 48.5 50 PD 1500 3 243.7 Cerna et al. 199224 140 48 41 PD 500 24 295.75 Paolisso et al. 199526 20 73 55 XD 1000 16 278 Vinson and Jang 20017 18 53 56 PD 1000 8 279.15Shidfar et al. 200329 36 53.2 36 PD 500 10 243.5
Table 2. High cholesterol category (greater than 240 mg/dl) population, study design and baseline total serum cholesterolcharacteristics
* *PD, Parallel double-blind; XD, Crossover double-blind
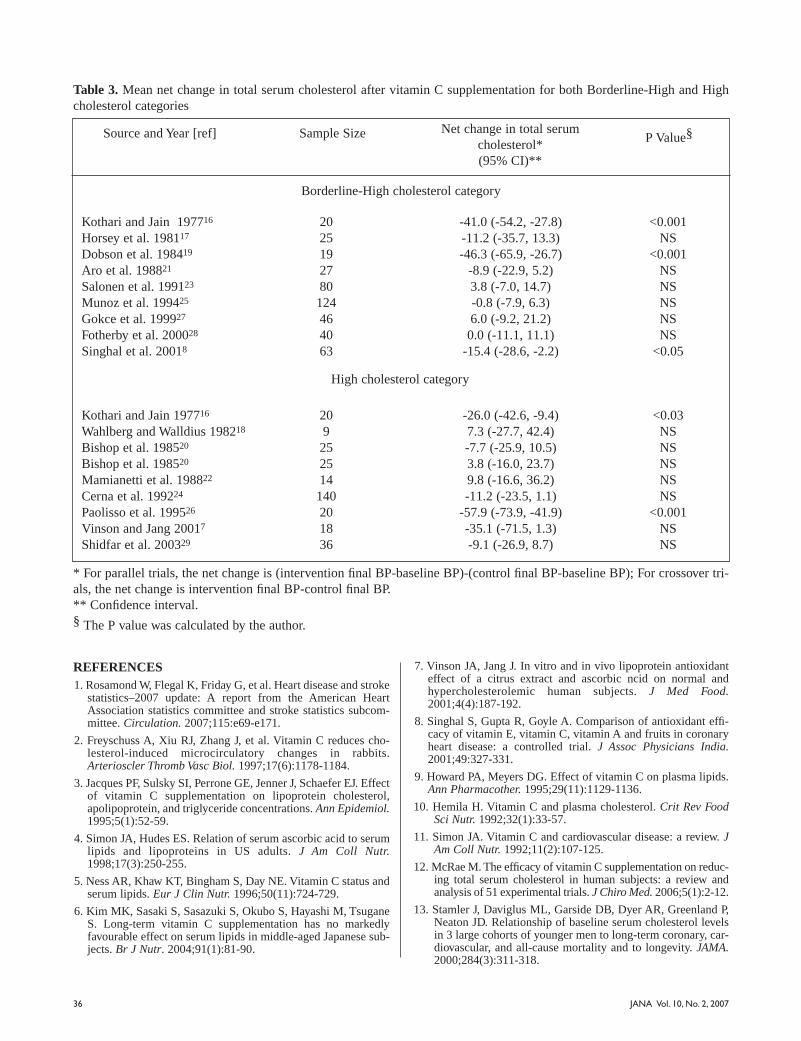
Kothari and Jain 197716 20 -41.0 (-54.2, -27.8) <0.001 Horsey et al. 198117 25 -11.2 (-35.7, 13.3) NS Dobson et al. 198419 19 -46.3 (-65.9, -26.7) <0.001 Aro et al. 198821 27 -8.9 (-22.9, 5.2) NS Salonen et al. 199123 80 3.8 (-7.0, 14.7) NS Munoz et al. 199425 124 -0.8 (-7.9, 6.3) NS Gokce et al. 199927 46 6.0 (-9.2, 21.2) NS Fotherby et al. 200028 40 0.0 (-11.1, 11.1) NS Singhal et al. 20018 63 -15.4 (-28.6, -2.2) <0.05
High cholesterol category
Kothari and Jain 197716 20 -26.0 (-42.6, -9.4) <0.03 Wahlberg and Walldius 198218 9 7.3 (-27.7, 42.4) NS Bishop et al. 198520 25 -7.7 (-25.9, 10.5) NS Bishop et al. 198520 25 3.8 (-16.0, 23.7) NS Mamianetti et al. 198822 14 9.8 (-16.6, 36.2) NS Cerna et al. 199224 140 -11.2 (-23.5, 1.1) NS Paolisso et al. 199526 20 -57.9 (-73.9, -41.9) <0.001 Vinson and Jang 20017 18 -35.1 (-71.5, 1.3) NS Shidfar et al. 200329 36 -9.1 (-26.9, 8.7) NS
Table 3. Mean net change in total serum cholesterol after vitamin C supplementation for both Borderline-High and Highcholesterol categories
Source and Year [ref] Sample Size Net change in total serum cholesterol*(95% CI)**
P Value§
Borderline-High cholesterol category
* For parallel trials, the net change is (intervention final BP-baseline BP)-(control final BP-baseline BP); For crossover tri-als, the net change is intervention final BP-control final BP.** Confidence interval.§ The P value was calculated by the author.
36 JANA Vol. 10, No. 2, 2007
REFERENCES 1. Rosamond W, Flegal K, Friday G, et al. Heart disease and stroke
statistics–2007 update: A report from the American HeartAssociation statistics committee and stroke statistics subcom-mittee. Circulation. 2007;115:e69-e171.
2. Freyschuss A, Xiu RJ, Zhang J, et al. Vitamin C reduces cho-lesterol-induced microcirculatory changes in rabbits.Arterioscler Thromb Vasc Biol. 1997;17(6):1178-1184.
3. Jacques PF, Sulsky SI, Perrone GE, Jenner J, Schaefer EJ. Effectof vitamin C supplementation on lipoprotein cholesterol,apolipoprotein, and triglyceride concentrations. Ann Epidemiol.1995;5(1):52-59.
4. Simon JA, Hudes ES. Relation of serum ascorbic acid to serumlipids and lipoproteins in US adults. J Am Coll Nutr.1998;17(3):250-255.
5. Ness AR, Khaw KT, Bingham S, Day NE. Vitamin C status andserum lipids. Eur J Clin Nutr. 1996;50(11):724-729.
6. Kim MK, Sasaki S, Sasazuki S, Okubo S, Hayashi M, TsuganeS. Long-term vitamin C supplementation has no markedlyfavourable effect on serum lipids in middle-aged Japanese sub-jects. Br J Nutr. 2004;91(1):81-90.
7. Vinson JA, Jang J. In vitro and in vivo lipoprotein antioxidanteffect of a citrus extract and ascorbic ncid on normal andhypercholesterolemic human subjects. J Med Food.2001;4(4):187-192.
8. Singhal S, Gupta R, Goyle A. Comparison of antioxidant effi-cacy of vitamin E, vitamin C, vitamin A and fruits in coronaryheart disease: a controlled trial. J Assoc Physicians India.2001;49:327-331.
9. Howard PA, Meyers DG. Effect of vitamin C on plasma lipids.Ann Pharmacother. 1995;29(11):1129-1136.
10. Hemila H. Vitamin C and plasma cholesterol. Crit Rev FoodSci Nutr. 1992;32(1):33-57.
11. Simon JA. Vitamin C and cardiovascular disease: a review. JAm Coll Nutr. 1992;11(2):107-125.
12. McRae M. The efficacy of vitamin C supplementation on reduc-ing total serum cholesterol in human subjects: a review andanalysis of 51 experimental trials. J Chiro Med. 2006;5(1):2-12.
13. Stamler J, Daviglus ML, Garside DB, Dyer AR, Greenland P,Neaton JD. Relationship of baseline serum cholesterol levelsin 3 large cohorts of younger men to long-term coronary, car-diovascular, and all-cause mortality and to longevity. JAMA.2000;284(3):311-318.
37JANA Vol. 10, No. 2, 2007
14. Brubacher D, Moser U, Jordan P. Vitamin C concentrations inplasma as a function of intake: a meta-analysis. Int J VitamNutr Res. 2000;70(5):226-237.
15. Levine M, Conry-Cantilena C, Wang Y, et al. Vitamin C phar-macokinetics in healthy volunteers: evidence for a recom-mended dietary allowance. Proc Natl Acad Sci.1996;93(8):3704-3709.
16. Kothari LK, Jain K. Effect of vitamin C administration onblood cholesterol level in man. Acta Biol. 1977;28(1):111-114.
17. Horsey J, Livesley B, Dickerson JW. Ischaemic heart diseaseand aged patients: effects of ascorbic acid on lipoproteins. JHum Nutr. 1981;35(1):53-58.
18. Wahlberg G, Walldius G. Lack of effect of ascorbic acid onserum lipoprotein concentrations in patients with hyper-triglyceridaemia. Atherosclerosis. 1982;43(2-3):283-288.
19. Dobson HM, Muir MM, Hume R. The effect of ascorbic acidon the seasonal variations in serum cholesterol levels. ScottMed J. 1984;29(3):176-182.
20. Bishop N, Schorah CJ, Wales JK. The effect of vitamin C sup-plementation on diabetic hyperlipidaemia: a double blind,crossover study. Diabet Med. 1985;2(2):121-124.
21. Aro A, Kyllastinen M, Kostiainen E, Gref CG, Elfving S,Usitalo U. No effect on serum lipids by moderate and highdoses of vitamin C in elderly subjects with low plasma ascor-bic acid levels. Ann Nutr Metab. 1988;32(3):133-137.
22. Mamianetti A, Vescina MC, Matejka MA, Alvarez O, DamenoE, Carducci CN. Efecto del acido ascorbico sobre los lipidosbiliares en pacientes litiasicos. Prensa Med Argent.1988;75:346-350.
23. Salonen JT, Salonen R, Seppanen K, et al. Effects of antioxi-dant supplementation on platelet function: a randomized pair-matched, placebo-controlled, double-blind trial in men withlow antioxidant status. Am J Clin Nutr. 1991;53(5):1222-1229.
24. Cerna O, Ramacsay L, Ginter E. Plasma lipids, lipoproteinsand atherogenic index in men and women administered vita-min C. Cor Vasa. 1992;34(3):246-254.
25. Munoz JA, Garcia C, Quilez JL, Andugar MA. Effect of vita-min C on lipoproteins in healthy adults. Ann Med Interne.1994;145(1):13-19.
26. Paolisso G, Balbi V, Volpe C, et al. Metabolic benefits derivingfrom chronic vitamin C supplementation in aged non-insulindependent diabetics. J Am Coll Nutr. 1995;14(4)387-392.
27. Gokce N, Keaney JF, Frei B, et al. Long-term ascorbic acidadministration reverses endothelial vasomotor dysfunction inpatients with coronary artery disease. Circulation.1999;99:3234-3240.
28. Fotherby MD, Williams JC, Forster LA, Craner P, Ferns GA.Effect of vitamin C on ambulatory blood pressure and plasmalipids in older persons. J Hypertens. 2000;18(4):411-415.
29. Shidfar F, Keshavarz A, Jallali M, Miri R, Eshraghian M.Comparison of the effects of simultaneous administration ofvitamin C and omega-3 fatty acids on lipoproteins, apo A-I,apo B, and malondialdehyde in hyperlipidemic patients. Int JVitam Nutr Res. 2003;73(3):163-170.
30. Follmann D, Elliott P, Suh I, Cutler J. Variance imputation foroverviews of clinical trials with continuous response. J ClinEpidemiol. 1992;45(7):769-773.
31. Rossouw JE. The effects of lowering serum cholesterol oncoronary heart disease risk. Med Clin North Am.1994;78(1):181-195.
32. Jousilahti P, Vartiainen E, Pekkanen J, Tuomilehto J, SundvallJ, Puska P. Serum cholesterol distribution and coronary heartdisease risk: observations and predictions among middle-agedpopulation in eastern Finland. Circulation.1998;97(11):1087-1094.
33. Menotti A, Lanti M, Nedeljkovic S, et al. The relationship ofage, blood pressure, serum cholesterol and smoking habitswith the risk of typical and atypical coronary heart diseasedeath in the European cohorts of the Seven Countries Study.Int J Cardiol. 2006;106(2):157-163.
34. Anderson JW, Allgood LD, Lawrence A, et al. Cholesterol-lowering effects of psyllium intake adjunctive to diet therapyin men and women with hypercholesterolemia: meta-analysisof 8 controlled trials. Am J Clin Nutr. 2000;71(2):472-479.
35. Zhan S, Ho SC. Meta-analysis of the effects of soy proteincontaining isoflavones on the lipid profile. Am J Clin Nutr.2005;81(2):397-408.
36. Stevinson C, Pittler MH, Ernst E. Garlic for treating hyperc-holesterolemia. A meta-analysis of randomized clinical trials.Ann Intern Med. 2000;133(6):420-429.
37. Moruisi KG, Oosthuizen W, Opperman AM. Phytosterols/stanolslower cholesterol concentrations in familial hypercholes-terolemic subjects: a systematic review with meta-analysis. J AmColl Nutr. 2006;25(1):41-48.
38. Balkan J, Dogru-Abbasoglu S, Aykac-Toker G, Uysal M.Serum pro-oxidant-antioxidant balance and low-densitylipoprotein oxidation in healthy subjects with different cho-lesterol levels. Clin Exp Med. 2004;3(4):237-342.
39. Jialal I, Vega GL, Grundy SM. Physiologic levels of ascorbateinhibit the oxidative modification of low density lipoprotein.Atherosclerosis. 1990;82:185-191.
40. Padayatty SJ, Katz A, Wang Y, et al. Vitamin C as an antioxi-dant: evaluation of its role in disease prevention. J Am CollNutr. 2003;22(1):18-35.
41. Sakuma N, Yoshikawa M, Hibino A, et al. Ascorbic acid pro-tects against peroxidative modification of low-densitylipoprotein, maintaining its recognition by LDL receptors. JNutr Sci Vitaminol. 2001;47(1):28-31.
42. Jialal I, Fuller CJ. Effect of vitamin E, vitamin C and beta-carotene on LDL oxidation and atherosclerosis. Can JCardiol. 1995;11:97G-103G.
43. Anderson D, Phillips BJ, Yu TW, Edwards AJ, Ayesh R,Butterworth FR. The effects of vitamin C supplementation onbiomarkers of oxygen radical generated damage in humanvolunteers with low or high cholesterol levels. Environ MolMutagen. 1997;30(2):161-174.
44. Van Hoydonck PG, Schouten EG, Manuel-Y-Keenoy B, vanCampenhout A, Hoppenbrouwers KP, Temme EH. Does vita-min C supplementation influence the levels of circulating oxi-dized LDL, sICAM-1, sVCAM-1 and vWF-antigen in healthymale smokers? Eur J Clin Nutr. 2004;58(12):1587-1593.
45. Das S, Ray R, Snehlata, Das N, Srivastava LM. Effect ofascorbic acid on prevention of hypercholesterolemia inducedatherosclerosis. Mol Cell Biochem. 2006;285(1-2):143-147.
46. Jacques PF. Relationship of vitamin C status to cholesterol andblood pressure. Ann N Y Acad Sci. 1992;669:205-213.
47. Kothari LK, Pramod J, Sharma P. Chaturvedi SK. Influence ofage and vitamin C status on serum cholesterol. Int JEpidemiol. 1988;17(4):929-930.
48. Rivers JM. Safety of high-level vitamin C ingestion. Int JVitam Nutr Res Suppl. 1989;30:95-102

38 JANA Vol. 10, No. 2, 2007
O R I G I N A L R E S E A R C H
Comparison of the Absorption, Brain andProstate Distribution, and Elimination of
CaNa2 EDTA of Rectal Chelation Suppositoriesto Intravenous Administration
Rita Ellithorpe, MD,1* Paul Mazur, PhD, Glenwood Gum, PhD,2 Gerry Button, BS,2
Julian Le, BS,2 Ernest H. Pfadenhauer, MS,3 Robert A. Settineri, MS,3 Garth Nicolson, PhD4
1. Tustin Longevity Center, Tustin, California
2. Biological Test Center, Irvine, California
3. Research Consultant, Sierra Research, Irvine, California
4. The Institute for Molecular Medicine, Laguna Beach, California
ABSTRACT
Rectal suppositories were compared to IV administra-tion of C14-labeled calcium disodium ethylenediaminete-traacetate (CaNa2EDTA) to evaluate the absorption, brainand prostate tissue distribution, and excretion in rats. Theabsolute bioavailability of CaNa2EDTA in blood followingrectal dosing was 36.3% of the IV dose route, which con-firmed that rectal dosing is an efficient method for deliver-ing ethylenediaminetetraacetic acid (EDTA) to tissues. Theratio of radioactive residues of EDTA in tissues comparedto blood, following IV or rectal dosing of C14 labeledCaNa2EDTA, showed negligible brain localization.However, prostate tissues were found to have a mean ratioof 3.69 via the IV route and 13.6 rectally. The total recov-ery of C14 EDTA expressed as percent of administereddosed IV was a mean of 47.3% and 30.3% rectally at eighthours when the test was concluded. The suppository formu-lation of CaNa2 appears to be well absorbed, deliveringhigh levels of EDTA to prostate tissue.
INTRODUCTION
Heavy metal exposures in the twenty-first century arean established global health concern. The FDA hasapproved EDTA as a chelation agent for the removal ofheavy metals. It has been placed on the FDA “GenerallyRecognized as Safe” (GRAS) list for the past sixty years.Extensive national and international clinical experiencesdemonstrate that acute and chronic human exposure to awide range of heavy metals can be treated with consider-able efficacy using EDTA. It is widely administered, withconsiderable cost to the patient, as an intravenous (IV) solu-tion, which entails 15 to 30 sessions in a physician’s office,taking two to five hours per visit. The transrectal deliveryof several pharmacological agents is well established.Therefore, using a rat animal model, we set out to deter-mine if the rectal administration of EDTA is absorbed,resulting in significant blood and tissue levels.
The pharmacodynamic effects of therapeutic agentsdiffer widely in their route of administration, penetration,absorption, and distribution in body tissues. For medicinalagents to act, they must be absorbed and transported to theappropriate tissue or organ, penetrate to the responding cellsurface or sub-cellular and interstitial space, and elicit aresponse or alter ongoing processes.1 The parenteral andintramuscular forms of EDTA are well absorbed, but notvery practical for routine usage.2 Oral forms of EDTA havebeen shown to be poorly absorbed (2% to 5%), and topicaland subcutaneous forms have been reported as not being
* Correspondence:Rita Ellithorpe, MDTustin Longevity Center13422 Newport Avenue # LTustin, CA 92780Phone: 714-544-1521 Fax: 714-544-1904E-mail: [email protected]
JANA Vol. 10, No. 2, 2007 39
absorbed at all.3,4,5,6,7,8,9,10 A relatively new alternative andmore convenient route of administration is rectal supposito-ry delivery of a proprietary suppository formula of EDTA(CaNa2 EDTA, Detoxamin,® World Health Products,Draper, Utah), which is the basis of this pharmacokinetic(PK) study. Although IV EDTA dosing is well character-ized and has been used for decades, little is known about theabsorption of rectal suppositories.
In an effort to elucidate the absorption characteristicsof CaNa2 EDTA in a suppository form, a rat model was
chosen. 14C-labeled EDTA Calcium Disodium salt wasadministered as a tracer in the suppository and in intra-venous forms; blood, urine, and selected tissue levels wereevaluated over eight hours.
MATERIALS AND METHODS14C-labeled EDTA free acid (11.7 mCi/mmol, Lot
No. 63151012, purity greater than 98%) was obtained fromMP Biomedicals (Irvine, CA). For the IV dosing solution,14C-labeled EDTA was added to normal saline to achieveconcentrations needed to deliver a final dose of 7.53 µCi inapproximately 1 gram. The rectal suppository (a propri-etary suppository formula of EDTA, CaNa2 EDTA,Detoxamin® Health Products, East Draper, Utah, LotNo. 228-190-0117) was prepared by adding 14C-labeledEDTA solution from Moravek to molten suppository. Forthe animal dose, approximately 100 µL of the mixture (con-taining 23.7 µCi per dose) was taken up in a cylindricalglass pipette equipped with a plunger and allowed to cool toroom temperature, where it re-solidified.
The radioactive concentration of the IV dosing solutionwas calculated by Liquid Scintillation Counting (LSC). Theprepared dosing solutions were stored and refrigerated.
Ten male Sprague Dawley rats were obtained fromTaconic, Oxnard, CA. Animals were 6 to 7 weeks old andweighed 157 to 187 grams on Day 1. The animal experi-ments were performed at the Biological Test Center (BTC),in Irvine, CA. Quarantine and care of animals were per-formed per BTC Standard Operating Procedures.
Prior to dosing, 10 animals were weighed. Cannulatedanimals (six animals to undergo IV dosing) were random-
ized for placement into Group A or B. Uncannulated ani-mals (four animals to undergo rectal dosing) were not ran-domized and were placed into Group C. Treatment groupsare presented below.
Animals were fasted (food withheld) for 16.5 to 19.5hours before 14C-EDTA administration. Prior to dosing, ratswere anesthetized with an intramuscular combination injec-tion of ketamine hydrochloride (40-90 mg/kg) and xylazine(5-10 mg/kg). Water and feed were withheld from animalsfor four hours after 14C-EDTA administration, and thenfood and water were given ad libitum.
For Group C, the contents of the colon were removedbefore dosing by flushing with normal saline heated to37°C. Rectal doses were administered via a 100 µL glasscylindrical tube, gently heated to allow partial liquefactionof the suppository material. Blood samples of approximate-ly 100 µL were taken. Each sample was placed in combus-tion cones and stored frozen prior to combustion and LSCanalysis. The time of blood collection was recorded.
A terminal blood sample was collected from all ani-mals via heart puncture (1 hour ± 5 minutes after dosing forGroup A animals; 8 hours ± 15 minutes after dosing forGroup B and C animals). Each animal was anesthetizedwith an intramuscular combination injection of ketaminehydrochloride (40-90 mg/kg) and xylazine (5-10 mg/kg),and euthanized by exsanguination following heart puncture.As much blood as possible was collected from each rat intoheparinized tubes. The time of blood collection was record-ed. Four 100-µL aliquots of whole blood were transferred tocombustion cones. Two of the aliquots were combusted fordetermination of radioactivity by LSC, and two were keptfrozen as reserve samples.
Absorbent paper was placed in the restrainers to collecturine 0 to 4 hours after dosing. Urine was collected from theindividual metabolism cages 4 to 8 hours after dosing. Forurine samples collected in absorbent paper, water was addedto the paper and urine extracted. For urine samples collectedfrom metabolism cages, the urine was freeze-trapped to avoidatmospheric oxidation, evaporation, and bacterial degrada-tion, and the urine collection pan was rinsed with water.
Following euthanasia by exsanguination, the brain andprostate were collected from each animal. Prior to collec-
14C-EDTA Blood Collection Time points
Group No. Treatment Dose (µCi) Route (Time After Dosing)1
A 2 14C-EDTA 10 IV 1 hour
B 4 14C-EDTA 10 IV 5, 15, 30 minutes; 1, 2, 4, 8 hours
C 32 14C-EDTA 20 Rectal 5, 15, 30 minutes; 1, 2, 4, 8 hours
1. Blood collection times were ± 1 minute for the 5-minute time point; ± 3 minutes for the 15- and 30-minute time points; ± 5 minutesfor the 1-hour time point; and ± 15 minutes for the 2-, 4-, and 8-hour time points.2. The fourth animal in group C, animal, No. 55905, was dead (attributed to anesthesia) 15 minutes after dosing.
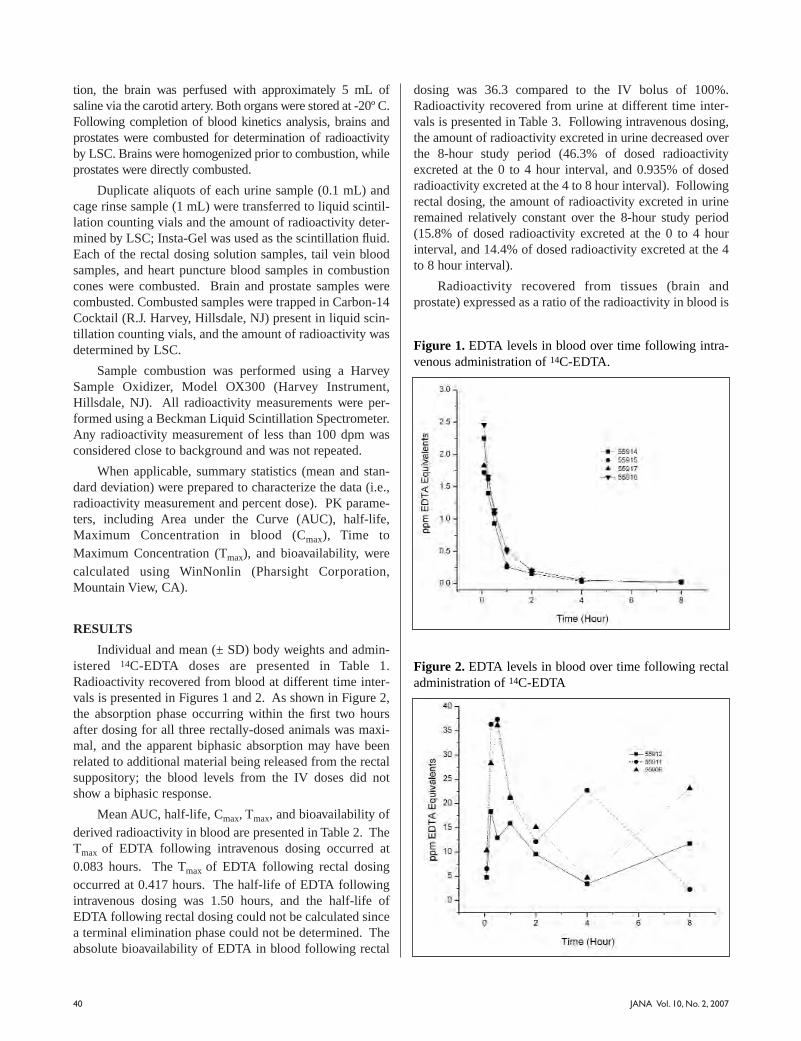
40 JANA Vol. 10, No. 2, 2007
tion, the brain was perfused with approximately 5 mL ofsaline via the carotid artery. Both organs were stored at -20º C.Following completion of blood kinetics analysis, brains andprostates were combusted for determination of radioactivityby LSC. Brains were homogenized prior to combustion, whileprostates were directly combusted.
Duplicate aliquots of each urine sample (0.1 mL) andcage rinse sample (1 mL) were transferred to liquid scintil-lation counting vials and the amount of radioactivity deter-mined by LSC; Insta-Gel was used as the scintillation fluid.Each of the rectal dosing solution samples, tail vein bloodsamples, and heart puncture blood samples in combustioncones were combusted. Brain and prostate samples werecombusted. Combusted samples were trapped in Carbon-14Cocktail (R.J. Harvey, Hillsdale, NJ) present in liquid scin-tillation counting vials, and the amount of radioactivity wasdetermined by LSC.
Sample combustion was performed using a HarveySample Oxidizer, Model OX300 (Harvey Instrument,Hillsdale, NJ). All radioactivity measurements were per-formed using a Beckman Liquid Scintillation Spectrometer.Any radioactivity measurement of less than 100 dpm wasconsidered close to background and was not repeated.
When applicable, summary statistics (mean and stan-dard deviation) were prepared to characterize the data (i.e.,radioactivity measurement and percent dose). PK parame-ters, including Area under the Curve (AUC), half-life,Maximum Concentration in blood (Cmax), Time toMaximum Concentration (Tmax), and bioavailability, werecalculated using WinNonlin (Pharsight Corporation,Mountain View, CA).
RESULTS
Individual and mean (± SD) body weights and admin-istered 14C-EDTA doses are presented in Table 1.Radioactivity recovered from blood at different time inter-vals is presented in Figures 1 and 2. As shown in Figure 2,the absorption phase occurring within the first two hoursafter dosing for all three rectally-dosed animals was maxi-mal, and the apparent biphasic absorption may have beenrelated to additional material being released from the rectalsuppository; the blood levels from the IV doses did notshow a biphasic response.
Mean AUC, half-life, Cmax, Tmax, and bioavailability ofderived radioactivity in blood are presented in Table 2. TheTmax of EDTA following intravenous dosing occurred at0.083 hours. The Tmax of EDTA following rectal dosingoccurred at 0.417 hours. The half-life of EDTA followingintravenous dosing was 1.50 hours, and the half-life ofEDTA following rectal dosing could not be calculated sincea terminal elimination phase could not be determined. Theabsolute bioavailability of EDTA in blood following rectal
dosing was 36.3 compared to the IV bolus of 100%.Radioactivity recovered from urine at different time inter-vals is presented in Table 3. Following intravenous dosing,the amount of radioactivity excreted in urine decreased overthe 8-hour study period (46.3% of dosed radioactivityexcreted at the 0 to 4 hour interval, and 0.935% of dosedradioactivity excreted at the 4 to 8 hour interval). Followingrectal dosing, the amount of radioactivity excreted in urineremained relatively constant over the 8-hour study period(15.8% of dosed radioactivity excreted at the 0 to 4 hourinterval, and 14.4% of dosed radioactivity excreted at the 4to 8 hour interval).
Radioactivity recovered from tissues (brain andprostate) expressed as a ratio of the radioactivity in blood is
Figure 1. EDTA levels in blood over time following intra-venous administration of 14C-EDTA.
Figure 2. EDTA levels in blood over time following rectaladministration of 14C-EDTA

41JANA Vol. 10, No. 2, 2007
Animal Body Dosage Dose Total TotalGroup Number Weight (kg) Weight (g) (mg/kg) Dose (µCi) Dose (dpm)
A 55921 0.187 1.0019 1.31 7.64 16,954,958
A 55920 0.184 0.9906 1.31 7.55 16,763,730 Mean: 0.186 1.31 7.59 16,859,344
± SD: 0.002 0.00 0.06 135,218
B 55918 0.166 0.9899 1.45 7.55 16,751,884
B 55915 0.175 0.9776 1.36 7.45 16,543,734
B 55917 0.177 0.9718 1.34 7.41 16,445,582
B 55914 0.183 0.9804 1.31 7.47 16,591,118 Mean: 0.175 1.37 7.47 16,583,079
± SD: 0.007 0.06 0.06 127,819
C 55912 0.167 0.1100 214.4 24.6 54,534,057
C 55911 0.157 0.0970 201.1 21.7 48,089,123
C 55906 0.162 0.1120 225.0 25.0 55,525,585 Mean: 0.162 213.5 23.7 52,716,255
± SD: 0.005 12.0 1.8 4,037,765
Table 1. Body Weights and Administered 14C-EDTA Doses
Dose AUC AUC Half-life Cmax Tmax AbsoluteGroup Route Stat. (mg/kg) (µg x Hr/mL) Inf (Hour) (µg/mL) (Hour) Bioavailability (%)
(µg x Hr/mL)
B Intravenous MEAN 1.37 1.86 1.91 1.50 2.07 0.083 N/A
SD 0.06 0.20 0.19 0.34 0.35 0.000
N 4 4 4 4 4 4
C Rectal MEAN 213.5 105.8 307.3 N/A1 30.6 0.417 36.3
SD 12.0 32.2 225.6 N/A1 10.6 0.144
N 3 3 3 3 3 3
Table 2. Mean AUC, half-life, Cmax, Tmax, and bioavailability of EDTA in blood following intravenous or rectal adminis-tration of 14C-EDTA
N/A = not applicableAbsolute bioavailability (%) =
(AUCtest x Dose ref)
(AUCref x Dose test ) x 100
Where “test” data is the rectal data, and “ref ” (reference) data is the intravenous data.
1. The terminal elimination phase was not observed, therefore, the half-life could not be calculated.
References for the above formula are as follows:1) Kwon Y. Handbook of Essential Pharmacokinetics, Pharmacodynamics, and Drug Metabolism for Industrial Scientists.
New York: Kluwer Academic/Plenum Publishers, 2001.2) Shargel L, Yu A. Applied Biopharmaceutics and Pharmacokinetics, 4th ed. Norwalk, Connecticut: Appleton & Lange, 1999
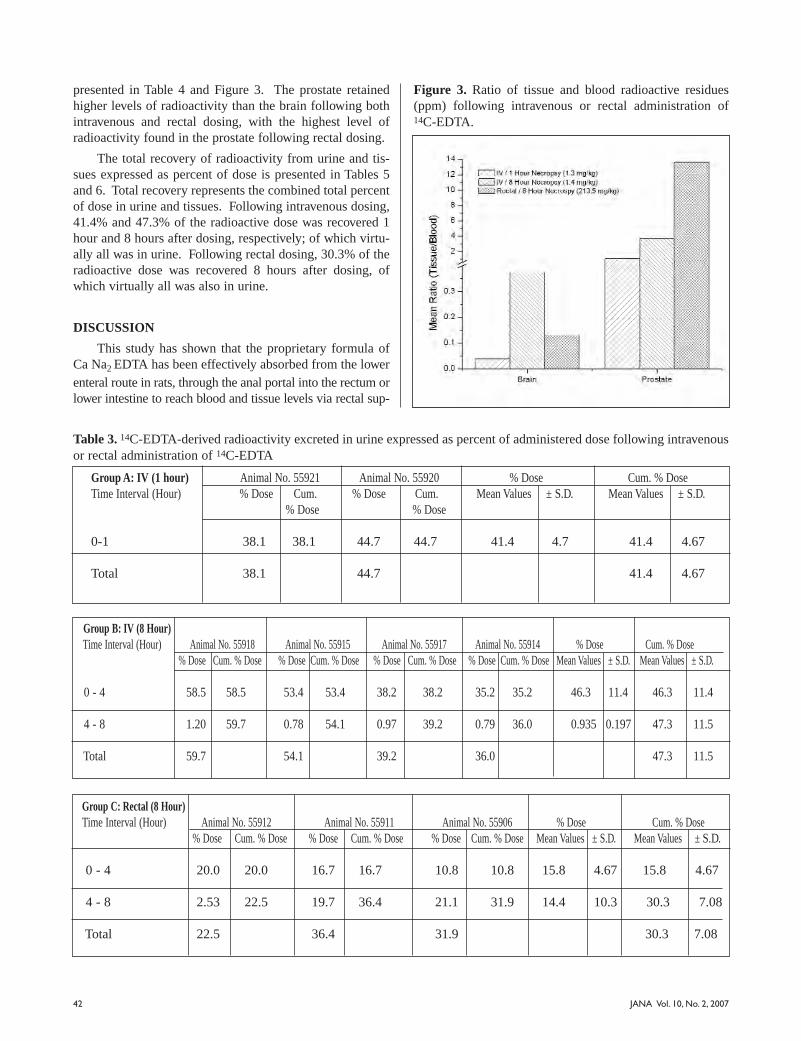
42 JANA Vol. 10, No. 2, 2007
presented in Table 4 and Figure 3. The prostate retainedhigher levels of radioactivity than the brain following bothintravenous and rectal dosing, with the highest level ofradioactivity found in the prostate following rectal dosing.
The total recovery of radioactivity from urine and tis-sues expressed as percent of dose is presented in Tables 5and 6. Total recovery represents the combined total percentof dose in urine and tissues. Following intravenous dosing,41.4% and 47.3% of the radioactive dose was recovered 1hour and 8 hours after dosing, respectively; of which virtu-ally all was in urine. Following rectal dosing, 30.3% of theradioactive dose was recovered 8 hours after dosing, ofwhich virtually all was also in urine.
DISCUSSION
This study has shown that the proprietary formula ofCa Na2 EDTA has been effectively absorbed from the lowerenteral route in rats, through the anal portal into the rectum orlower intestine to reach blood and tissue levels via rectal sup-
Group C: Rectal (8 Hour)Time Interval (Hour) Animal No. 55912 Animal No. 55911 Animal No. 55906 % Dose Cum. % Dose
% Dose Cum. % Dose % Dose Cum. % Dose % Dose Cum. % Dose Mean Values ± S.D. Mean Values ± S.D.
0 - 4 20.0 20.0 16.7 16.7 10.8 10.8 15.8 4.67 15.8 4.67
4 - 8 2.53 22.5 19.7 36.4 21.1 31.9 14.4 10.3 30.3 7.08
Total 22.5 36.4 31.9 30.3 7.08
Table 3. 14C-EDTA-derived radioactivity excreted in urine expressed as percent of administered dose following intravenousor rectal administration of 14C-EDTA
Group A: IV (1 hour) Animal No. 55921 Animal No. 55920 % Dose Cum. % DoseTime Interval (Hour) % Dose Cum. % Dose Cum. Mean Values ± S.D. Mean Values ± S.D.
% Dose % Dose
0-1 38.1 38.1 44.7 44.7 41.4 4.7 41.4 4.67
Total 38.1 44.7 41.4 4.67
Group B: IV (8 Hour)Time Interval (Hour) Animal No. 55918 Animal No. 55915 Animal No. 55917 Animal No. 55914 % Dose Cum. % Dose
% Dose Cum. % Dose % Dose Cum. % Dose % Dose Cum. % Dose % Dose Cum. % Dose Mean Values ± S.D. Mean Values ± S.D.
0 - 4 58.5 58.5 53.4 53.4 38.2 38.2 35.2 35.2 46.3 11.4 46.3 11.4
4 - 8 1.20 59.7 0.78 54.1 0.97 39.2 0.79 36.0 0.935 0.197 47.3 11.5
Total 59.7 54.1 39.2 36.0 47.3 11.5
Figure 3. Ratio of tissue and blood radioactive residues(ppm) following intravenous or rectal administration of14C-EDTA.

JANA Vol. 10, No. 2, 2007 43
positories. Bioavailability has now been established for thismode of administration in an animal model and is strong evi-dence that EDTA suppositories are an adequate and medical-ly acceptable approach to providing the benefits of chelation.
Intravenous dosing resulted in greater elimination ofradioactivity in urine at the 0 to 4 hour time point, but thepercent of dose recovered drastically decreased by the 4 to8 hour time point, while the level of recovery was relative-ly steady at both time points following rectal dosing. Theslow and consistent movement of CaNa2 EDTA via rectaladministration may have lesser toxicity since there are sig-nificant blood and tissue levels to chelate metals without ahigh dose EDTA IV drip over many hours. These data pointto the ability of rectal suppositories to deliver a continuouslower dose concentration of EDTA for longer periods oftime compared with IV administration, allowing EDTA tobind metals efficiently and effectively.
In tissues, significant amounts of radioactivity wererecovered from the prostate following intravenous or rectaldosing, with the highest level of dosed radioactivity (179.6ppm) recovered 8 hours following rectal dosing. Thisobservation of rectal administration, revealing higheramounts of EDTA in prostate tissue as compared to IV, canhave far-reaching implications of a more complete distribu-tion of EDTA into interstitial and intracellular spaces, fur-ther leading to more efficient chelation of compartmental-
ized heavy metal content with CaNa2 suppositories.
EDTA is not bio-transformed in the body. It is excret-ed in hair, urine, feces, saliva, and perspiration. This studyshows that animals excreted 47.3% and 30.3% of dosedradioactivity in urine during the 8 hours following intra-venous and rectal dosing, respectively. The 30.3% excretionof EDTA in the urine corresponds closely to the rectal dosebioavailability calculated from the blood levels (36.3%).
Blood samples were taken over an 8-hour period, andduring this time, the rectal administration showed high lev-els of absorbed ETDA with no apparent elimination phaseobserved. If further blood samples had been taken, thebioavailability calculated for rectally administered EDTAwould have undoubtedly been much higher, since thebioavailability calculation presented here only used up to 8-hour blood level data. No extrapolation of the AUC couldbe done since the levels at 8 hours were actually increasingin two out of three animals. Further research is indicatedover a longer time span to quantify the actual half life of thesuppository form of administration.
CONCLUSIONS
This proprietary suppository formulation appears to bea viable dosing mechanism for delivery of CaNa2 EDTA to
the bloodstream in this rat model, showing substantial cir-culating levels of EDTA for least 8 hours after administra-
Group A: IV (1 Hour) Ratio of Radioactive Residues of EDTA
Sample Animal No: 55921 Animal No: 55920 Mean Values ± SD
Brain 0.039 0.039 0.039 0.000
Prostate 1.80 0.357 1.08 1.02
Table 4. Ratio of radioactive residues of EDTA in tissues (µg/g) to blood (µg/g) following intravenous or rectal administra-tion of 14C-EDTA
Group B: IV (8 Hour) Ratio of Radioactive Residues of EDTA
Sample Animal No: 55918 Animal No: 55917 Animal No: 55915 Animal No: 55914 Mean Values ± SD
Brain 0.345 0.318 0.487 0.351 0.375 0.076
Prostate 6.70 2.01 3.07 2.98 3.69 2.06
Group C: Rectal (8 Hour) Ratio of Radioactive Residues of EDTA
Sample Animal No: 55912 Animal No: 55911 Animal No: 55906 Mean Values ± SD
Brain 0.050 0.288 0.056 0.132 0.135
Prostate 8.90 14.4 17.4 13.6 4.31
Note: Brain was perfused with normal saline prior to collection.
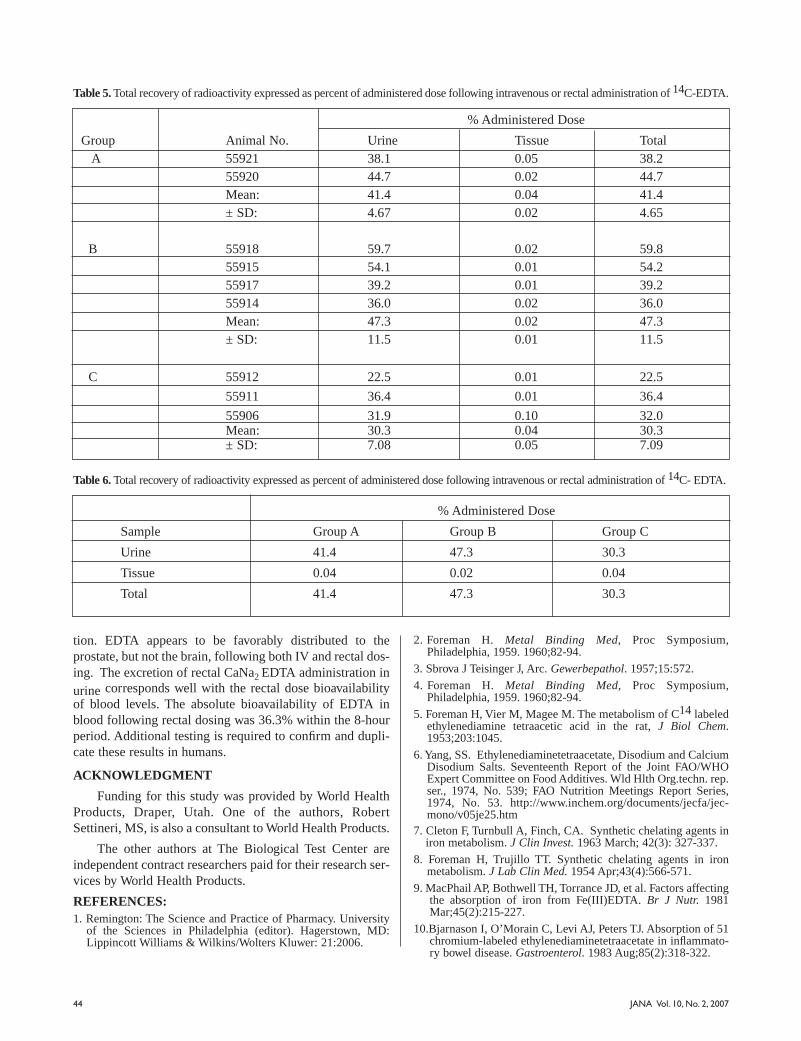
JANA Vol. 10, No. 2, 200744
tion. EDTA appears to be favorably distributed to theprostate, but not the brain, following both IV and rectal dos-ing. The excretion of rectal CaNa2 EDTA administration in
urine corresponds well with the rectal dose bioavailabilityof blood levels. The absolute bioavailability of EDTA inblood following rectal dosing was 36.3% within the 8-hourperiod. Additional testing is required to confirm and dupli-cate these results in humans.
ACKNOWLEDGMENT
Funding for this study was provided by World HealthProducts, Draper, Utah. One of the authors, RobertSettineri, MS, is also a consultant to World Health Products.
The other authors at The Biological Test Center areindependent contract researchers paid for their research ser-vices by World Health Products.
REFERENCES:1. Remington: The Science and Practice of Pharmacy. University
of the Sciences in Philadelphia (editor). Hagerstown, MD:Lippincott Williams & Wilkins/Wolters Kluwer: 21:2006.
2. Foreman H. Metal Binding Med, Proc Symposium,Philadelphia, 1959. 1960;82-94.
3. Sbrova J Teisinger J, Arc. Gewerbepathol. 1957;15:572.
4. Foreman H. Metal Binding Med, Proc Symposium,Philadelphia, 1959. 1960;82-94.
5. Foreman H, Vier M, Magee M. The metabolism of C14 labeledethylenediamine tetraacetic acid in the rat, J Biol Chem.1953;203:1045.
6. Yang, SS. Ethylenediaminetetraacetate, Disodium and CalciumDisodium Salts. Seventeenth Report of the Joint FAO/WHOExpert Committee on Food Additives. Wld Hlth Org.techn. rep.ser., 1974, No. 539; FAO Nutrition Meetings Report Series,1974, No. 53. http://www.inchem.org/documents/jecfa/jec-mono/v05je25.htm
7. Cleton F, Turnbull A, Finch, CA. Synthetic chelating agents iniron metabolism. J Clin Invest. 1963 March; 42(3): 327-337.
8. Foreman H, Trujillo TT. Synthetic chelating agents in ironmetabolism. J Lab Clin Med. 1954 Apr;43(4):566-571.
9. MacPhail AP, Bothwell TH, Torrance JD, et al. Factors affectingthe absorption of iron from Fe(III)EDTA. Br J Nutr. 1981Mar;45(2):215-227.
10.Bjarnason I, O’Morain C, Levi AJ, Peters TJ. Absorption of 51chromium-labeled ethylenediaminetetraacetate in inflammato-ry bowel disease. Gastroenterol. 1983 Aug;85(2):318-322.
% Administered Dose
Group Animal No. Urine Tissue Total A 55921 38.1 0.05 38.2
55920 44.7 0.02 44.7 Mean: 41.4 0.04 41.4 ± SD: 4.67 0.02 4.65
B 55918 59.7 0.02 59.8 55915 54.1 0.01 54.2 55917 39.2 0.01 39.2 55914 36.0 0.02 36.0 Mean: 47.3 0.02 47.3 ± SD: 11.5 0.01 11.5
C 55912 22.5 0.01 22.5
55911 36.4 0.01 36.4
55906 31.9 0.10 32.0 Mean: 30.3 0.04 30.3 ± SD: 7.08 0.05 7.09
Table 5. Total recovery of radioactivity expressed as percent of administered dose following intravenous or rectal administration of 14C-EDTA.
% Administered Dose
Sample Group A Group B Group C
Urine 41.4 47.3 30.3
Tissue 0.04 0.02 0.04
Total 41.4 47.3 30.3
Table 6. Total recovery of radioactivity expressed as percent of administered dose following intravenous or rectal administration of 14C- EDTA.
www.tishcon.comOnly nature has had more experience with vitamins.
Manufacturers of Soft Elastic Gelatin Capsules
New York Office: 30 New York Ave., Westbury, NY 11590Phone: (516) 333-3050, Fax: (516) 997-1052
Maryland Plant: 2410 North Zion Rd., Salisbury, MD 21801Phone: (410) 860-0046, Fax: (410) 860-0324
Now with UNLIMITED FREE ACCESS
Finding FREE Current Research in Nutrition and Integrative Medicine Has just Gotten a LOT Easier!
www.Vitasearch.com
It’s“USP Verified”*
*USP has tested and verified ingredients, product, and manufacturing process. USP sets official standards for dietary supplements. See www.uspverified.org.
U.S. Patent No. 6,056,971Other U.S. and International
Patents Pending
Enhanced Bioavailabilitywww.COQ.com
Q-Gel® - The Quintessential™ Coenzyme Q10
AVAILABLE IN 15 mg, 30 mg, 60 mg & 100 mg SOFTGELS!ALSO AVAILABLE IN VEGE-CAPS, CHEWTABS, DROPS & AS A SYRUP!
Q-Gel® products and their combinations with L-Carnitine, Vitamin E, Alpha Lipoic Acid, Omega-3 Fatty Acids may also be covered by the following U.S. Patents (U.S. Patent Nos. 4,654,373, 4,602,039, 6,300,377, 6,056,971, 6,441,050, 5,952,379 and 6,441,039). These statements have not been evaluated by the Food and Drug Administration. This product is not intended to diagnose, treat, cure or prevent disease.
©2004 Copyright Tishcon Corporation. All Rights Reserved. Q-Gel® is a registered trademark of Tishcon Corp. Hydrosoluble™, Liposoluble™ and Quintessential™, Vitasearch and Vitagram are trademarks of Tishcon Corp.
®
Clinical Pearls Data Base
❖ Weekly Research Updates (Clinical Pearls)
❖ Expert Interviews (New Interviews Added Every Week)
❖ Coenzyme Q10 Research (Updated Regularly)
❖ healthnotes® and More
Sign up forVITAGRAM™ — Our Weekly e-mail Newsletter
Brought to you by
LIPOSOLUBLE™
HYDROSOLUBLE™


![4LIFE PRODUCT CATALOG · 1/4/2018 · CERTIFIED, CONCENTRATED 4LIFE TRANSFER FACTOR® [6] 4LIFE PRODUCT CATALOG U.S. VERSIONCOUNT ON OUR QUALITY 4Life® pledges to uphold the highest](https://img.pdfslide.us/doc/110x75/600bee642f35a06aaa4f2f31/4life-product-142018-certified-concentrated-4life-transfer-factor-6-4life.jpg)