Embed Size (px)
Citation preview
A PAY-FOR-PERFORMANCE INNOVATIONINTEGRATING THE QUANTITY AND QUALITYOF CARE IN MATERNAL, NEWBORN ANDCHILD HEALTH SERVICES IN BANGLADESH
P4P FINAL REPORT
TECHNICALREPORT

Cover photos by. Rinat Akter and Kaji Tamanna Keya, Population Council, Bangladesh.
P4P Final Report
A PAY-FOR-PERFORMANCE INNOVATION INTEGRATING THE QUANTITY AND QUALITY OF CARE IN MATERNAL, NEWBORN AND CHILD HEALTH SERVICES IN BANGLADESH
P4P FINAL REPORT
Laila Rahman1, Ubaidur Rob1, Riad Mahmud2, Azizul Alim3 Ismat Ara Hena1, Md. Noorunnabi Talukder1 and Hafizur Rahman1
1 Population Council, Bangladesh 2 United Nations Children’s Fund, Bangladesh 3 Directorate General of Health Services Ministry of Health and Family Welfare, Government of Bangladesh
Funding. United Nations Children’s Fund (UNICEF) funded the P4P project under the project cooperative agreement number UNICEF/PCA/2010/004, with funding from the Australian Agency for International Aid (AusAID), Canadian International Development Agency (CIDA), the United Kingdom's Department for International Development (DfID), and European Union (EU). The views expressed herein are those of the authors, and do not necessarily reflect the views of the Government of Bangladesh, Population Council, UNICEF, AusAID, CIDA, the United Kingdom’s DfID, and EU.
P4P Final Report ii
The Population Council confronts critical health and development issues—from stopping the spread of HIV to improving reproductive health and ensuring that young people lead full and productive lives. Through biomedical, social science, and public health research in 50 countries, we work with our partners to deliver solutions that lead to more effective policies, programs, and technologies that improve lives around the world. Established in 1952 and headquartered in New York, the Council is a nongovernmental, nonprofit organization governed by an international board of trustees. PPopulation Council Bangladesh Office House CES (B) 21, Road No. 118, Gulshan, Dhaka 1212, Bangladesh email: [email protected]
www.popcouncil.org
The United Nations Children’s Fund (UNICEF) is the world’s leading organization focusing on children and child rights. Established in 1946, UNICEF is active in 190 countries and territories through country programmes and National Committees. Headquartered in New York, UNICEF upholds the Convention on the Rights of the Child, and works to assure equality for those who are discriminated against, girls and women in particular. UNICEF works for the Millennium Development Goals and for the progress promised in the United Nations Charter. Striving for peace and security, UNICEF works to hold everyone accountable to the promises made for children.
UNICEF BangladeshBSL Office Complex 1 Minto Road, Ramna, Dhaka 1000, Bangladesh email: [email protected]
www.unicef.org.bd Suggested citation: Laila Rahman, Ubaidur Rob, Riad Mahmud, Azizul Alim, Ismat Ara Hena, Md. Noorunnabi Talukder, and Hafizur Rahman. 2011. “A pay-for-performance innovation integrating the quantity and quality of care in maternal, newborn and child health services in Bangladesh: P4P Final Report.” Dhaka: Population Council.
Permission for reprint. Any part of this publication may be photocopied without permission from the publisher provided that copies are distributed without charge and that full source citation is provided. The Population Council would appreciate receiving a copy of any materials in which the text is used. Project website. http://www.popcouncil.org/projects/311_P4PORStudy.asp © 2011. The Population Council, Inc.
P4P Final Report iii
SUMMARY IINTRODUCTION
In spite of a commendable 40 percent reduction in the maternal mortality ratio over the last decade to 194 per 100,000 live births in 2010, improving maternal, newborn and child health (MNCH) care remains a key development priority given the high inequality that persists between the richest and the poorest quintiles in Bangladesh. The service delivery systems are met with both supply and demand side barriers. Recent consensus aims to reduce these barriers to improve basic and emergency obstetric care, institutional delivery, skilled birth attendance, and family planning services. To reduce both demand- and supply-side barriers, a demand-side financing (DSF) scheme was introduced in 2006, which is a combination of supply-side incentives for providers and demand-side cash transfers for clients. Although the DSF scheme increased the volume of services provided, the quality of care was not addressed; also it promoted performance of individual providers instead of that of the facility. In this context, the Population Council explored the possibilities of introducing a Pay-for-Performance (P4P) scheme to improve maternal health care services by using a consultative process. Based on the consultation and in guidance of the Government of Bangladesh, the Council and UNICEF provided technical assistance to the Directorate General of Health Services (DGHS) to test the P4P strategies for MNCH service providers to improve service volume and quality of care, and for the poor clients to receive services subsidized through vouchers or coupons. Using a pre-test post-test separate sample quasi-experimental design, the study tests two strategies. The first strategy is a combination of pay-for-performance for providers and subsidized coupons for poor pregnant women, newborns, and under-five children, while the second strategy employs only the pay-for-performance incentives for the providers.
OBJECTIVES
The objective of the study is to test and compare the two service delivery models on utilization of MNCH services to improve maternal, newborn and under-five children’s health. The specific objectives are to (i) test the feasibility of implementing performance incentives for providers; and (ii) evaluate whether payment for providers, with or without subsidized financing for clients, results in increased utilization of antenatal care, postnatal care, institutional deliveries, and family planning counseling.
DURATION
The project was initiated in mid-February 2010 and ended in December 2011. The intervention period was from October 2010 to November 2011.
STUDY SITES
Twelve public-sector health facilities in Jamalpur, Gaibandha and Kurigram districts are the intervention sites and three facilities of Thakurgaon district comprise the comparison sites. The DGHS selected these four districts out of its eight maternal and newborn health (MNH) and MNCH project districts as of 2010.
P4P Final Report iv
AACTIVITIES
The ppreparatory activities included development of guidelines and manuals, and the formation of P4P Committees, Quality Assurance Groups (QAGs), Quality Assurance Teams (QATs), fund operations teams and the MNCH service providers’ teams. A quality assurance system was developed allowing providers to receive incentives based on facilities’ achievement of targets of volume and quality of care of emergency obstetric and newborn care (EmONC) services (Figure 3). A coupon mechanism was developed to provide incentives to the poor clients to receive EmONC services (Figure 4). A financial mechanism was established through signing contracts between the facilities and the Council. In the communities, the fieldworkers and volunteers were trained, and 15,696 eligible women were identified using a community level validation process. Of them, 90 percent received coupons and about half received MNCH services from the designated facilities. Coupon utilization was the highest for antenatal care services followed by delivery, postnatal complications and delivery complications management. The referral mechanism was strengthened and all the stakeholders received orientation.
Intervention activities included the QAG visits every quarter while the facilities provided improved MNCH care and the P4P Committees and QATs carried out monitoring activities. When facilities received a positive recommendation upon meeting its targets, they provided incentives to the MNCH teams. In Gaibandha and Kurigram districts, financial assistance in the form of coupon was provided to poor clients to cover transportation, medicine and incidental costs.
The evaluation activities used a separate sample quasi-experimental pre-post test design and collected: baseline and endline survey data from 473 providers (Baseline 272; Endline 201) from 15 facilities; monthly service statistics from the 15 facilities over 26 months (pre-intervention- 12 months, during intervention- 14 months); quality of care measurements at the 12 intervention facilities over 6 quarters; client exit interviews with 2,124 clients at the 15 facilities during the intervention period; and in-depth interviews with 270 clients at the 15 facilities during the intervention period.
RESULTS
Feasibility of implementing performance incentives for providers and clients is measured in terms of operationalization of the incentive schemes, increased volume of services and improvement in quality of care of the MNCH services at the intervention facilities. Comparison across strategies and comparison sites indicates that payment for providers, with or without financing for clients, results in increased utilization of MNCH services.
Change in service volume. The increase in service volume was significantly higher at the intervention facilities relative to comparison facilities in terms of institutional delivery (Table A.1 and Figure 8). Institutional deliveries increased by 114 and 32 percent in facilities under strategies I and II, respectively, relative to the comparison facilities. Strategy I facilities registered higher increases than strategy II facilities. Antenatal and postnatal care services increased significantly in strategy I sites relative to comparison sites, but performance in these sites varied significantly during the baseline survey; therefore, the differences cannot be attributed to the intervention activities alone.
Change in quality of care. The intervention facilities significantly increased quality of care of MNCH services measured on a 100 point scale (Figure 9). The change was most striking in strategy I (50 percent) than the strategy II site facilities (28 percent). Some of the important changes include: introducing antenatal and postnatal care corners, breastfeeding corners, and post-operative rooms;
P4P Final Report v
installing a washroom adjacent to the labor room; and separating the sick newborn care unit within the pediatric ward of the District Hospital. The facilities managed to increase labor room readiness and made sitting arrangements for attendants.
CClient satisfaction. The overall client satisfaction score was highest in strategy I sites relative to both the strategy II and comparison sites after adjusting for age, years of education, husband’s education, total number of children and religion (Table 8). Both strategy II and the comparison sites performed better in terms of providers’ behavior relative to strategy I sites (Table 9). Client satisfaction was significantly higher at the strategy I relative to strategy II sites for the medicines being free of cost and not requiring extra monetary payment.
Provider satisfaction. The provider survey indicated that the group work has become more structured in complying with guidelines-- strategy I and II site facilities are two and six times, respectively, more likely to follow structured guidelines relative to the comparison site facilities controlling for the baseline performance. Providers reported higher rate of reception of the supervisory feedback and recognition, which were attenuated after adjusting for the baseline performances (Table A.2).
COST OF MATERNAL HEALTH SERVICES
Cost per maternal health service unit including antenatal care, institutional delivery and postnatal care services is US$ 8 for strategy I and II sites (Table 11). The total incentive cost per unit of maternal health service unit is lower at the strategy II sites relative to the strategy I sites ($7 versus $9) because of higher number of service units delivered at strategy II relative to strategy I facilities while strategy I facilities incurred costs for coupons to the poor clients.
DISSEMINATION
A two-day national level dissemination workshop was organized in December 2011 with the Senior Secretary, MoHFW as the Chief Guest. The Secretary underscored the role of the P4P models for incorporating the quality of care in incentive payments, and incorporation of the institution-based incentives to enhance facility rather than individual performance. He put emphasis on examining both the DSF and P4P models to better address the MDGs 4 and 5. The participants of the workshop put forth suggestions for modification of the two models.
CHALLENGES
The prerequisites for initiating a P4P approach for providers with a team approach include placement of key human resources and equipping the facilities with equipment and supplies. These prerequisites were not entirely met. The weak management information system (MIS) remained a challenge for establishing the benchmark level and tracking performance. A simple form was developed to ensure proper recording of the key services at both the intervention and comparison sites. Obstetrics, newborn and under-five child complications management service volumes could not be incentivized on ethical ground although service statistics were monitored, and quality of care in complications management was incentivized through incorporating indicators in the quality assessment tool. The team dynamics played a key role in facility performance with a few providers taking incentives for granted. Measurement of the quality of care of MNCH services underwent several revisions to reflect the needs of the facilities. The instrument is appreciated for being detailed, but also faced criticism for featuring a long checklist requiring 4 hours to administer. The
P4P Final Report vi
QAG members decided to divide themselves into two groups to measure the performance of their respective units simultaneously. Establishing the financial mechanism to track each payment involved multiple providers and clients and keeping vouchers for each transaction remained challenging. The competency of the financial operations team was enhanced through an interactive workshop, supportive follow-up and on-the-job training.
LLESSONS LEARNED
Facilities with sub-optimal performance tend to respond to the performance targets in terms of increasing quantity and quality of MNCH care if it is tied with incentives, in spite of the human resource and other constraints. However, certain level of infrastructure is pivotal to ensure quality of care related with offering privacy to the clients. Accountability of the managers and providers can be increased through administration of the QAG and QAT tools. The visual tool administered by the QATs improves the internal monitoring system. The QAG tool empowers the external experts to measure performance and provide constructive feedback. Sharing the tools across all the actors is the key to success. Setting institutional targets based on the past performance and providing group incentives can increase the cost of delivery per facility if the facilities have, historically, been performing at a very low level. In such case, facilities can be enrolled only after achieving a threshold level of performance targets in order to minimize the cost of incentive per institutional delivery. Using results from the validation for performance measurement is likely to improve providers’ attitude towards clients and increase their level of satisfaction. Pre-existing conditions are to be addressed through behavior change communication activities to mitigate the demand-side barriers. In order to increase utilization, coupon promotion and payment of transportation costs in actual are important. Lastly, 14-month intervention period is inadequate to bring changes at the outcome level.
NEXT STEPS
The P4P models offering incentives to the providers, with or without the demand-side financing, hold great potential to enable the health facilities to provide better quality of care in MNCH services bringing greater accountability and transparency into the health system. Therefore, these strategies should be pursued through the health financing schemes being implemented in Bangladesh. Given that both strategies performed well relative to the comparison sites, it is recommended that strategy II (incentives for providers alone) be introduced in the low performing and poorer regions, while the poorest areas with greater geographical access limitations would benefit from a combination of a demand plus supply side P4P approach. However, expansion should be preceded with another study documenting the changes at the population level outcomes. The DSF scheme should consider incorporating the quality of care mechanism, group-based incentive payments to the providers based on institutional performance, and introduction of vouchers for newborn and under-five children’s care.
P4P Final Report vii
TABLE OF CONTENTS
Summary ..................................................................................................................................................... iii Table of Contents ....................................................................................................................................... vii List of Tables ............................................................................................................................................. viii List of Figures .............................................................................................................................................. ix Abbreviations ............................................................................................................................................... x Acknowledgments ...................................................................................................................................... xii Introduction .................................................................................................................................................. 1 Context .......................................................................................................................................................... 1 Objectives ..................................................................................................................................................... 4 Study Design ................................................................................................................................................ 5 Activities........................................................................................................................................................ 7 Results ....................................................................................................................................................... 24 Dissemination ........................................................................................................................................... 35 Challenges ................................................................................................................................................. 36 Lessons Learned ....................................................................................................................................... 37 Next Steps ................................................................................................................................................. 38 References ................................................................................................................................................ 40 Appendix .................................................................................................................................................... 41
P4P Final Report viii
LIST OF TABLES Table 1. Selected facilities under the P4P project according to study arms 6
Table 2. List of Quality Assurance Teams across type of facilities 13
Table 3. Identification, selection and card distribution among the poor pregnant women 16
Table 4. Service recipients using coupon cards by type of services under the strategy I 17
Table 5. Characteristics of the interviewed providers across strategies and over time 22
Table 6. Characteristics of client exit interview respondents across arms 23
Table 7. Characteristics of in-depth interview respondents across arms 24
Table 8. Mean and mean difference on client satisfaction with MNCH services across arms 29
Table 9. Component of satisfaction with MNCH services across arms 30
Table 10. Advantages and challenges faced in the facilities, as reported by in-depth interview respondents across arms (in percent)
31
Table 11. Incentive costs per maternal health service unit per quarter by intervention study arms
34
Table A.1. Maternal health service volume across arms and over time 41
Table A.2. Providers’ supervision and receiving of feedback and recognition across arms and over time
42
Table A.3. Average quarterly services on pregnant women, newborn and under-five complications management across arms and over time
43
P4P Final Report ix
LIST OF FIGURES Figure 1. P4P study design 5
Figure 2. Study sites according to strategies 6
Figure 3. Incentive payment mechanism for the facility-based providers under the P4P scheme
8
Figure 4. Incentive payment mechanism for the coupon clients under the P4P scheme 9
Figure 5. Brochures on the P4P project, MNCH referrals and coupon mechanism 11
Figure 6. Remote unions of Nageswari Upazila Health Complex of Kurigram district 18
Figure 7. Distribution of liquidated expenses according to the head of expenditure across strategies
20
Figure 8. Percentage changes in maternal health service volumes over time across the three sites
25
Figure 9. The change in overall quality of care score, and percent changes in the score related to MNCH services across districts and strategies over time
26
Figure 10. The change in overall quality of care score related to MNCH services over time
27
Figure 11. The change in the incentive level achievement across strategies over time 28
Figure 12. Adhering to the group work guidelines in the facilities across strategies over time (in percent)
33
P4P Final Report x
ABBREVIATIONS ANC Antenatal care
AusAID Australian Agency for International Development
BCC Behavior Change Communication
BDHS Bangladesh Demographic and Health Survey
BEmONC Basic Emergency Obstetric and Newborn Care
CEmONC Comprehensive Emergency Obstetric and Newborn Care
CIDA Canadian International Development Agency
Council Population Council, Bangladesh
DfID Department for International Development
DGFP Directorate General of Family Planning
DGHS Directorate General of Health Services
DH District Hospital
DSF Demand-side Financing
EmONC Emergency Obstetric and Newborn Care
EU European Union
FP Family Planning
FWV Family Welfare Visitor
GoB Government of Bangladesh
HPNSDP Health Population and Nutrition Sector Development Program
IMR Infant Mortality Rate
MCH-FP Maternal and Child Health-Family Planning
MDG Millennium Development Goal
MIS Management Information System
MMR Maternal Mortality Ratio
MNCH Maternal, Newborn and Child Health
MNH Maternal and Newborn Health
MoHFW Ministry of Health and Family Welfare
NGO Non-governmental Organization
NIPORT National Institute of Population Research and Training
OGSB Obstetrical and Gynaecological Society of Bangladesh
P4P Pay-for-Performance
PNC Postnatal Care
P4P Final Report xi
QAG Quality Assurance Group
QAT Quality Assurance Team
QoC Quality of Care
SBA Skilled Birth Attendant
SPSS Statistical Package for Social Science
UHC Upazila Health Complex
UK United Kingdom
UN United Nations
UNFPA United Nations Population Fund
UNICEF United Nations Children’s Fund
USA United States of America
WHO World Health Organization
P4P Final Report xii
ACKNOWLEDGMENTS Population Council’s Reproductive Health Program collaborated with the Government of Bangladesh and United Nations Children’s Fund (UNICEF) to pilot test an innovative pay-for-performance initiative to improve maternal, newborn and child health in Bangladesh in order to contribute to the Millennium Development Goals 4 and 5. The Final Report of the P4P project offers the context of the initiative, gives overview of the study activities, reveals results, and discusses implications of the study for Bangladesh.
The authors are grateful to Mr. Md. Humayun Kabir, Senior Secretary, Ministry of Health and Family Welfare (MoHFW), and Professor Dr. Khondhaker Md. Shefyetullah, Director General, Directorate General of Health Services (DGHS) of the Government of Bangladesh for their overall guidance to the study. Mr. Prashanta Bhushan Barua, Joint Chief, Health Economics Unit, MoHFW; Dr. Md. Anwar Hossain Munshi, former Joint Chief (Joint Secretary) Health Economics Unit, MoHFW and Mr. Md. Abdul Mannan, former Joint Chief, Planning, MoHFW provided valuable inputs at different point in time. We sincerely thank Dr. Md. Shamsul Haque, Director, Primary Health Care and Line Director, Maternal, Newborn, Child and Adolescent Health, DGHS. Dr. A.B.M. Jahangir Alam, former Director, Primary Health Care, and Line Director of Essential Service Delivery, DGHS had been instrumental in designing the intervention activities. The contribution of Dr. Mohammed Sharif, Director, Maternal and Child Health (MCH) Services and Line Director, Maternal Child-Reproductive Health (MC-RH), Directorate General of Family Planning (DGFP) and Dr. Jafar Ahmad Hakim, former Director, MCH Services & Line Director, MC-RH Services, DGFP is gratefully appreciated.
We extend our heartfelt thanks to Mr. Michel Saint-Lot, Deputy Representative, UNICEF, for directing the way forward. Dr. Lubana Ahmed, former Health Specialist, UNICEF, and Dr. Monira Parveen, former Health Manager, UNICEF, made instrumental contribution to initiate the study.
Civil Surgeons, Deputy Directors Family Planning, and Presidents of the Bangladesh Medical Associations of Gaibandha, Kurigram, Jamalpur and Thakurgaon districts as well as the Upazila Health and Family Planning Officers, Resident Medical Officers, Consultants, Doctors, and all the MNCH providers and staff of the four District Hospitals, and Upazila Health Complexes – namely, Sunderganj, Shaghata, Fulchari, Nageswari, Bhurungamari, Chilmari, Islampur, Melandah, Bakshiganj, Baliadangi, Pirganj and Ranisankoil – are acknowledged for extending their cooperation and inputs during project implementation and surveys. The Quality Assurance Group members from Mymensingh and Rangpur Medical Colleges, Obstetrical and Gynaecological Society of Bangladesh as well as District Hospitals and Upazila Health Complexes deserve special thanks. We are thankful to the James P. Grant School of Public Health, BRAC University for facilitation in team-building workshops and quality assurance visits in Jamalpur district.
We are immensely grateful to the study monitors of the Population Council-- Dr. John Townsend, Vice President, Reproductive Health Program and Dr. Ian Askew, Director, Reproductive Health Services and Research for their professional input to enrich the project. Thanks to Joanne Gleason, Associate Director, for reviewing the report. Mr. A.K.M. Zafar Ullah Khan, Senior Advisor, Population Council contributed extensively throughout the study period. All the P4P project staff members deserve special thanks for their excellent contribution.
We acknowledge the Australian Agency for International Development, Canadian International Development Agency, the United Kingdom's Department for International Development, and European Union for investing on this important research endeavor through UNICEF.
Finally, the participants are the key to the study; we sincerely thank them for their cooperation and valuable inputs.
P4P Final Report 1
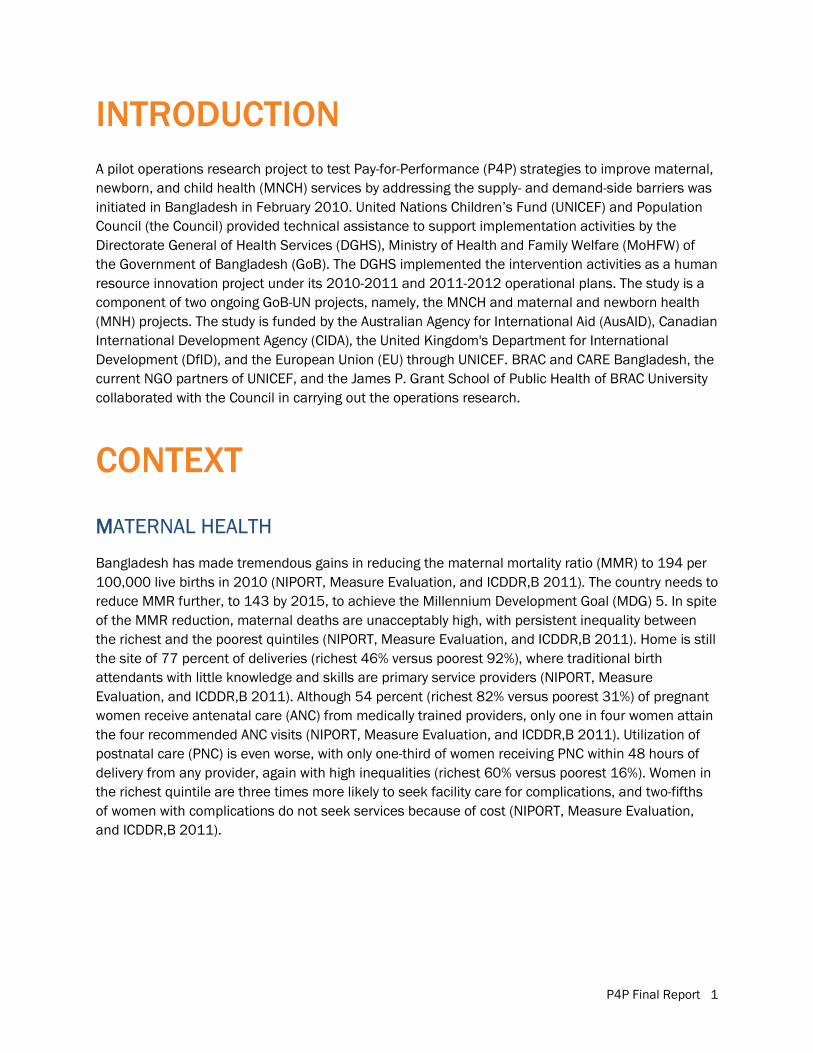
INTRODUCTION A pilot operations research project to test Pay-for-Performance (P4P) strategies to improve maternal, newborn, and child health (MNCH) services by addressing the supply- and demand-side barriers was initiated in Bangladesh in February 2010. United Nations Children’s Fund (UNICEF) and Population Council (the Council) provided technical assistance to support implementation activities by the Directorate General of Health Services (DGHS), Ministry of Health and Family Welfare (MoHFW) of the Government of Bangladesh (GoB). The DGHS implemented the intervention activities as a human resource innovation project under its 2010-2011 and 2011-2012 operational plans. The study is a component of two ongoing GoB-UN projects, namely, the MNCH and maternal and newborn health (MNH) projects. The study is funded by the Australian Agency for International Aid (AusAID), Canadian International Development Agency (CIDA), the United Kingdom's Department for International Development (DfID), and the European Union (EU) through UNICEF. BRAC and CARE Bangladesh, the current NGO partners of UNICEF, and the James P. Grant School of Public Health of BRAC University collaborated with the Council in carrying out the operations research.
CONTEXT
MMATERNAL HEALTH
Bangladesh has made tremendous gains in reducing the maternal mortality ratio (MMR) to 194 per 100,000 live births in 2010 (NIPORT, Measure Evaluation, and ICDDR,B 2011). The country needs to reduce MMR further, to 143 by 2015, to achieve the Millennium Development Goal (MDG) 5. In spite of the MMR reduction, maternal deaths are unacceptably high, with persistent inequality between the richest and the poorest quintiles (NIPORT, Measure Evaluation, and ICDDR,B 2011). Home is still the site of 77 percent of deliveries (richest 46% versus poorest 92%), where traditional birth attendants with little knowledge and skills are primary service providers (NIPORT, Measure Evaluation, and ICDDR,B 2011). Although 54 percent (richest 82% versus poorest 31%) of pregnant women receive antenatal care (ANC) from medically trained providers, only one in four women attain the four recommended ANC visits (NIPORT, Measure Evaluation, and ICDDR,B 2011). Utilization of postnatal care (PNC) is even worse, with only one-third of women receiving PNC within 48 hours of delivery from any provider, again with high inequalities (richest 60% versus poorest 16%). Women in the richest quintile are three times more likely to seek facility care for complications, and two-fifths of women with complications do not seek services because of cost (NIPORT, Measure Evaluation, and ICDDR,B 2011).
P4P Final Report 2
NNEWBORN, INFANT, AND UNDER FIVE CHILDREN’S HEALTH
Newborn, infant, and under five child mortality rates are 32, 43, 53, respectively (NIPORT, Mitra and Associates, and MEASURE DHS 2012). According to the Strategic Plan for Health Population and Nutrition Sector Development Program (HPNSDP) 2011–2016, the GoB intends to reduce these rates to at least 21, 31, 48, respectively, by 2016 (Ministry of Health and Family Welfare 2011). Substantial proportions of newborn deaths are attributed to sepsis, asphyxia, and low birth weight (Chowdhury 2008), which can be reduced by increased access to obstetric and neonatal care services. Infant postnatal checkup utilization is nearly similar to women’s PNC. Only 30 percent of infants receive a check-up from medical provider within two days of birth, with wide disparities between poorest and richest quintiles (NIPORT, Mitra and Associates, and MEASURE DHS 2012). Findings suggest alarmingly low use of child health care in Bangladesh. Only one in four children with diarrheal diseases, and one in three infants with symptoms of acute respiratory infections are taken to a health facility or medically trained health provider, respectively (NIPORT, Mitra and Associates, and MEASURE DHS 2012).
FAMILY PLANNING METHODS
Use of family planning (FP) methods is high in Bangladesh, but the country suffers from low utilization of long-term methods, high levels of discontinuation, and unmet need (NIPORT, Mitra and Associates, and MEASURE DHS 2012). Although a separate Directorate addresses population issues, DGHS-run health facilities do not, generally, cater to the FP needs of the huge number of clients, and miss important opportunities for improving FP service coverage. Current contraceptive prevalence is 61 percent (NIPORT, Mitra and Associates, and MEASURE DHS), and the country is under extreme pressure to achieve replacement-level fertility by increasing modern contraceptive use to at least 72 percent by 2016 (Ministry of Health and Family Welfare 2011).
CHALLENGES TO MATERNAL, NEWBORN, CHILDREN’S HEALTH AND FAMILY PLANNING SERVICES
The key challenges to reducing maternal, neonatal and under-five child mortality include lack of access and inadequate and poor quality of MNCH services. Although the government has developed a comprehensive MNCH service delivery infrastructure from grassroots to higher levels, significant underutilization of existing capacity results from both demand- and supply-side barriers. These barriers can be understood within the context of three delays: (i) delay in deciding to seek care due to lack of awareness and social-cultural-gender inequality, (ii) delay in reaching a medical facility due to transportation obstacles, and (iii) delay in receiving adequate treatment or management at facilities (Thaddeus and Maine 1994). The first two delays reflect demand-side barriers, while the third is supply-side, which, in turn, affects demand-side barriers. For instance, low quality, or unavailable services at facilities reduce demand for MNCH services. As half of the MMR is directly caused by eclampsia and hemorrhage, to further reduce MMR it is critical that public-sector health facilities, mostly servicing the poor, significantly improve their emergency obstetric and newborn care (EmONC) services. Recent consensus, mindful of the three delays, aims to reduce demand- and
P4P Final Report 3
supply-side barriers to MNCH services in order to improve basic and emergency obstetric care, institutional delivery, skilled birth attendance, and family planning services.
On the supply side, health facilities often operate at less than capacity in Bangladesh. Shortages of qualified staff, essential drugs and supplies, combined with administrative delays and clinical mismanagement, are key barriers to improve the quality of MNCH services. The shortage and sub-optimal performance of service providers are the most important supply-side challenge in Bangladesh (Talukder and Rob 2009). Bangladesh is one of the few countries in which physicians far exceed nurses and trained midwives, but most physicians are concentrated in urban areas, as rural sites do not offer urban amenities and have limited scope for private practice. Shortages in skilled health workers are results of weak incentive and low remuneration for public healthcare workers (UNICEF 2008). Remuneration of the public-sector providers is well below the private sector, and the providers do not receive any performance incentive. As a result, public-sector providers remain absent, and tend to refer patients to their own private clinics for personal gain, or alternatively, they charge unofficial fees when services at government facilities are supposed to be free or very low cost. This situation increases the poor’s out-of-pocket cost and makes obtaining necessary services difficult (Rob, Talukder and Ghafur 2006). Poor supervision and monitoring systems, and absence of financial incentives, also discourage provider accountability and responsiveness to patients. These factors indicate that service providers can be motivated by financial gain tied with performance targets.
IINTERVENTION STRATEGIES
To reduce both demand- and supply-side barriers in Bangladesh, a demand-side financing (DSF) scheme was introduced in 2006. Currently, the DSF is being implemented in 53 Upazila Health Complexes (UHCs) (sub-district level public-sector health facilities). The DSF, with funding from the GoB pool fund, targets the poor with a cash incentive of Taka 2,000 (US$25) for having an assisted safe delivery, either in facilities or at home with a skilled birth attendant (SBA). Payees are also entitled to transportation cost of Taka 500 ($6.25), from home to the UHC, and an additional Taka 500 ($6.25) for referral to the District Hospital. In addition, a gift box of one sari, two baby attires, two towels and baby-soap worth Taka 500 ($6.25) is provided to pregnant women. In seven of the 53 UHCs, the DSF is funded by UN partners; in these UHCs, the lump sum cash incentive of Taka 2,000 (US$25) has been discarded and transportation costs are reimbursed for actual expenditures. The DSF also offers incentives to providers based on service volume, varying according to type of service. Amounts equal to those paid to providers are deposited in the seed fund, from which associated expendable costs are paid. Thus, the DSF for maternal health care in Bangladesh is a combination of supply-side incentives for providers and demand-side cash transfers for clients. A recent evaluation of the DSF revealed increased service use among the target group although with little impact on service quality, misreporting of safe delivery services for financial gain, complex management arrangements, delays in fund disbursement through banks, and unofficial charges from providers (Schmidt et al. 2010; Koehlmoos et al. 2008).
In this context, the Council explored possibilities of introducing the Pay-for-Performance or P4P scheme to improve maternal health care services by using a consultative process in a series of
P4P Final Report 4
workshops, funded by the AusAID through Center for Global Development. The government and non-governmental health service providers, program managers and policymakers overwhelmingly supported introduction of the P4P incentive for MNCH service providers in Bangladesh (Population Council 2009).
Based on the study findings and consultative process, the Council collaborated with UNICEF for providing technical assistance to the DGHS to test P4P strategies for MNCH service providers to improve service volume and quality of care, and for the poor clients to receive services through subsidized vouchers or coupons. Using a pre-test post-test separate sample quasi-experimental design, the study tests two strategies. The first strategy is a combination of pay-for-performance incentive for providers and subsidized coupons for poor pregnant women, newborns, and under-five children, while the second strategy employs only pay-for-performance incentive for the providers.
The P4P approaches are different from the DSF scheme. Firstly, P4P approaches measure the facility performance not individual provider’s performance. Secondly, quality of care in providing EmONC services is measured and rewarded under the P4P scheme but this important aspect has not been included under the DSF scheme. Thirdly, poor pregnant women receive coupons under the P4P scheme irrespective of their number of parity while DSF scheme provides vouchers to the poor pregnant women who have less than two children, which is a violation of women’s reproductive health rights. Fourthly, P4P approaches allow poor pregnant women as well as their newborns and under-five children to receive pregnancy, newborn and under-five children’s complications related services. In contrast, DSF scheme allows vouchers for receiving pregnancy related services only. Fifthly, P4P scheme employed a third party (non-governmental institution) to manage the incentive disbursement to the facilities while the payer and the payees are the government under the DSF scheme. Finally, coupon and service validation is made by an independent audit firm under the P4P scheme while no such validation system is in place for the DSF scheme.
OBJECTIVES The objective of the study is to test and compare the two service delivery models on utilization of facility-based delivery, antenatal, postnatal and neonatal care services, and under-five children’s life-threatening health care services to contribute to improve the maternal, newborn and child health1
� test the feasibility of implementing performance incentives for providers, and clients;
.
The specific objectives are to:
� evaluate whether payment for providers, with or without financing for clients, results in increased utilization of antenatal care, postnatal care, institutional deliveries, and family planning counseling.
1Initially, the project aimed to increase the pregnancy-related complications management, newborn care and complications management, and use of facility-based care for life-threatening but preventable diseases of under-five children. However, the stakeholders could not agree on setting targets for complications management on ethical grounds.
P4P Final Report 5
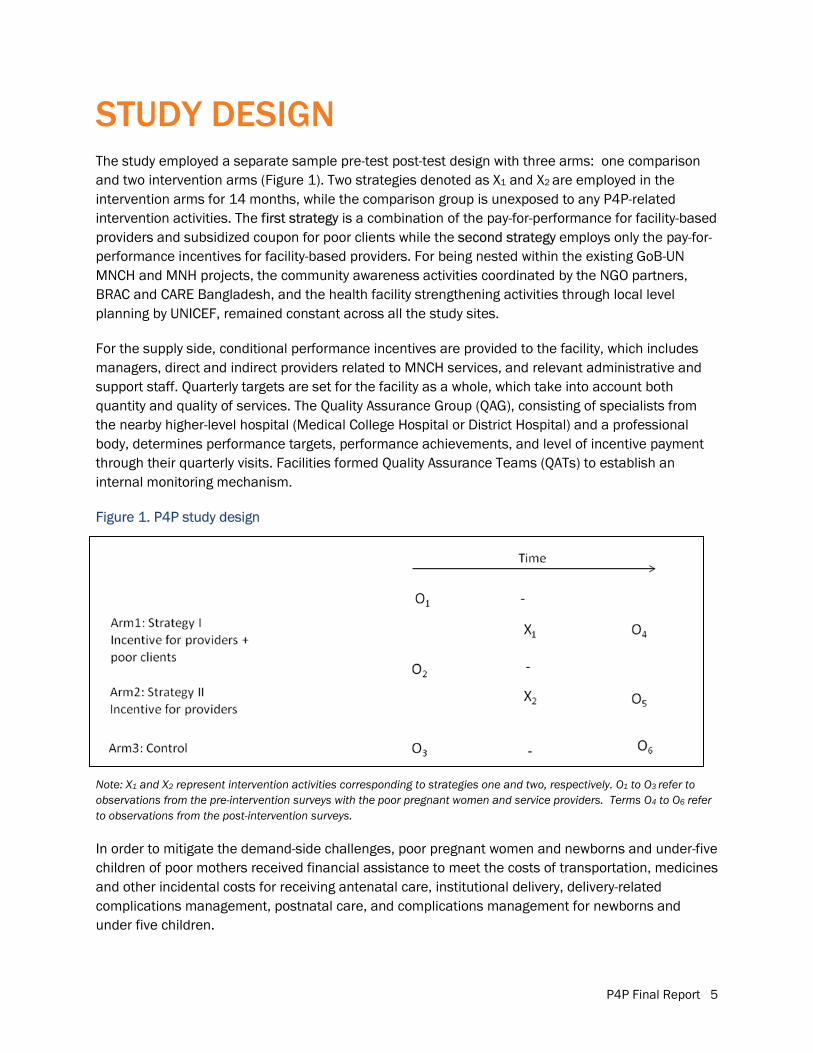
STUDY DESIGN The study employed a separate sample pre-test post-test design with three arms: one comparison and two intervention arms (Figure 1). Two strategies denoted as X1 and X2 are employed in the intervention arms for 14 months, while the comparison group is unexposed to any P4P-related intervention activities. The first strategy is a combination of the pay-for-performance for facility-based providers and subsidized coupon for poor clients while the second strategy employs only the pay-for-performance incentives for facility-based providers. For being nested within the existing GoB-UN MNCH and MNH projects, the community awareness activities coordinated by the NGO partners, BRAC and CARE Bangladesh, and the health facility strengthening activities through local level planning by UNICEF, remained constant across all the study sites.
For the supply side, conditional performance incentives are provided to the facility, which includes managers, direct and indirect providers related to MNCH services, and relevant administrative and support staff. Quarterly targets are set for the facility as a whole, which take into account both quantity and quality of services. The Quality Assurance Group (QAG), consisting of specialists from the nearby higher-level hospital (Medical College Hospital or District Hospital) and a professional body, determines performance targets, performance achievements, and level of incentive payment through their quarterly visits. Facilities formed Quality Assurance Teams (QATs) to establish an internal monitoring mechanism.
Figure 1. P4P study design
Note: X1 and X2 represent intervention activities corresponding to strategies one and two, respectively. O1 to O3 refer to observations from the pre-intervention surveys with the poor pregnant women and service providers. Terms O4 to O6 refer to observations from the post-intervention surveys.
In order to mitigate the demand-side challenges, poor pregnant women and newborns and under-five children of poor mothers received financial assistance to meet the costs of transportation, medicines and other incidental costs for receiving antenatal care, institutional delivery, delivery-related complications management, postnatal care, and complications management for newborns and under five children.
P4P Final Report 6
Comparison between the control and each intervention group and over time allows measuring the effectiveness of the intervention strategies. Comparison between the two strategies allows measuring the relative effectiveness of the two financing models in terms of changes attributable to each program intervention. Given the resource constraints for this study, comparison of effectiveness between the two strategies can better inform the policymakers to choose the more effective strategy. In case both the strategies indicate positive results, both of them can be applied in different settings according to the need. For instance, the first strategy can be applied in the poorest regions while the second strategy can be applied in the poorer regions of the country where the clients need less support to access the MNCH services.
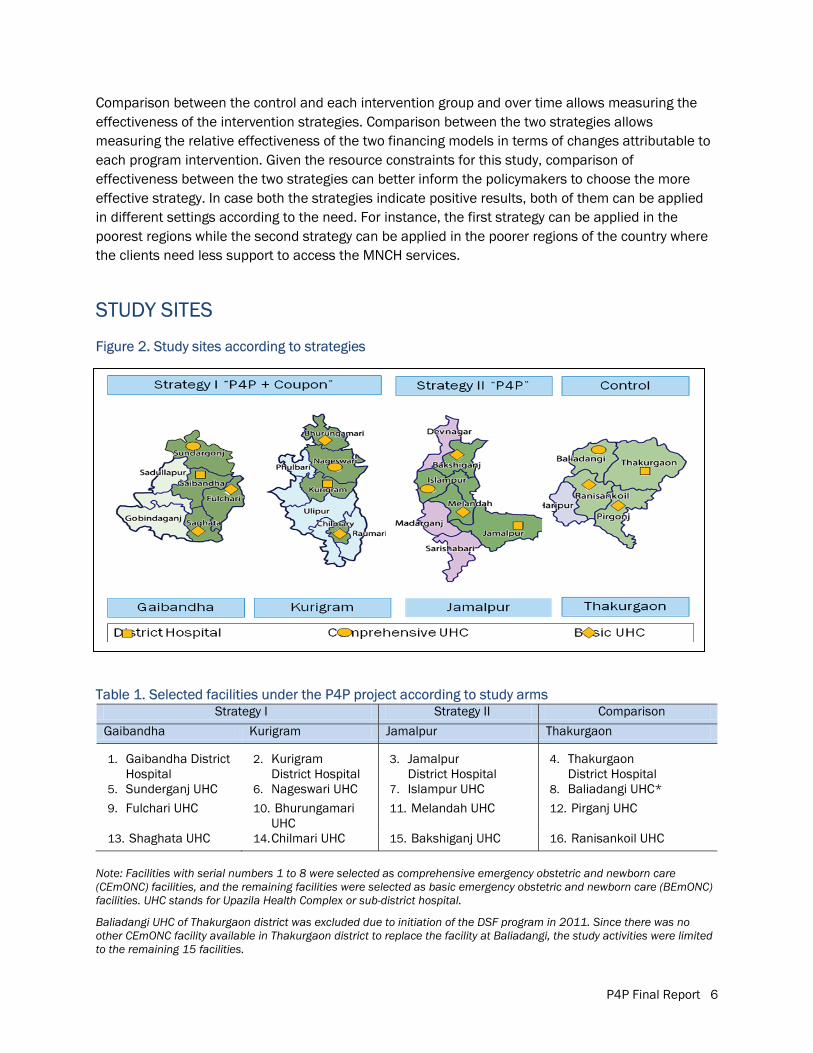
STUDY SITES
Figure 2. Study sites according to strategies
Table 1. Selected facilities under the P4P project according to study arms Strategy I Strategy II Comparison
Gaibandha Kurigram Jamalpur Thakurgaon
1. Gaibandha District Hospital
2. Kurigram District Hospital
3. Jamalpur District Hospital
4. Thakurgaon District Hospital
5. Sunderganj UHC 6. Nageswari UHC 7. Islampur UHC 8. Baliadangi UHC* 9. Fulchari UHC 10. Bhurungamari
UHC 11. Melandah UHC 12. Pirganj UHC
13. Shaghata UHC 14.Chilmari UHC 15. Bakshiganj UHC 16. Ranisankoil UHC
Note: Facilities with serial numbers 1 to 8 were selected as comprehensive emergency obstetric and newborn care (CEmONC) facilities, and the remaining facilities were selected as basic emergency obstetric and newborn care (BEmONC) facilities. UHC stands for Upazila Health Complex or sub-district hospital.
Baliadangi UHC of Thakurgaon district was excluded due to initiation of the DSF program in 2011. Since there was no other CEmONC facility available in Thakurgaon district to replace the facility at Baliadangi, the study activities were limited to the remaining 15 facilities.
P4P Final Report 7
ACTIVITIES
PPREPARATORY ACTIVITIES DESIGNING AND CONSENSUS-BUILDING WORKSHOPS
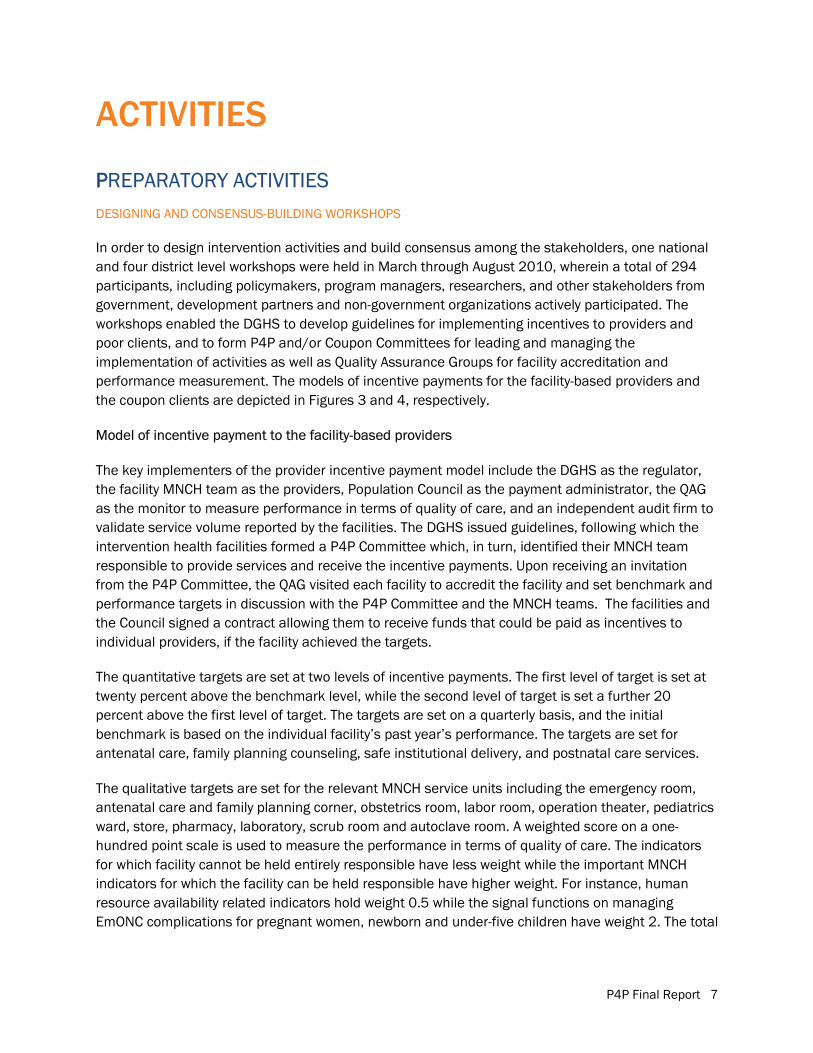
In order to design intervention activities and build consensus among the stakeholders, one national and four district level workshops were held in March through August 2010, wherein a total of 294 participants, including policymakers, program managers, researchers, and other stakeholders from government, development partners and non-government organizations actively participated. The workshops enabled the DGHS to develop guidelines for implementing incentives to providers and poor clients, and to form P4P and/or Coupon Committees for leading and managing the implementation of activities as well as Quality Assurance Groups for facility accreditation and performance measurement. The models of incentive payments for the facility-based providers and the coupon clients are depicted in Figures 3 and 4, respectively.
Model of incentive payment to the facility-based providers
The key implementers of the provider incentive payment model include the DGHS as the regulator, the facility MNCH team as the providers, Population Council as the payment administrator, the QAG as the monitor to measure performance in terms of quality of care, and an independent audit firm to validate service volume reported by the facilities. The DGHS issued guidelines, following which the intervention health facilities formed a P4P Committee which, in turn, identified their MNCH team responsible to provide services and receive the incentive payments. Upon receiving an invitation from the P4P Committee, the QAG visited each facility to accredit the facility and set benchmark and performance targets in discussion with the P4P Committee and the MNCH teams. The facilities and the Council signed a contract allowing them to receive funds that could be paid as incentives to individual providers, if the facility achieved the targets.
The quantitative targets are set at two levels of incentive payments. The first level of target is set at twenty percent above the benchmark level, while the second level of target is set a further 20 percent above the first level of target. The targets are set on a quarterly basis, and the initial benchmark is based on the individual facility’s past year’s performance. The targets are set for antenatal care, family planning counseling, safe institutional delivery, and postnatal care services.
The qualitative targets are set for the relevant MNCH service units including the emergency room, antenatal care and family planning corner, obstetrics room, labor room, operation theater, pediatrics ward, store, pharmacy, laboratory, scrub room and autoclave room. A weighted score on a one-hundred point scale is used to measure the performance in terms of quality of care. The indicators for which facility cannot be held entirely responsible have less weight while the important MNCH indicators for which the facility can be held responsible have higher weight. For instance, human resource availability related indicators hold weight 0.5 while the signal functions on managing EmONC complications for pregnant women, newborn and under-five children have weight 2. The total
P4P Final Report 8
weighted scores of all the MNCH service units are transformed into a 100-point scale for comparison with the previous quarter.
The facility MNCH team that is eligible to receive incentives includes the managers, direct and indirect providers, administrative and support staff at varying level of efforts. The level of effort of managers and direct providers is considered 100 percent, and is 50 percent for the indirect providers and administrative staff, while for the support staff it ranges from 50 to 100 percent. The first level of incentive amount is equivalent to a person’s one-month basic salary for a quarter; and the second level of incentive equals one and a half month’s basic salary of the respective providers.
Figure 3. Incentive payment mechanism for the facility-based providers under the P4P scheme
Upon receiving the target, the MNCH team attempts to improve the service volume and the quality of care. They engage the internal quality assurance teams to enhance the quality of care. At the end of the quarter, the QAGs visit the facilities to measure the quality of care following an agreed upon checklist. Upon reviewing the facility’s performance, the QAG recommends either rewarding the facility with incentives for the providers or not recommending any incentive due to a lack of improvement in performance. If a facility achieves both the volume and quality targets, then they become eligible to receive performance incentives. Achieving only the quantitative target does not allow a facility to receive the incentive. For the first level of incentive, the facility must meet the first level of qualitative target coupled with at least the first level of quantitative target; and for the second level of incentive, facilities must meet the second level of qualitative target along with the second level of quantitative target.
P4P Final Report 9
The P4P Committees receive an advance payment from the Council to pay incentives to the providers by bank transfers. An audit firm, engaged by the Council, validates the payment made to the providers, and service volume reported by the facilities.
Model of incentive payment to the coupon holders
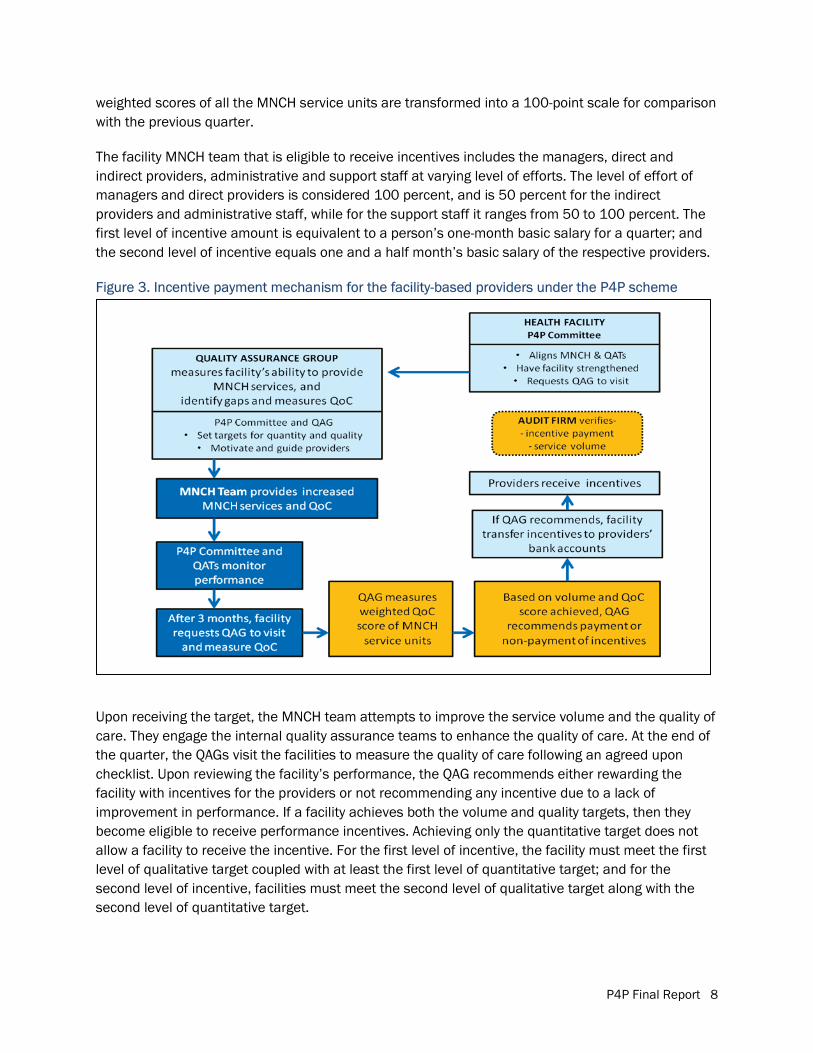
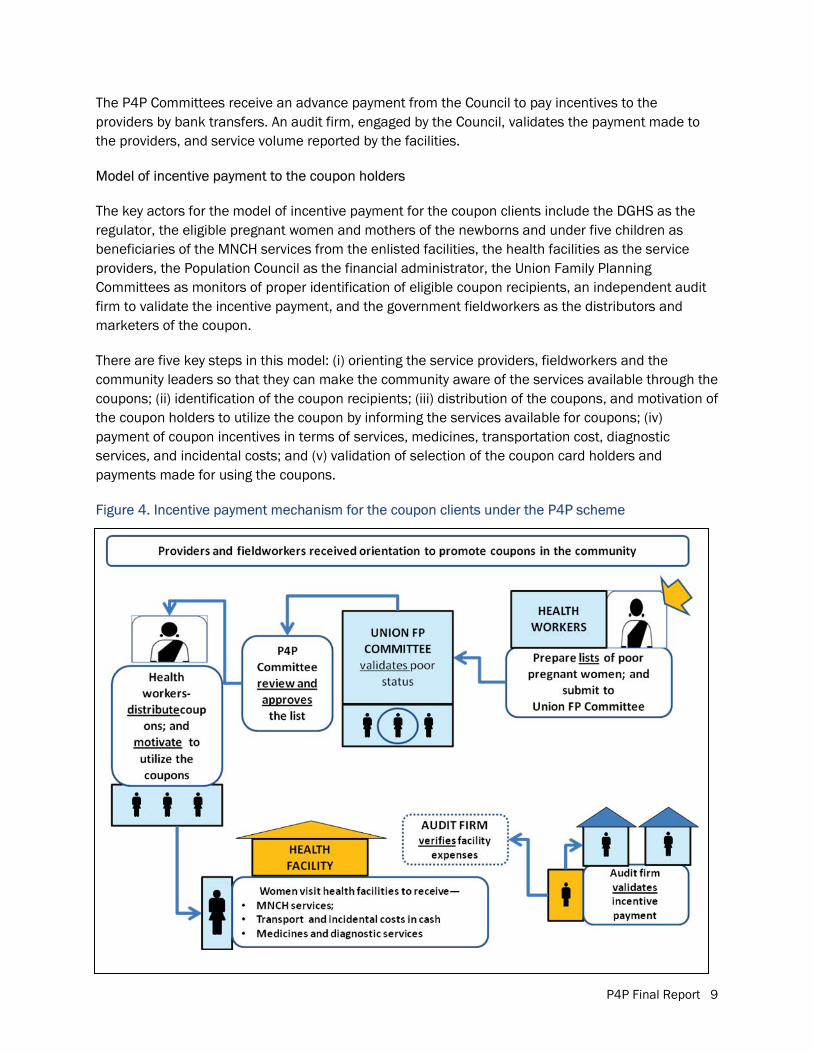
The key actors for the model of incentive payment for the coupon clients include the DGHS as the regulator, the eligible pregnant women and mothers of the newborns and under five children as beneficiaries of the MNCH services from the enlisted facilities, the health facilities as the service providers, the Population Council as the financial administrator, the Union Family Planning Committees as monitors of proper identification of eligible coupon recipients, an independent audit firm to validate the incentive payment, and the government fieldworkers as the distributors and marketers of the coupon.
There are five key steps in this model: (i) orienting the service providers, fieldworkers and the community leaders so that they can make the community aware of the services available through the coupons; (ii) identification of the coupon recipients; (iii) distribution of the coupons, and motivation of the coupon holders to utilize the coupon by informing the services available for coupons; (iv) payment of coupon incentives in terms of services, medicines, transportation cost, diagnostic services, and incidental costs; and (v) validation of selection of the coupon card holders and payments made for using the coupons.
Figure 4. Incentive payment mechanism for the coupon clients under the P4P scheme
P4P Final Report 10
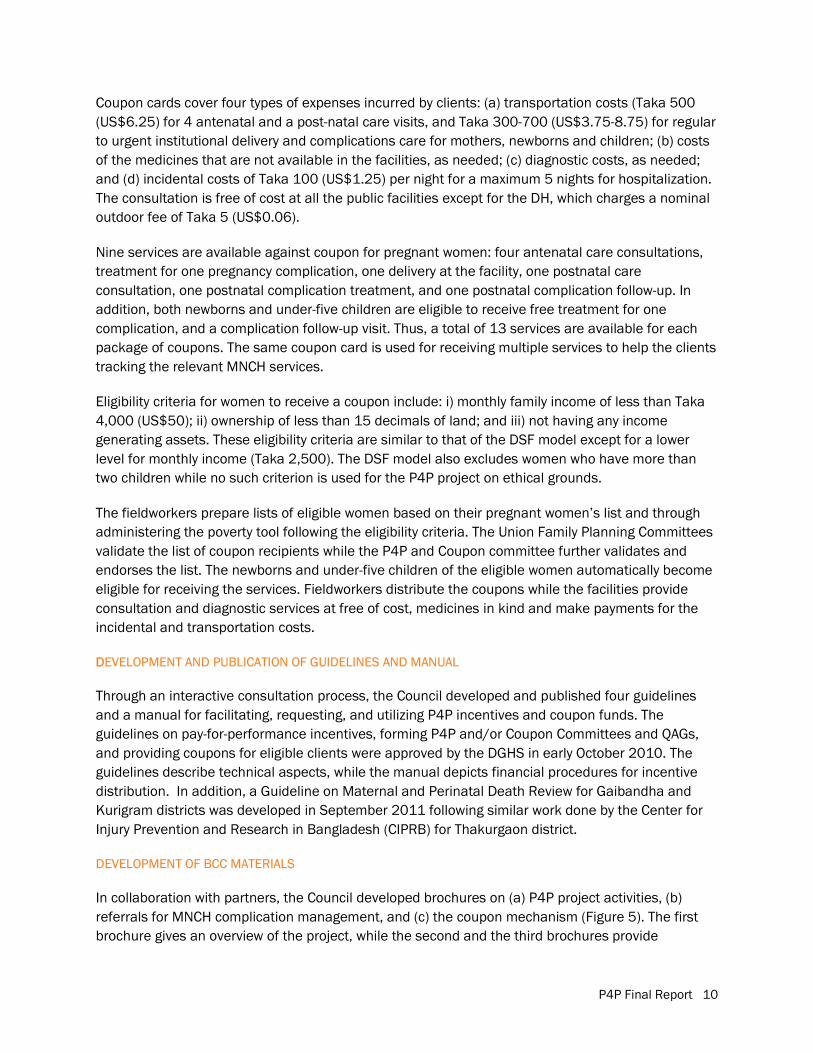
Coupon cards cover four types of expenses incurred by clients: (a) transportation costs (Taka 500 (US$6.25) for 4 antenatal and a post-natal care visits, and Taka 300-700 (US$3.75-8.75) for regular to urgent institutional delivery and complications care for mothers, newborns and children; (b) costs of the medicines that are not available in the facilities, as needed; (c) diagnostic costs, as needed; and (d) incidental costs of Taka 100 (US$1.25) per night for a maximum 5 nights for hospitalization. The consultation is free of cost at all the public facilities except for the DH, which charges a nominal outdoor fee of Taka 5 (US$0.06).
Nine services are available against coupon for pregnant women: four antenatal care consultations, treatment for one pregnancy complication, one delivery at the facility, one postnatal care consultation, one postnatal complication treatment, and one postnatal complication follow-up. In addition, both newborns and under-five children are eligible to receive free treatment for one complication, and a complication follow-up visit. Thus, a total of 13 services are available for each package of coupons. The same coupon card is used for receiving multiple services to help the clients tracking the relevant MNCH services.
Eligibility criteria for women to receive a coupon include: i) monthly family income of less than Taka 4,000 (US$50); ii) ownership of less than 15 decimals of land; and iii) not having any income generating assets. These eligibility criteria are similar to that of the DSF model except for a lower level for monthly income (Taka 2,500). The DSF model also excludes women who have more than two children while no such criterion is used for the P4P project on ethical grounds.
The fieldworkers prepare lists of eligible women based on their pregnant women’s list and through administering the poverty tool following the eligibility criteria. The Union Family Planning Committees validate the list of coupon recipients while the P4P and Coupon committee further validates and endorses the list. The newborns and under-five children of the eligible women automatically become eligible for receiving the services. Fieldworkers distribute the coupons while the facilities provide consultation and diagnostic services at free of cost, medicines in kind and make payments for the incidental and transportation costs.
DDEVELOPMENT AND PUBLICATION OF GUIDELINES AND MANUAL
Through an interactive consultation process, the Council developed and published four guidelines and a manual for facilitating, requesting, and utilizing P4P incentives and coupon funds. The guidelines on pay-for-performance incentives, forming P4P and/or Coupon Committees and QAGs, and providing coupons for eligible clients were approved by the DGHS in early October 2010. The guidelines describe technical aspects, while the manual depicts financial procedures for incentive distribution. In addition, a Guideline on Maternal and Perinatal Death Review for Gaibandha and Kurigram districts was developed in September 2011 following similar work done by the Center for Injury Prevention and Research in Bangladesh (CIPRB) for Thakurgaon district.
DEVELOPMENT OF BCC MATERIALS
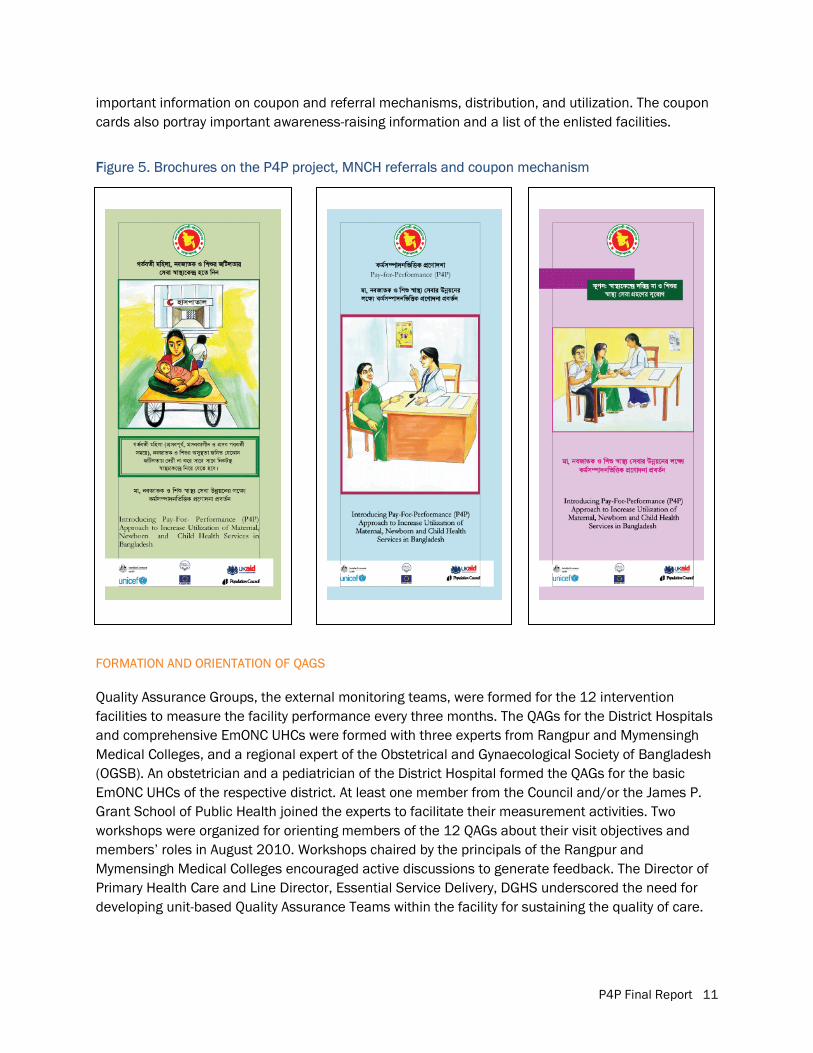
In collaboration with partners, the Council developed brochures on (a) P4P project activities, (b) referrals for MNCH complication management, and (c) the coupon mechanism (Figure 5). The first brochure gives an overview of the project, while the second and the third brochures provide
P4P Final Report 11
important information on coupon and referral mechanisms, distribution, and utilization. The coupon cards also portray important awareness-raising information and a list of the enlisted facilities.
FFigure 5. Brochures on the P4P project, MNCH referrals and coupon mechanism
FORMATION AND ORIENTATION OF QAGS
Quality Assurance Groups, the external monitoring teams, were formed for the 12 intervention facilities to measure the facility performance every three months. The QAGs for the District Hospitals and comprehensive EmONC UHCs were formed with three experts from Rangpur and Mymensingh Medical Colleges, and a regional expert of the Obstetrical and Gynaecological Society of Bangladesh (OGSB). An obstetrician and a pediatrician of the District Hospital formed the QAGs for the basic EmONC UHCs of the respective district. At least one member from the Council and/or the James P. Grant School of Public Health joined the experts to facilitate their measurement activities. Two workshops were organized for orienting members of the 12 QAGs about their visit objectives and members’ roles in August 2010. Workshops chaired by the principals of the Rangpur and Mymensingh Medical Colleges encouraged active discussions to generate feedback. The Director of Primary Health Care and Line Director, Essential Service Delivery, DGHS underscored the need for developing unit-based Quality Assurance Teams within the facility for sustaining the quality of care.
P4P Final Report 12
FFACILITY ACCREDITATION VISITS
Facilities hosted QAG visits in September 2010 for getting accreditation and to determine benchmarks and set the first and second levels of target for the first quarter. Facilities of Gaibandha organized the visits in November and December; therefore, the targets, performance and incentives for these facilities were set and measured according to the month of the visit. The QAGs gave instant feedback to the providers and the internal quality assurance teams while visiting the facility, and mentored them to improve the quality of care. The visits ended with an interactive discussion with the P4P Committees in order to set the benchmarks and targets for the first quarter. All the facilities received accreditation, but one facility was downgraded as a basic instead of a comprehensive EmONC care facility2
FORMATION OF FACILITY-BASED COMMITTEES AND TEAMS
.
In order to make the performance incentive functional, the facilities formed P4P and/or Coupon Committees, MNCH teams, quality assurance teams, fund operation teams, and community based referral teams.
P4P and/or Coupon Committees: To lead and manage the project implementation activities, six-member P4P and/or Coupon Committees, headed by the Civil Surgeons/Upazila Health and Family Planning Officers were formed. The Committees for District Hospital include the Resident Medical Officer as the member-secretary and the President of the local branch of the Bangladesh Medical Association, Deputy Director of Family Planning, an NGO representative and Nursing Supervisor as committee members. For Upazila Health Complex, the Committees had Resident Medical Officer as the member-secretary and an NGO representative, elected female local government representative, Upazila Family Planning Officer and Nursing Supervisor as committee members. The Committee is known as the P4P Committee for facilities implementing performance incentives for providers only. The Committee members meet to review the performance and take necessary measures to improve the situation, to arrange the QAG visits and to receive and utilize funds for distributing incentives to the providers, and incur expenses for drugs, consumables, and maintenance activities. In addition, the P4P and Coupon Committees are responsible for making payment to the coupon holders for transportation and incidental costs, acquire drugs, and sign contract with diagnostic facilities in case the service is not available within their facility.
MNCH Teams: The P4P Committees aligned the MNCH teams, including managers, direct and indirect providers, and administrative and support staff for providing services and receiving performance-based incentives. Numbers of team members in District Hospitals varied from 50 to 84 (lowest in Gaibandha, a 100-bed hospital and highest in Jamalpur, a 250-bed hospital), while members varied from 40 to 51 in UHCs.
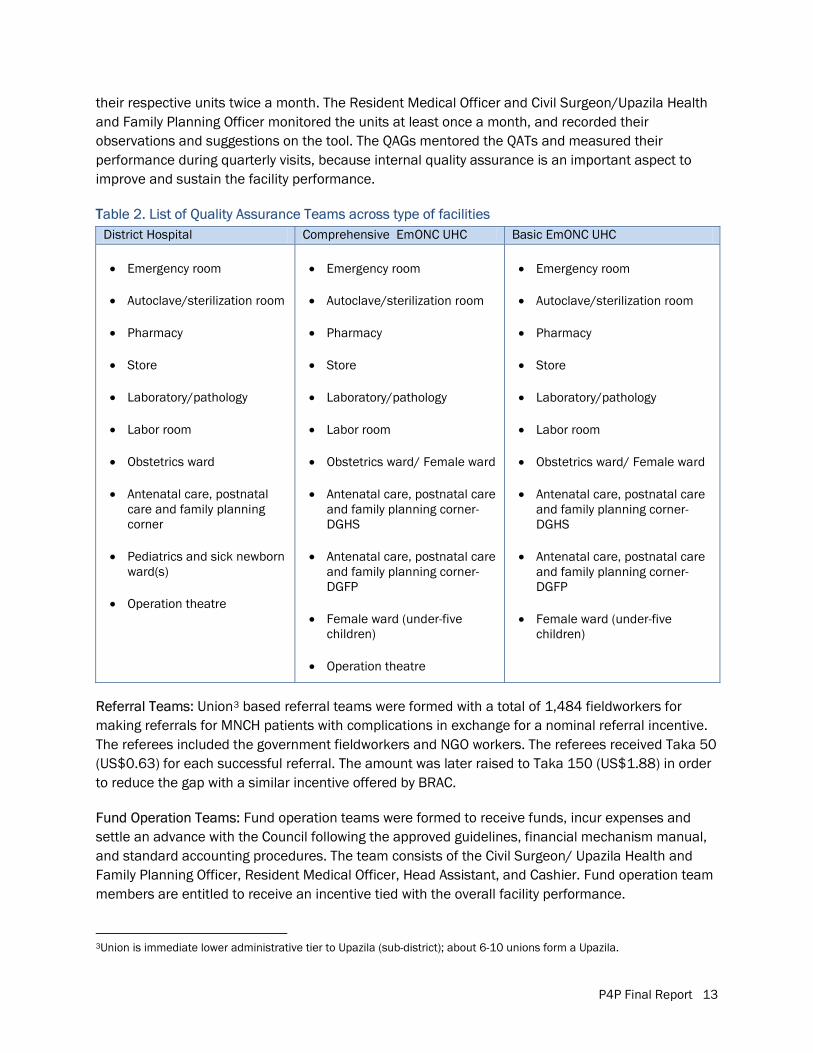
Quality Assurance Teams: Facilities formed QATs to ensure the quality of care at important MNCH units to enable the institutions to bring about changes from within (Table 2). Monitoring tools in Bangla posted on the walls allowed the QAT team leaders to monitor and record the performance of
2The comprehensive EmONC facilities offer the WHO prescribed nine signal functions while the basic facilities are unable to offer cesarean section and blood transfusion services.
P4P Final Report 13
their respective units twice a month. The Resident Medical Officer and Civil Surgeon/Upazila Health and Family Planning Officer monitored the units at least once a month, and recorded their observations and suggestions on the tool. The QAGs mentored the QATs and measured their performance during quarterly visits, because internal quality assurance is an important aspect to improve and sustain the facility performance.
TTable 2. List of Quality Assurance Teams across type of facilities
Referral Teams: Union3
3Union is immediate lower administrative tier to Upazila (sub-district); about 6-10 unions form a Upazila.
based referral teams were formed with a total of 1,484 fieldworkers for making referrals for MNCH patients with complications in exchange for a nominal referral incentive. The referees included the government fieldworkers and NGO workers. The referees received Taka 50 (US$0.63) for each successful referral. The amount was later raised to Taka 150 (US$1.88) in order to reduce the gap with a similar incentive offered by BRAC.
Fund Operation Teams: Fund operation teams were formed to receive funds, incur expenses and settle an advance with the Council following the approved guidelines, financial mechanism manual, and standard accounting procedures. The team consists of the Civil Surgeon/ Upazila Health and Family Planning Officer, Resident Medical Officer, Head Assistant, and Cashier. Fund operation team members are entitled to receive an incentive tied with the overall facility performance.
District Hospital Comprehensive EmONC UHC Basic EmONC UHC
� Emergency room
� Autoclave/sterilization room
� Pharmacy
� Store
� Laboratory/pathology
� Labor room
� Obstetrics ward
� Antenatal care, postnatal care and family planning corner
� Pediatrics and sick newborn ward(s)
� Operation theatre
� Emergency room
� Autoclave/sterilization room
� Pharmacy
� Store
� Laboratory/pathology
� Labor room
� Obstetrics ward/ Female ward
� Antenatal care, postnatal care and family planning corner- DGHS
� Antenatal care, postnatal care and family planning corner- DGFP
� Female ward (under-five children)
P4P Final Report 14
TTEAM-BUILDING WORKSHOPS
Twenty-four team building-workshops with 579 facility-based managers, direct and indirect providers, and administrative and support staff were organized in August and September 2010. Not to disrupt services, two workshops for each facility were arranged on facility premises. The workshops aimed to revitalize the team spirit among MNCH team members by discussing present barriers and motivating staff to be team players for attaining facility targets. The James P. Grant School of Public Health designed, developed and facilitated the workshops with inputs from the project partners.
ORIENTATION WORKSHOPS WITH FIELDWORKERS
Orientation workshops with 1,065 fieldworkers (Health Assistants, Family Welfare Assistants, and NGO workers) were organized in October and December 2010 in nine Upazilas. The workshops oriented fieldworkers on (a) the P4P project, (b) MNCH referral, and (c) the coupon mechanism. The objectives were to enable fieldworkers to work in harmony for strengthening the referral mechanism and to identify poor pregnant women for coupon distribution and motivating them to use the coupons for receiving MNCH services.
Considering gaps in the community awareness level, 270 NGO fieldworkers were oriented in nine workshops, one in each upazila, in 2011. The fieldworkers received information to enable them to orient about 2,500 frontline NGO volunteers living in the community, on timely referring the complicated MNCH patients to relevant facilities, and to increase the service uptake for coupon holders.
FINANCIAL MANAGEMENT WORKSHOP AND SIGNING OF CONTRACTS
Financial management workshops with fund operation teams were organized to orient and build facility capacity for managing incentive funds for providers and patients following the Financial Manual and P4P Guidelines. All the facilities held the workshop in 2010 except for Fulchari Upazila Health Complex, which organized the event in January 2011. The fund operation team included the Civil Surgeon/Upazila Health and Family Planning Officer, Resident Medical Officer, and administrative personnel maintaining accounts and records, making payments, keeping stores, and providing medicines or diagnostic services to clients. Following the financial management workshops, all facilities signed agreements with the Council and opened P4P and/or Coupon Committee bank accounts. The contracts were signed by December 2010 except for Fulchari which was signed in March 2011. Due to transfer of managerial officers who are the bank account signatories, three facilities of Gaibandha opened bank accounts in January through March 2011 while others opened their accounts in 2010.
P4P Final Report 15
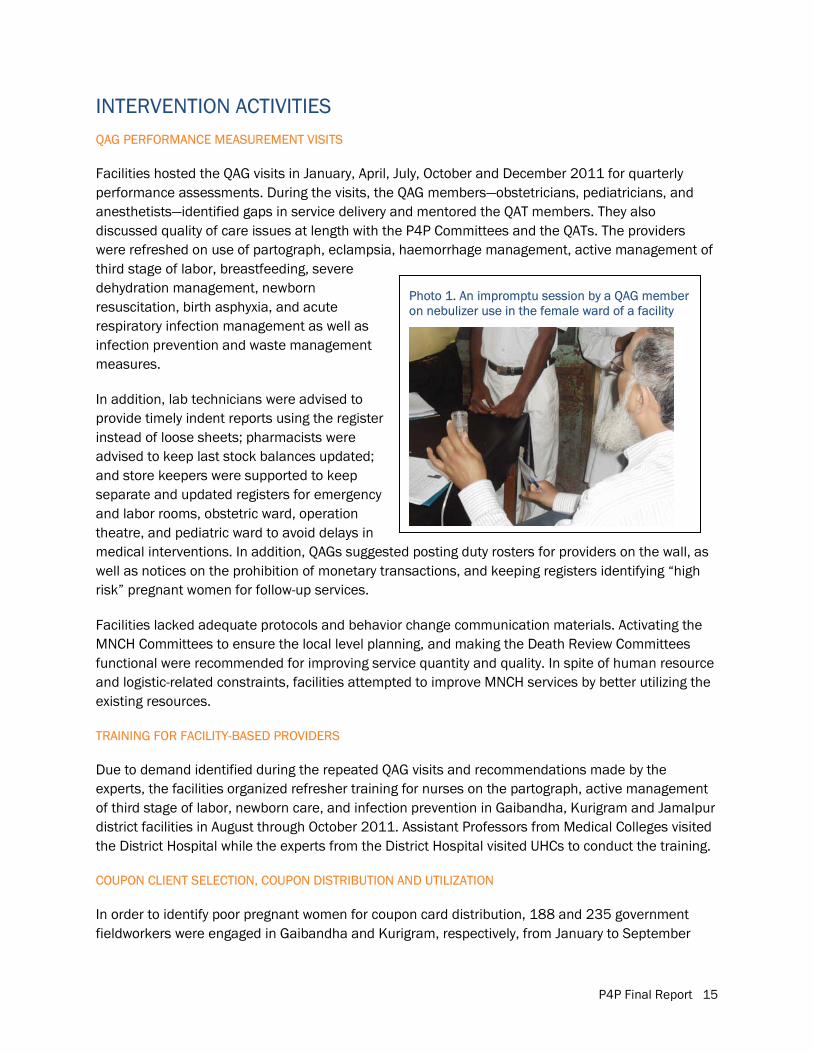
Photo 1. An impromptu session by a QAG member on nebulizer use in the female ward of a facility
INTERVENTION ACTIVITIES QAG PERFORMANCE MEASUREMENT VISITS
Facilities hosted the QAG visits in January, April, July, October and December 2011 for quarterly performance assessments. During the visits, the QAG members—obstetricians, pediatricians, and anesthetists—identified gaps in service delivery and mentored the QAT members. They also discussed quality of care issues at length with the P4P Committees and the QATs. The providers were refreshed on use of partograph, eclampsia, haemorrhage management, active management of third stage of labor, breastfeeding, severe dehydration management, newborn resuscitation, birth asphyxia, and acute respiratory infection management as well as infection prevention and waste management measures.
In addition, lab technicians were advised to provide timely indent reports using the register instead of loose sheets; pharmacists were advised to keep last stock balances updated; and store keepers were supported to keep separate and updated registers for emergency and labor rooms, obstetric ward, operation theatre, and pediatric ward to avoid delays in medical interventions. In addition, QAGs suggested posting duty rosters for providers on the wall, as well as notices on the prohibition of monetary transactions, and keeping registers identifying “high risk” pregnant women for follow-up services.
Facilities lacked adequate protocols and behavior change communication materials. Activating the MNCH Committees to ensure the local level planning, and making the Death Review Committees functional were recommended for improving service quantity and quality. In spite of human resource and logistic-related constraints, facilities attempted to improve MNCH services by better utilizing the existing resources.
TRAINING FOR FACILITY-BASED PROVIDERS
Due to demand identified during the repeated QAG visits and recommendations made by the experts, the facilities organized refresher training for nurses on the partograph, active management of third stage of labor, newborn care, and infection prevention in Gaibandha, Kurigram and Jamalpur district facilities in August through October 2011. Assistant Professors from Medical Colleges visited the District Hospital while the experts from the District Hospital visited UHCs to conduct the training.
COUPON CLIENT SELECTION, COUPON DISTRIBUTION AND UTILIZATION
In order to identify poor pregnant women for coupon card distribution, 188 and 235 government fieldworkers were engaged in Gaibandha and Kurigram, respectively, from January to September
P4P Final Report 16
2011. Gaibandha engaged only Family Welfare Assistants while Kurigram engaged equal numbers of Family Welfare Assistants and Health Assistants. Lists prepared by the government fieldworkers were verified by the Union Family Planning Committee, and later approved by the respective facility-level P4P and Coupon Committees.
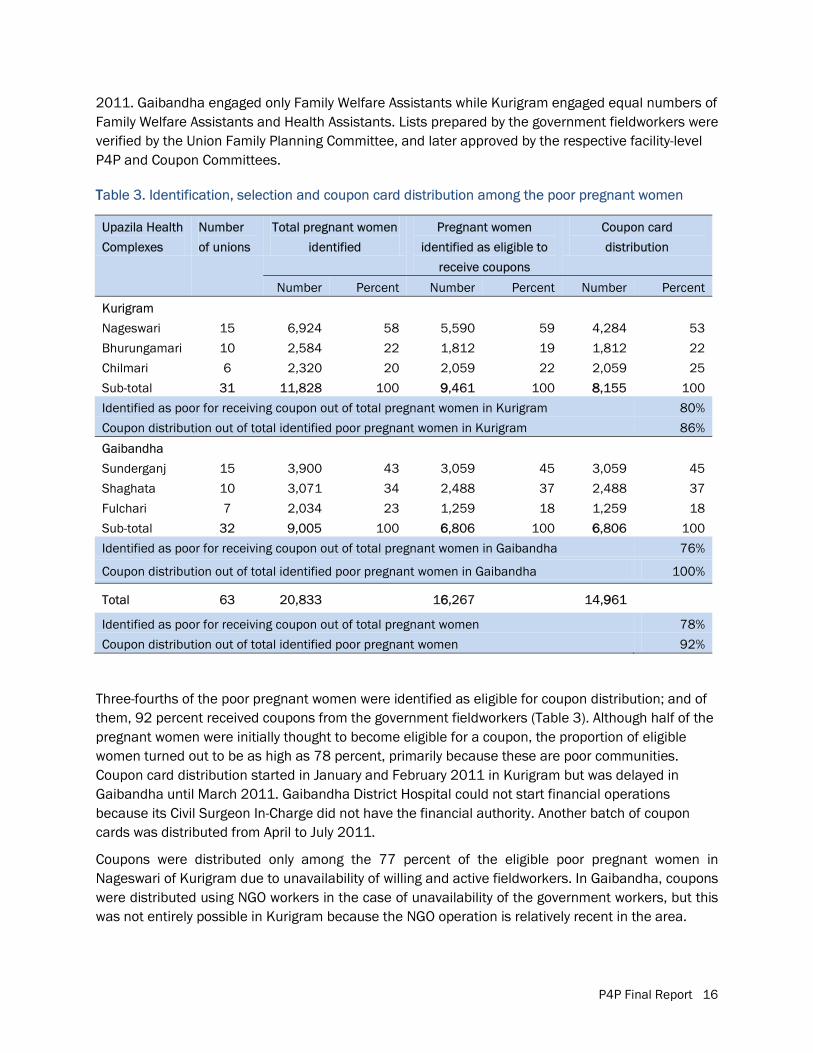
TTable 3. Identification, selection and coupon card distribution among the poor pregnant women
Upazila Health
Complexes
Number
of unions
Total pregnant women
identified
Pregnant women
identified as eligible to
receive coupons
Coupon card
distribution
Number Percent Number Percent Number Percent
Kurigram
Nageswari 15 6,924 58 5,590 59 4,284 53
Bhurungamari 10 2,584 22 1,812 19 1,812 22
Chilmari 6 2,320 20 2,059 22 2,059 25
Sub-total 31 11,828 100 99,461 100 88,155 100
Identified as poor for receiving coupon out of total pregnant women in Kurigram 80%
Coupon distribution out of total identified poor pregnant women in Kurigram 86%
Gaibandha
Sunderganj 15 3,900 43 3,059 45 3,059 45
Shaghata 10 3,071 34 2,488 37 2,488 37
Fulchari 7 2,034 23 1,259 18 1,259 18
Sub-total 32 9,005 100 66,806 100 66,806 100
Identified as poor for receiving coupon out of total pregnant women in Gaibandha 76%
Coupon distribution out of total identified poor pregnant women in Gaibandha 100%
Total 63 20,833
166,267 14,9961
Identified as poor for receiving coupon out of total pregnant women 78%
Coupon distribution out of total identified poor pregnant women 92% Three-fourths of the poor pregnant women were identified as eligible for coupon distribution; and of them, 92 percent received coupons from the government fieldworkers (Table 3). Although half of the pregnant women were initially thought to become eligible for a coupon, the proportion of eligible women turned out to be as high as 78 percent, primarily because these are poor communities. Coupon card distribution started in January and February 2011 in Kurigram but was delayed in Gaibandha until March 2011. Gaibandha District Hospital could not start financial operations because its Civil Surgeon In-Charge did not have the financial authority. Another batch of coupon cards was distributed from April to July 2011.
Coupons were distributed only among the 77 percent of the eligible poor pregnant women in Nageswari of Kurigram due to unavailability of willing and active fieldworkers. In Gaibandha, coupons were distributed using NGO workers in the case of unavailability of the government workers, but this was not entirely possible in Kurigram because the NGO operation is relatively recent in the area.
P4P Final Report 17
Due to poor utilization rates of coupon beneficiaries, 284 fieldworkers were oriented and engaged for coupon promotion and validation of the coupon distribution activities in Gaibandha and Kurigram districts, in September 2011. Gaibandha employed only the NGO workers, including BRAC Shasthyo Shebikas (health volunteers) and Friendship NGO workers while Kurigram engaged a few Health Assistants in Nageswari and Chilmari upazilas.
VVALIDATION OF COUPON DISTRIBUTION
Three-fifths of the total 14,961 coupon card holders were interviewed in order to validate the coupon card distribution, and to know about the utilization and reasons for non-use. About 88 percent (n=4060) in Gaibandha and 72 percent (n=3057) coupon card holders in Kurigram reported receiving the coupons. The others either damaged or lost the cards or did not receive the cards from the workers.
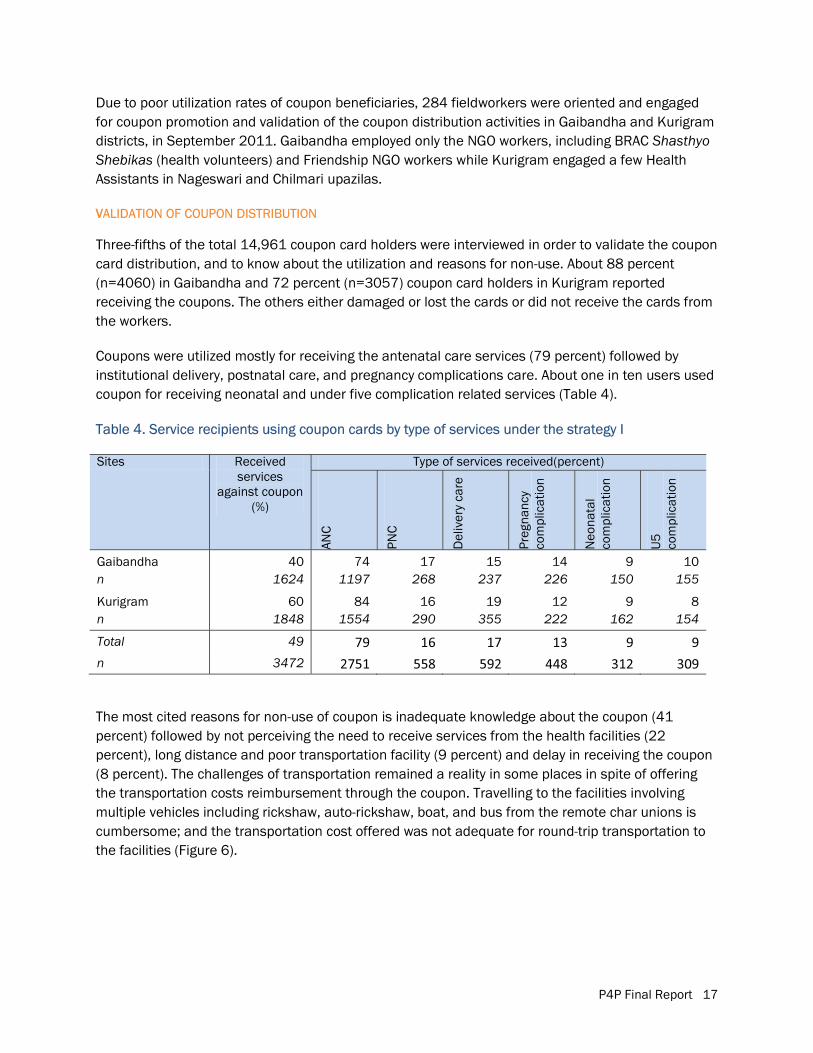
Coupons were utilized mostly for receiving the antenatal care services (79 percent) followed by institutional delivery, postnatal care, and pregnancy complications care. About one in ten users used coupon for receiving neonatal and under five complication related services (Table 4).
Table 4. Service recipients using coupon cards by type of services under the strategy I
Sites Received services
against coupon (%)
Type of services received(percent)
ANC
PNC
Del
iver
y ca
re
Preg
nanc
y co
mpl
icat
ion
Neo
nata
l co
mpl
icat
ion
U5
co
mpl
icat
ion
Gaibandha 40 74 17 15 14 9 10 n 1624 1197 268 237 226 150 155
Kurigram 60 84 16 19 12 9 8 n 1848 1554 290 355 222 162 154
Total 49 79 16 17 13 9 9 n 3472 2751 558 592 448 312 309
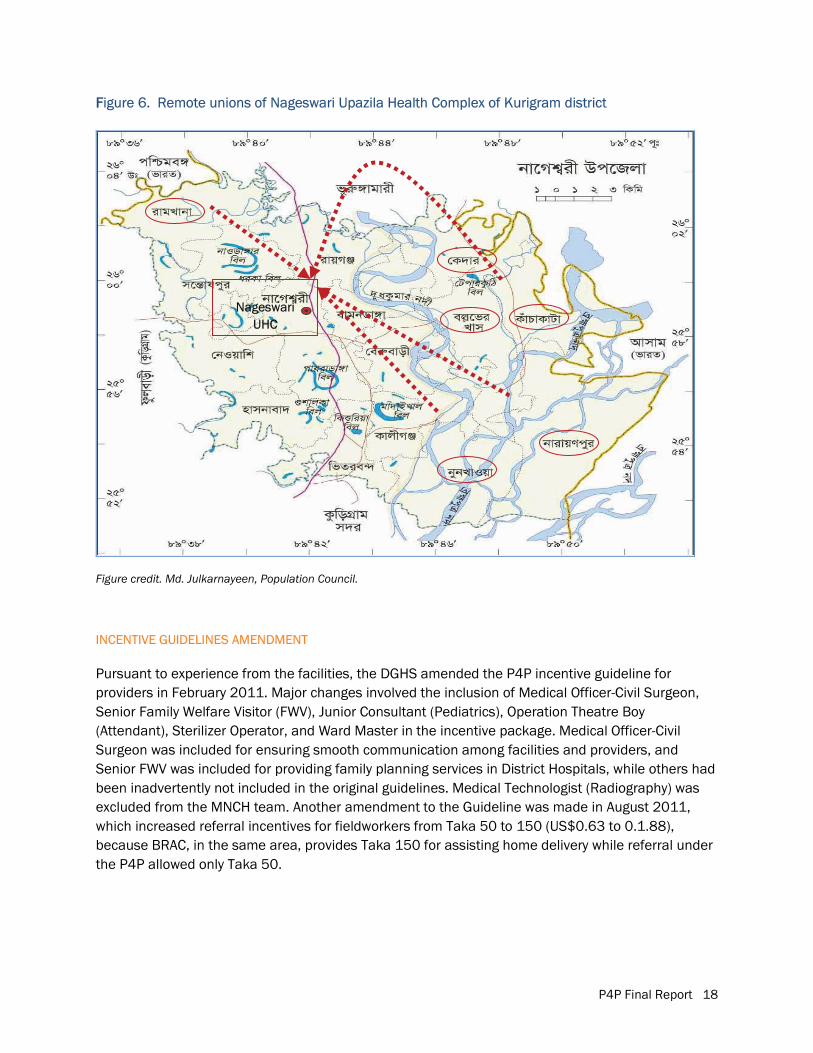
The most cited reasons for non-use of coupon is inadequate knowledge about the coupon (41 percent) followed by not perceiving the need to receive services from the health facilities (22 percent), long distance and poor transportation facility (9 percent) and delay in receiving the coupon (8 percent). The challenges of transportation remained a reality in some places in spite of offering the transportation costs reimbursement through the coupon. Travelling to the facilities involving multiple vehicles including rickshaw, auto-rickshaw, boat, and bus from the remote char unions is cumbersome; and the transportation cost offered was not adequate for round-trip transportation to the facilities (Figure 6).
P4P Final Report 18
FFigure 6. Remote unions of Nageswari Upazila Health Complex of Kurigram district
Figure credit. Md. Julkarnayeen, Population Council.
INCENTIVE GUIDELINES AMENDMENT
Pursuant to experience from the facilities, the DGHS amended the P4P incentive guideline for providers in February 2011. Major changes involved the inclusion of Medical Officer-Civil Surgeon, Senior Family Welfare Visitor (FWV), Junior Consultant (Pediatrics), Operation Theatre Boy (Attendant), Sterilizer Operator, and Ward Master in the incentive package. Medical Officer-Civil Surgeon was included for ensuring smooth communication among facilities and providers, and Senior FWV was included for providing family planning services in District Hospitals, while others had been inadvertently not included in the original guidelines. Medical Technologist (Radiography) was excluded from the MNCH team. Another amendment to the Guideline was made in August 2011, which increased referral incentives for fieldworkers from Taka 50 to 150 (US$0.63 to 0.1.88), because BRAC, in the same area, provides Taka 150 for assisting home delivery while referral under the P4P allowed only Taka 50.
Nageswari UHC
P4P Final Report 19
RREVIEW MEETING WITH NGO PARTNERS
A review meeting with UNICEF and NGO partners, BRAC and CARE Bangladesh, was held in Dhaka in April 2011. As BRAC also incentivizes poor clients, participants discussed how to avoid duplication, as well as coupon distribution, the referral system, and NGO worker orientation. Considering the insufficiency of one-way transportation cost reimbursement, it was decided that a coupon beneficiary who is also a BRAC beneficiary will be reimbursed from both BRAC and P4P project in order to help her covering the round-trip transportation cost. BRAC staff will ensure that there is no duplication in providing medicines free of cost to such clients. BRAC is unable to reach all the poor clients with the full benefit due to fund limitation; therefore, the P4P and BRAC initiatives are complementary and not wastage of the resources. Since P4P study tests supply-side versus demand-plus-supply-side approaches, subsidies by both BRAC and P4P will not affect the P4P study design, although added advantage of client incentives will not be separately attributable to either BRAC’s MNCH or the P4P project.
FACILITY FUND MANAGEMENT
The 12 facilities under the Arms 1 and 2 spent US$432,913 from October 2010 to November 2011. This amount represents the incremental expenditures incurred in addition to the usual government and UNICEF funding. Since no incremental cost has been incurred, the comparison facility costs have not been analyzed. To help settle advance funds, the Council arranged and paid for training and on-the-job training. The trainers visited all the three districts to train and help facilities in fund disbursement upon expense incurred. An audit firm verified the facility expense reports before liquidation. Eight facilities of strategy I and four facilities of strategy II spent $262,495 (61 percent) and $170,418 (39 percent), respectively. On average, each facility under strategy I spent $32,812 while each facility under strategy II spent $42,605 over the 14-month intervention period. The total average expenditures of the strategy II facilities are higher because the facilities spent from about one and a half times to twice the amount spent for incentive payments to the providers, referral incentives payments to the fieldworkers, and for purchasing supplies, consumables and maintenance.
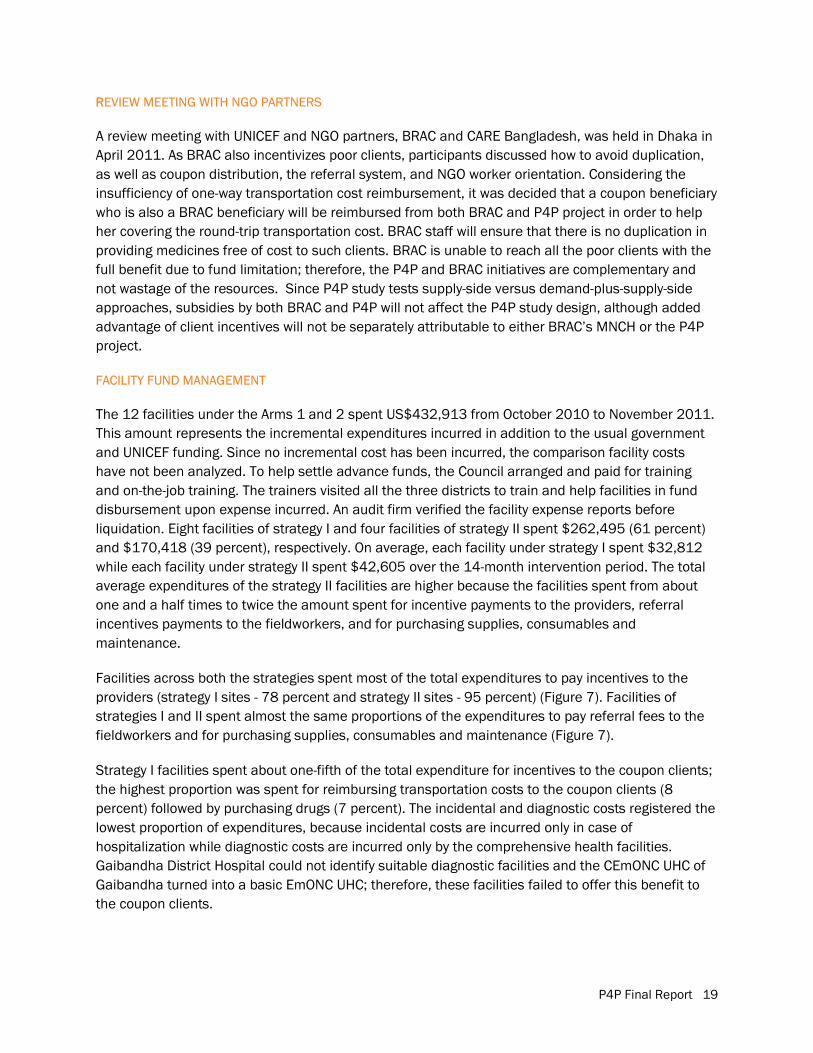
Facilities across both the strategies spent most of the total expenditures to pay incentives to the providers (strategy I sites - 78 percent and strategy II sites - 95 percent) (Figure 7). Facilities of strategies I and II spent almost the same proportions of the expenditures to pay referral fees to the fieldworkers and for purchasing supplies, consumables and maintenance (Figure 7).
Strategy I facilities spent about one-fifth of the total expenditure for incentives to the coupon clients; the highest proportion was spent for reimbursing transportation costs to the coupon clients (8 percent) followed by purchasing drugs (7 percent). The incidental and diagnostic costs registered the lowest proportion of expenditures, because incidental costs are incurred only in case of hospitalization while diagnostic costs are incurred only by the comprehensive health facilities. Gaibandha District Hospital could not identify suitable diagnostic facilities and the CEmONC UHC of Gaibandha turned into a basic EmONC UHC; therefore, these facilities failed to offer this benefit to the coupon clients.
P4P Final Report 20
FFigure 7. Distribution of liquidated expenses according to the head of expenditure across strategies
VALIDATION OF INCENTIVE PAYMENT AND RECEIVING SERVICES FROM THE FACILITY
An audit firm investigated if the facilities correctly reported the number of clients of MNCH services, and validated if the coupon clients received the intended benefits.
A total of 1,026 clients were selected from the facility registers; of them, 96 percent were available for interview. All the clients reported receiving services from the facilities. Four-fifths of the respondents reported receiving drugs; the rate was universal in Jamalpur (99 percent), followed by Kurigram (84 percent) while over two-fifth participants in Gaibandha reported not receiving any medicine. No clients reported receiving diagnostic services in Gaibandha and Jamalpur, and only 11 percent received them in Kurigram. All the facilities lagged behind in providing diagnostic services. In spite of having incentive funding for providing diagnostic services, facilities under strategy I failed to provide these important services to the clients. The UHCs are supposed to provide the diagnostic services free of cost while the DHs realize expenses for providing this service. The CEmONC facilities of strategy I sites were encouraged to sign contracts with outside facilities in order to provide the sonography (ultrasonography) services. But only one out of the three CEmONC facilities signed a contract with diagnostic service centers. The diagnostic service centers were non-cooperative over the payment of value added tax (VAT), without which contracts could not be signed between the facilities and diagnostic centers. Interestingly, the reported level of satisfaction with the services is the highest in Gaibandha (92 percent) followed by Kurigram (75 percent), and Jamalpur (61 percent).
Ten percent of coupon clients (n=941) during April to September 2011 were randomly selected and validated if they had had received the intended benefits. About two-thirds of the coupon clients reported receiving medicines (three-fourth in Kurigram and about half in Gaibandha). Almost all the coupon clients (95 percent) received the transportation cost but only one in ten reported receiving the diagnostic cost. Overall, nine in 10 coupon clients reported satisfaction with the services.
P4P Final Report 21
EEVALUATION ACTIVITIES FACILITY MIS
Facility based management information system (MIS) data have been collected from the 15 facilities for 26 months, from October 2009 to November 2011. The MIS data have been extracted from the monthly reports and registers maintained at the facilities. Council researchers collected the information directly from the facilities in cooperation with the facility staff. District Coordinators monitored the data collection and a Data Management Specialist collated and checked quality of the data for consistency and accuracy. The MIS data on monthly performance have been the key to the measurement of the quantitative targets pursued and achieved by the facilities, and for evaluating the MNCH service delivery in terms of quantity across facilities and strategies. The facilities, administered by the DGHS, do not usually record data on family planning counseling, therefore, a form to record this information was developed, which was administered at all the study sites. Strengthening the MIS may result in increasing the reporting and act as a confounder. In order to avoid such bias, MIS support was provided to all the facilities at the same time. However, the data collectors were not blinded because two data collectors per district had to be stationed at the district level for continuous and multiple data collection activities who knew about the on-going facility activities. However, they were part of the evaluation team, and remained detached from the intervention activity facilitators.
QAG VISITS
The QAGs made five quarterly visits at the 12 facilities from October 2010 to December 2011. The QAG members administered three types of QoC checklists appropriate for the District Hospitals, UHCs providing comprehensive EmONC services, and UHCs providing or basic EmONC services. QAG visits were not made at the comparison sites. Therefore, quality of care measured by the specialists is compared only across the intervention districts and strategies.
PROVIDERS’ SURVEY
Separate samples of providers were interviewed for baseline (n=272) and endline surveys (n=201) from the 15 facilities using a semi-structured questionnaire on motivation and problems faced in carrying out the MNCH services (see Table 5). Survey participants included managers and direct providers including the doctors, consultants and nurses. Data have been entered and analyzed using the SPSS program. The samples are not significantly different, both between the three arms and over time, except that more managers participated in the baseline survey at the strategy I facilities than in strategy II sites; and more males participated in the end line relative to the baseline survey at the comparison facilities than at the strategy I facilities (Table 5).
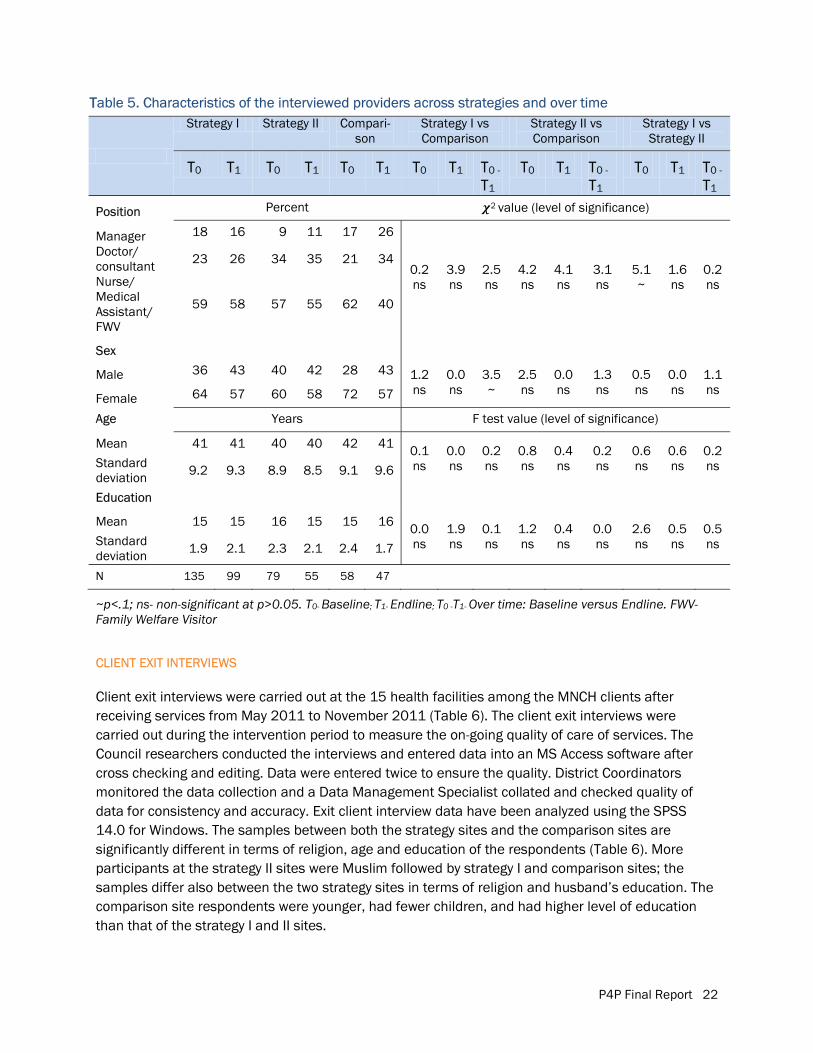
P4P Final Report 22
TTable 5. Characteristics of the interviewed providers across strategies and over time
Strategy I Strategy II Compari-son
Strategy I vs Comparison
Strategy II vs Comparison
Strategy I vs Strategy II
T0 T1 T0 T1 T0 T1 T0 T1 T0 -
T1 T0 T1 T0 -
T1 T0 T1 T0 -
T1
Position Percent 2 value (level of significance)
Manager 18 16 9 11 17 26
0.2 ns
3.9 ns
2.5 ns
4.2 ns
4.1 ns
3.1 ns
5.1~
1.6 ns
0.2 ns
Doctor/ consultant 23 26 34 35 21 34
Nurse/ Medical Assistant/ FWV
59 58 57 55 62 40
Sex
Male 36 43 40 42 28 43 1.2 ns
0.0 ns
3.5~
2.5 ns
0.0 ns
1.3 ns
0.5 ns
0.0 ns
1.1 ns
Female 64 57 60 58 72 57
Age Years F test value (level of significance)
Mean 41 41 40 40 42 41 0.1 ns
0.0 ns
0.2 ns
0.8 ns
0.4 ns
0.2 ns
0.6 ns
0.6 ns
0.2 ns Standard
deviation 9.2 9.3 8.9 8.5 9.1 9.6
Education
Mean 15 15 16 15 15 16 0.0 ns
1.9 ns
0.1 ns
1.2 ns
0.4 ns
0.0 ns
2.6 ns
0.5 ns
0.5 ns Standard
deviation 1.9 2.1 2.3 2.1 2.4 1.7
N 135 99 79 55 58 47
~p<.1; ns- non-significant at p>0.05. T0- Baseline; T1- Endline; T0 -T1- Over time: Baseline versus Endline. FWV- Family Welfare Visitor
CLIENT EXIT INTERVIEWS
Client exit interviews were carried out at the 15 health facilities among the MNCH clients after receiving services from May 2011 to November 2011 (Table 6). The client exit interviews were carried out during the intervention period to measure the on-going quality of care of services. The Council researchers conducted the interviews and entered data into an MS Access software after cross checking and editing. Data were entered twice to ensure the quality. District Coordinators monitored the data collection and a Data Management Specialist collated and checked quality of data for consistency and accuracy. Exit client interview data have been analyzed using the SPSS 14.0 for Windows. The samples between both the strategy sites and the comparison sites are significantly different in terms of religion, age and education of the respondents (Table 6). More participants at the strategy II sites were Muslim followed by strategy I and comparison sites; the samples differ also between the two strategy sites in terms of religion and husband’s education. The comparison site respondents were younger, had fewer children, and had higher level of education than that of the strategy I and II sites.
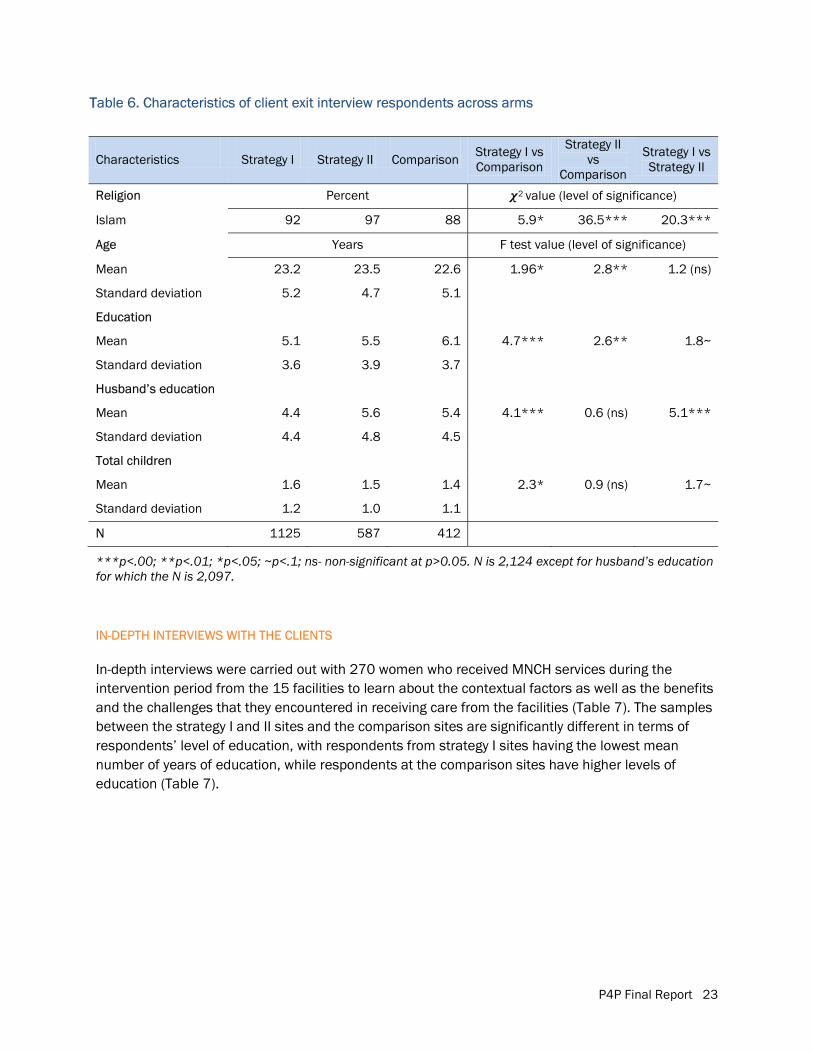
P4P Final Report 23
TTable 6. Characteristics of client exit interview respondents across arms
Characteristics Strategy I Strategy II Comparison Strategy I vs Comparison
Strategy II vs
Comparison
Strategy I vs Strategy II
Religion Percent 2 value (level of significance)
Islam 92 97 88 5.9* 36.5*** 20.3***
Age Years F test value (level of significance)
Mean 23.2 23.5 22.6 1.96* 2.8** 1.2 (ns)
Standard deviation 5.2 4.7 5.1
Education
Mean 5.1 5.5 6.1 4.7*** 2.6** 1.8~
Standard deviation 3.6 3.9 3.7
Husband’s education
Mean 4.4 5.6 5.4 4.1*** 0.6 (ns) 5.1***
Standard deviation 4.4 4.8 4.5
Total children
Mean 1.6 1.5 1.4 2.3* 0.9 (ns) 1.7~
Standard deviation 1.2 1.0 1.1
N 1125 587 412
***p<.00; **p<.01; *p<.05; ~p<.1; ns- non-significant at p>0.05. N is 2,124 except for husband’s education for which the N is 2,097.
IN-DEPTH INTERVIEWS WITH THE CLIENTS
In-depth interviews were carried out with 270 women who received MNCH services during the intervention period from the 15 facilities to learn about the contextual factors as well as the benefits and the challenges that they encountered in receiving care from the facilities (Table 7). The samples between the strategy I and II sites and the comparison sites are significantly different in terms of respondents’ level of education, with respondents from strategy I sites having the lowest mean number of years of education, while respondents at the comparison sites have higher levels of education (Table 7).
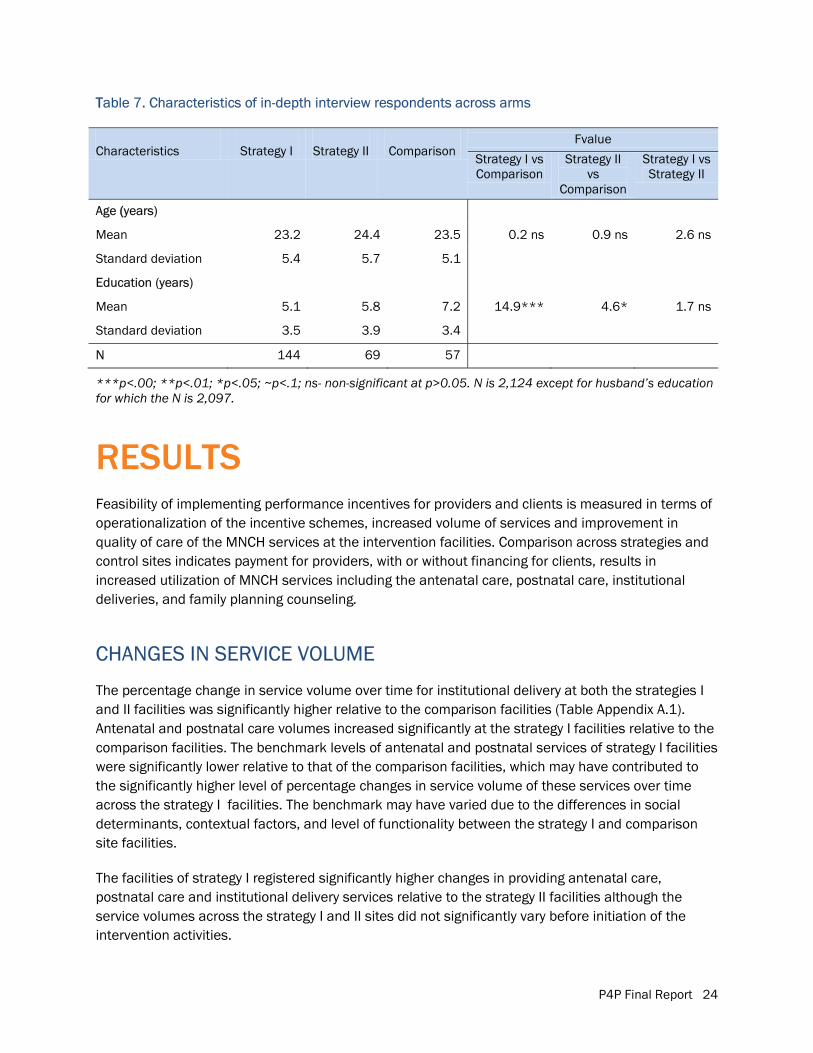
P4P Final Report 24
TTable 7. Characteristics of in-depth interview respondents across arms
Characteristics Strategy I Strategy II Comparison Fvalue
Strategy I vs Comparison
Strategy II vs
Comparison
Strategy I vs Strategy II
Age ((years)
Mean 23.2 24.4 23.5 0.2 ns 0.9 ns 2.6 ns
Standard deviation 5.4 5.7 5.1
Education (years)
Mean 5.1 5.8 7.2 14.9*** 4.6* 1.7 ns
Standard deviation 3.5 3.9 3.4
N 144 69 57
***p<.00; **p<.01; *p<.05; ~p<.1; ns- non-significant at p>0.05. N is 2,124 except for husband’s education for which the N is 2,097.
RESULTS Feasibility of implementing performance incentives for providers and clients is measured in terms of operationalization of the incentive schemes, increased volume of services and improvement in quality of care of the MNCH services at the intervention facilities. Comparison across strategies and control sites indicates payment for providers, with or without financing for clients, results in increased utilization of MNCH services including the antenatal care, postnatal care, institutional deliveries, and family planning counseling.
CHANGES IN SERVICE VOLUME
The percentage change in service volume over time for institutional delivery at both the strategies I and II facilities was significantly higher relative to the comparison facilities (Table Appendix A.1). Antenatal and postnatal care volumes increased significantly at the strategy I facilities relative to the comparison facilities. The benchmark levels of antenatal and postnatal services of strategy I facilities were significantly lower relative to that of the comparison facilities, which may have contributed to the significantly higher level of percentage changes in service volume of these services over time across the strategy I facilities. The benchmark may have varied due to the differences in social determinants, contextual factors, and level of functionality between the strategy I and comparison site facilities.
The facilities of strategy I registered significantly higher changes in providing antenatal care, postnatal care and institutional delivery services relative to the strategy II facilities although the service volumes across the strategy I and II sites did not significantly vary before initiation of the intervention activities.
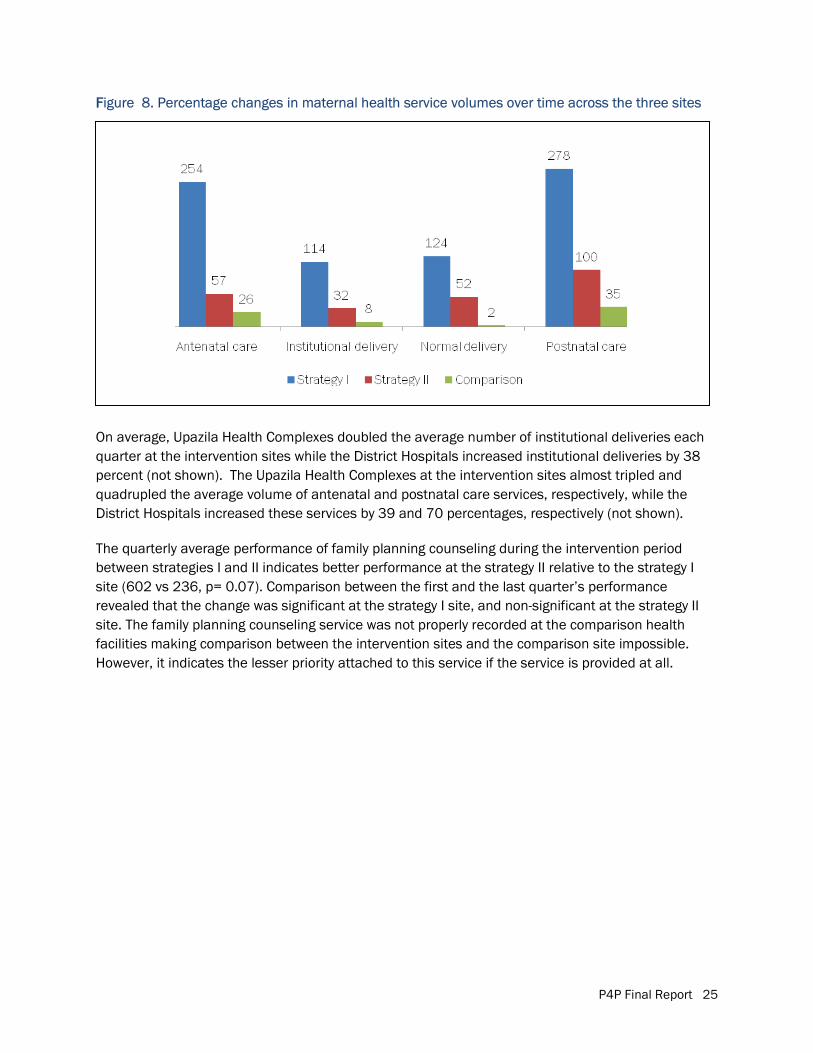
P4P Final Report 25
FFigure 8. Percentage changes in maternal health service volumes over time across the three sites
On average, Upazila Health Complexes doubled the average number of institutional deliveries each quarter at the intervention sites while the District Hospitals increased institutional deliveries by 38 percent (not shown). The Upazila Health Complexes at the intervention sites almost tripled and quadrupled the average volume of antenatal and postnatal care services, respectively, while the District Hospitals increased these services by 39 and 70 percentages, respectively (not shown).
The quarterly average performance of family planning counseling during the intervention period between strategies I and II indicates better performance at the strategy II relative to the strategy I site (602 vs 236, p= 0.07). Comparison between the first and the last quarter’s performance revealed that the change was significant at the strategy I site, and non-significant at the strategy II site. The family planning counseling service was not properly recorded at the comparison health facilities making comparison between the intervention sites and the comparison site impossible. However, it indicates the lesser priority attached to this service if the service is provided at all.
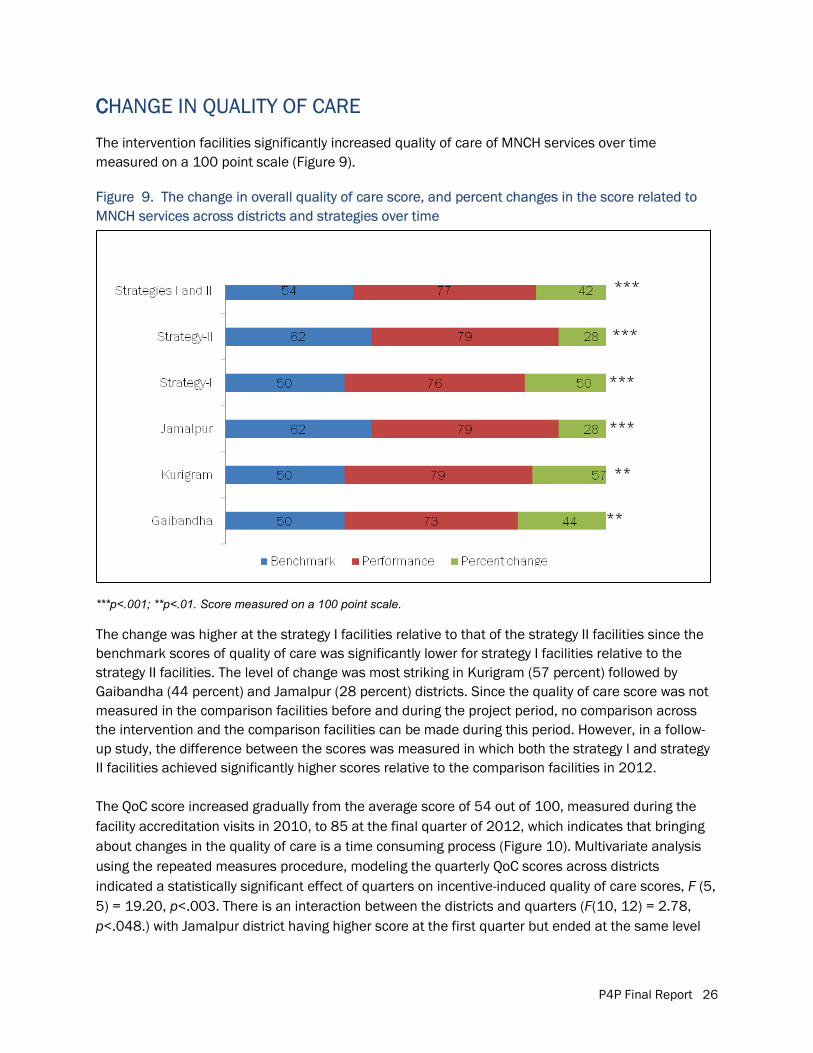
P4P Final Report 26
CCHANGE IN QUALITY OF CARE
The intervention facilities significantly increased quality of care of MNCH services over time measured on a 100 point scale (Figure 9).
Figure 9. The change in overall quality of care score, and percent changes in the score related to MNCH services across districts and strategies over time
***p<.001; **p<.01. Score measured on a 100 point scale.
The change was higher at the strategy I facilities relative to that of the strategy II facilities since the benchmark scores of quality of care was significantly lower for strategy I facilities relative to the strategy II facilities. The level of change was most striking in Kurigram (57 percent) followed by Gaibandha (44 percent) and Jamalpur (28 percent) districts. Since the quality of care score was not measured in the comparison facilities before and during the project period, no comparison across the intervention and the comparison facilities can be made during this period. However, in a follow-up study, the difference between the scores was measured in which both the strategy I and strategy II facilities achieved significantly higher scores relative to the comparison facilities in 2012.
The QoC score increased gradually from the average score of 54 out of 100, measured during the facility accreditation visits in 2010, to 85 at the final quarter of 2012, which indicates that bringing about changes in the quality of care is a time consuming process (Figure 10). Multivariate analysis using the repeated measures procedure, modeling the quarterly QoC scores across districts indicated a statistically significant effect of quarters on incentive-induced quality of care scores, F (5, 5) = 19.20, p<.003. There is an interaction between the districts and quarters (F(10, 12) = 2.78, p<.048.) with Jamalpur district having higher score at the first quarter but ended at the same level
***
***
***
***
**
**
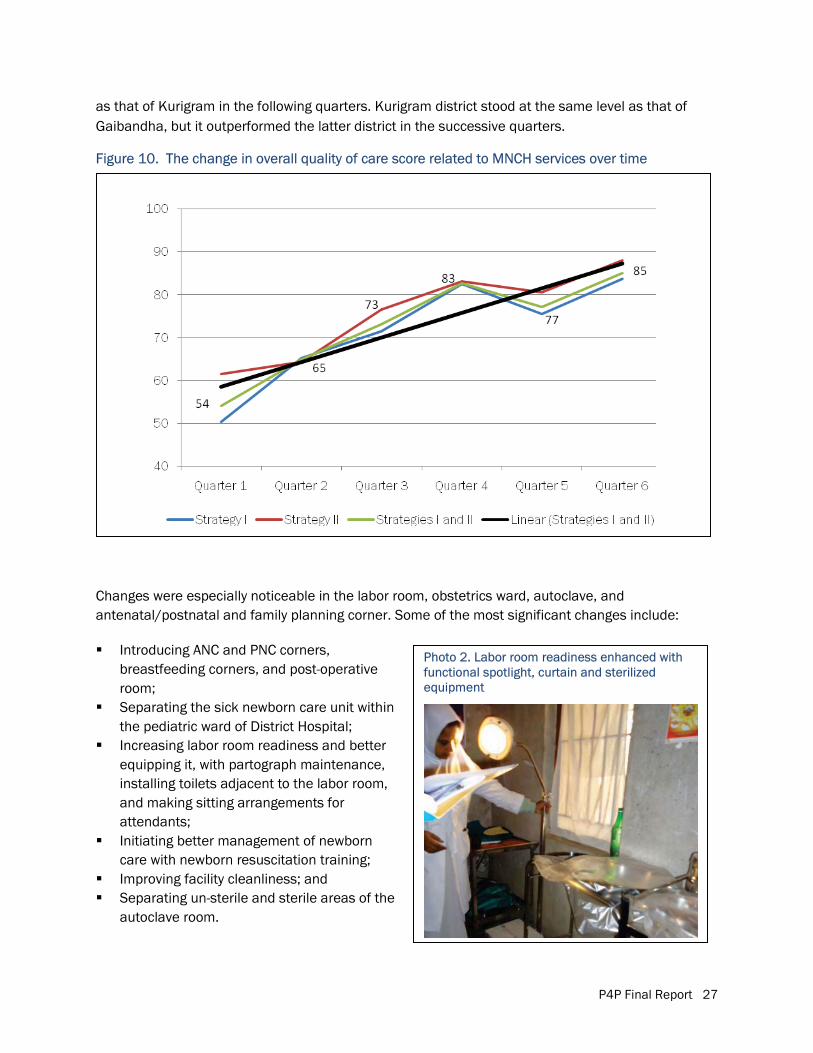
P4P Final Report 27
Photo 2. Labor room readiness enhanced with functional spotlight, curtain and sterilized equipment
as that of Kurigram in the following quarters. Kurigram district stood at the same level as that of Gaibandha, but it outperformed the latter district in the successive quarters.
Figure 10. The change in overall quality of care score related to MNCH services over time
Changes were especially noticeable in the labor room, obstetrics ward, autoclave, and antenatal/postnatal and family planning corner. Some of the most significant changes include:
� Introducing ANC and PNC corners, breastfeeding corners, and post-operative room;
� Separating the sick newborn care unit within the pediatric ward of District Hospital;
� Increasing labor room readiness and better equipping it, with partograph maintenance, installing toilets adjacent to the labor room, and making sitting arrangements for attendants;
� Initiating better management of newborn care with newborn resuscitation training;
� Improving facility cleanliness; and � Separating un-sterile and sterile areas of the
autoclave room.
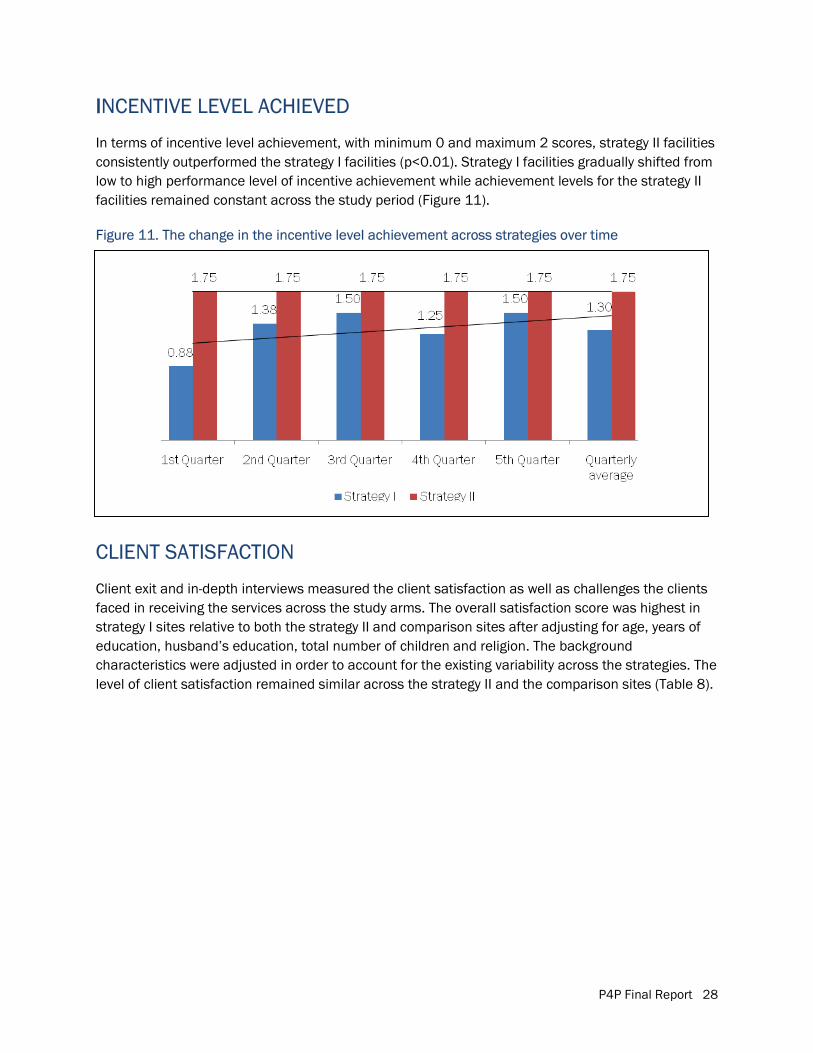
P4P Final Report 28
IINCENTIVE LEVEL ACHIEVED
In terms of incentive level achievement, with minimum 0 and maximum 2 scores, strategy II facilities consistently outperformed the strategy I facilities (p<0.01). Strategy I facilities gradually shifted from low to high performance level of incentive achievement while achievement levels for the strategy II facilities remained constant across the study period (Figure 11).
Figure 11. The change in the incentive level achievement across strategies over time
CLIENT SATISFACTION
Client exit and in-depth interviews measured the client satisfaction as well as challenges the clients faced in receiving the services across the study arms. The overall satisfaction score was highest in strategy I sites relative to both the strategy II and comparison sites after adjusting for age, years of education, husband’s education, total number of children and religion. The background characteristics were adjusted in order to account for the existing variability across the strategies. The level of client satisfaction remained similar across the strategy II and the comparison sites (Table 8).
P4P Final Report 29
Photo 3. Maternal, newborn and child health coupon card allowed poor clients better access to services
Table 8. Mean and mean difference on client satisfaction with MNCH services across arms
Arm
Mean
Std. Error
95% Confidence Interval Lower Bound Upper Bound
Strategy-I 2.16 .07 2.02 2.31
Strategy-II 1.60 .18 1.26 1.95
Comparison 1.71 .10 1.51 1.91
Comparison between arms
Mean Difference
(significancea)
Std. Error
95% Confidence Interval for Difference
Lower Bound Upper Bound
Strategy I versus Comparison
.45*
(.001) .13 .15 .75
Strategy II versus Comparison
-.11
(1.00) .20 -.59 .38
Strategy I versus Strategy II
.56*
(.01) .19 .100 1.01
* The mean difference is significant at the .05 level. a Adjustment for multiple comparisons: Bonferroni. F (9, 2087) = 13.66, p<.000. The model adjusted for age, education, total number of children, husband’s education and religion.
The individual items on level of client satisfaction revealed that offering free-of-cost services and medicines, and not requiring extra money have caused higher satisfaction level at the strategy I sites (Table 9). However, the strategy II and the comparison facilities performed better in terms of providers’ behavior relative to strategy I sites. The client satisfaction level was significantly lower at the strategy II sites relative to the strategy I sites except for the satisfaction that was reported due to providers’ good behavior while the differences between the strategy II sites and the comparison sites were not significant.
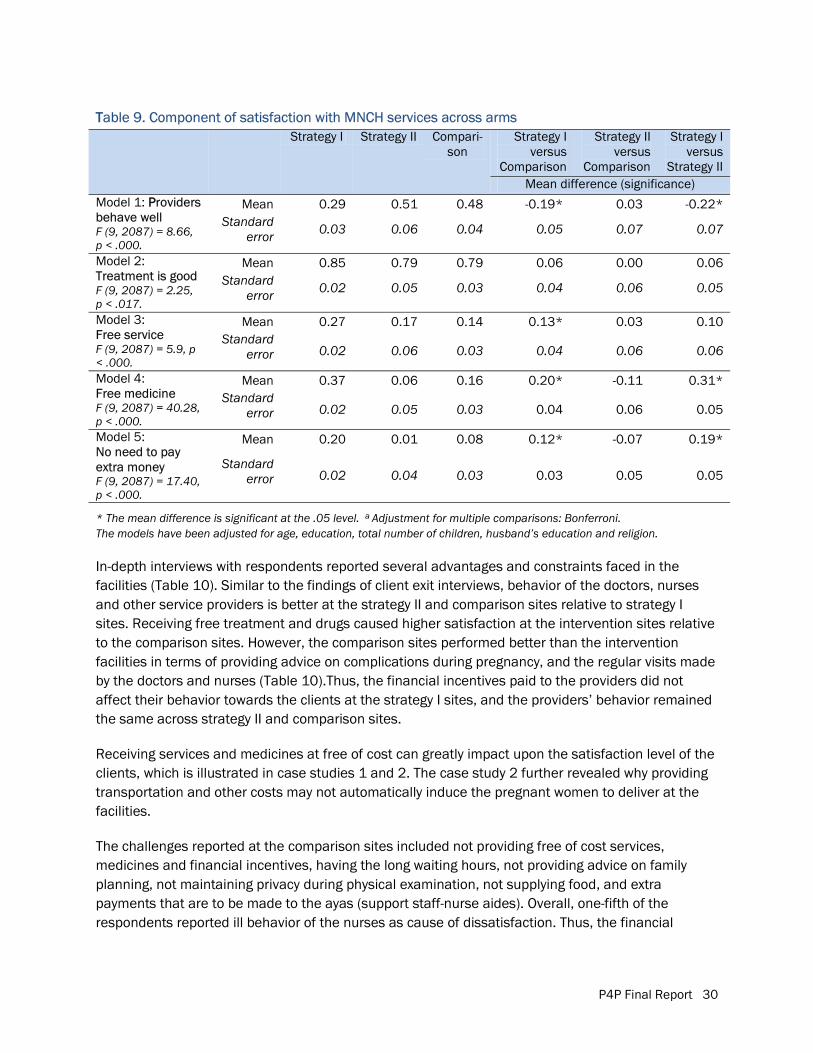
P4P Final Report 30
TTable 9. Component of satisfaction with MNCH services across arms Strategy I Strategy II Compari-
son Strategy I
versus Comparison
Strategy II versus
Comparison
Strategy I versus
Strategy II Mean difference (significance)
Model 1: PProviders behave well F (9, 2087) = 8.66, p < .000.
Mean 0.29 0.51 0.48 -0.19* 0.03 -0.22* Standard
error 0.03 0.06 0.04 0.05 0.07 0.07
Model 2: Treatment is good F (9, 2087) = 2.25, p < .017.
Mean 0.85 0.79 0.79 0.06 0.00 0.06 Standard
error 0.02 0.05 0.03 0.04 0.06 0.05
Model 3: Free service F (9, 2087) = 5.9, p < .000.
Mean 0.27 0.17 0.14 0.13* 0.03 0.10 Standard
error 0.02 0.06 0.03 0.04 0.06 0.06
Model 4: Free medicine F (9, 2087) = 40.28, p < .000.
Mean 0.37 0.06 0.16 0.20* -0.11 0.31* Standard
error 0.02 0.05 0.03 0.04 0.06 0.05
Model 5: No need to pay extra money F (9, 2087) = 17.40, p < .000.
Mean 0.20 0.01 0.08 0.12* -0.07 0.19*
Standard error 0.02 0.04 0.03 0.03 0.05 0.05
* The mean difference is significant at the .05 level. a Adjustment for multiple comparisons: Bonferroni. The models have been adjusted for age, education, total number of children, husband’s education and religion.
In-depth interviews with respondents reported several advantages and constraints faced in the facilities (Table 10). Similar to the findings of client exit interviews, behavior of the doctors, nurses and other service providers is better at the strategy II and comparison sites relative to strategy I sites. Receiving free treatment and drugs caused higher satisfaction at the intervention sites relative to the comparison sites. However, the comparison sites performed better than the intervention facilities in terms of providing advice on complications during pregnancy, and the regular visits made by the doctors and nurses (Table 10).Thus, the financial incentives paid to the providers did not affect their behavior towards the clients at the strategy I sites, and the providers’ behavior remained the same across strategy II and comparison sites.
Receiving services and medicines at free of cost can greatly impact upon the satisfaction level of the clients, which is illustrated in case studies 1 and 2. The case study 2 further revealed why providing transportation and other costs may not automatically induce the pregnant women to deliver at the facilities.
The challenges reported at the comparison sites included not providing free of cost services, medicines and financial incentives, having the long waiting hours, not providing advice on family planning, not maintaining privacy during physical examination, not supplying food, and extra payments that are to be made to the ayas (support staff-nurse aides). Overall, one-fifth of the respondents reported ill behavior of the nurses as cause of dissatisfaction. Thus, the financial
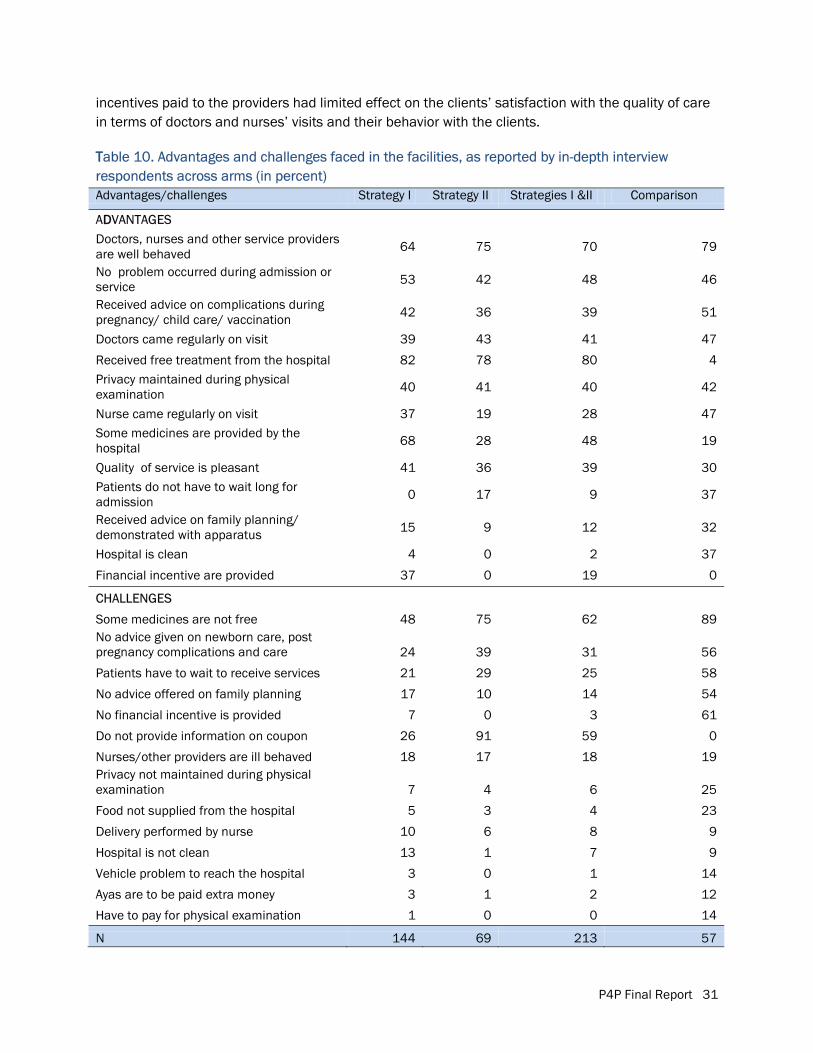
P4P Final Report 31
incentives paid to the providers had limited effect on the clients’ satisfaction with the quality of care in terms of doctors and nurses’ visits and their behavior with the clients.
TTable 10. Advantages and challenges faced in the facilities, as reported by in-depth interview respondents across arms (in percent) Advantages/challenges Strategy I Strategy II Strategies I &II Comparison
ADDVANTAGES Doctors, nurses and other service providers are well behaved 64 75 70 79
No problem occurred during admission or service 53 42 48 46
Received advice on complications during pregnancy/ child care/ vaccination 42 36 39 51
Doctors came regularly on visit 39 43 41 47
Received free treatment from the hospital 82 78 80 4 Privacy maintained during physical examination 40 41 40 42
Nurse came regularly on visit 37 19 28 47 Some medicines are provided by the hospital 68 28 48 19
Quality of service is pleasant 41 36 39 30 Patients do not have to wait long for admission 0 17 9 37
Received advice on family planning/ demonstrated with apparatus 15 9 12 32
Hospital is clean 4 0 2 37
Financial incentive are provided 37 0 19 0
CHALLENGES
Some medicines are not free 48 75 62 89 No advice given on newborn care, post pregnancy complications and care 24 39 31 56
Patients have to wait to receive services 21 29 25 58
No advice offered on family planning 17 10 14 54
No financial incentive is provided 7 0 3 61
Do not provide information on coupon 26 91 59 0
Nurses/other providers are ill behaved 18 17 18 19 Privacy not maintained during physical examination 7 4 6 25
Food not supplied from the hospital 5 3 4 23
Delivery performed by nurse 10 6 8 9
Hospital is not clean 13 1 7 9
Vehicle problem to reach the hospital 3 0 1 14
Ayas are to be paid extra money 3 1 2 12
Have to pay for physical examination 1 0 0 14
N 144 69 213 57
P4P Final Report 32
CCase study 1: Delivering a baby at a facility that provides quality of care
After having the first delivery at home, Nileema (fictitious name) got admitted to an Upazila Health Complex facility for her second delivery. She has been coming to the facility to receive antenatal care services since her early pregnancy every month. In each check up, either a doctor or a nurse examined her pulse, weight and position of the baby. Doctors advised her on pregnancy planning and preparation. She wanted to deliver at home, as she did during birth of her first child. But when she met with prolonged labor pain, she was taken to the hospital. The doctors examined her, administered with injection and waited for 3-4 hours. Finally, she had to undergo a cesarean section. Five service providers including two doctors and nurses were present at the time of operation. After operation, Nileema stayed at the hospital for 6 days. Doctors and nurses visited her regularly and advised her on post pregnancy complications and newborn care. She is satisfied with the overall condition of the hospital and quality of care received from the facility.
Since Nileema had to pay for the medicines only, she viewed this as a free-of-cost service. She reported full satisfaction with the behavior of the doctors, nurses and other service providers. According to her, quality of service has improved at the facility, especially due to expansion of service provision, such as, cesarean section. The cost of operation at the facility is much lower relative to that of a private clinic.
(Case profile: 23-year old married female, mother of two children, housewife, completed ninth grade of education)
Case study 2: Patients’ readiness– a key to utilization of subsidized cost services against coupon
Salma (fictitious name), a mother of three, gave birth to all of her children at home. After getting referred by a fieldworker, she visited the hospital in order to receive antenatal care during her last pregnancy. Salma reported improvement in the services of the facility relative to the previous years because during one of her previous pregnancies, she came to the hospital, but the provider did not attend her. This time, the nurse behaved well; she measured weight and pressure, advised her on pregnancy complications and handed some iron tablets for free. She was advised to get admitted in the hospital when her water broke. For being a coupon card holder, she received transportation cost of Taka 100 (US$1.25) - she was very pleased with the money. However, she had to wait long before receiving the service, and privacy was not maintained during the physical examination.
Despite having a coupon card that offers transportation cost, medicines and incidental costs, Salma decided to deliver at home with her mother-in-law performing the delivery. She and the baby were healthy after the labor. However, when the child was 14-day old, she started suffering from convulsion and had to be rushed to the hospital. The child was hospitalized for 3 days. The treatment cost was not much, and the entire expenses were later reimbursed with the coupon card. Doctors and nurses came on regular visits and behaved well. Salma was satisfied with the services that her baby received except for an initial delay occurred during the admission. Earlier she used to visit a doctor at the market place, but upon receiving the coupon she started visiting the hospital.
(Case profile: 26-year old married female, mother of three children, handicraft artist, completed 5th grade of education)
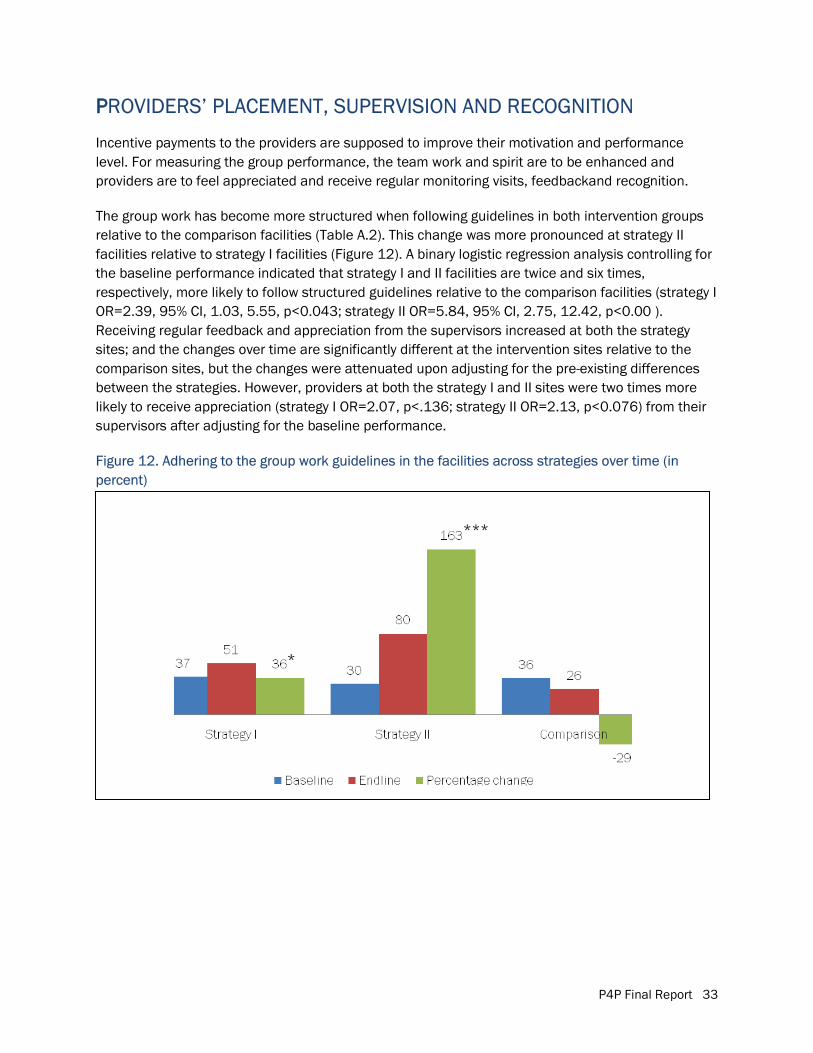
P4P Final Report 33
PPROVIDERS’ PLACEMENT, SUPERVISION AND RECOGNITION
Incentive payments to the providers are supposed to improve their motivation and performance level. For measuring the group performance, the team work and spirit are to be enhanced and providers are to feel appreciated and receive regular monitoring visits, feedbackand recognition.
The group work has become more structured when following guidelines in both intervention groups relative to the comparison facilities (Table A.2). This change was more pronounced at strategy II facilities relative to strategy I facilities (Figure 12). A binary logistic regression analysis controlling for the baseline performance indicated that strategy I and II facilities are twice and six times, respectively, more likely to follow structured guidelines relative to the comparison facilities (strategy I OR=2.39, 95% CI, 1.03, 5.55, p<0.043; strategy II OR=5.84, 95% CI, 2.75, 12.42, p<0.00 ). Receiving regular feedback and appreciation from the supervisors increased at both the strategy sites; and the changes over time are significantly different at the intervention sites relative to the comparison sites, but the changes were attenuated upon adjusting for the pre-existing differences between the strategies. However, providers at both the strategy I and II sites were two times more likely to receive appreciation (strategy I OR=2.07, p<.136; strategy II OR=2.13, p<0.076) from their supervisors after adjusting for the baseline performance.
Figure 12. Adhering to the group work guidelines in the facilities across strategies over time (in percent)
*
***
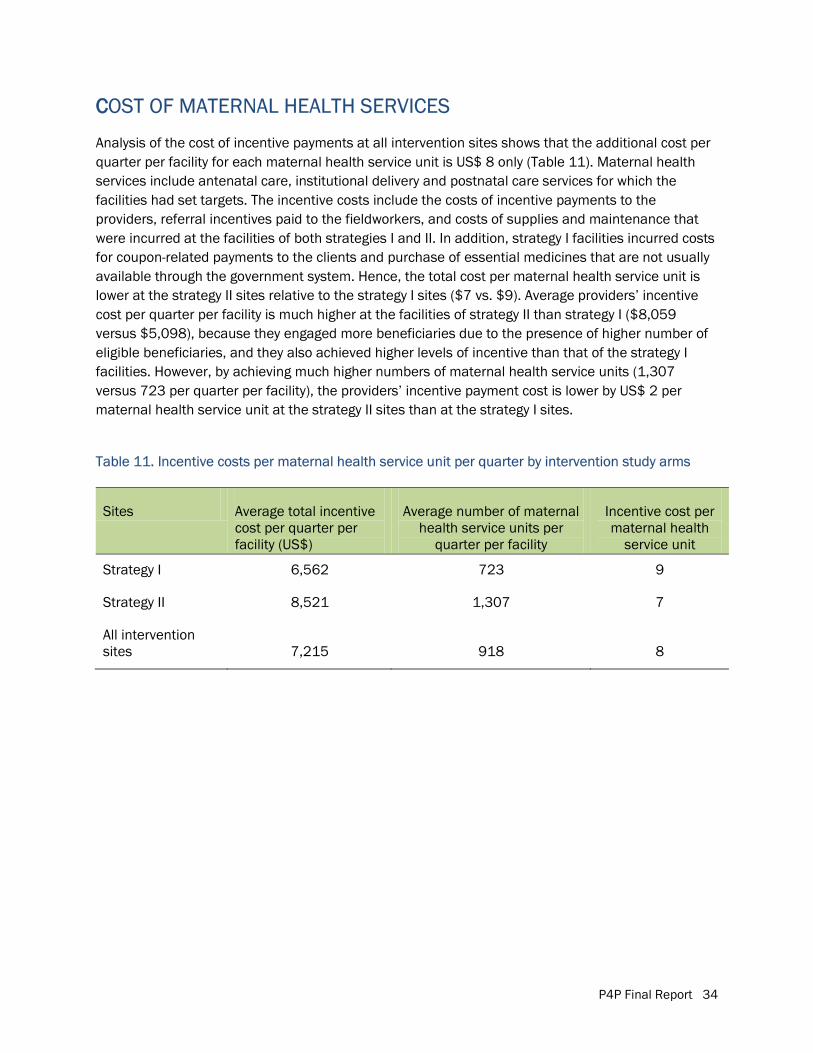
P4P Final Report 34
CCOST OF MATERNAL HEALTH SERVICES
Analysis of the cost of incentive payments at all intervention sites shows that the additional cost per quarter per facility for each maternal health service unit is US$ 8 only (Table 11). Maternal health services include antenatal care, institutional delivery and postnatal care services for which the facilities had set targets. The incentive costs include the costs of incentive payments to the providers, referral incentives paid to the fieldworkers, and costs of supplies and maintenance that were incurred at the facilities of both strategies I and II. In addition, strategy I facilities incurred costs for coupon-related payments to the clients and purchase of essential medicines that are not usually available through the government system. Hence, the total cost per maternal health service unit is lower at the strategy II sites relative to the strategy I sites ($7 vs. $9). Average providers’ incentive cost per quarter per facility is much higher at the facilities of strategy II than strategy I ($8,059 versus $5,098), because they engaged more beneficiaries due to the presence of higher number of eligible beneficiaries, and they also achieved higher levels of incentive than that of the strategy I facilities. However, by achieving much higher numbers of maternal health service units (1,307 versus 723 per quarter per facility), the providers’ incentive payment cost is lower by US$ 2 per maternal health service unit at the strategy II sites than at the strategy I sites.
Table 11. Incentive costs per maternal health service unit per quarter by intervention study arms
Sites Average total incentive cost per quarter per facility (US$)
Average number of maternal health service units per
quarter per facility
Incentive cost per maternal health
service unit
Strategy I 6,562 723 9
Strategy II 8,521 1,307 7
All intervention sites 7,215 918 8
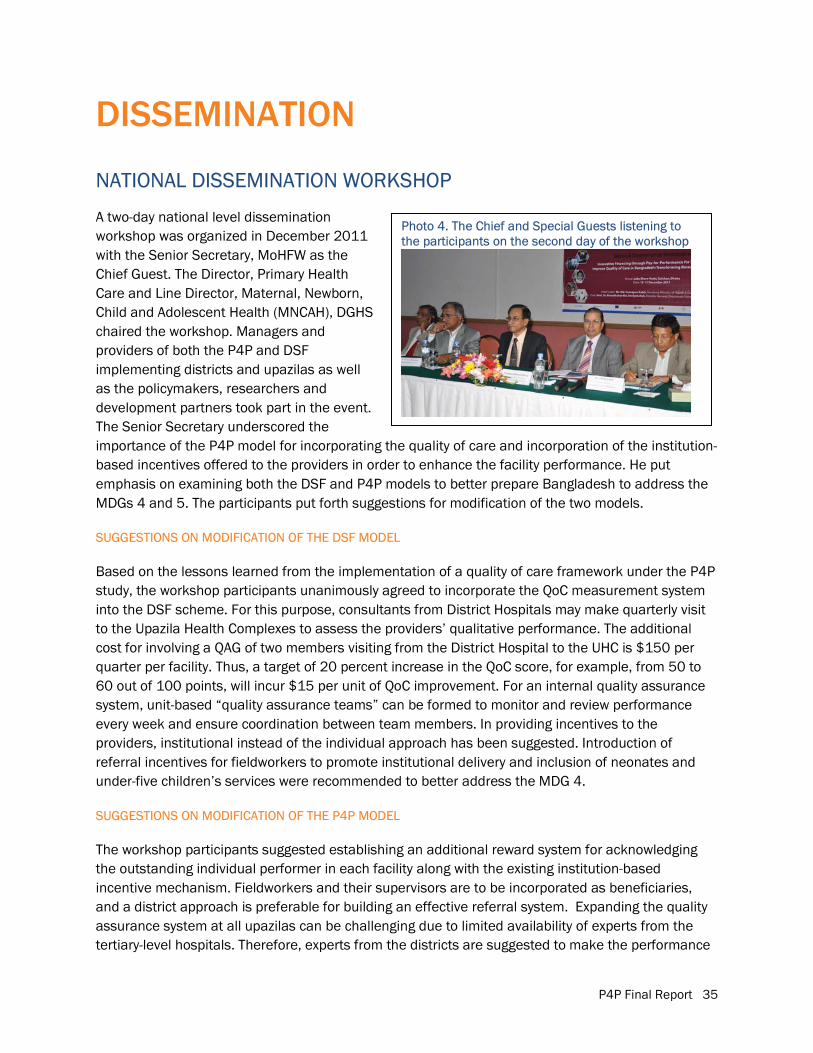
P4P Final Report 35
Photo 4. The Chief and Special Guests listening to the participants on the second day of the workshop
DISSEMINATION
NATIONAL DISSEMINATION WORKSHOP
A two-day national level dissemination workshop was organized in December 2011 with the Senior Secretary, MoHFW as the Chief Guest. The Director, Primary Health Care and Line Director, Maternal, Newborn, Child and Adolescent Health (MNCAH), DGHS chaired the workshop. Managers and providers of both the P4P and DSF implementing districts and upazilas as well as the policymakers, researchers and development partners took part in the event. The Senior Secretary underscored the importance of the P4P model for incorporating the quality of care and incorporation of the institution-based incentives offered to the providers in order to enhance the facility performance. He put emphasis on examining both the DSF and P4P models to better prepare Bangladesh to address the MDGs 4 and 5. The participants put forth suggestions for modification of the two models.
SUGGESTIONS ON MODIFICATION OF THE DSF MODEL
Based on the lessons learned from the implementation of a quality of care framework under the P4P study, the workshop participants unanimously agreed to incorporate the QoC measurement system into the DSF scheme. For this purpose, consultants from District Hospitals may make quarterly visit to the Upazila Health Complexes to assess the providers’ qualitative performance. The additional cost for involving a QAG of two members visiting from the District Hospital to the UHC is $150 per quarter per facility. Thus, a target of 20 percent increase in the QoC score, for example, from 50 to 60 out of 100 points, will incur $15 per unit of QoC improvement. For an internal quality assurance system, unit-based “quality assurance teams” can be formed to monitor and review performance every week and ensure coordination between team members. In providing incentives to the providers, institutional instead of the individual approach has been suggested. Introduction of referral incentives for fieldworkers to promote institutional delivery and inclusion of neonates and under-five children’s services were recommended to better address the MDG 4.
SUGGESTIONS ON MODIFICATION OF THE P4P MODEL
The workshop participants suggested establishing an additional reward system for acknowledging the outstanding individual performer in each facility along with the existing institution-based incentive mechanism. Fieldworkers and their supervisors are to be incorporated as beneficiaries, and a district approach is preferable for building an effective referral system. Expanding the quality assurance system at all upazilas can be challenging due to limited availability of experts from the tertiary-level hospitals. Therefore, experts from the districts are suggested to make the performance
P4P Final Report 36
measurement visits to upazilas. Finally, the QAG tools are to be automated for better administration of the assessment and instant access to the reports.
CHALLENGES � MMeeting the prerequisites. The prerequisites for initiating a performance incentive scheme
with a team approach include placement of key human resources and equipment and supplies. But these were not entirely met. Some facilities are chronically constrained by turnover and vacancy in key human resource positions like anesthesiologist and obstetrician. Lack of training/refresher training on the EmONC and integrated management of childhood illnesses hindered quality improvement to the highest desired level. Ineffective utilization of the MNCH funds limited the capacity of the QATs to bring into the ideal changes. The District Hospitals that have 100 beds and UHCs of 31 beds were constrained in terms of space, and were not able to offer adequate level of privacy, food and other amenities to the clients. Besides the providers were over-burdened, especially with higher demand created through the coupon distribution in strategy I sites.
� Weak health information system. A strong health information system providing timely and accurate data is vital to measure performance. The weak MIS remained a challenge to establish the benchmark levels and track the performance. Therefore, special forms had to be developed for collecting data from a number of registers maintained by several providers. In some cases, providers were found not keeping records; in such cases, for instance, for family planning counseling it had been difficult to establish a benchmark level. An automated MIS and training on record keeping, as envisioned by the DGHS, may solve such problems. However, strengthening of the MIS should remain constant across all sites along with the comparison sites in order to ensure that changes in the service volume due to strengthening of the MIS do not get accounted for against the incentive related intervention.
� Awareness on the incentive mechanism. Although incentive calculation for the providers is simple (e.g., each receiving one-month basic salary for a quarter’s performance), not every beneficiaries well understood the process at the beginning. Turning over of the staff in the middle of the quarter required complicated calculation of proportional payment. Placing some MNCH team nurses at the different units of facilities hindered the intended tie between the payment and performance.
� Incentivizing the EmONC complications management. Obstetrics, newborn and under-five child complications management service volumes could not be incentivized on ethical ground although service statistics had been monitored for tracking performance. Quality of care in EmONC complications management was incentivized through incorporating indicators in the quality assessment tool.
� Team dynamics. The team dynamics played a key role in facility performance. A few providers took the incentive as granted; they received incentives without any effort due to improved facility performance by a number of providers. Therefore, the P4P Committees
P4P Final Report 37
were given responsibility to ensure payment to the performing providers only. Some providers expressed dissatisfaction for not receiving incentives due to non-performance of other units. They were advised to create peer pressure to improve the facility performance in consultation of the P4P Committees.
� MMeasurement of the quality of care. The measurement of the quality of care of MNCH services underwent several revisions to reflect the needs of the facilities. The instrument is appreciated for being detailed, but also criticized for being a long checklist requiring at least 4 hours for its administration. The QAG members later decided to divide themselves into two groups to measure their respective units simultaneously except for the operation theater, and the initial and closing decision-making feedback sessions with the P4P Committees.
� Financial mechanism. Establishing the financial mechanism to track each payment and services involving multiple providers and clients and keeping vouchers for each transaction remained challenging. The competency of the financial operations team was enhanced through interactive workshop, supportive follow-up and on the job training. Issuing of account payee checks saved time to draw, count and disburse cash. However, if all beneficiaries maintained accounts in the bank, the process could be simplified by writing a single letter on bank transfer. The clients received cash for non-repetitive incentive amount for transportation or incidental costs; and fieldworkers for referring cases to intervention facilities. With the introduction of mobile cash transfer, challenges relating to cash transfer can be better addressed in future.
LESSONS LEARNED � Facility response to the incentive. Facilities with sub-optimal performance tend to respond to
the performance targets in terms of increasing quantity and quality of MNCH care if it is tied with incentives in spite of the human resource and other constraints. Managers and providers become innovative to improve the services. However, non-functional facilities cannot be incorporated into the program without upgrading them to a certain functional level.
� Motivation. Motivation level varies across providers. Nurses, indirect providers, administrative and support staff perceive more financial benefits than doctors and consultants for having lower opportunity cost of time. Special acknowledgement and reward system can be developed to motivate the doctors.
� Human resources and infrastructure. Key human resources are to be placed and provided with necessary training and refresher training. Mentoring through the quality assurance groups provides impromptu insights on key issues, but it does not replace the need for formal training to increase competency of the providers to offer better care. The facilities also need to improve the infrastructure in case of higher bed occupancy in order to ensure better care.

P4P Final Report 38
� QQAG and QAT tools. Accountability of the managers and providers can be increased through administration of the QAG and QAT tools. The visual tool administered by the QATs improves the internal monitoring system. The QAG tool empowers the external experts to measure performance and provide constructive feedback. Sharing the tools across all the actors is the key to success of the program. Outcome indicators need to be included in the tool.
� Target threshold levels. Setting institutional targets based on the past performance and providing group incentives can increase the cost of delivery per facility if the facilities historically have been performing at a very low level. In such case, facilities can be enrolled only after achieving a threshold level of performance targets in order to minimize the cost of incentive per institutional delivery.
� Health information system. Weak health information system hinders measuring the performance. Introducing any incentive mechanism needs strengthening of the MIS.
� Client response to the incentive. The coupon clients responded well in terms of receiving the antenatal care services but were reluctant for having deliveries at the facilities. Intensive advocacy at the community levels and increasing the quality of antenatal care may encourage them to plan delivery at the facilities. Certain level of infrastructure is pivotal to ensure quality of care in terms of offering privacy to the clients. Roundtrip transportation cost should be paid in actual and awareness raising activities are must to generate demand for services.
� Validation. Incorporating the auditor’s validation on service volume and exit client interviews measuring the client satisfaction is important. Considering results from the validation into performance measurement is likely to improve providers’ attitude towards clients and increase their level of satisfaction.
� Inadequate time for interventions. The 14-month intervention duration has been highly inadequate to carry out the intended intervention activities to bring about changes at the outcome level. In order to ensure the complete care for the pregnant women among at least two cohorts of the pregnant women to bring sustainable change in the community requires at least a 24-month intervention period for evaluation.
NEXT STEPS The need for performance-based financing programs on key maternal, newborn and child health care services is beyond dispute, especially until the MDG targets are met and the health systems are further strengthened. Given the increasing emphasis on the quality, introduction of quality of care measures into the DSF program is critical. In this regard, the experiences, tools and findings of the P4P pilot study can be useful to improve the maternal and newborn health community served by the DSF program. The DSF model is poised for national level expansion; therefore, it can be modified to incorporate the QoC framework tested in the P4P project after intensive consultation and discussion.

P4P Final Report 39
The services against vouchers can also be expanded for the newborn care and under-five children’s complications management to reduce the newborn, infant and under-five child mortality under the DSF program.
In the non-DSF but high priority and low performing areas with high level of maternal, newborn and child mortality and morbidity, the P4P model has the potential to improve the health facility response in providing improved quality and volume of MNCH services. The modified model needs to be tested at a larger number of facilities and with a longer duration.
The research design compromised at the pilot study should be avoided in future evaluations to enable the measurement of the outcome indicators by carrying out population-based surveys. For example, an evaluation using baseline and endline surveys across the intervention and comparison groups could inform the changes occurring at the population level in terms of met need, service utilization, client satisfaction, morbidity and wellbeing of the clients. For validation through triangulation, it is important to collect and analyze the service statistics data. In the absence of population-based surveys, the current study employed service statistics data alone. However, due to resource constraints, each strategy did not have similar number of facilities; therefore, variability remained high in the unbalanced design.
The P4P models offering incentives to the providers, with or without the demand-side financing, hold great potential to enable the health facilities to provide better quality of care bringing greater accountability and transparency into the health system. Therefore, these strategies are to be pursued under the health financing schemes of the country.
Given both the strategies performed well relative to the comparison site, the strategy II with incentives for providers alone can be introduced at the low performing but poorer regions; while the poorest areas with greater geographical draw back will benefit from a combination of a demand plus supply side P4P approach. Clients living in the regions with poorer geographical accessibility are likely to have higher demand side barriers in terms of transportation cost and other socio-demographic indicators; therefore, they may benefit more from demand side financing for essential MNCH services relative to clients living in the regions with limited geographical constraints.
It is acknowledged that monetary incentives alone are NOT enough to improve the MNCH services. The long-term solution is about putting a stronger system in place through placing the adequate human resources, strengthening the facilities with necessary equipment, drugs and supplies, making the quality assurance system functional, providing mentoring and coaching, supervision, and strengthening the health information system and governance to address the health system building blocks for improving the quality of care in order to improve the quality of life of the patients; and also improving the work environment and satisfaction of the providers. Linking with incentives may facilitate achieving these goals.
P4P Final Report 40
REFERENCES Chowdhury, M.H.R. 2008. “Neonatal deaths in a rural area of Bangladesh: An assessment of causes,
predictors and health care seeking using verbal autopsy.” Ph.D. dissertation, Curtin University of Technology, Western Australia.
Koehlmoos, T.L.P., A. Ashraf, H. Kabir, Z. Islam, R. Gazi, N.C. Saha, and J. Khyang. 2008. “Rapid assessment of demand-side financing experiences in Bangladesh.” ICDDR,B Working Paper 170. Dhaka: ICDDR,B.
Ministry of Health and Family Welfare. 2011. Strategic Plan for Health Population and Nutrition Sector Development Program (HPNSDP) 2011–2016: Draft. Dhaka: Planning Wing, Ministry of Health and Family Welfare, Government of Bangladesh
National Institute of Population Research and Training (NIPORT), MEASURE Evaluation, and ICDDR,B. 2011. Bangladesh Maternal Mortality and Health Care Survey 2010: Preliminary Results. Dhaka: NIPORT, MEASURE Evaluation, and ICDDR,B.
National Institute of Population Research and Training (NIPORT), Mitra and Associates, and MEASURE DHS. 2012. Bangladesh Demographic and Health Survey 2011: Preliminary Report. Dhaka: NIPORT, Mitra and Associates, and MEASURE DHS.
Population Council. 2009. “Workshop report on the Pay-for-Performance scheme.” Dhaka: Population Council.
Rob, Ubaidur, Md. Noorunnabi Talukder, and Tehmina Ghafur. 2006. “Health policies: Pledges and implementation.” In “The State of Health in Bangladesh 2006: Challenges of Achieving Equity in Health.” Dhaka: James P. Grant School of Public Health, BRAC University.
Schmidt, Jean-Olivier, Tim Ensor, Atia Hossain, and Salam Khan. 2010. “Vouchers as demand side financing instruments for health care: A review of the Bangladesh maternal voucher scheme.” Health Policy. doi:10.1016/j.healthpol.2010.01.008
Talukder, Md. Noorunnabi and Ubaidur Rob. 2009. “Strengthening voice and accountability in the health sector.” Workshop Report. Dhaka: Population Council.
Thaddeus, S. and D. Maine. 1994. “Too far to walk: Maternal mortality in context.” Social Science and Medicine, 38(8): 1091-110.
UNICEF. 2008. The State of the World’s Children 2009: Maternal and Newborn Health. New York: UNICEF.
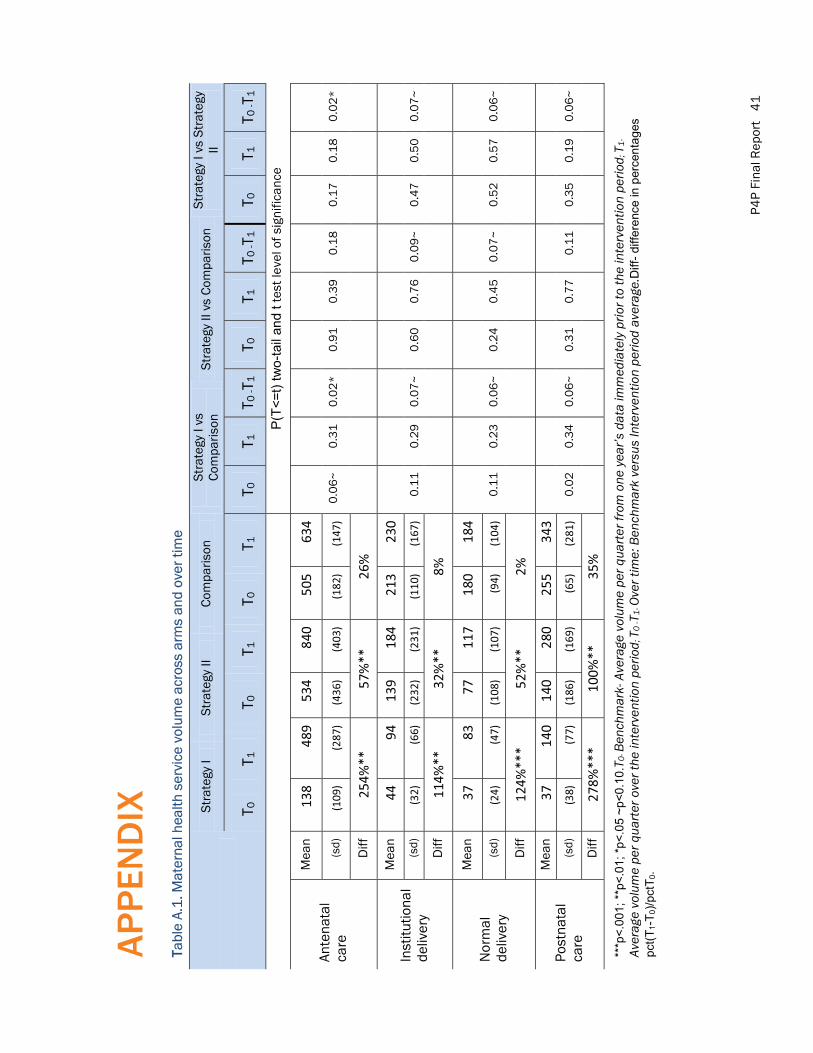
P4P
Fina
l Rep
ort
41
AP
PEN
DIX
TTa
ble
A.1
. Mat
erna
l hea
lth s
ervi
ce v
olum
e ac
ross
arm
s an
d ov
er ti
me
Stra
tegy
I St
rate
gy II
Co
mpa
rison
St
rate
gy I
vs
Com
paris
on
Stra
tegy
II v
s Co
mpa
rison
St
rate
gy I
vs S
trat
egy
II
T 0
T 1
T 0
T 1
T 0
T 1
T 0
T 1
T 0 -T
1 T 0
T 1
T 0
-T1
T 0
T 1
T 0 -T
1
P(T<
=t) t
wo-
tail
and
t tes
t lev
el o
f sig
nific
ance
Ante
nata
l ca
re
Mea
n 13
8 48
9 53
4 84
0 50
5 63
4
0.0
6~
0
.31
0
.02
*
0.9
1
0.3
9
0.1
8
0.1
7
0.1
8
0.0
2*
(s
d)
(109
) (2
87)
(436
) (4
03)
(182
) (1
47)
Diff
25
4%**
57
%**
26
%
Inst
itutio
nal
deliv
ery
Mea
n 44
94
13
9 18
4 21
3 23
0
0.1
1
0.2
9
0.0
7~
0
.60
0
.76
0
.09
~
0.4
7
0.5
0
0.0
7~
(s
d)
(32)
(6
6)
(232
) (2
31)
(110
) (1
67)
Diff
11
4%**
32
%**
8%
Nor
mal
de
liver
y
Mea
n 37
83
77
11
7 18
0 18
4
0.1
1
0.2
3
0.0
6~
0
.24
0
.45
0
.07
~
0.5
2
0.5
7
0.0
6~
(s
d)
(24)
(4
7)
(108
) (1
07)
(94)
(1
04)
Diff
12
4%**
* 52
%**
2%
Post
nata
l ca
re
Mea
n 37
14
0 14
0 28
0 25
5 34
3
0.0
2
0.3
4
0.0
6~
0
.31
0
.77
0
.11
0
.35
0
.19
0
.06
~
(sd)
(3
8)
(77)
(1
86)
(169
) (6
5)
(281
)
Diff
27
8%**
* 10
0%**
35
%
***p
<.00
1; *
*p<.
01; *
p<.0
5~p
<0.1
0.T 0
- Ben
chm
ark-
Ave
rage
vol
ume
per q
uarte
r fro
m o
ne y
ear’s
dat
a im
med
iate
ly p
rior t
o th
e in
terv
entio
n pe
riod ;
T1-
Aver
age
volu
me
per q
uart
er o
ver t
he in
terv
entio
n pe
riod ;
T0
-T1-
Ove
r tim
e: B
ench
mar
k ve
rsus
Inte
rven
tion
perio
d av
erag
e.D
iff-d
iffer
ence
in p
erce
ntag
es
pct(T
1-T 0
)/pct
T 0.
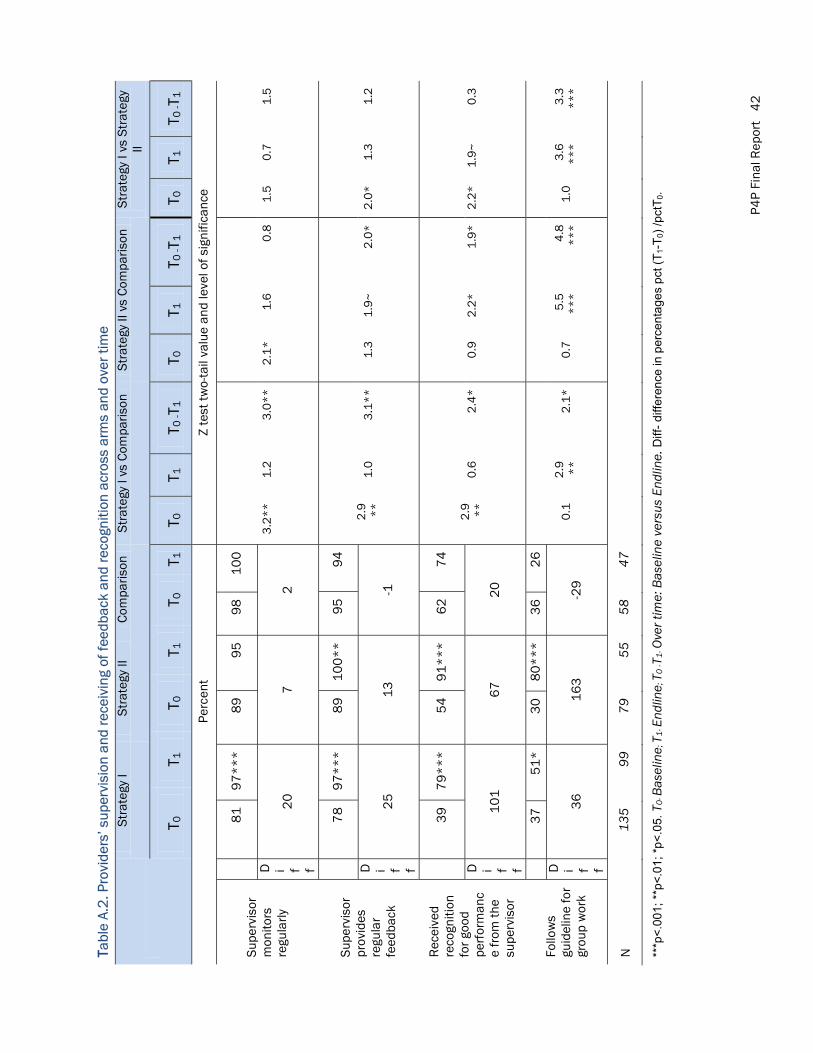
P4P
Fina
l Rep
ort
42
TTabl
e A.
2. P
rovi
ders
’ sup
ervi
sion
and
rece
ivin
g of
feed
back
and
reco
gniti
on a
cros
s ar
ms
and
over
tim
e
Stra
tegy
I St
rate
gy II
Co
mpa
rison
St
rate
gy I
vs C
ompa
rison
St
rate
gy II
vs
Com
paris
on
Stra
tegy
I vs
Str
ateg
y II
T 0
T 1
T 0
T 1
T 0
T 1
T 0
T 1
T 0 -T
1 T 0
T 1
T 0
-T1
T 0
T 1
T 0 -T
1
Pe
rcen
t Z
test
two-
tail
valu
e an
d le
vel o
f sig
nific
ance
Supe
rvis
orm
onito
rs
regu
larly
8
1
97
**
* 8
9
95
9
8
10
0
3.2
**
1
.2
3.0
**
2
.1*
1
.6
0.8
1
.5
0.7
1
.5
D i f f
20
7
2
Supe
rvis
or
prov
ides
re
gula
r fe
edba
ck
7
8
97
**
* 8
9
10
0*
* 9
5
94
2.9
*
*
1.0
3
.1*
*
1.3
1
.9~
2
.0*
2
.0*
1
.3
1.2
D i f f
25
1
3
-1
Rec
eive
d re
cogn
ition
fo
r goo
d pe
rfor
man
ce
from
the
supe
rvis
or
3
9
79
**
* 5
4
91
**
* 6
2
74
2.9
*
*
0.6
2
.4*
0
.9
2.2
*
1.9
*
2.2
*
1.9
~
0.3
D i f f
10
1
67
2
0
Follo
ws
guid
elin
e fo
r gr
oup
wor
k
3
7
51
*
30
8
0*
**
36
2
6
0.1
2
.9
**
2
.1*
0
.7
5.5
*
**
4
.8
**
*
1.0
3
.6
**
*
3.3
*
**
D i f f
36
1
63
-2
9
N
135
99
79
55
58
47
***p
<.00
1; *
*p<.
01; *
p<.0
5. T
0- B
asel
ine ;
T1-
End
line ;
T0
-T1-
Ove
r tim
e: B
asel
ine
vers
us E
ndlin
e. D
iff-d
iffer
ence
in p
erce
ntag
es p
ct(T
1-T 0
)/pc
tT0.
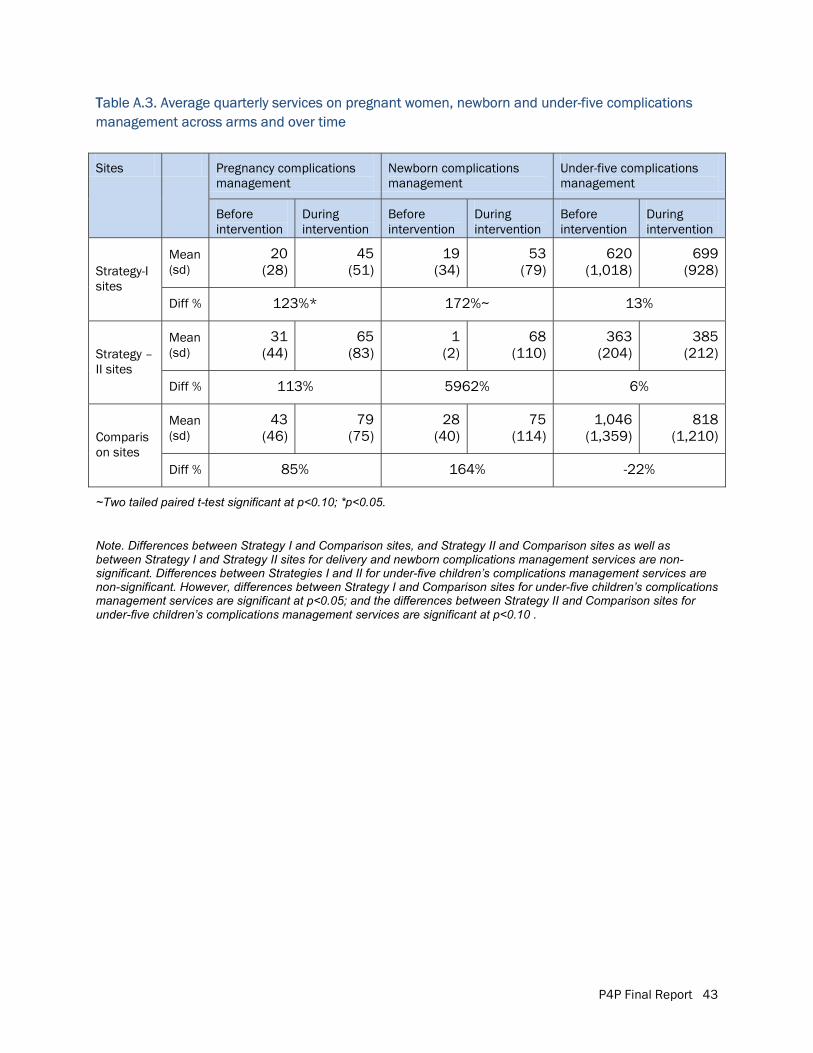
P4P Final Report 43
TTable A.3. Average quarterly services on pregnant women, newborn and under-five complications management across arms and over time
Sites Pregnancy complications management
Newborn complications management
Under-five complications management
Before intervention
During intervention
Before intervention
During intervention
Before intervention
During intervention
Strategy-I sites
Mean (sd)
20 (28)
45 (51)
19 (34)
53 (79)
620 (1,018)
699 (928)
Diff % 123%* 172%~ 13%
Strategy –II sites
Mean (sd)
31 (44)
65 (83)
1 (2)
68 (110)
363 (204)
385 (212)
Diff % 113% 5962% 6%
Comparison sites
Mean (sd)
43 (46)
79 (75)
28 (40)
75 (114)
1,046 (1,359)
818 (1,210)
Diff % 85% 164% -22%
~Two tailed paired t-test significant at p<0.10; *p<0.05.
Note. Differences between Strategy I and Comparison sites, and Strategy II and Comparison sites as well as between Strategy I and Strategy II sites for delivery and newborn complications management services are non-significant. Differences between Strategies I and II for under-five children’s complications management services are non-significant. However, differences between Strategy I and Comparison sites for under-five children’s complications management services are significant at p<0.05; and the differences between Strategy II and Comparison sites for under-five children’s complications management services are significant at p<0.10 .
UNICEFBSL Office Complex1, Minto Road, RamnaDhaka 1000, Bangladesh
email: [email protected]
Population CouncilBangladesh Office House CES (B) 21, Road 118Gulshan, Dhaka 1212, Bangladesh
email: [email protected]