Embed Size (px)
Citation preview
A Path to developing oral proficiency: Speaking rate, silent
pauses and fillers
Aya Kitagawa1, Akiko Watanabe
1 and Hideyuki Kumaki
2
1School of Education, Waseda University,
2Foreign Language Center, Tokai University
[email protected], [email protected] [email protected]
Abstract The study investigates natural speech differences of
non-natives who were evaluated based on a
simplified version of CEFR descriptor for the
global oral proficiency. The purpose of this study is
to highlight three prosodic features of non-natives.
It is hoped that this result would contribute to a
development of non-natives’ speaking. The three
prosodic features, speaking rate, silent pauses, and
fillers obtained by 17 non-natives’ self-introduction
speech, were analyzed. In order to describe the
relationship between the global oral proficiency and
these prosodic features, first, a correlation analysis
between each factor and the global oral proficiency
was conducted; then, a multiple regression analysis
was carried out. As a result, it was demonstrated
that the frequency of silent pauses was one of the
critical predictors of the non-native speakers’ global
oral proficiency.
Keywords speaking rate, silent pauses, fillers,
1 Introduction
1.1 Aim of the study
This research aims to characterize speaking rate,
silent pauses and fillers produced by non-native
speakers of English and to define whether they
contributed to the dysfluency of their speech. Since
the speech itself results from the constellation of
various elements, not only the three prosodic
aspects targeted here, there are certainly other
factors leading to the dysfluency of their English
speech, such as the accuracy of pronunciation
including the intonation contour, pitch range and
lexical stress, the complexity of the syntactic
structures, and many more. However, it is through
this sort of close observation of each feature that the
authors believe it would be possible to provide a
pedagogical suggestion for learners to develop oral
proficiency. Therefore, out of these interwound
nature of speech, the current study solely narrowed
down the focus to the three prosodic features:
speaking rate, silent pauses and fillers.
1.2 Speaking rate
Speaking rate is a temporal variable of the utterance,
one of the prosodic features. There are several
major methods to measure it. However, it varies in
accordance with a variety of factors: gender,
cultural backgrounds, different types of texts in
different lengths, different contexts (Osada, 2002)
and so forth. For instance, Tauroza and Allison
(1990) claimed that native speakers’ speaking rate
calculated by word per minute (wpm) differs
depending on the context: 150-170 for radio;
125-160 for lecture: 160-210 for interview; 190-230
for conversation. Therefore, they stressed the
inappropriateness of applying these rates to general
assessment for speakers.
Other measures frequently used for the speaking
rate are speech rate (SR) and articulation rate (AR).
The difference between SR and AR is that the
former includes pausing time whereas the latter
excludes it (Hinks, 2010; Munro and Derwing,
1998). SR has been used more often for the
measuring. Goldman-Eisler (1968) argued that the
speaking rate in L1 was determined by the length of
pause rather than by changes in the articulation of
individual words”. This implies that the pause is
one of the possible beneficial measurements to
explain about speaking rate. Thus, there is a
possibility that SR which includes the pause could
be a better measure than AR.
1.3 Silent pauses
According to Ogata, Goto, and Itou (2009), the term
“silent pause” basically means a temporal region in
which a speaker does not utter during a word,
phrase, or sentence in spontaneous speech. This
type of pause is associated with respiration and
occurs when a speaker pauses in order to breathe.
Furthermore, silent pauses are probably the most
basic way of dealing with problems of formulation
at the same time. Not knowing what to say, the
speaker just remains silent.
Proceedings of The 16th Conference of Pan-Pcific Association of Applied Linguistics
261
This was confirmed by Pickering (1999), who
stated silent pauses represent the most common
device for signaling hesitation, both among native
speakers (NSs) and non-native speakers (NNSs).
1.4 Fillers Fillers are distinct from silent pauses in that they
have audible sounds usually written “uh,” “um” or
“er.” Some researchers view them as a sign of
hesitation without any lexical meaning, and call
them filled “pauses.” However, Clark and Tree
(2002), who conducted the comprehensive study on
English fillers using English corpus data, claimed
they are English words, which had been implied by
Swerts (1998) concluding fillers were linguistic
elements. They discussed the three possible causes
of fillers, too: the difficulty in structuring utterances,
self-repairs and plan for what to say next. They
asserted “speakers use uh and um to announce that
they are initiating what they expect to be a minor or
major delay before speaking. (p.93)” in particular.
When it comes to fillers, another issue is the
segmental structure. “Uh” and “um” mentioned
here are two of the major fillers in English. In
contrast, fillers, in fact, vary from language to
language, although the variation of fillers between
languages is outside the scope of the present study.
Speaking of English fillers, Candea, Vasilescu and
Adda-Decker (2005) pointed out that a vocalic
segment accompanied by a nasal segment .l. was
preferable in English through examining eight
languages: Arabic, Mandarin Chinese, French,
German, Italian, European Portuguese, American
English and Latin American Spanish. On the other
hand, Clark and Tree (2002) rather did not imply
such a preference, referring to the possible
differences in the preference among dialects,
discourse types, and other factors.
Concerning the acoustic properties of fillers,
Shriberg (2001) reported that the vowel in the fillers
was close to schwa in most cases although it could
sound other /a/-like vowels. Additionally, Candea,
Vasilescu and Adda-Decker (2005) argued the
vocalic segment of fillers was approximate to a
central vowel in the quality for all of the eight
languages they observed, discovering English fillers
were produced with a low central vowel.
Nevertheless, they also maintained they were not
absolutely universal. Instead, the duration is likely
to be language-independent: longer in duration
(Shriberg, 2001; Candea, Vasilescu and
Adda-Decker, 2005). As for the intonation of fillers,
Clark and Tree (2002) found that three types were
possible, i.e. level, fall and rise. The level tone
tended to be most common (Candea, Vasilescu and
Adda-Decker, 2005; Clark and Tree, 2002), and
Shriberg (2001) mentioned the tone of the fillers lay
halfway between the preceding peak and the
speakers F0 baseline to make themselves rather
outstanding.
1.5 Non-natives’ three prosodic feature 1.5.1 Speaking rate
Not only has speaking rate of the first language
been examined, but many have investigated how
speech rate differs between NSs and NNSs.
According to Trofimovich and Baker (2006), the
possible factor which defines the NNSs’ speaking
rate is the age at which L2 learning begins, the
same going for pause frequency and pause duration.
Generally speaking, NNSs speaks at a slower
speech. Munro and Derwing (1998) stated adult
NNSs often produce L2 speech at a lower rate.
Various studies have been carried out to
determine the effect of slow speech, one of the
characteristics of NNSs’ speech. Some
demonstrated slow speech negatively affected
speakers’ proficiency. Munro and Derwing (1998)
suggested that speeding up speaking rates showed
better ratings and slowing down speaking rates
resulted in worse ratings from listeners,
investigating the effects of rate change on listener’s
perception. Hinks (2010), moreover, concluded that
slower speaking rate significantly reduced the
information content of speaking, although the study
did not reveal the relationship between speaking
rate and proficiency judgment.
However, Munro and Derwing (1998) also
commented that NNSs’ slower speaking could
benefit listeners’ comprehension. This is because it
could be take time to process accented speech as
one possible interpretation. Their interpretation
from the result of the study supported Anderson and
Koehler’s study (1988), demonstrating that faster
speaking rate resulted in a greater decreased in
comprehension.
1.5.2 Silent pauses and fillers
Silent pauses and fillers have been investigated as a
group, both regarded as pauses. Many of the
previous studies showed that there was a difference
in producing them between fluent speakers and
non-fluent speakers although some did not confirm
this finding (Kang, Rubin and Pickering 2010).
According to Pickering (1999), silent pauses in the
NNSs’ data were both longer and more irregular
than those in the NSs’ data and tended to regularly
break up conceptual units. Besides, Clark and Tree
(2002) asserted that NNSs applied fillers from their
first languages, which could contribute to the
non-nativeness. This is also supported by
Riazantseva (2001) claiming that if NNSs did not
use pauses in a similar manner to NSs, it reduced
the degree of fluency. According to Trofimovich
Proceedings of The 16th Conference of Pan-Pcific Association of Applied Linguistics
262
and Baker (2006), on the other hand, who reported
the effect of language experience on pauses, the
frequency and duration of silent pauses decreased
as learners became more-experienced speakers with
their L2.
1.6 Hypothesis / Research Question
From the previous research, it is possible to predict
that NNSs would speak more slowly and use both
silent pauses and fillers more frequently at less
acceptable places, which could be also longer.
Therefore, it can be hypothesized that these features
would be related with the global oral proficiency of
NNSs. That is to say, the more native-like these
features are, the higher the proficiency would be.
2 Methodology
2.2 Subjects
The subjects of this research were 17 students from
Asian universities: 5 Japanese, 2 Chinese, 2
Taiwanese, 6 Koreans, and 2 Filipinos. For none of
them English was their mother tongue.
2.3 Data Collection
The data was obtained using an audio digital
recorder, R-09, and a microphone ECM-MS957.
Their response was also tape-recorded. It was done
in a very quiet room, which was not sound-proof.
The subjects were asked to introduce themselves as
long as they like.
2.4 Rating
The data was evaluated based on CEFR descriptor
by the teachers of English and postgraduates in the
field of Applied Linguistics, 15 raters in total. Their
native language was Japanese. The average score of
speech evaluation done by these raters was used as
the global oral proficiency for each speaker in this
study (Mean = 4.0, SD =1.0, Min = 2.0, Max = 5.4).
The CEFR descriptor had six levels: A1, A2, B1,
B2, C1, and C2 from beginner to experience.
The inter-rater reliability was statistically
studied with an intra-class correlation coefficient on
SPSS. First, the reliability of all the raters was
computed; next, that of all the raters but one was
calculated in sequence for 15 times, which enabled
us to detect a rater who had evaluated in an
inconsistent manner with the other raters. In effect,
one rater fell into this; therefore, the evaluation by
this rater was excluded from the further analysis.
The overall inter-rater reliability of the 14 raters
was statistically significant, r = .95, p = .00.
2.5 Measurement
The obtained speech was transcribed by three
postgraduates, and was annotated on Praat based on
the waveform, spectrogram and careful listening.
Then, each feature was analyzed in the following
ways.
Firstly, as for speaking rate, both speech rate
and articulation rate were computed. The former
was calculated by dividing the total length of
speech with silent pauses by the number of
syllables in the speech; the latter by dividing the
total length of speech without silent pauses by the
number of syllable in the speech.
Secondly, silent pauses were identified as the
100 ms-and-longer unfilled sections. Then, the
frequency and duration of them were quantitatively
computed. The frequency was obtained by the ratio
of the total length of silent pauses to the total length
of the speech, expressed in percent figures. Also,
their location was analyzed referring to the
constituent boundary and incomplete sentences.
Finally, fillers were observed in the light of the
frequency, duration, vowel quality and location.
The frequency was calculated by the ratio of the
number of fillers to that of syllables. Concerning
the quality, the first formant (F1) and the second
formant (F2) of the vocalic element of fillers and
schwa/long schwa were acoustically measured, so
that it allowed us to investigate the acoustic
closeness of vowel quality between the fillers and
central vowels. To measure this, the F1 and F2
values of the central vowel averaged across the
speakers was defined as a reference point, the
distance from each vowel of fillers to this point was
computed for each speaker. The distance from the
mean value was quantified using the equation to
obtain the perceptual distance defined as the
Euclidean distance. In addition, the F1 and F2
values for each speaker were normalized using all
the F1 and F2 of the other vowels (Lobanov, 1971),
which led to the possible comparison across the
speakers. As for the location of fillers, there are a
few different criteria, such as defining the position
with reference to the intonation unit (Clark and Tree,
2002). However, some NNSs’ are rather vague to
define accurately owing to their difficulty in
realizing clear intonational properties. Hence, the
location of their fillers was simply classified into
two in the present study: whether they occurred at
the constituent boundary or within it, instead of the
intonation unit.
2.6 Statistical analysis
The statistical analysis was conducted with SPSS
(IBM SPSS Statistics 19). Especially, a correlation
analysis using the Pearson’s correlation coefficient
was done in order to examine the relation between
each prosodic feature and the global oral
proficiency. A multiple regression analysis followed
it to identify the good predictor of the global oral
proficiency.
Proceedings of The 16th Conference of Pan-Pcific Association of Applied Linguistics
263
3 Results and Discussion
3.1 Speaking rate
3.1.1 Speech rate
The mean value of speech rate by the 17 speakers
was 3.39 (SD = 1.02) and ranged from 1.83 to 5.05.
Table 1: Speech rate
Mean SD Min. Max
SR 3.39 1.02 1.83 5.05 Note: SR represents speech rate.
A peculiar point of the result in SR is that there
was a feature that three speakers who had 3.03 SR,
3.28 SR, 3.43 SR corresponding to the middle value
of SR among the group were given higher scores of
global oral proficiency by the raters. On the
contrary, two speakers who had 4.69 SR and 5.05
SR corresponding to the highest value of SR among
the group were given lower scores of global oral
proficiency than these three speakers. One of the
reasons to interpret this is that the two speakers who
were given lower proficiency rate could relate with
the amount of silent pause. In fact, the former three
speakers with the higher proficiency put silent
pauses in the 18.4-21.3 % section of their speaking.
The latter two speakers with the middle proficiency
used them more frequently, resulting in 32-37 % of
their speaking being silent pauses. The speaker with
the highest proficiency among the group put only
11% of the pause frequency.
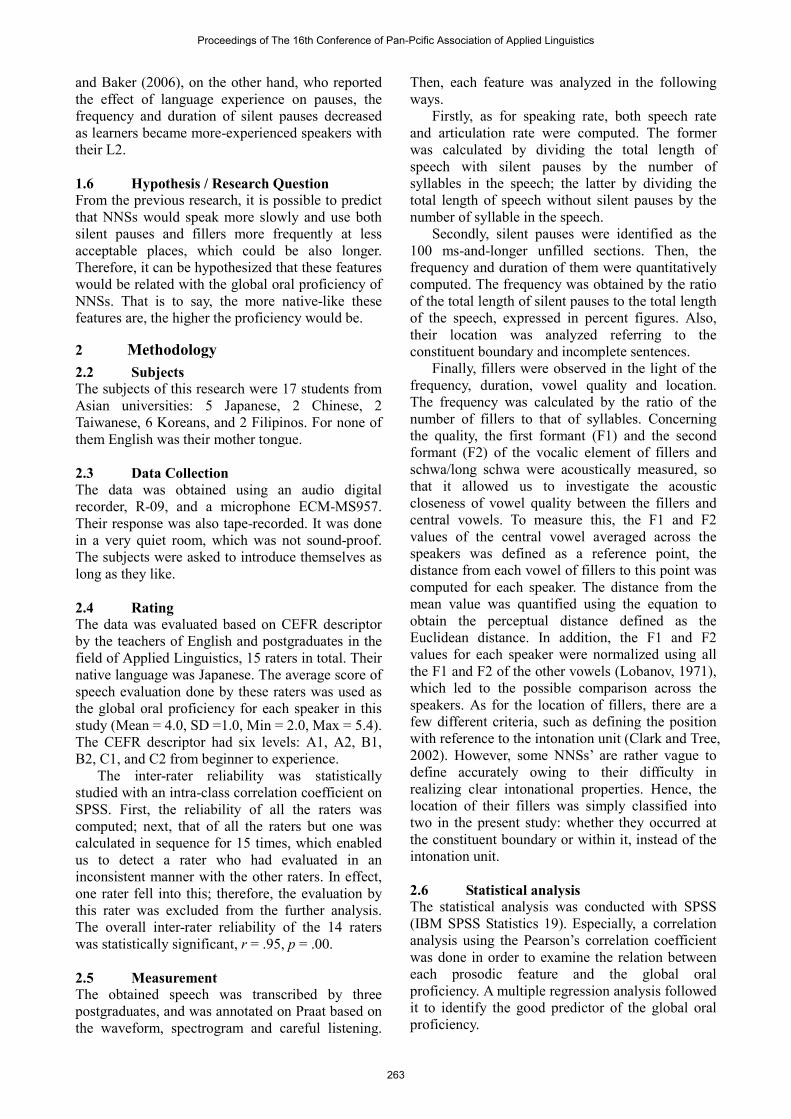
Figure 1: Correlation between the global oral
proficiency and SR
However, there seems to be a certain tendency
as for the relationship between SR and the global
oral proficiency as illustrated in the scatter graph of
Figure 1, where speech rate is plotted on the x-axis
and the score of global oral proficiency on the
y-axis. That is, a higher SR leads to the high
proficiency while a lower SR leads to the low
proficiency. This tendency between SR and the
global oral proficiency was statistically proved, r
= .68, p = .00. Therefore, when speakers speak at a
higher speed rate, the raters judge their proficiency
higher. This supports the result in Munro and
Derwing’s (1998) study. Also, it upholds
Goldman-Eisler (1968)’s study on the relationship
between the numbers of length of pause and
speaking rate, since SR contains the pausing time.
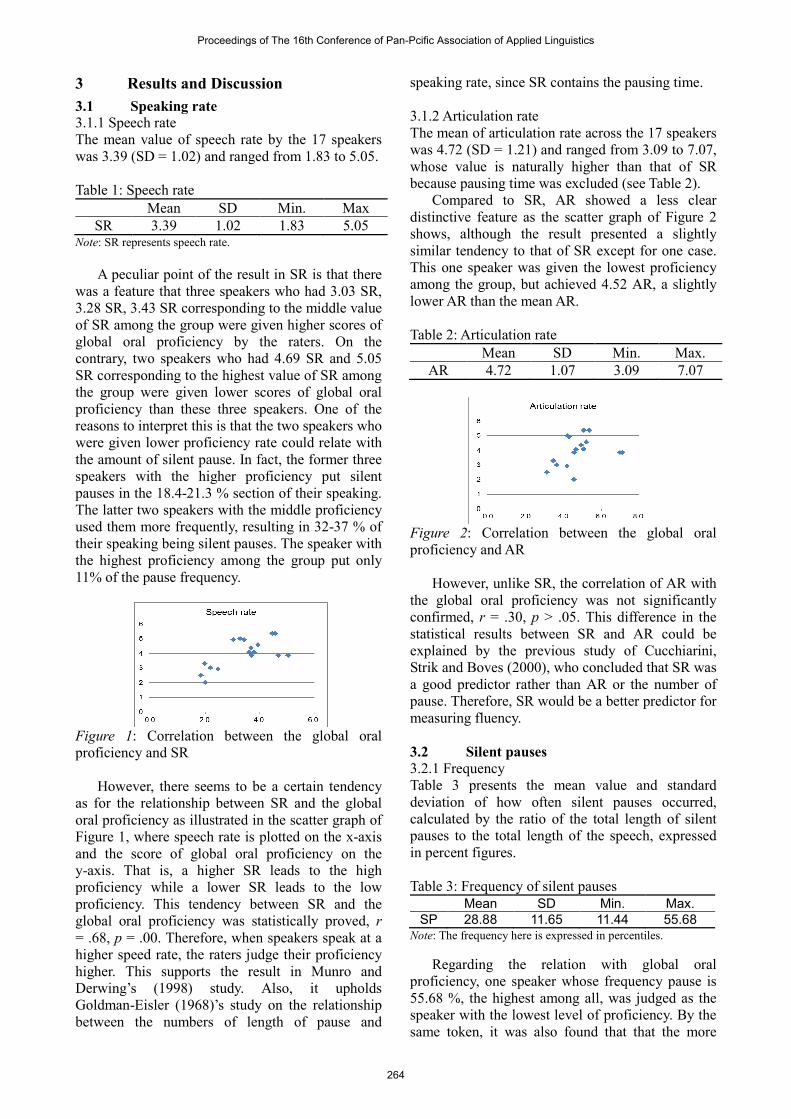
3.1.2 Articulation rate
The mean of articulation rate across the 17 speakers
was 4.72 (SD = 1.21) and ranged from 3.09 to 7.07,
whose value is naturally higher than that of SR
because pausing time was excluded (see Table 2).
Compared to SR, AR showed a less clear
distinctive feature as the scatter graph of Figure 2
shows, although the result presented a slightly
similar tendency to that of SR except for one case.
This one speaker was given the lowest proficiency
among the group, but achieved 4.52 AR, a slightly
lower AR than the mean AR.
Table 2: Articulation rate
Mean SD Min. Max.
AR 4.72 1.07 3.09 7.07
Figure 2: Correlation between the global oral
proficiency and AR
However, unlike SR, the correlation of AR with
the global oral proficiency was not significantly
confirmed, r = .30, p > .05. This difference in the
statistical results between SR and AR could be
explained by the previous study of Cucchiarini,
Strik and Boves (2000), who concluded that SR was
a good predictor rather than AR or the number of
pause. Therefore, SR would be a better predictor for
measuring fluency.
3.2 Silent pauses
3.2.1 Frequency
Table 3 presents the mean value and standard
deviation of how often silent pauses occurred,
calculated by the ratio of the total length of silent
pauses to the total length of the speech, expressed
in percent figures.
Table 3: Frequency of silent pauses
Mean SD Min. Max.
SP 28.88 11.65 11.44 55.68 Note: The frequency here is expressed in percentiles.
Regarding the relation with global oral
proficiency, one speaker whose frequency pause is
55.68 %, the highest among all, was judged as the
speaker with the lowest level of proficiency. By the
same token, it was also found that that the more
Proceedings of The 16th Conference of Pan-Pcific Association of Applied Linguistics
264
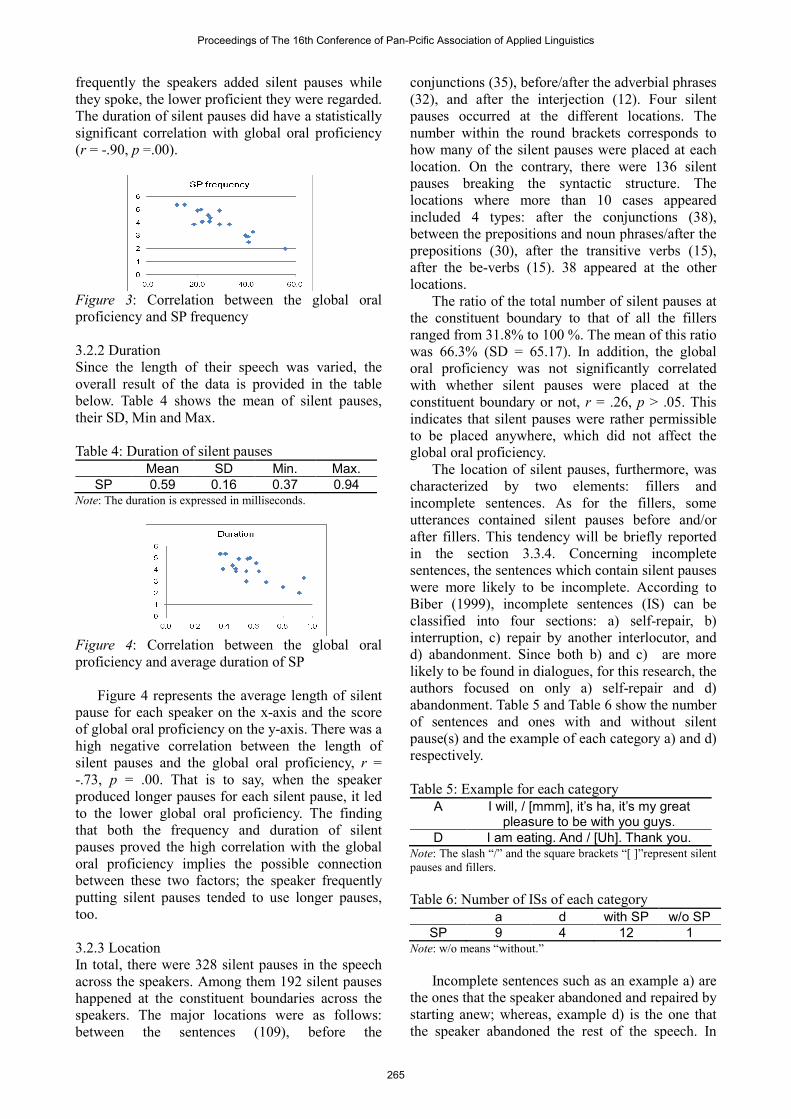
frequently the speakers added silent pauses while
they spoke, the lower proficient they were regarded.
The duration of silent pauses did have a statistically
significant correlation with global oral proficiency
(r = -.90, p =.00).
Figure 3: Correlation between the global oral
proficiency and SP frequency
3.2.2 Duration
Since the length of their speech was varied, the
overall result of the data is provided in the table
below. Table 4 shows the mean of silent pauses,
their SD, Min and Max.
Table 4: Duration of silent pauses
Mean SD Min. Max.
SP 0.59 0.16 0.37 0.94 Note: The duration is expressed in milliseconds.
Figure 4: Correlation between the global oral
proficiency and average duration of SP
Figure 4 represents the average length of silent
pause for each speaker on the x-axis and the score
of global oral proficiency on the y-axis. There was a
high negative correlation between the length of
silent pauses and the global oral proficiency, r =
-.73, p = .00. That is to say, when the speaker
produced longer pauses for each silent pause, it led
to the lower global oral proficiency. The finding
that both the frequency and duration of silent
pauses proved the high correlation with the global
oral proficiency implies the possible connection
between these two factors; the speaker frequently
putting silent pauses tended to use longer pauses,
too.
3.2.3 Location
In total, there were 328 silent pauses in the speech
across the speakers. Among them 192 silent pauses
happened at the constituent boundaries across the
speakers. The major locations were as follows:
between the sentences (109), before the
conjunctions (35), before/after the adverbial phrases
(32), and after the interjection (12). Four silent
pauses occurred at the different locations. The
number within the round brackets corresponds to
how many of the silent pauses were placed at each
location. On the contrary, there were 136 silent
pauses breaking the syntactic structure. The
locations where more than 10 cases appeared
included 4 types: after the conjunctions (38),
between the prepositions and noun phrases/after the
prepositions (30), after the transitive verbs (15),
after the be-verbs (15). 38 appeared at the other
locations.
The ratio of the total number of silent pauses at
the constituent boundary to that of all the fillers
ranged from 31.8% to 100 %. The mean of this ratio
was 66.3% (SD = 65.17). In addition, the global
oral proficiency was not significantly correlated
with whether silent pauses were placed at the
constituent boundary or not, r = .26, p > .05. This
indicates that silent pauses were rather permissible
to be placed anywhere, which did not affect the
global oral proficiency.
The location of silent pauses, furthermore, was
characterized by two elements: fillers and
incomplete sentences. As for the fillers, some
utterances contained silent pauses before and/or
after fillers. This tendency will be briefly reported
in the section 3.3.4. Concerning incomplete
sentences, the sentences which contain silent pauses
were more likely to be incomplete. According to
Biber (1999), incomplete sentences (IS) can be
classified into four sections: a) self-repair, b)
interruption, c) repair by another interlocutor, and
d) abandonment. Since both b) and c) are more
likely to be found in dialogues, for this research, the
authors focused on only a) self-repair and d)
abandonment. Table 5 and Table 6 show the number
of sentences and ones with and without silent
pause(s) and the example of each category a) and d)
respectively.
Table 5: Example for each category
A I will, / [mmm], it’s ha, it’s my great pleasure to be with you guys.
D I am eating. And / [Uh]. Thank you. Note: The slash “/” and the square brackets “[ ]”represent silent
pauses and fillers.
Table 6: Number of ISs of each category
a d with SP w/o SP
SP 9 4 12 1 Note: w/o means “without.”
Incomplete sentences such as an example a) are
the ones that the speaker abandoned and repaired by
starting anew; whereas, example d) is the one that
the speaker abandoned the rest of the speech. In
Proceedings of The 16th Conference of Pan-Pcific Association of Applied Linguistics
265
total, there were 13 incomplete sentences. Among
them, except one case, there was always at least one
silent pause. Despite the small number of
incomplete sentences in our data, the limited study
here suggested the phenomenon of the incomplete
sentences accompanied by silent pauses. Possibly,
this is natural taking into consideration that silent
pauses are used when speakers have difficulty in
formulating sentences as mentioned in the section
1.3.
3.3 Fillers
14 out of the 17 speakers produced fillers, while 3
speakers did not produce any filler. In total, 68
fillers out of 1586 syllables were identified. Overall,
there were three types of fillers depending on the
segmental structure: a vocalic segment, a nasal
segment and a vocalic segment followed by a nasal
segment.
3.3.1 Frequency
The frequency for each segmental structure is as
follows: 39 vocalic segments, 18 nasal segments
and 11 vocalic segments followed by nasal
segments. This result did not uphold the finding by
Candea, Vasilescu and Adda-Decker (2005),
discovering the English speakers’ preference for the
vowel-nasal structure over the others. This
disagreement of the results is probably because of
the difference of the subjects. NSs participated in
their research while this study targeted NNSs.
Table 7: Frequency of fillers
Mean SD Min. Max.
frequency 3.27 3.36 0.99 9.43 Note: The frequency is expressed in percentiles.
Table 7 presents the mean value and standard
deviation of how often fillers occurred in the speech.
One speaker uttered 16 fillers, which was most
frequent, whereas three speakers did not produce
any. Excluding the speakers who did not use fillers
at all, the frequency ranged from 0.99% to 9.43%.
Regarding the relation with the global oral
proficiency, two speakers out of the three who did
not produce any filler received the below-average
score and the other made a 0.03 higher score than
the average. Therefore, it does not seem appropriate
to claim that the higher the proficiency was, the
fewer fillers the speakers used. In fact, the
correlation analysis did not yield any significant
correlation, r = -.26, p >.05.
3.3.2 Duration
The durational features on fillers are demonstrated
in Table 8. One speaker produced one filler which
was 1190 ms, far longer than the average, and was
regarded as an outlier and was excluded from this
analysis. The speaker’s total length of the speech
was varied; therefore, the mean length of the fillers
is represented in percent figures. Clark and Tree
(2002) argued “um” is related with a major delay of
the speech, and this was verified in our findings.
Table 8: Duration of fillers
Mean SD Min. Max.
overall 335.3 108.9 187.7 567.99 V 265.59 80.15 130.89 426.62 V + N 544.08 120.7 418.85 699.77 N 412.86 238.96 228.50 860.79 Note: V, V + N and N refer to “uh,” “um” and “mmm.” These
durations are expressed in milliseconds.
On the other hand, when the proficiency score
of the speakers was compared with the durational
features of fillers, the duration did not seem to be a
critical contributor to the higher proficiency.
Considering the fact that five speakers with a lower
proficiency score than the average generally used
shorter pauses and two speakers with a higher
proficiency score longer pauses, the half of the
analyzed speakers bore the opposite results to the
anticipation that the longer pauses would lead to the
dysfluency. The statistical analysis also did not
show a significant correlation, r = .19, p >.05.
3.3.3 Acoustic features of the vocalic segment
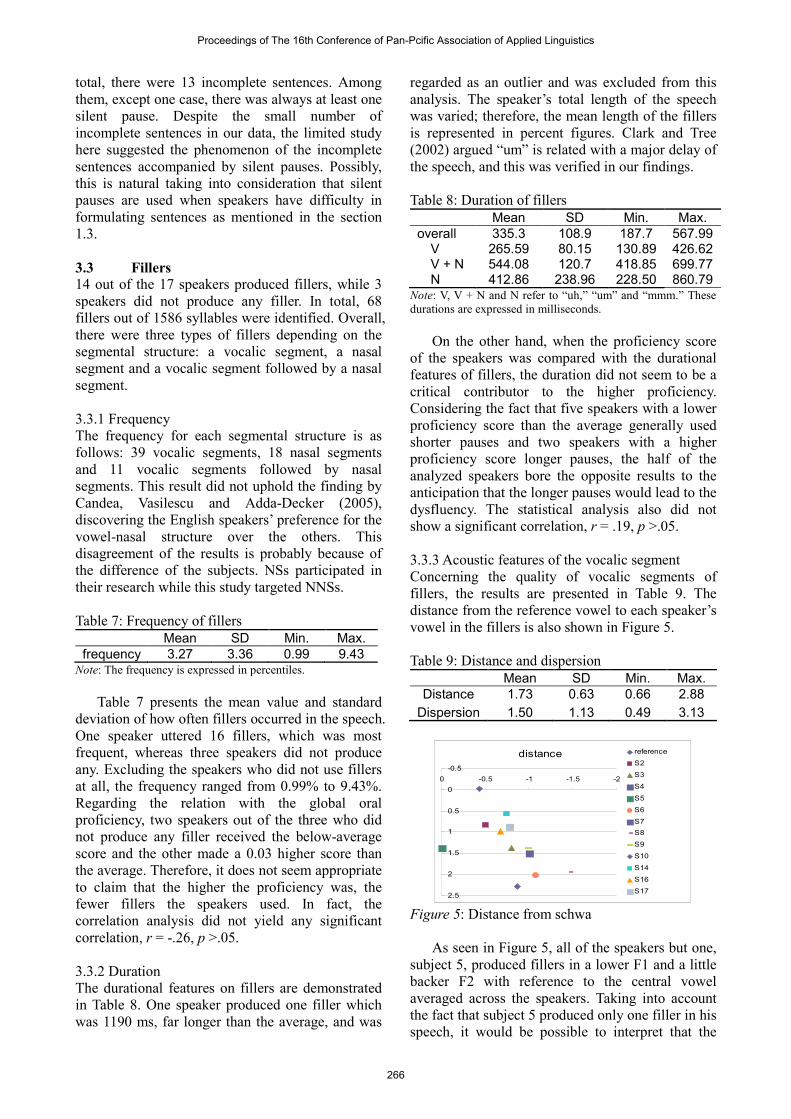
Concerning the quality of vocalic segments of
fillers, the results are presented in Table 9. The
distance from the reference vowel to each speaker’s
vowel in the fillers is also shown in Figure 5.
Table 9: Distance and dispersion
Mean SD Min. Max.
Distance 1.73 0.63 0.66 2.88
Dispersion 1.50 1.13 0.49 3.13
distance
-0.5
0
0.5
1
1.5
2
2.5
-2-1.5-1-0.50
reference
S2
S3
S4
S5
S6
S7
S8
S9
S10
S14
S16
S17
Figure 5: Distance from schwa
As seen in Figure 5, all of the speakers but one,
subject 5, produced fillers in a lower F1 and a little
backer F2 with reference to the central vowel
averaged across the speakers. Taking into account
the fact that subject 5 produced only one filler in his
speech, it would be possible to interpret that the
Proceedings of The 16th Conference of Pan-Pcific Association of Applied Linguistics
266
NNSs fairly succeeded in producing the fillers
using a low central quality which was identified as
the vowel quality of English fillers by Candea,
Vasilescu and Adda-Decker (2005). However, the
actual distance somewhat differed from speaker to
speaker in that some speakers’ fillers were closer to
the reference vowel, a central vowel, than others.
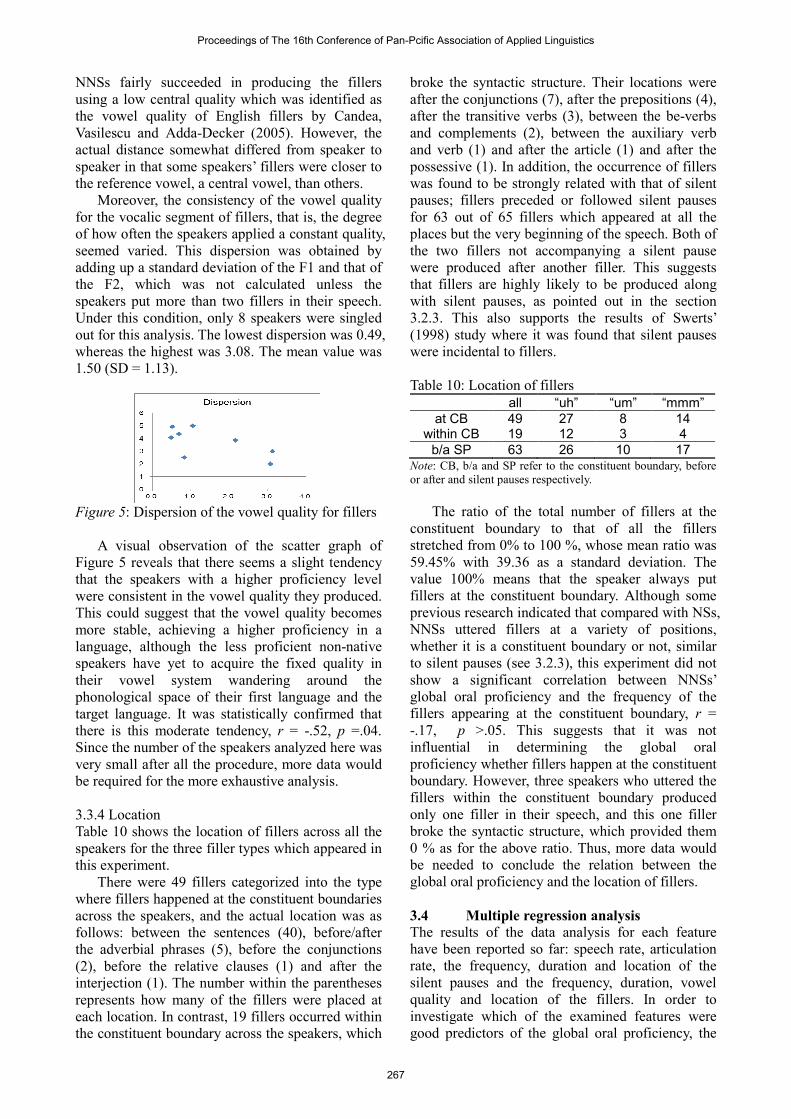
Moreover, the consistency of the vowel quality
for the vocalic segment of fillers, that is, the degree
of how often the speakers applied a constant quality,
seemed varied. This dispersion was obtained by
adding up a standard deviation of the F1 and that of
the F2, which was not calculated unless the
speakers put more than two fillers in their speech.
Under this condition, only 8 speakers were singled
out for this analysis. The lowest dispersion was 0.49,
whereas the highest was 3.08. The mean value was
1.50 (SD = 1.13).
Figure 5: Dispersion of the vowel quality for fillers
A visual observation of the scatter graph of
Figure 5 reveals that there seems a slight tendency
that the speakers with a higher proficiency level
were consistent in the vowel quality they produced.
This could suggest that the vowel quality becomes
more stable, achieving a higher proficiency in a
language, although the less proficient non-native
speakers have yet to acquire the fixed quality in
their vowel system wandering around the
phonological space of their first language and the
target language. It was statistically confirmed that
there is this moderate tendency, r = -.52, p =.04.
Since the number of the speakers analyzed here was
very small after all the procedure, more data would
be required for the more exhaustive analysis.
3.3.4 Location
Table 10 shows the location of fillers across all the
speakers for the three filler types which appeared in
this experiment.
There were 49 fillers categorized into the type
where fillers happened at the constituent boundaries
across the speakers, and the actual location was as
follows: between the sentences (40), before/after
the adverbial phrases (5), before the conjunctions
(2), before the relative clauses (1) and after the
interjection (1). The number within the parentheses
represents how many of the fillers were placed at
each location. In contrast, 19 fillers occurred within
the constituent boundary across the speakers, which
broke the syntactic structure. Their locations were
after the conjunctions (7), after the prepositions (4),
after the transitive verbs (3), between the be-verbs
and complements (2), between the auxiliary verb
and verb (1) and after the article (1) and after the
possessive (1). In addition, the occurrence of fillers
was found to be strongly related with that of silent
pauses; fillers preceded or followed silent pauses
for 63 out of 65 fillers which appeared at all the
places but the very beginning of the speech. Both of
the two fillers not accompanying a silent pause
were produced after another filler. This suggests
that fillers are highly likely to be produced along
with silent pauses, as pointed out in the section
3.2.3. This also supports the results of Swerts’
(1998) study where it was found that silent pauses
were incidental to fillers.
Table 10: Location of fillers
all “uh” “um” “mmm”
at CB 49 27 8 14 within CB 19 12 3 4
b/a SP 63 26 10 17 Note: CB, b/a and SP refer to the constituent boundary, before
or after and silent pauses respectively.
The ratio of the total number of fillers at the
constituent boundary to that of all the fillers
stretched from 0% to 100 %, whose mean ratio was
59.45% with 39.36 as a standard deviation. The
value 100% means that the speaker always put
fillers at the constituent boundary. Although some
previous research indicated that compared with NSs,
NNSs uttered fillers at a variety of positions,
whether it is a constituent boundary or not, similar
to silent pauses (see 3.2.3), this experiment did not
show a significant correlation between NNSs’
global oral proficiency and the frequency of the
fillers appearing at the constituent boundary, r =
-.17, p >.05. This suggests that it was not
influential in determining the global oral
proficiency whether fillers happen at the constituent
boundary. However, three speakers who uttered the
fillers within the constituent boundary produced
only one filler in their speech, and this one filler
broke the syntactic structure, which provided them
0 % as for the above ratio. Thus, more data would
be needed to conclude the relation between the
global oral proficiency and the location of fillers.
3.4 Multiple regression analysis The results of the data analysis for each feature
have been reported so far: speech rate, articulation
rate, the frequency, duration and location of the
silent pauses and the frequency, duration, vowel
quality and location of the fillers. In order to
investigate which of the examined features were
good predictors of the global oral proficiency, the
Proceedings of The 16th Conference of Pan-Pcific Association of Applied Linguistics
267
data was submitted to the multiple regression
analysis. The four features which were proved to be
significantly correlated with the score of global oral
proficiency in the previous sections were applied as
independent variables. Table 11 represents the result
of the multiple regressions.
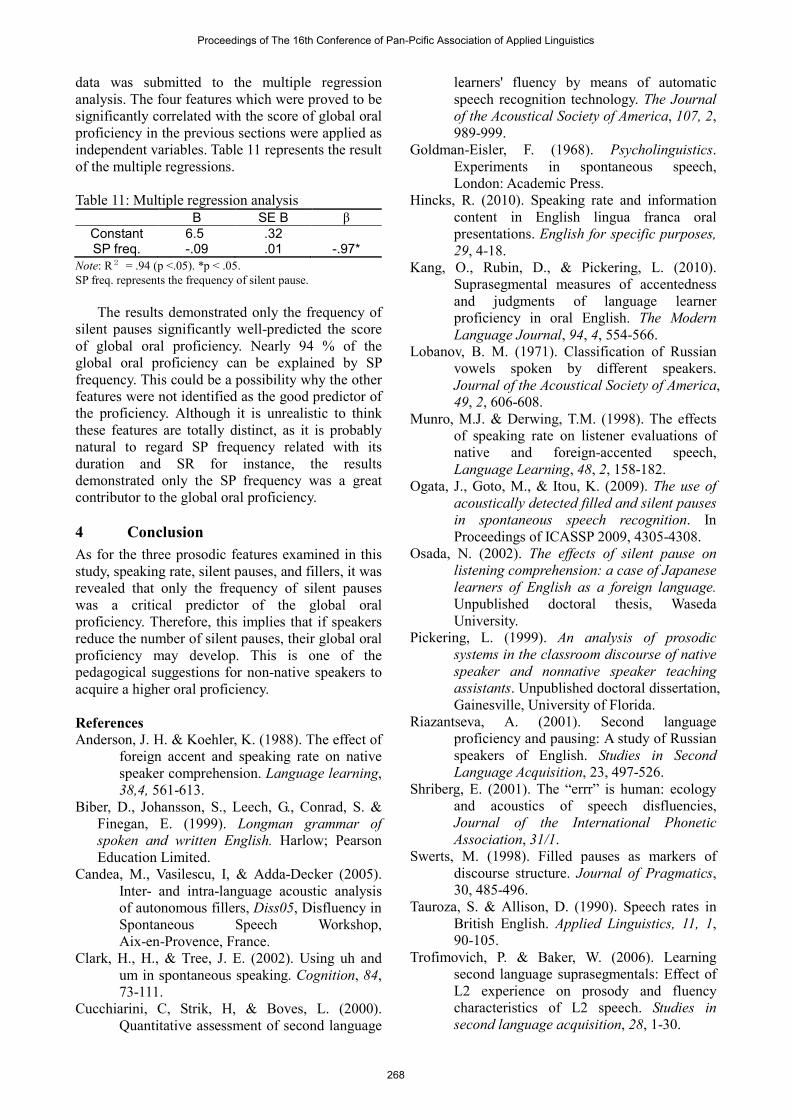
Table 11: Multiple regression analysis
B SE B β
Constant 6.5 .32
SP freq. -.09 .01 -.97*
Note: R2 = .94 (p <.05). *p < .05.
SP freq. represents the frequency of silent pause.
The results demonstrated only the frequency of
silent pauses significantly well-predicted the score
of global oral proficiency. Nearly 94 % of the
global oral proficiency can be explained by SP
frequency. This could be a possibility why the other
features were not identified as the good predictor of
the proficiency. Although it is unrealistic to think
these features are totally distinct, as it is probably
natural to regard SP frequency related with its
duration and SR for instance, the results
demonstrated only the SP frequency was a great
contributor to the global oral proficiency.
4 Conclusion
As for the three prosodic features examined in this
study, speaking rate, silent pauses, and fillers, it was
revealed that only the frequency of silent pauses
was a critical predictor of the global oral
proficiency. Therefore, this implies that if speakers
reduce the number of silent pauses, their global oral
proficiency may develop. This is one of the
pedagogical suggestions for non-native speakers to
acquire a higher oral proficiency.
References
Anderson, J. H. & Koehler, K. (1988). The effect of
foreign accent and speaking rate on native
speaker comprehension. Language learning,
38,4, 561-613.
Biber, D., Johansson, S., Leech, G., Conrad, S. &
Finegan, E. (1999). Longman grammar of
spoken and written English. Harlow; Pearson
Education Limited.
Candea, M., Vasilescu, I, & Adda-Decker (2005).
Inter- and intra-language acoustic analysis
of autonomous fillers, Diss05, Disfluency in
Spontaneous Speech Workshop,
Aix-en-Provence, France.
Clark, H., H., & Tree, J. E. (2002). Using uh and
um in spontaneous speaking. Cognition, 84,
73-111.
Cucchiarini, C, Strik, H, & Boves, L. (2000).
Quantitative assessment of second language
learners' fluency by means of automatic
speech recognition technology. The Journal
of the Acoustical Society of America, 107, 2,
989-999.
Goldman-Eisler, F. (1968). Psycholinguistics.
Experiments in spontaneous speech,
London: Academic Press.
Hincks, R. (2010). Speaking rate and information
content in English lingua franca oral
presentations. English for specific purposes,
29, 4-18.
Kang, O., Rubin, D., & Pickering, L. (2010).
Suprasegmental measures of accentedness
and judgments of language learner
proficiency in oral English. The Modern
Language Journal, 94, 4, 554-566.
Lobanov, B. M. (1971). Classification of Russian
vowels spoken by different speakers.
Journal of the Acoustical Society of America,
49, 2, 606-608.
Munro, M.J. & Derwing, T.M. (1998). The effects
of speaking rate on listener evaluations of
native and foreign-accented speech,
Language Learning, 48, 2, 158-182.
Ogata, J., Goto, M., & Itou, K. (2009). The use of
acoustically detected filled and silent pauses
in spontaneous speech recognition. In
Proceedings of ICASSP 2009, 4305-4308.
Osada, N. (2002). The effects of silent pause on
listening comprehension: a case of Japanese
learners of English as a foreign language.
Unpublished doctoral thesis, Waseda
University.
Pickering, L. (1999). An analysis of prosodic
systems in the classroom discourse of native
speaker and nonnative speaker teaching
assistants. Unpublished doctoral dissertation,
Gainesville, University of Florida.
Riazantseva, A. (2001). Second language
proficiency and pausing: A study of Russian
speakers of English. Studies in Second
Language Acquisition, 23, 497-526.
Shriberg, E. (2001). The “errr” is human: ecology
and acoustics of speech disfluencies,
Journal of the International Phonetic
Association, 31/1.
Swerts, M. (1998). Filled pauses as markers of
discourse structure. Journal of Pragmatics,
30, 485-496.
Tauroza, S. & Allison, D. (1990). Speech rates in
British English. Applied Linguistics, 11, 1,
90-105.
Trofimovich, P. & Baker, W. (2006). Learning
second language suprasegmentals: Effect of
L2 experience on prosody and fluency
characteristics of L2 speech. Studies in
second language acquisition, 28, 1-30.
Proceedings of The 16th Conference of Pan-Pcific Association of Applied Linguistics
268