Embed Size (px)
Citation preview
TRANSPORT A N D ROAD RESEARCH LABORATORY Department of Transport
RESEARCH REPORT 116
A PARAMETRIC STUDY OF THE STABILITY OF EMBEDDED
CANTILEVER RETAINING WALLS
by I F S Y M O N S (TRRL) and H KOTERA (TAISEI C O R P O R A T I O N , Y O K O H A M A , J A P A N )
The views expressed in this report are not necessarily those of the Department of Transport
Ground Engineering Division Structures Group Transport and Road Research Laboratory Crowthorne, Berkshire, RG11 6AU 1987
ISSN 0266-5247
Ownership of the Transport Research Laboratory was transferred from the Department of Transport to a subsidiary of the Transport Research Foundation on I st April 1996.
This report has been reproduced by permission of the Controller of HMSO. Extracts from the text may be reproduced, except for commercial purposes, provided the source is acknowledged.
CONTENTS
List of Symbols
Abstract
1. Introduction
2. Variables considered in the study
3. Calculation of Wall Stability
3.1 Failure Mechanism
3.2 Earth Pressures
3.3 Factors of Safety
3.3.1
3.3.2
3.3.3
3.3.4
The CP2 Method
The Net Total Pressure Method
The Strength Method
Burland-- Potts Method
4. Results and Discussion
4.1 Effects of variation in the shear strength parameters
4.2 Effects of changes in ground water conditions and assumed porewater pressure distribution
4.3 Relations between the Methods
4.4 Comparison of Methods when used in design
5. Conclusions
6. Acknowledgements
7. References
Page
iv
1
1
1
2
2
2
3
3
3
3
5
5
6
7
8
10
14
14
14
© CROWN COPYRIGHT 1987 Extracts from the text may be reproduced,
except for commercial purposes, provided the source is acknowledged

LIST OF SYMBOLS C I
Cw
6
)"
Kac
Kpc
P;
p~'.
P;
Pp.
Pan I
Ppn I
Pwa
Pwp
Oh'
Ov I
u
h
d
do
Effective cohesion intercept
Effective angle of internal fr iction
Wall adhesion
Angle of wall fr iction
Unit weight of soil
Act ive earth pressure coefficients
Passive earth pressure coefficients
Act ive soil thrust
Horizontal component of active soil force
Passive soil thrust
Horizontal component of passive soil force
Horizontal component of active earth pressure
Horizontal component of passive earth pressure
Water force on active side
Water force on passive side
Effective horizontal soil stress
Effective vertical soil stress
Porewater pressure
Retained height
Total depth of penetration
Reduced depth of penetration
A PARAMETRIC STUDY OF THE STABILITY OF EMBEDDED CANTILEVER RETAINING WALLS
ABSTRACT
In the design of an embedded earth retaining structure the geometry is adjusted to achieve a prescribed factor of safety against overturning. There are at present a number of methods which can be used to assess the stability of an embedded retaining wall, each of which gives a different value of the factor of safety for a stable wall configuration. To achieve a measure of consistency in the design of this type of structure information is therefore needed on the interrelations between the methods.
This report gives results from a parametric study which used four different methods to assess the stability of an embedded cantilever wall retaining 5 metres of ground. The effect on the factors of safety of variations in individual input parameters are illustrated and the findings compared with the values of factor of safety currently recommended for design.
1 INTRODUCTION
In the design of earthworks and earth retaining structures the normal approach adopted is to postulate a collapse mechanism and to determine the factor of safety for this; if necessary the dimensions of the structure are then adjusted until the factor of safety equals or exceeds a prescribed value. For embedded retaining walls consideration of moment equilibrium is normally the key criterion since both model tests (Powrie 1986) and field experience (Daniel and Olson 1982) have shown that overturning of the wall by rotation about a point near its base or about a point of support is the most likely failure mode.
A number of methods can be used by the designer to assess the stability of the structure against overturning, each of which employs a different definition of the factor of safety. For a given set of design parameters, each method will therefore yield a different value for the factor of safety; the only exception is when the wall is on the point of overturning and all methods give a factor of safety of unity. To ensure a measure of consistency in design, information is required on the interrelation between the factors of safety given by the different methods, so that appropriate values can be established.
Comparisons of four methods of assessing stability for the case of an embedded wall propped at the top have been published previously (Potts and Burland
1983, Symons 1983). This work formed the basis for the recommendations concerning the factors of safety to be used for embedded walls in st i f f clay given by Padfield and Mair (1984).
Many embedded retaining walls are unsupported and act as free standing cantilevers. These include retaining walls on the A329(M) at Reading (Burland Simpson and St John 1979) and on the M25 at Dunton Green (Garrett and Barnes 1984). To examine the relations between the methods of assessing stabil ity for this case a similar parametric study has been carried out and the results are given in this report. A wide range of soil parameters was considered in the study together with variations in both the position of the water table and the assumed distributions of porewater pressures.
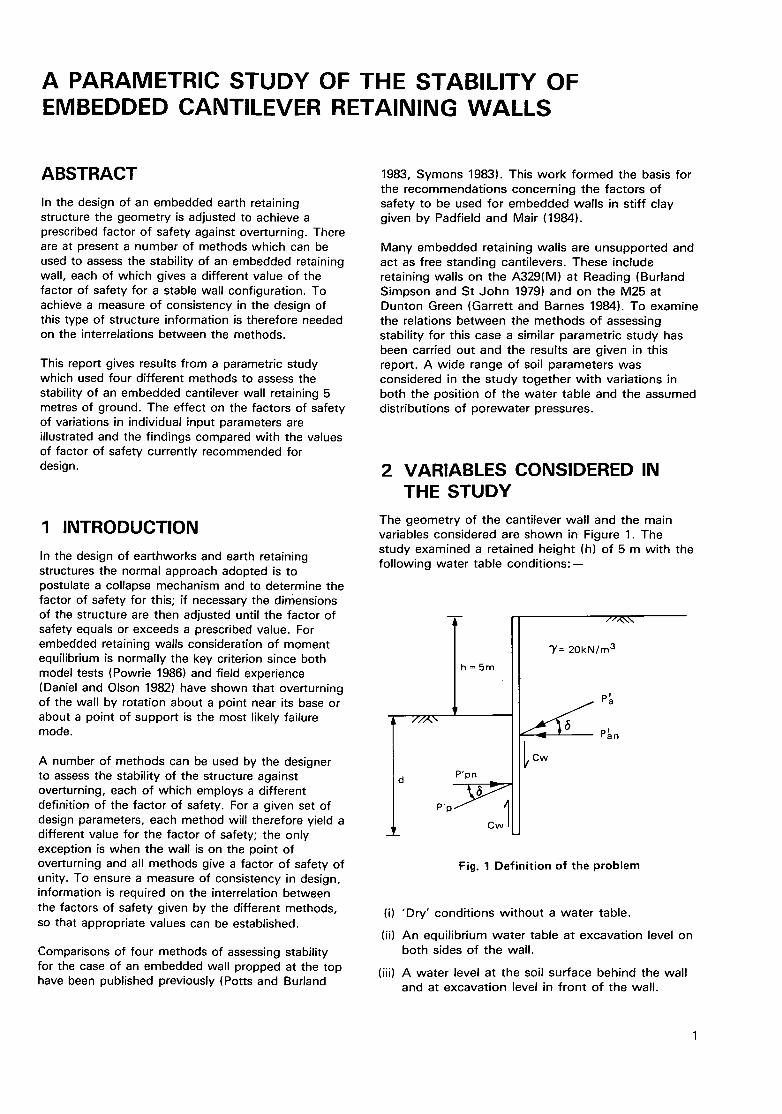
2 VARIABLES CONSIDERED IN THE STUDY
The geometry of the cantilever wall and the main variables considered are shown in Figure 1. The study examined a retained height (h) of 5 m with the fol lowing water table condit ions:--
t h=5m
P'pn
P ' P ~ Cw!
//,R~\
~'= 20kN/m 3
Pan
Fig. 1 Definition of the problem
(i) 'Dry' conditions wi thout a water table.
(ii) An equilibrium water table at excavation level on both sides of the wall.
(iii) A water level at the soil surface behind the wall and at excavation level in front of the wall.
In the last case two types of porewater pressure distr ibutions were assumed. First a distribution was used based on a linear decrease in hydraulic head down the back and up the front of the wall to simulate a condition of steady seepage (Burland, Potts and Walsh 1981). Secondly hydrostatic distr ibutions based on the water levels acting on each side of the wall were used. These two distributions are referred to in the subsequent text as a Type 1 and a Type 2 distr ibution respectively.
Drained conditions in the soil were assumed in the analyses and the shear strengh parameters (c ' , (~') and wal l interface properties (&,Cw) were varied over the fol lowing ranges:
c' of 0, 5 and 10 kN /m 2 with c__~ of 0 and 1. c'
(~' of 15 ° to 35 ° in increments of 5 ° or 10 ° , each wi th &/~' of 0 and 1.
A number of cases were also considered in which intermediate values of wall adherence cw and friction 6 were used to clarify the influence of these parameters on the factors of safety. In addition for 'dry' conditions only, the range of ~' was increased to 40 ° .
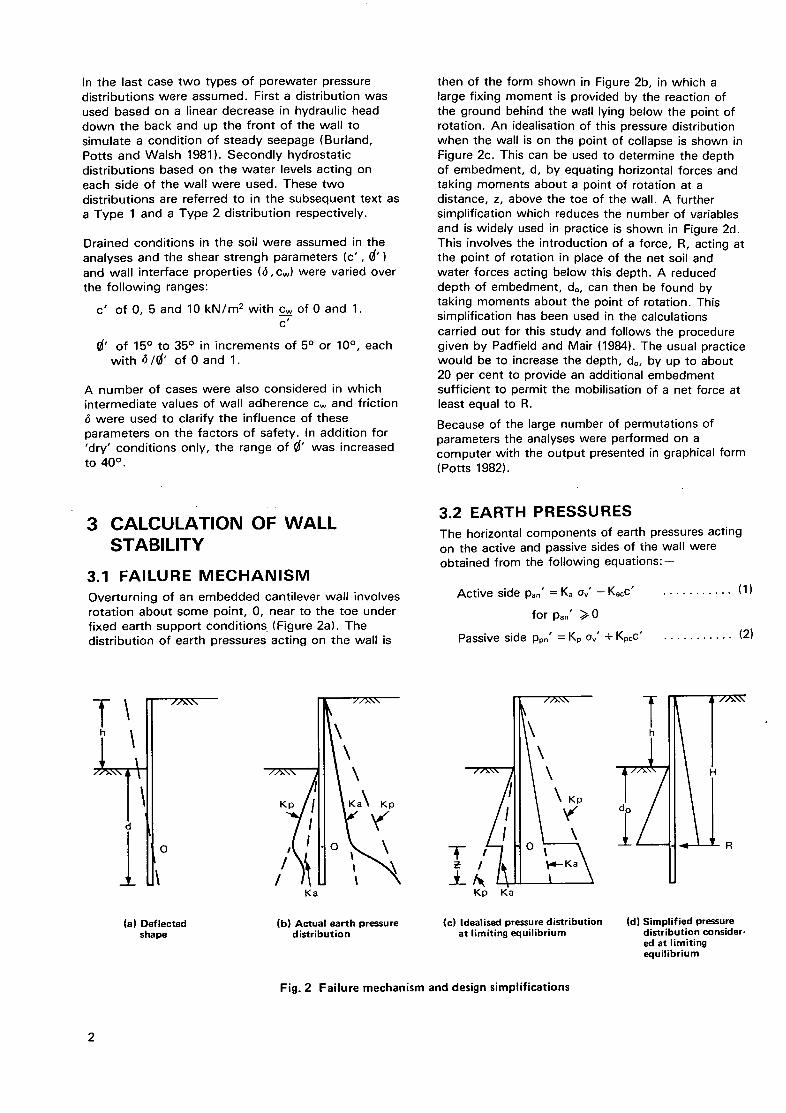
then of the form shown in Figure 2b, in which a large fixing moment is provided by the reaction of the ground behind the wall lying below the point of rotation. An idealisation of this pressure distribution when the wall is on the point of collapse is shown in Figure 2c. This can be used to determine the depth of embedment, d, by equating horizontal forces and taking moments about a point of rotation at a distance, z, above the toe of the wall. A further simplification which reduces the number of variables and is widely used in practice is shown in Figure 2d. This involves the introduction of a force, R, acting at the point of rotation in place of the net soil and water forces acting below this depth. A reduced depth of embedment, do, can then be found by taking moments about the point of rotation. This simplification has been used in the calculations carried out for this study and follows the procedure given by Padfield and Mair (1984). The usual practice would be to increase the depth, do, by up to about 20 per cent to provide an additional embedment sufficient to permit the mobilisation of a net force at least equal to R.
Because of the large number of permutations of parameters the analyses were performed on a computer with the output presented in graphical form (Potts 1982)o
3 CALCULATION OF WALL STABILITY
3.1 FAILURE MECHANISM Overturning of an embedded cantilever wall involves rotation about some point, 0, near to the toe under f ixed earth support condit ions (Figure 2a). The distribution of earth pressures acting on the wall is
3.2 EARTH PRESSURES The horizontal components of earth pressures acting on the active and passive sides of the wall were obtained from the following equat ions:-
Active side Pan' =Ka Ov' - Kacc' . . . . . . . . . . . (1)
for pan' >/0
Passive side ppn' = Kp Ov' + Kpcc' . . . . . . . . . . . (2)
T\ h
//"~\\ l d
1
/.,~\\
O
(a) Deflected shape
Kp
/
fh.%..
\ \\
Ka
/
-I-
_I_ I\ l l Kp Ka
//x\'~
\ \\
(b) Actual earth pressure d istribution
(c) Idealised pressure distribution at limiting equilibrium
Fig. 2 Failure mechanism and design simplifications
(d) Simplified pressure distribution consider- ed at limiting equilibrium
Where or' is the effective vertical stress taken equal to the effective overburden pressure
Ka, Kac, Kp, K~c are the Earth Pressure coefficients which include the effect of wall friction 6 and adherence cw.
The values of Ka were obtained using Coulombs equation and the values of Kn from Caquot and Kerisel (1948). The earth pressure coefficients Kac and Kpc were then derived using the following relations:--
3.3 F A C T O R S OF S A F E T Y Four methods of assessing wall stability were used in the study and the definition of the factor of safety associated with each of the methods is described in the following subsections and illustrated in Figures 3 to 6.
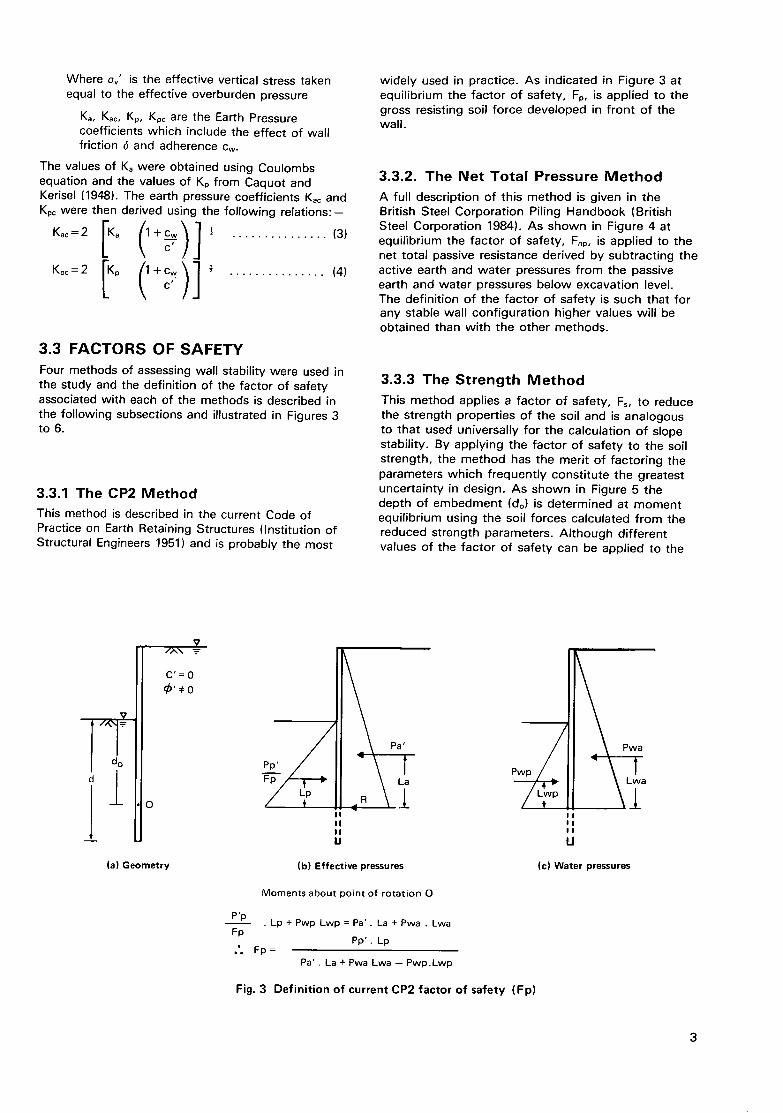
3.3.1 The CP2 Method This method is described in the current Code of Practice on Earth Retaining Structures (Institution of Structural Engineers 1951) and is probably the most
widely used in practice. As indicated in Figure 3 at equilibrium the factor of safety, Fp, is applied to the gross resisting soil force developed in f ront of the wall.
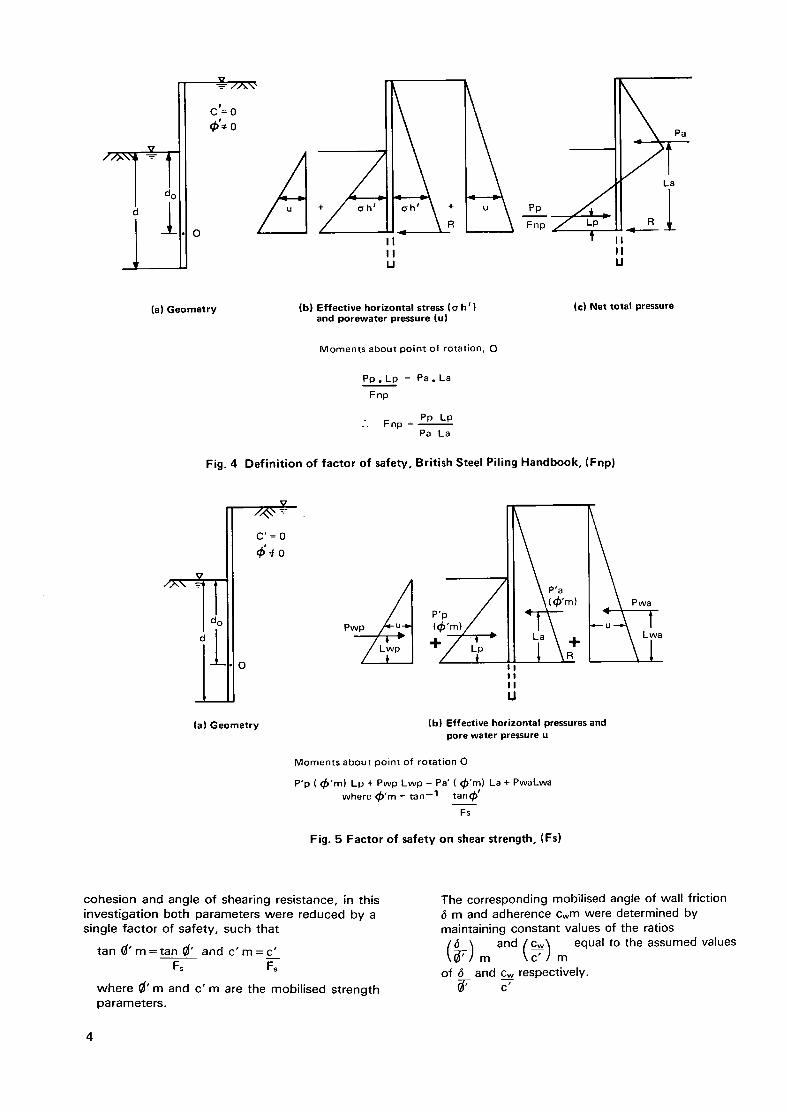
3.3.2. T h e N e t T o t a l P r e s s u r e M e t h o d
A full description of this method is given in the British Steel Corporation Piling Handbook (British Steel Corporation 1984). As shown in Figure 4 at equilibrium the factor of safety, Fnp, is applied to the net total passive resistance derived by subtracting the active earth and water pressures from the passive earth and water pressures below excavation level. The definition of the factor of safety is such that for any stable wall configurat ion higher values will be obtained than with the other methods.
3.3.3 The Strength Method This method applies a factor of safety, Fs, to reduce the strength properties of the soil and is analogous to that used universally for the calculation of slope stability. By applying the factor of safety to the soil strength, the method has the merit of factoring the parameters which frequent ly consti tute the greatest uncertainty in design. As shown in Figure 5 the depth of embedrnent (do) is determined at moment equilibrium using the soil forces calculated from the reduced strength parameters. Al though dif ferent values of the factor of safety can be applied to the
C ' = 0 ¢,',o
d 0
(a) Geometry
pp'
I I II II U
Pa' P w p ~
La
l / wo
(b) Effective pressures
Moments about point of rotat ion O
p'p • L p + P w p L w p = P a ' . La +Pwa . Lwa
Fp Pp'. Lp
.°o Fp = Pa'. La + Pwa Lwa -- Pwp.Lwp
Fig. 3 Definit ion of current CP2 factor of safety (Fp)
T \? I
!
U
(c) Water pressures
+
R
V
I 0
V
C t= 0
~'~ 0
II II U
Pa
- il 1 Fnp J Lp - R
II II U
(a) Geometry
Fig. 4
(b) Effective horizontal stress (o h I ) and porewater pressure (u)
(c) Net total pressure
Moments about point of rotation, O
Pp. Lp = Pa. La
Fnp
Pp Lp .'. Fnp = - -
Pa La
Def ini t ion of factor of safety, British Steel Piling Handbook, (Fnp)
V / , , ~ w
C ' = 0
~ o V I
0
(a) Geometry
Pw P'P' u
/ . : Y \: I
U
(b) Effective horizontal pressures and pore water pressure u
Moments about point of rotation O
P'p (q~'m) Lp + Pwp Lwp = Pa' ((~l~'m) La + PwaLwa where (~'m = tan -1 tanq~) I
Fs
Fig. 5 Factor of safety on shear strength, (Fs)
cohes ion and angle o f shear ing resistance, in this inves t iga t ion both parameters were reduced by a s ing le f ac to r o f safety, such that
t a n ( ~ ' m = t a n ( ~ ' and c ' m = c ' Fs Fs
w h e r e (~'m and c ' m are the mobi l ised s t rength parameters .
The corresponding mobil ised angle of wal l fr ict ion 6 m and adherence Cwm were determined by maintain ing constant values of the ratios (~ - ' ) m and (~w,w) m equal to the assumed values
of 6 and c__~w respect ive ly 0~ c'
4
Jwh~
i f
V _-~ //5,\\
C I= 0
~)~'~ 0
o
Fr
II II U
P&__2
T La 1
-f T T
Lw1
(a) Geometry (b) Ef fect ive horizontal pressures (c) Net water pressures
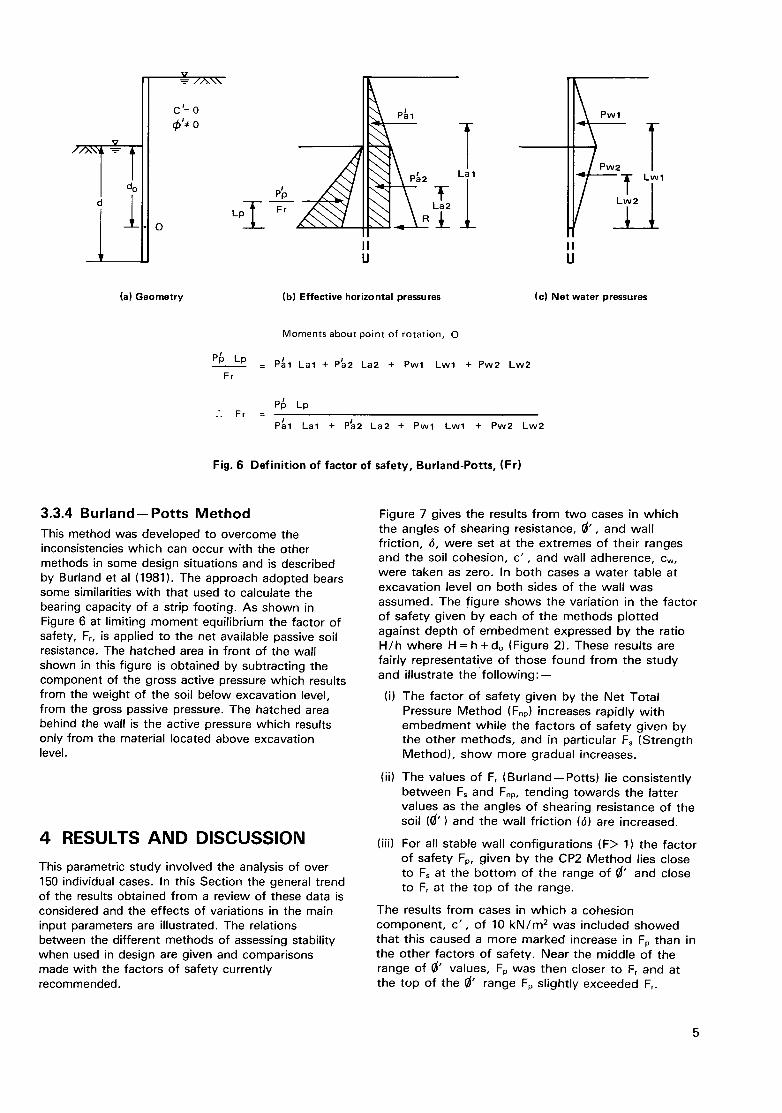
P~ L p
Fr
Moments about po in t o f ro ta t i on , O
P~I La t + P~2 La2 + Pw1 L w l + Pw2 L w 2
PI~ Lp • F r =
Pal La l + P~2 La2 + P w l L w l + Pw2 L w 2
Fig. 6 Definition of factor of safety, Burland-Potts, (Fr)
3 .3.4 B u r l a n d - - P o t t s M e t h o d
This method was developed to overcome the inconsistencies which can occur with the other methods in some design situations and is described by Burland et al (1981). The approach adopted bears some similarities with that used to calculate the bearing capacity of a strip footing. As shown in Figure 6 at limiting moment equilibrium the factor of safety, Fr, is applied to the net available passive soil resistance. The hatched area in front of the wall shown in this figure is obtained by subtracting the component of the gross active pressure which results from the weight of the soil below excavation level, from the gross passive pressure. The hatched area behind the wall is the active pressure which results only from the material located above excavation level.
4 RESULTS AND DISCUSSION
This parametric study involved the analysis of over 150 individual cases. In this Section the general trend of the results obtained from a review of these data is considered and the effects of variations in the main input parameters are illustrated. The relations between the different methods of assessing stability when used in design are given and comparisons made with the factors of safety currently recommended•
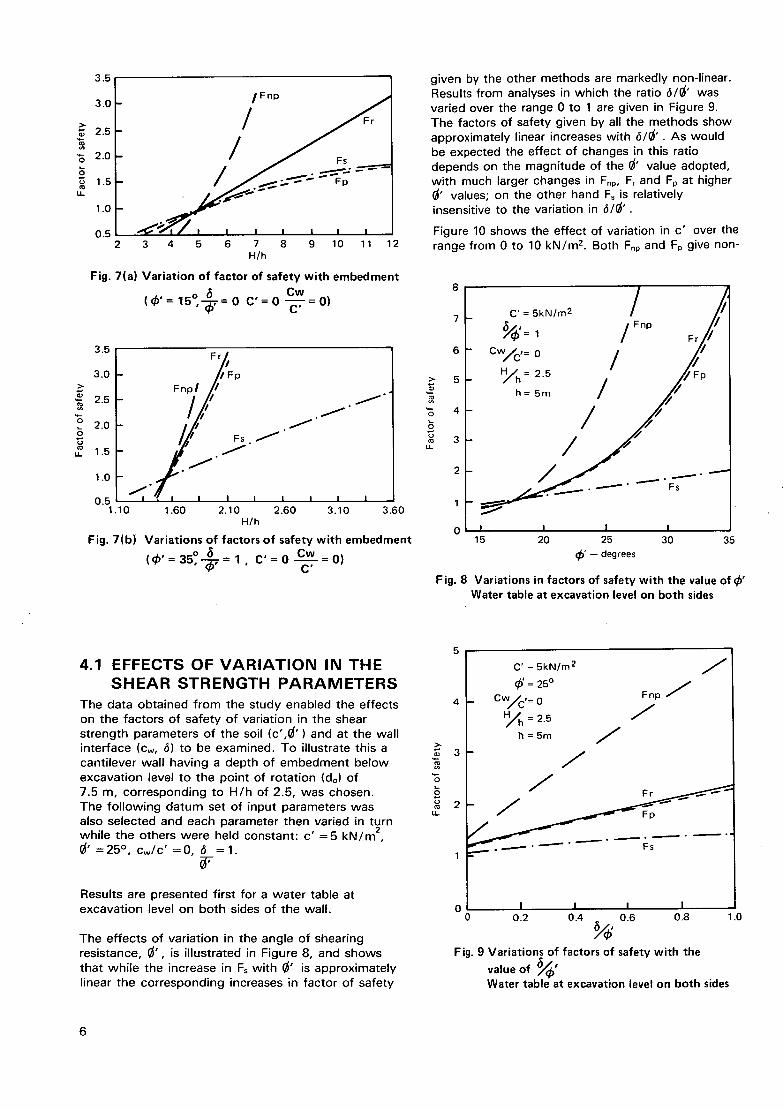
Figure 7 gives the results f rom two cases in which the angles of shearing resistance, ~', and wall fr iction, (~, were set at the extremes of their ranges and the soil cohesion, c ' , and wall adherence, Cw, were taken as zero• In both cases a water table at excavation level on both sides of the wall was assumed• The figure shows the variation in the factor of safety given by each of the methods plotted against depth of embedment expressed by the ratio H/h where H = h + do (Figure 2). These results are fairly representative of those found from the study and illustrate the fo l lowing: - -
(i) The factor of safety given by the Net Total Pressure Method (Fnp) increases rapidly with embedment while the factors of safety given by the other methods, and in particular Fs (Strength Method), show more gradual increases•
(ii) The values of Fr (Burland--Potts) lie consistently between Fs and Fnp, tending towards the latter values as the angles of shearing resistance of the soil ((~') and the wall fr ict ion (6) are increased.
(iii) For all stable wall configurations (F> 1) the factor of safety Fp, given by the CP2 Method lies close to Fs at the bottom of the range of (~" and close to Fr at the top of the range.
The results from cases in which a cohesion component, c ' , of 10 kN /m 2 was included showed that this caused a more marked increase in Fp than in the other factors of safety. Near the middle of the range of (~' values, Fp was then closer to Fr and at the top of the (~" range Fp slightly exceeded Ft.
3.5
r
2.5
• ~ 2.0
~ 1.5 u _
1.0-
0.5 2 3 4 5 6 7 8 9 10 11 2
H/h
Fig. 7(a) Variation of factor of safety with embedment
( ~ ) ' = 1 5 °, = 0 C ' = O - - ~ - = O )
3.5
3 . 0 - / I F p
,~ 2.5 F n p l / / I / /
Y .
~ 1.5 " . /
1.0 / 1 " 1 1 1 " i 0.5 < " I I I
1.10 1.60 2.10 H/h
o
I I 2.60 3.10 3.60
Fig. 7(b) Variations of factors of safety with embedment (q~,=35o ~, .=1 C,=O Cw =0) (p - • C'
given by the other methods are markedly non-linear. Results from analyses in which the ratio 6/~" was varied over the range 0 to 1 are given in Figure 9. The factors of safety given by all the methods show approximately linear increases with &/~J'. As would be expected the effect of changes in this ratio depends on the magnitude of the (~' value adopted, with much larger changes in Fnp, Fr and Fp at higher ~' values; on the other hand Fs is relatively insensitive to the variation in 6 /~ ' .
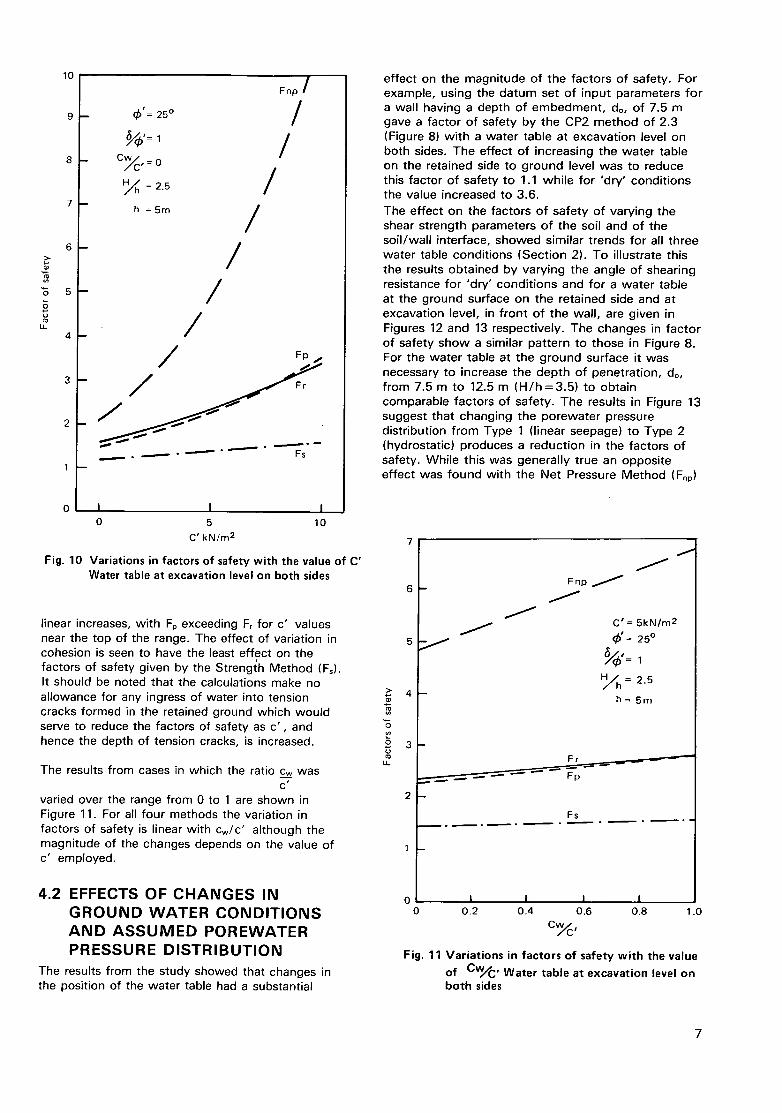
Figure 10 shows the effect of variation in c' over the range from 0 to 10 kN/m 2. Both Fnp and Fp give non-
>.
to LL
8 C'=SkN/~2 / 7 ~/~ ' - 1 / Fnp F r l /
6 CW/c'= 0 / ~7
5 ,~"h = 2.5 . j / p h=Srn / S
2 / . ~ . . . . ~ ~ ~ 4 ' - . ~ " Fs
1
0 I I I I 15 20 25 30 35
~' - degrees
Fig. 8 Variations in factors of safety with the value of ~' Water table at excavation level on both sides
4.1 EFFECTS OF VARIATION IN THE S H E A R S T R E N G T H P A R A M E T E R S
The data obtained from the study enabled the effects on the factors of safety of variation in the shear strength parameters of the soil (c',(~') and at the wall interface (Cw, 6) to be examined. To illustrate this a canti lever wall having a depth of embedment below excavation level to the point of rotation (do) of 7.5 m, corresponding to H/h of 2.5, was chosen. The fol lowing datum set of input parameters was also selected and each parameter then varied in turn while the others were held constant: c' = 5 kN/m 2, (~" =25 ° , Cw/C' =0 , 6 =1.
Results are presented first for a water table at excavation level on boths ides of the wall.
The effects of variation in the angle of shearing resistance, ~ ' , is i l lustrated in Figure 8, and shows that whi le the increase in Fs with (~" is approximately linear the corresponding increases in factor of safety
J C' = 5kN/m 2
~' = 25 ° Fnp / 4 - CW/c,= 0
3 -
• , - o .
1 ~ . .-.--- • "--'-- " -- '--- " " - - - - Fs
Ol I I I I 0 0.2 0.4 0.6 0.8 1.0
Fig. 9 Variations of factors of safety with the
value of ~ / ~ ' Water table at excavation level on both sides
"6
LL
10
9 B
8 -
7 -
6 -
5 --
4 --
3 --
2 --
1 --
0
q~'= 25 °
~ s= 1
C~C, = 0
h = 2.5
h =5m
Fnp /
/ /
/ /
/ /
/
..........-..---- • " ' ' - " " Fs
I I I 0 5 10
c' kN/m 2
Fig. 10 Variations in factors of safety wi th the value of C' Water table at excavation level on both sides
linear increases, wi th Fp exceeding F, for c' values near the top of the range. The effect of variation in cohesion is seen to have the least effect on the factors of safety given by the Strength Method (Fs). It should be noted that the calculations make no allowance for any ingress of water into tension cracks formed in the retained ground which would serve to reduce the factors of safety as c ' , and hence the depth of tension cracks, is increased.
The results from cases in which the ratio Cw was c'
varied over the range from 0 to 1 are shown in Figure 11. For all four methods the variation in factors of safety is linear wi th Cw/C' although the magnitude of the changes depends on the value of c' employed.
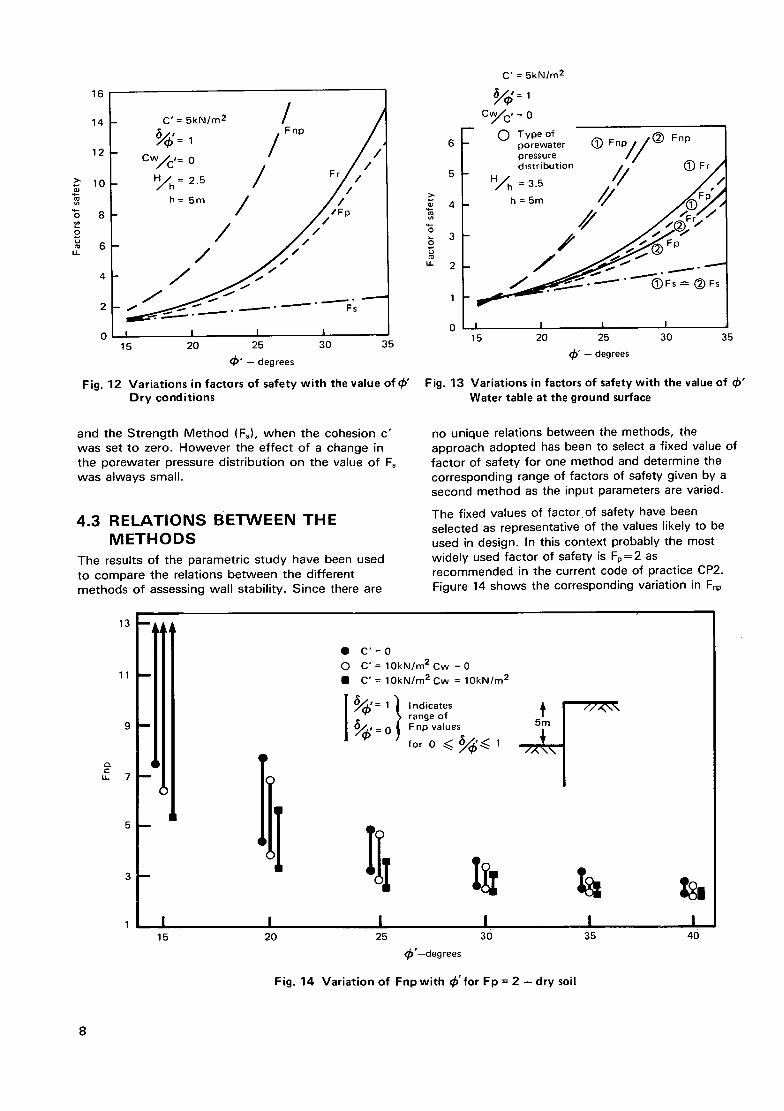
4.2 EFFECTS OF C H A N G E S IN G R O U N D W A T E R C O N D I T I O N S A N D A S S U M E D P O R E W A T E R P R E S S U R E D I S T R I B U T I O N
The results from the study showed that changes in the position of the water table had a substantial
effect on the magnitude of the factors of safety. For example, using the datum set of input parameters fo r a wall having a depth of embedment, do, of 7.5 m gave a factor of safety by the CP2 method of 2.3 (Figure 8) w i th a water table at excavat ion level on both sides. The effect of increasing the water table on the retained side to ground level was to reduce this factor of safety to 1.1 whi le for 'dry' condi t ions the value increased to 3.6. The effect on the factors of safety of varying the shear strength parameters of the soil and of the soi l /wal l interface, showed similar trends for all three water table condit ions (Section 2). To illustrate this the results obtained by varying the angle of shearing resistance for 'dry' condi t ions and for a water table at the ground surface on the retained side and at excavation level, in f ront of the wall , are given in Figures 12 and 13 respectively. The changes in factor of safety show a similar pattern to those in Figure 8. For the water table at the ground surface it was necessary to increase the depth of penetration, do, from 7.5 m to 12.5 m ( H / h = 3 . 5 ) to obtain comparable factors of safety. The results in Figure 13 suggest that changing the porewater pressure distr ibution f rom Type 1 (linear seepage) to Type 2 (hydrostatic) produces a reduct ion in the factors of safety. While this was general ly true an opposite effect was found wi th the Net Pressure Method (Fnp)
~" 4
o 3
LL
1 m
0 0
/ J
/
J /
F n p /
/
C ' = 5kN/m 2 =25 °
/ ~ ' = 1
h = 2 . 5
h = 5 m
Fs
| I I I 0.2 0.4 0.6 0.8 1.0
c~/~,
Fig. 1 1 Var ia t ions in factors of safety w i t h the value
of CW//c' Wate r table at excavat ion level on b o t h sides
16
14
12
"5 8
4
2
C' = 5kN/m2 / i ~/~'= 1 / F n p /
c WTc,= 0 ~ / / / _ ~ = 2 . 5 / F ~ /
/ U'"
I I I I 15 20 25 30 35
(~)' -- degrees
Fig. 12 Variations in factors of safety wi th the value of~ ' Dry conditions
and the Strength Method (Fs), when the cohesion c' was set to zero. However the effect of a change in the porewater pressure distribution on the value of Fs was always small.
4 .3 R E L A T I O N S B E T W E E N T H E M E T H O D S
The results of the parametric study have been used to compare the relations between the different methods of assessing wall stabil ity. Since there are
4
"6 3
LL 2
C'= 5kN/m 2
Cw//C' = 0
O Type of (~) Fnp porewater (3~) F n p / / pressure distribution / / (3~) F r /
HA = " / 7 , h=5m ~ . ~ F p ~
I I" I I I 15 20 25 30 35
(~)' -- degrees
Fig. 13 Variations in factors of safety with the value of ~ ' Water table at the ground surface
no unique relations between the methods, the approach adopted has been to select a fixed value of factor of safety for one method and determine the corresponding range of factors of safety given by a second method as the input parameters are varied.
The fixed values of factor,of safety have been selected as representative of the values likely to be used in design. In this context probably the most widely used factor of safety is F, = 2 as recommended in the current code of practice CP2. Figure 14 shows the corresponding variation in Fn~
Q . E
L L
13 B
11 B
9 - -
( 7 - -
5 - -
3 - -
1 I 15
• C ' = 0 O C' = 10kN/m 2 Cw = 0 • C '= 10kN/m 2Cw = 10kN/m 2
Indicates range of Fnp values
for 0 ~ ( ~ ' ~ 1 / I p
I I I 20 25 30
(~'--degrees
Fig. 14 Variation of Fnpwi th ~ ' fo r Fp = 2 - d r y soil
I 35
.
40
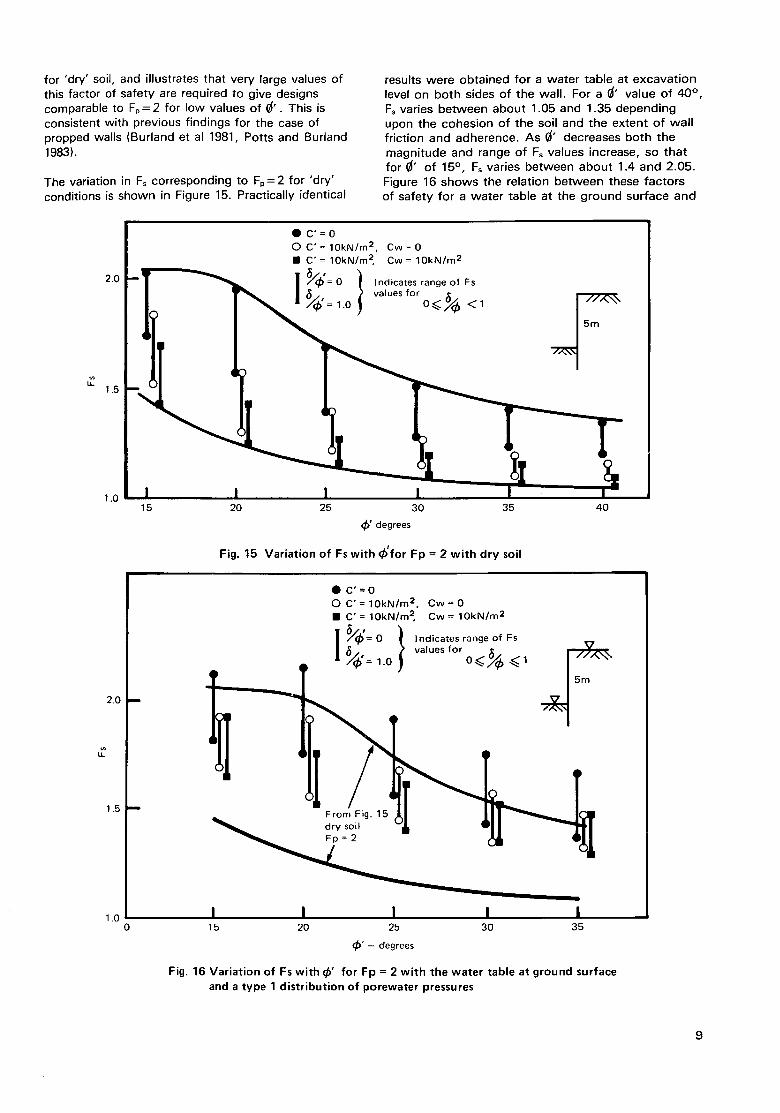
for 'dry' soil, and illustrates that very large values of this factor of safety are required to give designs comparable to F~ = 2 for low values of (~'. This is consistent with previous findings for the case of propped walls (Burland et al 1981, Potts and 8urland 1983).
The variation in F, corresponding to Fp = 2 for 'dry' conditions is shown in Figure 15. Practically identical
results were obtained for a water table at excavat ion level on both sides of the wall. For a ~' value of 40 °, Fs varies between about 1.05 and 1.35 depending upon the cohesion of the soil and the extent of wall friction and adherence. As (~' decreases both the magnitude and range of Fs values increase, so that for (~' of 15 °, Fs varies between about 1.4 and 2.05. Figure 16 shows the relation between these factors of safety for a water table at the ground surface and
2.0
1.5
1.0
• C ' = 0 O C'= 10kN/m 2, Cw=0 • C "= 10kN/m 2 Cw = 10kN/m 2
t
i I I I 15 20 25 30 35 40
(;1~ t degrees
Fig. 15 Variation of Fs with ~'for Fp = 2 wi th dry soil
2 . 0 m
1.5 m
1.0 0
• C'=O O C' = 10kN/m 2, C w = 0 • C'= 10kN/m 2, Cw = 10kN/m 2
! ~/~l= 0 } Indicates range °f Fs ~ ~/~0= 1. 0 values for 0 ~ < / ~ ~< 1
I I I I I 15 20 25 30 35
~ ' - - degrees
Fig. 16 Variation of Fs with (~' for Fp = 2 with the water table at ground surface and a type 1 distribution of porewater pressures
9
a Type 1 distr ibut ion of porewater pressure (linear seepage). The range of values from Figure 15 is also included for comparison. The trend of the results is similar a l though for this water table condit ion higher values of F~ are obtained over the complete range of (~' values. Changing from a Type 1 to a Type 2 (hydrostatic) distribution of porewater pressures gave F, values wh ich were slightly higher except at the bot tom of the parameter range when marginally smaller values were obtained. These results illustrate that a constant factor applied to the passive pressure will lead to a varying level of safety when assessed in terms of the proportion of the available shear strength of the soil which is mobilised at equilibrium.
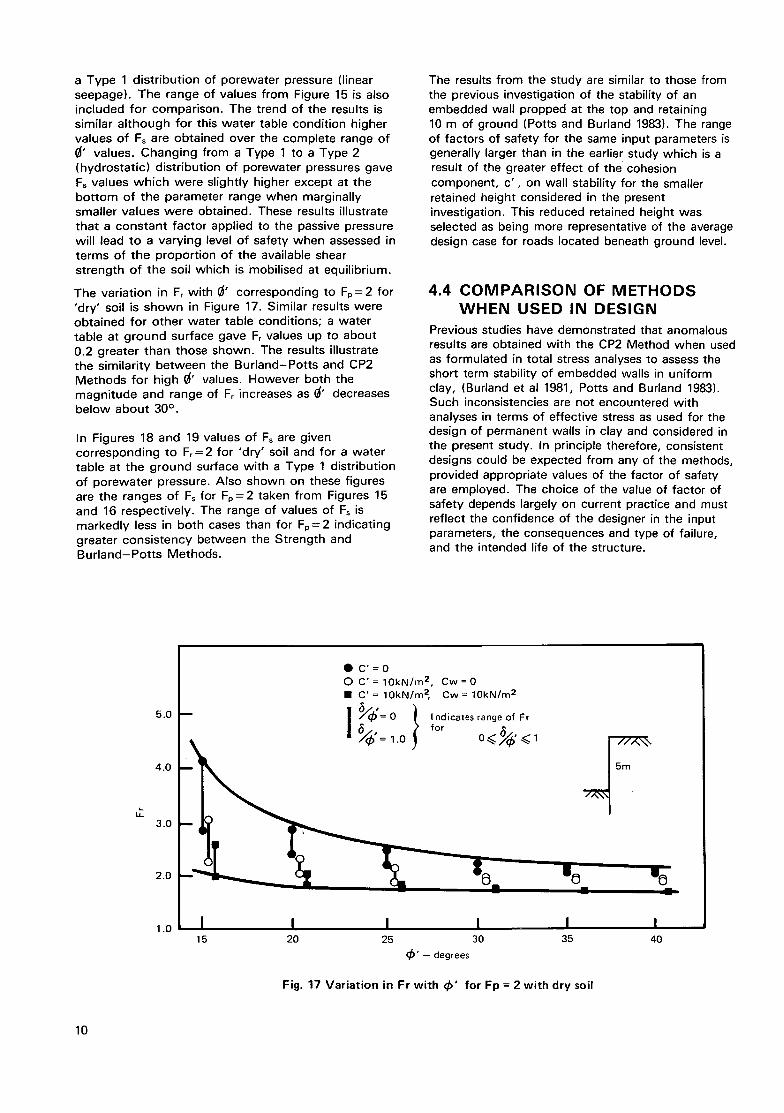
The variation in Fr with (~' corresponding to Fp=2 for 'dry' soil is shown in Figure 17. Similar results were obtained for other water table conditions; a water table at ground surface gave F, values up to about 0.2 greater than those shown. The results illustrate the similarity between the Bur land-Pot ts and CP2 Methods for high (~" values. However both the magnitude and range of Fr increases as (~' decreases below about 30 ° .
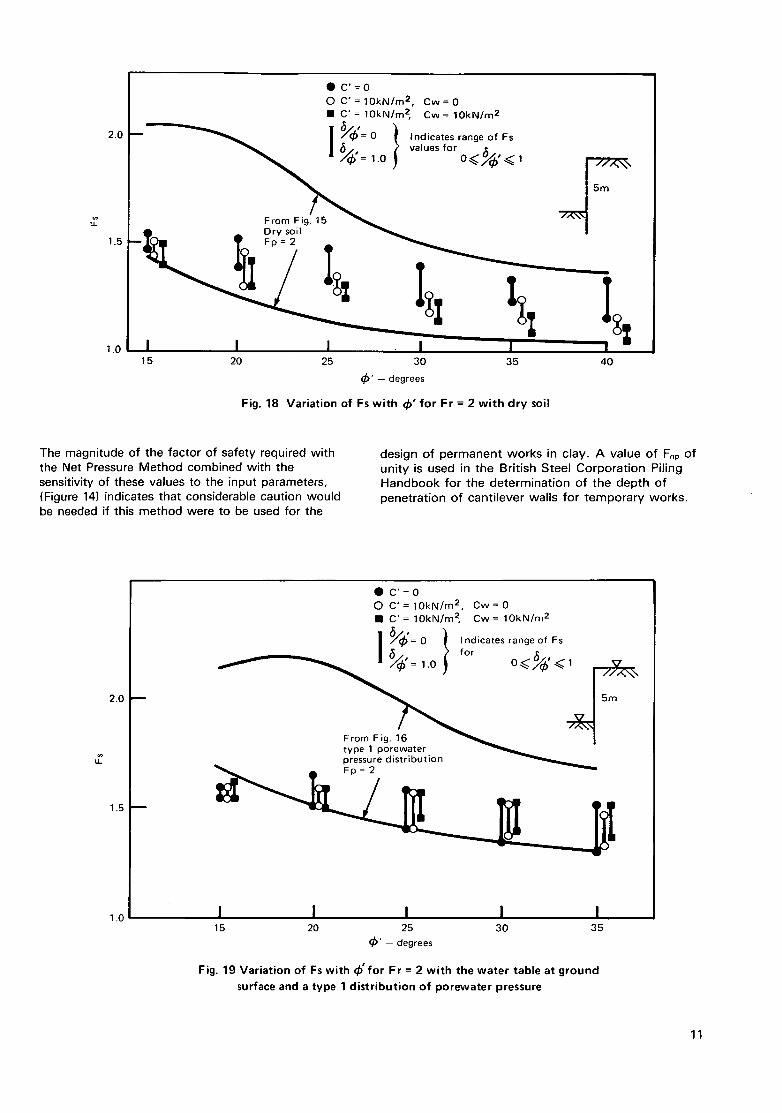
In Figures 18 and 19 values of Fs are given corresponding to Fr = 2 for 'dry' soil and for a water table at the ground surface with a Type 1 distribution of porewater pressure. Also shown on these figures are the ranges of Fs for Fp=2 taken from Figures 15 and 16 respectively. The range of values of Fs is markedly less in both cases than for Fp = 2 indicating greater consistency between the Strength and Bur land-Pot ts Methods.
The results from the study are similar to those from the previous investigation of the stability of an embedded wall propped at the top and retaining 10 m of ground (Potts and Burland 1983). The range of factors of safety for the same input parameters is generally larger than in the earlier study which is a result of the greater effect of the cohesion component, c ' , on wall stability for the smaller retained height considered in the present investigation. This reduced retained height was selected as being more representative of the average design case for roads located beneath ground level.
4.4 C O M P A R I S O N OF M E T H O D S W H E N USED IN DESIGN
Previous studies have demonstrated that anomalous results are obtained with the CP2 Method when used as formulated in total stress analyses to assess the short term stability of embedded walls in uniform clay, (Burland et al 1981, Potts and Burland 1983). Such inconsistencies are not encountered with analyses in terms of effective stress as used for the design of permanent walls in clay and considered in the present study. In principle therefore, consistent designs could be expected from any of the methods, provided appropriate values of the factor of safety are employed. The choice of the value of factor of safety depends largely on current practice and must reflect the confidence of the designer in the input parameters, the consequences and type of failure, and the intended life of the structure.
4.0 L ~
3.0
0 C ' = 0 O C" = 10kN/m 2, Cw=0 • C' = 10kN/m 2, Cw= 10kN/m 2
I ~J~:)°=0 } IndicatesrangeofFr
2.0
1.0 15 20
I I I | 25 30 35 40
(~' -- degrees
Fig. 17 Variation in Fr with 4 ' for Fp = 2 with dry soil
10
Q C ' = 0 O C'= 10kN/m 2, Cw=0 • C' = 10kN/m 2, Cw = 10kN/m 2
2.0 - - ~ ! ,~(~=0~ ' i IndicatesrangeofFs I (~ ~ values for
From Fig. 15 " ~ = Dry soil Fp=2
, 0 / , , 15 20 25 30 35 40
(~' - degrees
Fig. 18 Variation of Fs with ~ ' for Fr = 2 with dry soil
The magnitude of the factor of safety required with the Net Pressure Method combined with the sensitivity of these values to the input parameters, (Figure 14) indicates that considerable caution would be needed if this method were to be used for the
design of permanent works in clay. A value of Fop of uni ty is used in the Brit ish Steel Corporat ion Piling Handbook for the determinat ion of the depth of penetrat ion of cant i lever walls for temporary works.
2.0
1.5
1.0
O C ' = 0 O C'= 10kN/m 2, Cw=0 • C'= 10kN/m 2, Cw= 10kN/m 2
,
! ,~/(j~=0 "~ Indicatesrangeof Fs
= 1.0 0 ~ / ~ ' 4 1
type 1 por.ew.ater. pressure distribution
_
I I I I I 15 20 25 30 35
(~i~' -- degrees
Fig. 19 Variation of Fs with ~ ' fo r Fr -- 2 with the water table at ground surface and a type 1 distribution of porewater pressure
11
This contrasts sharply with the values recommended by Padfield and Mair (1984) for use with their design Approach A, based on the use of moderately conservative parameters as shown in Column 2 of Table 1. The apparent success of the Net Pressure Method in practice may therefore rely on a more conservative estimate of the strength properties of the soil tending towards the worst credible effective stress parameters of Padfield and Mair. Since all methods converge at a factor of safety of unity the Net Pressure Method would then give designs for temporary works comparable to those obtained using design Approach B, (Column 4 of Table 1). In the context of the selection of strength parameters the passive resistance is part icularly sensitive to (~' at the higher values representative of granular soils. For example an increase in ~' f rom 35 ° to 40 ° will result in a 40 per cent increase in passive resistance for 6/(~' =0.5. Moreover for granular soils, laboratory tests on large samples often yield (~' values which are greater than the values derived from empirical correlations or quoted as typical values (Brady, Awcock and Wightman 1983).
It is of interest to compare the recommended factors of safety given by Padfield and Mair (1984) for permanent works with the results from this study. Rigorous comparison with the full range of input
parameters is not possible because in the present investigation no allowance was made for a reduction in cohesion towards the ground surface or for the inclusion of a minimum pressure on the wall as recommended by these authors with Design Approach A (Column 3 of Table 1). However valid comparisons can be made with their recommended minimum factors of safety for use with Design Approach B (column 5 of Table 1). This design approach is based on the use of worst credible parameters in which the soil cohesion c' is taken to be zero, and overcomes the difficulties discussed by Symons (1983) of determining appropriate design values for this component of the soil strength.
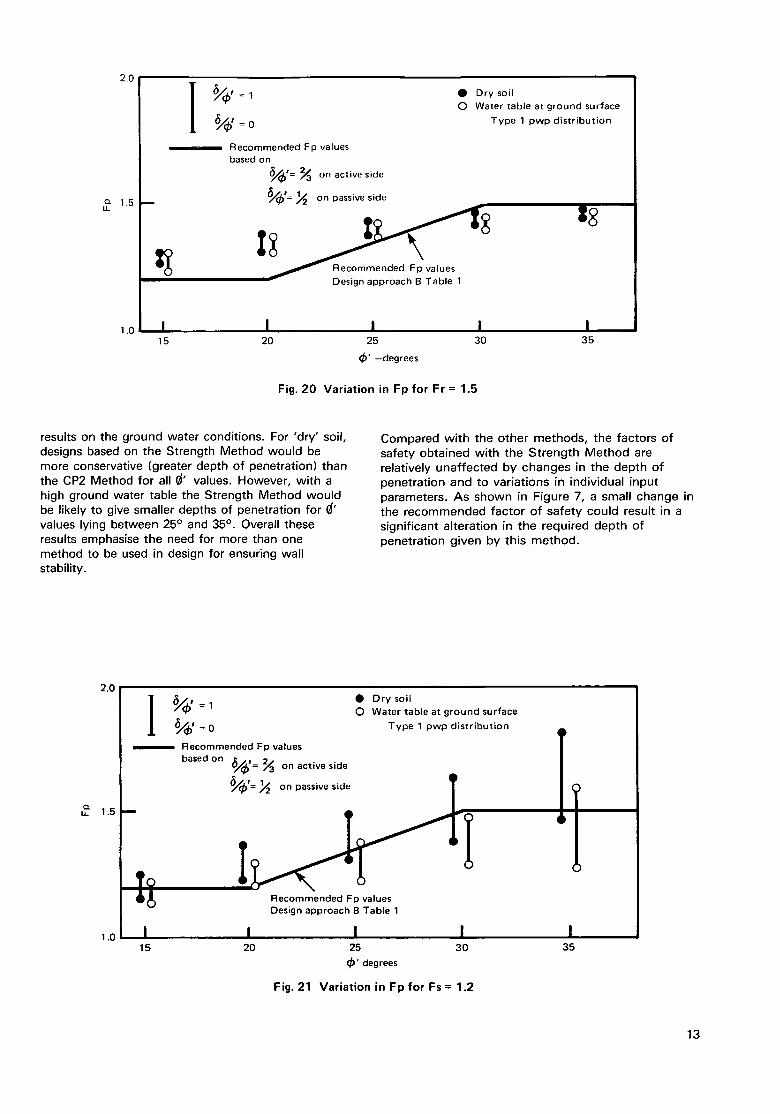
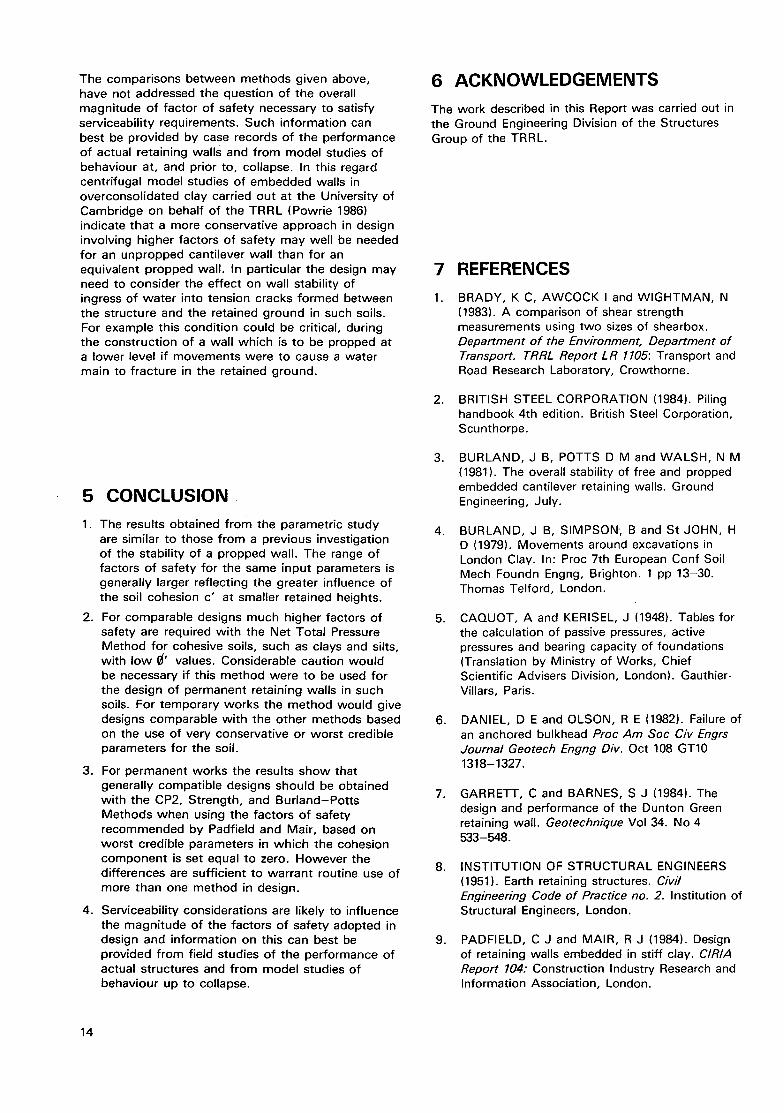
The variation in Fp corresponding to designs based on Fr= 1.5and Fs = l .2 are shown in Figures 20 and 21 respectively, for both 'dry' soil and a water table at the ground surface with a Type 1 distribution of porewater pressure. For both water table conditions Figure 20 shows that cantilever walls designed using the Burland-Potts Method (Fr = 1.5) would have greater depths of penetration than using the CP2 Method with the recommended factors of safety, for (~' values less than about 27°; for higher ~' values depths of penetration are smaller. Comparisons between the Strength and CP2 Methods of design given in Figure 21 illustrate the dependence of the
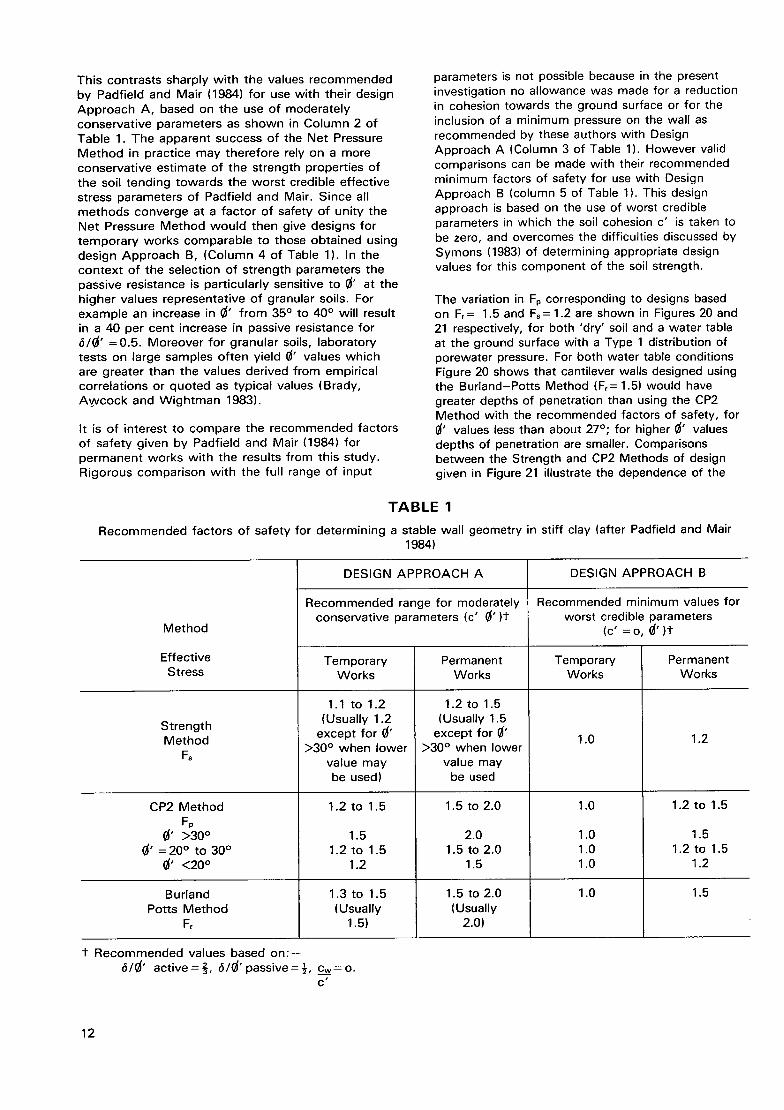
T A B L E 1
Recommended factors of safety for determining a stable wall geometry in stiff clay (after Padfield and Mair 1984)
Method
Effective Stress
Strength Method
Fs
CP2 Method Fp
~" >30 ° (~" = 20 ° tO 30 °
(~' <20 °
Burland Potts Method
F,
DESIGN APPROACH A
Recommended range for moderately conservative parameters (c' ~ ' ) t
Temporary Works
1.1 to 1.2 (Usually 1.2
except for ~" >30 ° when lower
value may be used)
1.2 to 1.5
Permanent Works
1.2 to 1.5 (Usually 1.5
except for ~' >30 ° when lower
value may be used
1.5 to 2.0
2.0 1.5 to 2.0
1.5
1.5 to 2.0 (Usually
2.0)
DESIGN APPROACH B
Recommended minimum values for worst credible parameters
(c ' = o, ~' ) t
Temporary Works
1.0
1.0
1.5 1.2 to 1.5
1.2
1.3 to 1.5 (Usually
1.5)
1.0 1.0 1.0
1.0
Permanent Works
1.2
1 . 2 t o l . 5
1.5 1.2 to 1.5
1.2
1.5
-I- Recommended values based on: - - 6/~" active = } , 6/(~' passive = ½, c__~ = o.
c'
12
2.0
cz 1.5 LL
1.0 I 15
Recommended Fp values based on
~/~(~'= ~3 on active side
~ ' = ~2 on passive side
Design approach B Table 1
• Dry soil O Water table at ground surface
Type 1 pwp distribution
=8
I I I 20 25 30
q~' --degrees
Fig. 20 Variation in F p f o r F r = 1.5
I 35
results on the ground water conditions. For 'dry' soil, designs based on the Strength Method would be more conservative (greater depth of penetration) than the CP2 Method for all (~" values. However, with a high ground water table the Strength Method would be likely to give smaller depths of penetration for ~' values lying between 25 ° and 35 ° . Overall these results emphasise the need for more than one method to be used in design for ensuring wall stability.
Compared with the other methods, the factors of safety obtained with the Strength Method are relatively unaffected by changes in the depth of penetration and to variations in individual input parameters. As shown in Figure 7, a small change in the recommended factor of safety could result in a significant alteration in the required depth of penetration given by this method.
2.0 r ~, _ • Dry soil y(~ = I O Water table at ground surface ~/~l= Type 1 distribution 0 pwp
Recommended Fp values / based on ~ -t 2
1 O//'~ = ~ on active side
u. ~ 1.5 ~ ' = I ~ 1 ~ 2 on passive side 1
~ ~ Recommended Fp values Design approach B Table 1
1.0 I I I I 15 20 25 30 35
4)' degrees
Fig. 21 Variation in Fp for Fs = 1.2
13
The comparisons between methods given above, have not addressed the question of the overall magnitude of factor of safety necessary to satisfy serviceabil ity requirements. Such information can best be provided by case records of the performance of actual retaining walls and from model studies of behaviour at, and prior to, collapse. In this regard centrifugal model studies of embedded walls in overconsol idated clay carried out at the University of Cambridge on behalf of the TRRL (Powrie 1986) indicate that a more conservative approach in design involving higher factors of safety may well be needed for an unpropped cantilever wall than for an equivalent propped wall. In particular the design may need to consider the effect on wall stability of ingress of water into tension cracks formed between the structure and the retained ground in such soils. For example this condit ion could be critical, during the construct ion of a wall which is to be propped at a lower level if movements were to cause a water main to fracture in the retained ground.
5 C O N C L U S I O N
1. The results obtained from the parametric study are similar to those from a previous investigation of the stability of a propped wall. The range of factors of safety for the same input parameters is generally larger reflecting the greater influence of the soil cohesion c' at smaller retained heights.
2. For comparable designs much higher factors of safety are required wi th the Net Total Pressure Method for cohesive soils, such as clays and silts, with low (~' values. Considerable caution would be necessary if this method were to be used for the design of permanent retaining walls in such soils. For temporary works the method would give designs comparable wi th the other methods based on the use of very conservative or worst credible parameters for the soil.
3. For permanent works the results show that generally compatible designs should be obtained with the CP2, Strength, and Bur land-Pot ts Methods when using the factors of safety recommended by Padfield and Mair, based on worst credible parameters in which the cohesion component is set equal to zero. However t h e
differences are suff icient to warrant routine use of more than one method in design.
4. Serviceabil ity considerations are likely to influence the magnitude of the factors of safety adopted in design and information on this can best be provided from field studies of the performance of actual structures and from model studies of behaviour up to collapse.
6 ACKNOWLEDGEMENTS
The work described in this Report was carried out in the Ground Engineering Division of the Structures Group of the TRRL.
7 REFERENCES
1.
2.
.
4.
5.
.
7.
.
9.
BRADY, K C, AWCOCK I and WlGHTMAN, N (1983). A comparison of shear strength measurements using two sizes of shearbox. Department of the Environment, Department of Transport. TRRL Report LR 1105: Transport and Road Research Laboratory, Crowthorne.
BRITISH STEEL CORPORATION (1984). Piling handbook 4th edition. British Steel Corporation, Scunthorpe.
BURLAND, J B, POTTS D M and WALSH, N M (1981). The overall stability of free and propped embedded cantilever retaining walls. Ground Engineering, July.
BURLAND, J B, SIMPSON', B and St JOHN, H D (1979). Movements around excavations in London Clay. In: Proc 7th European Conf Soil Mech Foundn Engng, Brighton. 1 pp 13-30. Thomas Telford, London.
CAQUOT, A and KERISEL, J (1948). Tables for the calculation of passive pressures, active pressures and bearing capacity of foundations (Translation by Ministry of Works, Chief Scientific Advisers Division, London). Gauthier- Villars, Paris.
DANIEL, D E and OLSON, R E (1982). Failure of an anchored bulkhead Proc Am Soc Civ Engrs Journal Geotech Engng Div. Oct 108 GT10 1318-1327.
GARRETT, C and BARNES, S J (1984). The design and performance of the Dunton Green retaining wall. Geotechnique Vol 34. No 4 533-548.
INSTITUTION OF STRUCTURAL ENGINEERS (1951). Earth retaining structures. Civil Engineering Code of Practice no. 2. Institution of Structural Engineers, London.
PADFIELD, C J and MAIR, R J (1984). Design of retaining walls embedded in stiff clay. CIRIA Report 104: Construction Industry Research and Information Association, London.
14
10. POTTS, D M (1982). A program for the stability analysis of embedded retaining walls. Unpublished report submitted to TRRL.
11. POTTS, D M and BURLAND, J B (1983). A parametric study of the stability of embedded earth retaining structures. Department of the Environment, Department of Transport, TRRL Report SR 813 Transport and Road Research Laboratory, Crowthorne.
12. POWRIE, W (1986). The behaviour of diaphragm walls in clay. PhD Thesis St Catherines College, Cambridge University.
13. SYMONS, I F (1983). Assessing the stability of a propped in situ retaining wall in overconsolidated clay. Proc Instn of Civil Engrs (2) 75, pp 617-633.
Printed in the United Kingdom for Her Majesty's Stationery Office Dd8222700 7/87 C5 G426 10170