Embed Size (px)
Citation preview
J. theor. Biol. (1992) 156, 293-307
A Parallel Distributed Model of the Behaviour of Ant Colonies
DEBORAH M. GORDON'S, BRIAN C. GOODWIN~ AND L. E. H. TRAINOR§
Department of Biological Sciences, Stanford University, Stanford, CA 94305, U.S.A., ~ Department of Biology, Open University,
Milton Keynes MK7 6AA, U.K. and § Department of Physics, University of Toronto, Toronto, Canada
(Received on 10 July 1990, Accepted in revised form on 27 November 1991)
Members of an ant colony perform a variety of tasks outside the nest, such as foraging and nest maintenance work. The number of ants actively performing each task changes, because workers switch from one task to another and because workers are sometimes active, sometimes inactive. In field experiments with harvester ants (Gordon, 1986, Anita. Behao. 34, 1402-1419, 1987, Anita. Behav. 35, 833-834), a perturbation that directly affects only the number of workers engaged in one task, causes changes in the numbers engaged in other activities. These dynamics must be the outcome of interactions among individuals; an ant cannot be expected to assess and respond to colony-level changes of behaviour. Here we present a parallel distri- buted model of the processes regulating changes in numbers of workers engaged in various tasks. The model is based on a Hopfield net, but differs from conventional Hopfield models in that when a unit or ant changes state, it changes its interaction patterns. Simulation results resemble experimental results; perturbations of one activ- ity propagate to others. Depending on the pattern of interactions among worker groups, the distribution of active workers in different tasks either settles into a single, global attractor, or shows the dynamics associated with a landscape containing multiple attractors.
Introduction
There are obvious analogies between social insect colonies and brains. In both sys- tems, local information is exchanged among simple units (e.g. workers or neurons), leading to complex results at the level o f the whole system. Individual social insect workers are incapable of complicated decisions, yet colonies manage to construct nests, defend territories and retrieve food. Though the reproductive individual in the colony is referred to, misleadingly, as the "queen", social insect colonies are not hierarchically organized. Workers do not receive instructions from above. Models developed to describe the organization of brain processes may be applicable to social insect colonies. Here we present a parallel distributed process model of an ant colony.
Our model is concerned with one aspect of the behaviour of an ant colony: the distribution of workers into various tasks. In some models of colony organization, the colony is composed of distinct "castes" or groups of specialized workers; each worker consistently does a particular task (e.g. Oster & Wilson, 1978). According to this view, the distribution of workers in various tasks is static in the short term,
293
0022-5193/92/I 10293 + 15 $03.00/0 © 1992 Academic Press Limited
294 D . M . G O R D O N E T A L .
because such distributions are determined by the number of workers available in each behavioural caste. (The "short term" is any time less than that required to produce more workers of a given caste.) Recent work has shown that the distribution of workers into different tasks is not static (reviewed in Gordon, 1989a). Changes in numbers engaged in various tasks arise from two sources: first, workers switch tasks, and second, workers that are committed to particular tasks change between active and inactive states.
Much research on social insects has examined how the distribution of workers in various tasks affects the fitness of a colony. The dynamics of such distributions determine how a colony responds when environmental conditions change. These dynamics can also affect colony fitness. For example, it may be advantageous to a colony to channel large numbers of workers into searching for food when it is scarce; on the other hand, territorial interactions with other colonies may be more important, so that patrolling takes priority over foraging. To understand changes in worker distributions, empirical studies are needed in which the environment of a colony is altered; for example, perturbation experiments with seed-eating ants are summarized below. In addition, a model that describes colony response to perturbations can provide the basis for further study, both of short-term response to environmental change, and of the evolution of colony behaviour. Our objective here is to show that the dynamics of a parallel distributed model can account for some of the observed responses of harvester ant colonies to perturbation. Further empirical work is needed to test whether actual changes of worker distributions are based on mechanisms consistent with the model.
Harvester ants (Pogonomyrmex) are so-called because they collect, store and eat seeds. A colony performs various tasks outside the nest (Gordon, 1986). Foragers leave the nest on shared foraging trails, collect food, and bring it back to the nest. Nest maintenance workers maintain interior tunnels, carry out sand from the nest, and clear vegetation from the nest mound. Patrollers recruit foragers to new food sources, and respond to disturbances. Midden workers sort and maintain the colony refuse pile, or midden. Each of these activities is performed by a distinct group of workers, but when environmental conditions change, workers switch tasks (Gordon, 1989b). At any time, an exterior worker is either active outside the nest or remains in the upper chambers of the nest, near the nest entrance (MacKay, 1983). The interior workers, probably younger than the exterior ones, remain inside the nest at all times, tending the immature workers and maintaining the stored seeds.
Here we are concerned only with the behaviour of exterior workers. These are classified into four categories: foragers, nest maintenance workers, midden workers, and patrollers. Each category is further divided into active workers, currently outside the nest, and inactive ones currently inside the nest. Communication among workers is chemical and tactile; any individual ant can only perceive local information from the ants nearby. An individual exterior worker, of any type, enters and leaves the nest frequently. Considerable mixing among categories occurs, at the next entrance and in the nest chamber immediately inside the entrance, where ants of all categories meet as they go in and out of the nest.
A series of field studies examined the ways that colonies respond to environmental change (Gordon, 1986, 1987, 1989b). Perturbation experiments caused changes in
B E H A V I O U R O F A N T C O L O N I E S 295
the numbers of workers actively engaged in one task outside the nest. Perturbations of one activity led to changes in the numbers of workers engaged in other activities. For example, piles of toothpicks placed near the nest entrance caused an increase in the numbers of nest maintenance workers, who carried the toothpicks away. An increase in the numbers of active nest maintenance workers caused a decrease in the numbers of active foragers, and experiments with marked individuals showed that direct task switching between categories of active ants did not account for this; foragers did not simply switch tasks to do nest maintenance. The disturbance altered the proportions of ants in the active and inactive categories of each task, and also caused an increase in the number of active patrollers. Thus, several categories responded to a perturbation directly affecting only one. Similar patterns of task switching occurred in response to other perturbations, such as placing barriers on the foraging trails so that the rate of seed retrieval is decreased. In this case, the number of active foragers decreased while the number of nest maintenance workers increased, but again not as a result of simple, direct switching between these categor- ies. When two such perturbations were given to the colony simultaneously, the result was not the sum of the two single disturbances.
These experimental results suggest a model in which individual ants are units in a network described as a parallel distributed process. Since there are eight different possible states for each exterior worker (four types of task, each with active and inactive ants), the dynamics of state transitions involve three different binary deci- sions, each of which can be modelled by a Boolean threshold function. The model thus has some of the basic properties of Kauffman networks (Kauffman, i 969) and, due to the symmetric structure of the interaction matrices, it has affinities with Hopfield networks (Hopfield, 1982). The biological basis for the symmetry is the assumption that ants interact symmetrically via pheromones or other communication signals. However, our model has a significant difference from Hopfield nets, in which the interactions between any pair of units (neurons, spins, etc) are defined at the outset (e.g. when memories are laid down) and remain fixed through time. In our ant model, on the other hand, the interactions between any two ants depends on which categories of activity they are in, and these interactions can change as the ants change categories in accordance with the dynamics of the model.
The Model
The eight different categories of ant activity in the present application are defined by a triad of binary vectors (ak, bk, Ck) where a, b and c take on the values of ! and -1 . The state assignments we have chosen and the category labels are as follows:
(!, 1, 1) = active patroller, P
( - 1, 1, 1 ) = inactive patroller, p
(1, 1, - 1) = active forager, F
( - 1, 1, - 1 ) = inactive forager, f
( 1, - 1, 1) = active nest maintenance worker, N
296 D . M , G O R D O N E T A L .
( - 1, - 1, 1) = inactive nest maintenance worker, n
(1, - 1, - ! ) = active midden worker, M
( - I , - 1 , - 1 ) =inactive midden worker, m
Individual ants in a category are labelled with a numerical subscript; for example, ants in the active patroller category (P) are labelled Pj , P2, etc.
Ants appear usually to interact by pairwise encounters, sometimes involving antennal contact and probably pheromone exchange. In the model we assume however that all ants in a category interact before making a decision about switching categories. Though interactions between ants are local, it appears that movement and random encounters, especially at the nest entrance, lead to enough mixing to warrant this assumption. In the model, an ant decides its appropriate activity category by assessing three distinguishable local interactions with other ants, and then makes three indepen- dent decisions as to what a, b and c states it should take to conform to the interactions. The first decision, a = I or - 1 , is whether to be active or inactive (see the Boolean assignments above). The second, b = 1 or - I, is whether to be in the Patrol ler /Forager subclass or the Nest Maintenance/Midden Worker subclass. Finally, the third, c = 1 or - 1, decides whether to be a Patroller or a Forager if in the Patrol ler /Forager subclass, or Nest Maintenance or Midden Worker if in the Nest Maintenance/Midden Worker subclass.
Consider the first decision, whether to be active or inactive. Let the matrix defining interactions between ants relevant to this decision be defined by (ajk). The decision function is defined in the usual manner for a threshold function. I f h~ = ~ aika~ - 0i > 0, where the sum goes over all ants k ~j , then thejth ant either remains or becomes active (aj = 1 ). If the equality is reversed, the j th ant remains or becomes inactive ( a j = - 1 ) . The quantity hj can be thought of as the field on a n t j due to its interaction with other ants k ~j . The decision function then amounts to a dynamical law such that the state a t adjusts to conform to its interactions. For convenience we take the threshold fields 0 j = 0 and proceed to specify the interaction matrix (ajk). We choose an interaction pattern which will result in approximately equal numbers of active and inactive ants in each category. It is assumed that, relative to the active- inactive decision, there is interaction only among ants within single categories, such as patrollers or foragers, not between categories. A matrix structure that satisfies these assumptions has the form shown in (1).
N
M
P
f n
m
P F N
P -1
F - I
- 1
-1
- 1
-1
M p f n m
-1
- 1
-1
- 1
-1
- 1
- 1
-1
-1 - 1
(1)
B E H A V I O U R OF ANT C O L O N I E S 297
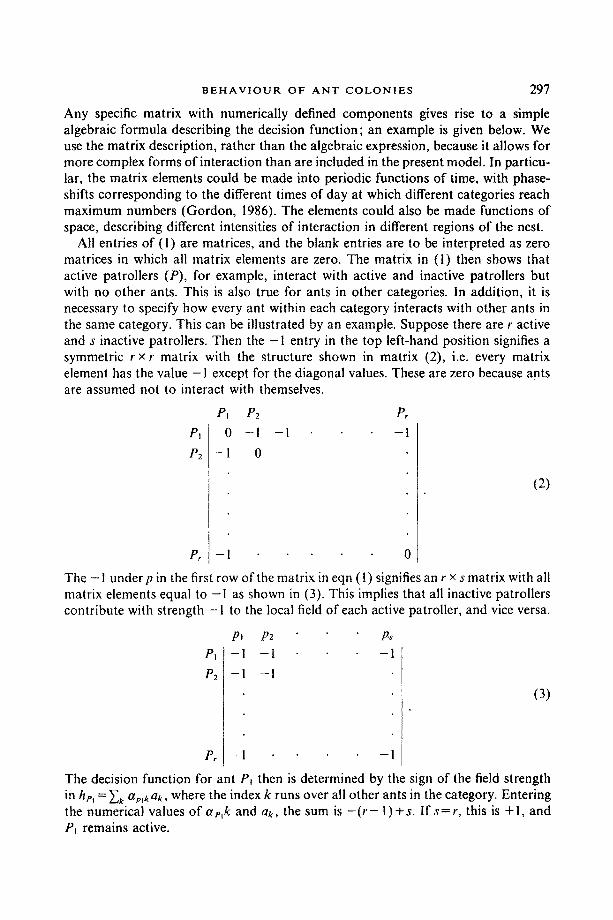
Any specific matrix with numerically defined components gives rise to a simple algebraic formula describing the decision function; an example is given below. We use the matrix description, rather than the algebraic expression, because it allows for more complex forms of interaction than are included in the present model. In particu- lar, the matrix elements could be made into periodic functions of time, with phase- shifts corresponding to the different times of day at which different categories reach maximum numbers (Gordon, 1986). The elements could also be made functions of space, describing different intensities of interaction in different regions of the nest.
All entries of (1) are matrices, and the blank entries are to be interpreted as zero matrices in which all matrix elements are zero. The matrix in (1) then shows that active patrollers (P), for example, interact with active and inactive patrollers but with no other ants. This is also true for ants in other categories. In addition, it is necessary to specify how every ant within each category interacts with other ants in the same category. This can be illustrated by an example. Suppose there are r active and s inactive patrollers. Then the -1 entry in the top left-hand position signifies a symmetric r× r matrix with the structure shown in matrix (2), i.e. every matrix element has the value -1 except for the diagonal values. These are zero because ants are assumed not to interact with themselves.
PI P2
e l
P2
e~
0 -1 -1
- i 0
-1
-1 0
(2)
The - 1 under p in the first row of the matrix in eqn ( 1 ) signifies an r × s matrix with all matrix elements equal to -1 as shown in (3). This implies that all inactive patrollers contribute with strength -1 to the local field of each active patroller, and vice versa.
P!
P2
Pr
PJ P2 P.s - I --1 - t
-1 - I
-1 -1
(3)
The decision function for ant PI then is determined by the sign of the field strength in he, = ~k ap,kak, where the index k runs over all other ants in the category. Entering the numerical values of ae,k and ak, the sum is - ( r - 1 ) + s . l f s = r , this is +1, and P~ remains active.
298 D. M. G O R D O N E T A L .
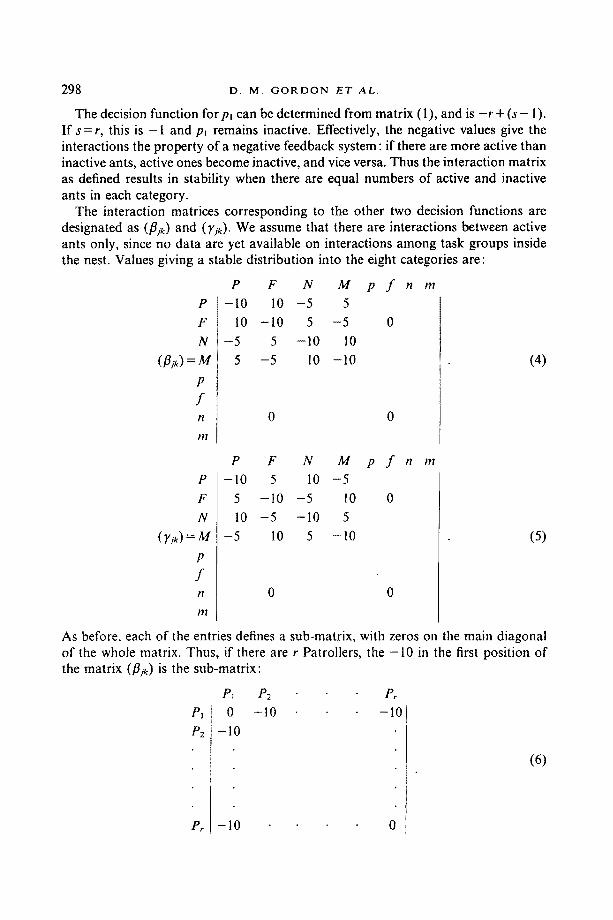
The decision function for p~ can be determined from matrix (1), and is - r + ( s - 1). If s = r , this is - 1 and p~ remains inactive. Effectively, the negative values give the interactions the property of a negative feedback system : if there are more active than inactive ants, active ones become inactive, and vice versa. Thus the interaction matrix as defined results in stability when there are equal numbers of active and inactive ants in each category.
The interaction matrices corresponding to the other two decision functions are designated as (flik) and (Yjk). We assume that there are interactions between active ants only, since no data are yet available on interactions among task groups inside the nest. Values giving a stable distribution into the eight categories are:
P
F
N
(flj~) = M
P
f n
i l l
P
F
N
(yjk) = M
P
f n
1H
P F N M
- I 0 10 - 5 5
10 - 1 0 5 - 5
- 5 5 - 1 0 10
5 - 5 10 - 1 0
p f
0
1'1 t n
0
P F N M
- 1 0 5 10 - 5
5 - I 0 - 5 10
10 - 5 - 1 0 5
- 5 10 5 - 1 0
p f
0
II Ili
0 0
(4)
(5)
As before, each of the entries defines a sub-matrix, with zeros on the main diagonal of the whole matrix. Thus, if there are r Patrollers, the - 1 0 in the first position of the matrix (fljk) is the sub-matrix:
P~ P~ e r
- 1 0
(6)
e l
P2
0 - I 0
- 1 0
P~ - 1 0 0
B E H A V I O U R O F A N T C O L O N I E S 299
All the off-diagonal entries are also sub-matrices of dimension defined by the numbers of ants in the designated categories, with the indicated number in every matrix position. For example, the five in the row labelled N and column labelled F in (4), which defines interactions between active Nest Maintenance workers of which there are, say r, and Foragers of number s, is an r x s matrix with a 5 in every position. The use of the particular numbers 10 and 5 in the fl and ~, matrices is not significant, though the sign pattern and the use of different numbers is required to get a global attractor with equal numbers of ants in each of the eight categories (see the Appendix for an analytical demonstration of this property).
Real colonies do not have this structure, because numbers tend to be greater in certain categories than in others, but this is a convenient reference state. It is a simple matter to adjust the matrices to give any desired distribution of ants among the categories in a stable state. For instance, if it is required that there be twice as many active as inactive ants in each category, then the matrix coefficients under the inactive categories (p,f, n, m) in matrix (1) are doubled relative to those under the active categories (P, F, N, M). This gives them double weight in the interactions so that one inactive ant is equal to two active ones in the decision function.
The decision functions for the binary variables bk and Ck are defined in the same way as for ak, using the appropriate matrices (4) and (5). These are respectively
If
and if
~-,k fljk bk > 0, bk = 1
<0, bk = - 1
~.,k yjkCk>O, Ck = 1
<0, Ck=--l.
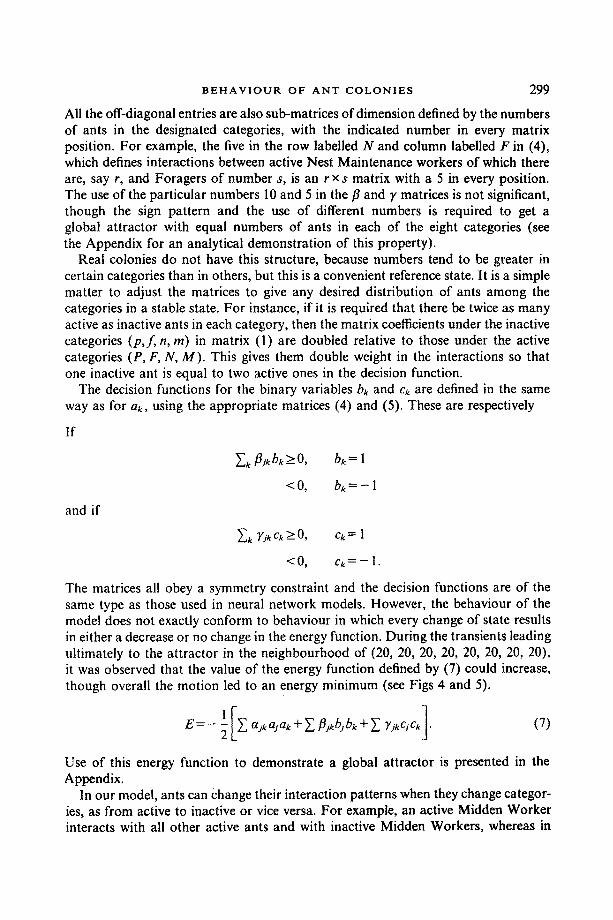
The matrices all obey a symmetry constraint and the decision functions are of the same type as those used in neural network models. However, the behaviour of the model does not exactly conform to behaviour in which every change of state results in either a decrease or no change in the energy function. During the transients leading ultimately to the attractor in the neighbourhood of (20, 20, 20, 20, 20, 20, 20, 20), it was observed that the value of the energy function defined by (7) could increase, though overall the motion led to an energy minimum (see Figs 4 and 5).
E=-- ~ [ ~ Ctjkajak + ~" fljkbjbk + ~ ~,jkCjCk]. (7)
Use of this energy function to demonstrate a global attractor is presented in the Appendix.
In our model, ants can Change their interaction patterns when they change categor- ies, as from active to inactive or vice versa. For example, an active Midden Worker interacts with all other active ants and with inactive Midden Workers, whereas in
300 D. M, G O R D O N E T A L .
the inactive condition it interacts only with active and inactive members of the same category. This appears to be why the energy defined by (7) can increase during a transient. The energy function is such, however, that there is always a downward path from any point on the surface towards the minimum, so that eventually the system reaches the neighbourhood of the global attractor.
Dynamics of Colony Behaviour
The model was programmed in FORTRAN, using a random updating procedure to determine the state of ants in the colony at successive time steps: i.e. ants were selected at random. The three decision functions were assessed based on the current state of the colony and the interaction matrices, to determine whether or not the chosen ant should change its state. An initial condition was defined by the number of ants in each category. These numbers then changed as determined by the Boolean decision functions until the distribution of ants in the eight categories reached stability.
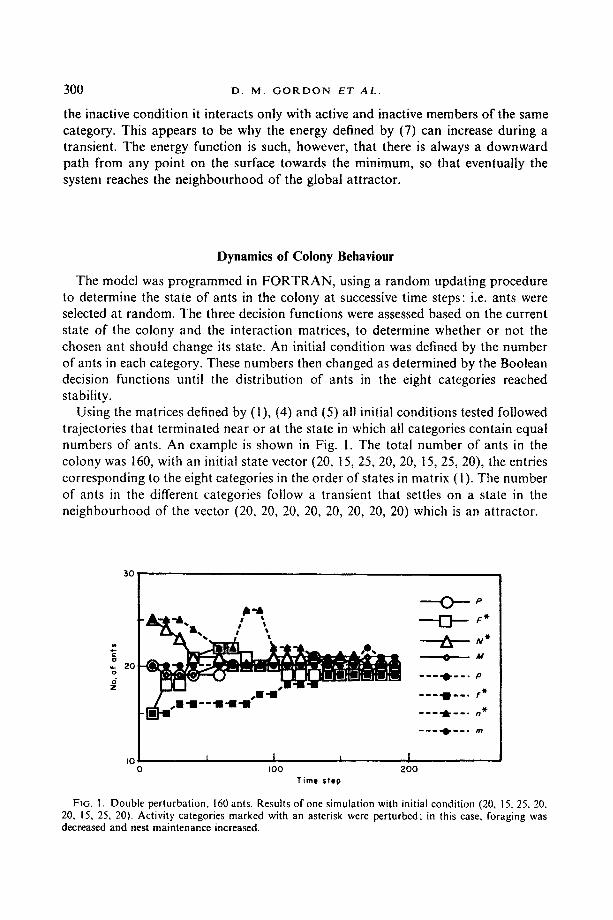
Using the matrices defined by (1), (4) and (5) all initial conditions tested followed trajectories that terminated near or at the state in which all categories contain equal numbers of ants. An example is shown in Fig. I. The total number of ants in the colony was 160, with an initial state vector (20, t5, 25, 20, 20, t5, 25, 20), the entries corresponding to the eight categories in the order of states in matrix (1). The number of ants in the different categories follow a transient that settles on a state in the neighbourhood of the vector (20, 20, 20, 20, 20, 20, 20, 20) which is an attractor.
3o !
/--ZX,A it.._ / ,, N*
~ 2 0
o IOO 200 Time step
FIG. 1+ Double perturbation, 160 ants. Results of one simulation with initial condition (20, 15, 25, 20, 20, 15, 25, 20). Activity categories marked with an asterisk were perturbed; in this case, foraging was decreased and nest maintenance increased.
B E H A V I O U R O F A N T C O L O N I E S 301
30'
25
20
15 J I 0 I00 ZOO 300
Time sfep
O. . . . - p
I D ' - ': A N* 8 M "
----(p--. P
• f
n ~
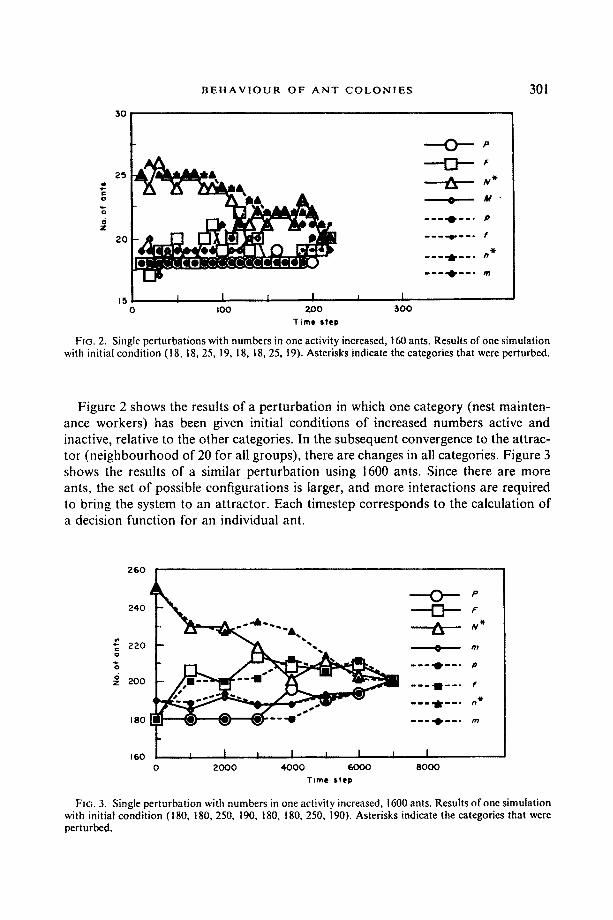
FIG. 2. Single perturbations with numbers in one activity increased, 160 ants. Results of one simulation with initial condition (18, 18, 25, 19, 18, 18, 25, 19). Asterisks indicate the categories that were perturbed.
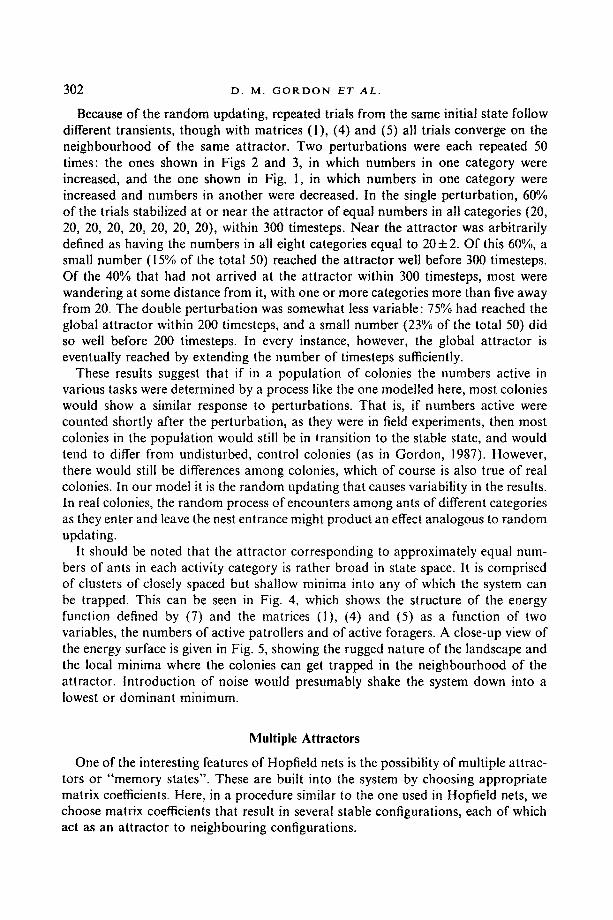
Figure 2 shows the results of a perturbation in which one category (nest mainten- ance workers) has been given initial conditions of increased numbers active and inactive, relative to the other categories. In the subsequent convergence to the attrac- tor (neighbourhood of 20 for all groups), there are changes in all categories. Figure 3 shows the results of a similar perturbation using 1600 ants. Since there are more ants, the set of possible configurations is larger, and more interactions are required to bring the system to an attractor. Each timestep corresponds to the calculation of a decision function for an individual ant.
260 O P
240 F ~ l ~ F
220 - %%" ,0 m
6 200 - - - ' l - - " f
180 [ ~ " - " " O, m
,60 0 2000 4o00 6oo0 8000
Time step
FIG. 3. Single perturbation with numbers in one activity increased, 1600 ants. Results of one simulation with initial condition (180, 180, 250, 190, 180, 180, 250, 190). Asterisks indicate the categories that were perturbed.
302 D . M . G O R D O N E T A L .
Because of the random updating, repeated trials from the same initial state follow different transients, though with matrices (1), (4) and (5) all trials converge on the neighbourhood of the same attractor. Two perturbations were each repeated 50 times: the ones shown in Figs 2 and 3, in which numbers in one category were increased, and the one shown in Fig. 1, in which numbers in one category were increased and numbers in another were decreased. In the single perturbation, 60% of the trials stabilized at or near the attractor of equal numbers in all categories (20, 20, 20, 20, 20, 20, 20, 20), within 300 timesteps. Near the attractor was arbitrarily defined as having the numbers in all eight categories equal to 20+2. Of this 60%, a small number (15% of the total 50) reached the attractor well before 300 timesteps. Of the 40% that had not arrived at the attractor within 300 timesteps, most were wandering at some distance from it, with one or more categories more than five away from 20. The double perturbation was somewhat less variable: 75% had reached the global attractor within 200 timesteps, and a small number (23% of the total 50) did so well before 200 timesteps. In every instance, however, the global attractor is eventually reached by extending the number of timesteps sufficiently.
These results suggest that if in a population of colonies the numbers active in various tasks were determined by a process like the one modelled here, most colonies would show a similar response to perturbations. That is, if numbers active were counted shortly after the perturbation, as they were in field experiments, then most colonies in the population would still be in iransition to the stable state, and would tend to differ from undisturbed, control colonies (as in Gordon, 1987). However, there would still be differences among colonies, which of course is also true of real colonies. In our model it is the random updating that causes variability in the results. In real colonies, the random process of encounters among ants of different categories as they enter and leave the nest entrance might product an effect analogous to random updating.
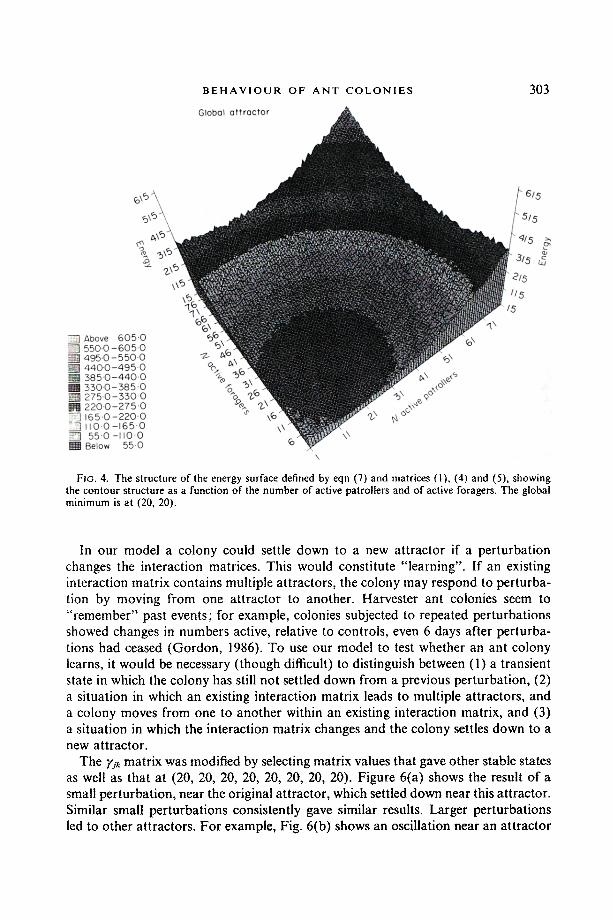
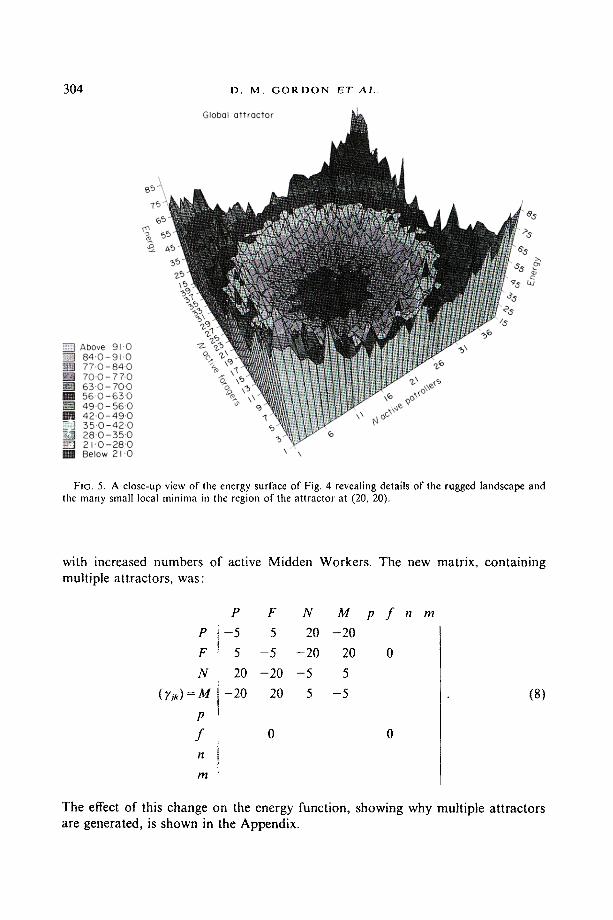
It should be noted that the attractor corresponding to approximately equal num- bers of ants in each activity category is rather broad in state space. It is comprised of clusters of closely spaced but shallow minima into any of which the system can be trapped. This can be seen in Fig. 4, which shows the structure of the energy function defined by (7) and the matrices (1), (4) and (5) as a function of two variables, the numbers of active patrollers and of active foragers. A close-up view of the energy surface is given in Fig. 5, showing the rugged nature of the landscape and the local minima where the colonies can get trapped in the neighbourhood of the attractor. Introduction of noise would presumably shake the system down into a lowest or dominant minimum.
Multiple Attractors
One of the interesting features of Hopfield nets is the possibility of multiple attrac- tors or "memory states". These are built into the system by choosing appropriate matrix coefficients. Here, in a procedure similar to the one used in Hopfield nets, we choose matrix coefficients that result in several stable configurations, each of which act as an attractor to neighbouring configurations.
B E H A V I O U R O F A N T C O L O N I E S 303
t..5
t . .
Above 60~ 550.0-60~ 495-0-55(
[ ] 440.0-49[ ~I 385.0-44( m 3300-38 ,~
275.0-33( N 220.0-27~
165,0-22( -.7 110.0-16~
55-0 -~10 R Below 55
Fio. 4. The structure of the energy surface defined by eqn (7) and matrices (1), (4) and (5), showing the contour structure as a function of the number of active patrollers and of active foragers. The global minimum is at (20, 20).
In our model a colony could settle down to a new attractor if a perturbation changes the interaction matrices. This would constitute "learning". If an existing interaction matrix contains multiple attractors, the colony may respond to perturba- tion by moving from one at tractor to another. Harvester ant colonies seem to " remember" past events; for example, colonies subjected to repeated perturbations showed changes in numbers active, relative to controls, even 6 days after perturba- tions had ceased (Gordon, 1986). To use our model to test whether an ant colony learns, it would be necessary (though difficult) to distinguish between (I) a transient state in which the colony has still not settled down from a previous perturbation, (2) a situation in which an existing interaction matrix leads to multiple attractors, and a colony moves from one to another within an existing interaction matrix, and (3) a situation in which the interaction matrix changes and the colony settles down to a new attractor.
The ?'jk matrix was modified by selecting matrix values that gave other stable states as well as that at (20, 20, 20, 20, 20, 20, 20, 20). Figure 6(a) shows the result of a small perturbation, near the original attractor, which settled down near this attractor. Similar small perturbations consistently gave similar results. Larger perturbations led to other attractors. For example, Fig. 6(b) shows an oscillation near an attractor
D. M. G O R D O N E T A L . 304
7
Above 9bO 8 4 " 0 - 9 1 0 7 7 . 0 - 8 4 0
[ ] 70 .0-77,0 I 63-0-70.0 ml 5 6 0 - 6 3 0 I 49 .0 - 56-0 [ ] 42 .0- 49.0 ~ ] 35.0-42"0
28.0-35-0 2 b 0 - 2 8 - 0
I Below 2 t ' 0 \ \
FIG. 5. A close-up view of the energy surface of Fig. 4 revealing details of the rugged landscape and the many small local minima in the region of the attractor at (20, 20),
with increased numbers of active Midden Workers. The new matrix, containing multiple attractors, was"
P
F
N
(Tjk) = M
P
f n
m
P F N M
- 5 5 20 -20
5 - 5 -20 20
20 -20 - 5 5
-20 20 5 - 5
0 0
p f n m
(8)
The effect of this change on the energy function, showing why multiple attractors are generated, is shown in the Appendix.
B E H A V I O U R O F A N T C O L O N I E S 3 0 5
3O ( = )
O - - " D-- 'F
@ M
- - - ' O - - - O
- ' - t 1 ' - ' " f
@ m
s
io l I I ,,~ I 0 IOO 200
I f I l I 300 400 500
Time step
3, F - 30 • 4
25
15
'2
( b )
O---p
A ..... N
- - - t 1 " - - " 0
- - - ' t 1 ' ' - " f
• m
o 500 IOOO 15oo
Time tteg
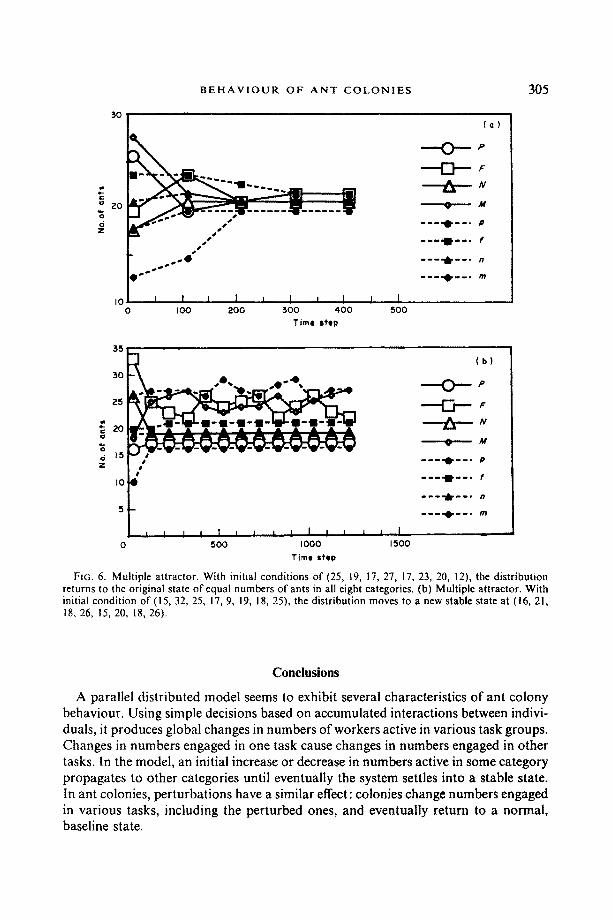
F|G. 6. Multiple attractor. With initial conditions of (25, 19, 17, 27, 17, 23, 20, 12), the distr ibution returns to the original state of equal numbers of ants in all eight categories. (b) Multiple attractor. With initial condition of (15, 32, 25, 17, 9, 19, 18, 25), the distribution moves to a new stable state at (16, 21, 18, 26, 15, 20, 18, 26)+
C o n c l u s i o n s
A parallel distributed model seems to exhibit several characteristics of ant colony behaviour. Using simple decisions based on accumulated interactions between indivi- duals, it produces global changes in numbers of workers active in various task groups. Changes in numbers engaged in one task cause changes in numbers engaged in other tasks. In the model, an initial increase or decrease in numbers active in some category propagates to other categories until eventually the system settles into a stable state. In ant colonies, perturbations have a similar effect: colonies change numbers engaged in various tasks, including the perturbed ones, and eventually return to a normal, baseline state.
3 0 6 D . M . G O R D O N E T A L .
To test whether PDP models actually describe the behaviour of real colonies, both theoretical and empirical refinements will be needed. For a model to reproduce more closely the dynamics of the behaviour of actual colonies, it will be necessary to consider the temporal structure of colony behaviour. Individuals switch tasks in response to changes of environment that alter colony requirements. In addition, on timescales from the hourly to the yearly, colonies adjust the numbers of workers actively engaged in various tasks. For example, in harvester ants activities are carried out in a characteristic sequence each day, the "daily round" of the colony. Such daily temporal patterns are characteristic of many species. Harvester ants' response to perturbations showed that only some aspects of the daily round are flexible (Gordon, 1986). This imposes constraints on the recovery from perturbations which are not yet included in our model, because it does not take temporal patterns of behaviour into account.
Further empirical work is needed to determine the thresholds for switching, either between task categories or between active and inactive ants in the same task category. Studies of task switching have generally concentrated on switching tasks as a function of the amount of work to be done (Meudec & Lenoir, 1982; Gordon, 1989b), or alternatively on switching as a function of the total number of workers (active and inactive) apparently available to do a task (Wilson, 1984). Here what is needed are temporally precise measures of numbers active and inactive in the vicinity of a worker as it switches tasks, or as it changes between active and inactive states. The notion of workers "in tlle vicinity" is a vague one, because we do not yet know the exact range in which information about nestmates is locally available to any individual. Much communication in social insects depends on chemical cues, but pheromones are produced in tiny quantities that are difficult to measure. Thus, further research is also needed on the mechanisms social insects use to assess the behaviour of their nestmates.
Recent theoretical work on social insects has emphasized the relevance of negative feedback and simple local rules in models of colony behaviour (Pasteels et al., 1987). These have been applied to the study of spatial patterns ofbehaviour such as foraging trails in ant colonies (Deneubourg et al., 1987). Our model makes use of negative feedback to account for changes in the distribution of workers in different tasks. It may be useful to think of the evolution of the social organization of an ant colony as the evolution of a particular interaction pattern which determines changes of activity in various worker groups. A colony's relation with its environment depends on the dynamics of worker allocation in changing conditions. The analogy of social insect colonies and brains may help to elucidate these dynamics.
This work was begun when the authors were at the Centre for Mathematical Biology, University of Oxford, and we thank another visitor there, Gunther Sawitski, for helpful discussions. We wish to thank Mr Jeff Bets who wrote the original computer program and Mr Dave Jourrard who assisted with modifications. For useful suggestions about the analysis of the energy function, and for Figs 4 and 5, we are grateful to Ricard Sole.
The research was carried out with financial assistance from a NATO Postdoctoral Fellowship from NSF and then a Research Fellowship from Lady Margaret Hall, Oxford, to D.M.G., and from the Center for Mathematical Biology, Oxford, to B.C.G and L.E.H.T., and from the National Research Council of Canada to LE.H.T.
B E H A V I O U R OF A N T C O L O N I E S
REFERENCES
307
DENEUBOURG, J. L., GOSS, S., PASTEELS, J. M., FRESNEAU, D. & LACHAUD, J.-P. (1987). Self-organiza- tion mechanisms in ant societies (II) : learning in foraging and division of labor. In : From Individual to Collective Behaoiour in Social Insects (Pasteels, J. M. & Deneubourg, J. L., eds) pp. 177-196. Basel: Birkhauseur.
GORDON. D. M. (1986). The dynamics of the daily round of the harvester ant colony. Anon. Behav. 34, 1402-1419.
GORDON, D. M. (1987). Group-level dynamics in harvester ants: young colonies and the role of patrolling. Anita. Behav. 35, 833-834.
GORDON, D. M. (1989a). Caste and change in social insects. In: Oxford Surveys in Evohaionary Biology Vol. 6 (Harvey, P. & Partridge, L., eds) Oxford: Oxford University Press.
GORDON. D. M. (1989b). Dynamics of task switching in harvester ants. Anita. Behat~. 38, 194-204. Hovw ELD, J. J. K. (1982). Neural networks and physical systems with emergent collective computational
abilities. Proc. natn. Acad. Sci. U.S.A. 79, 2554. K^UVVMAN, S. A. (1969). Metabolic stability and epigenesis in randomly constructed genetic nets. J.
theor. Biol. 22, 437-467. MACKAY, W. P. (1983). Stratification of workers in harvester ant nests. J. Kans. Ent. Soc. 56, 538-542. MEUDV.¢, M. & LENOm, A. (1982), Social responses to variation in food supply and nest suitability in
ants (Tap#mma erraticum). Anita. Behav. 30, 284-392. OSTER, G. & WIt_SON, E. O. (1978). Caste and Ecology in the Social Insects. Princeton, N.J.: Princeton
University Press. PAS'rEELS, J. M., DENEUaOURG, J. L. & GOSS, S. (1987). Transmission and amplification of informa-
tion in a changing environment: the ease of insect societies. In: Law of Nature and Human Conduct (Prigogine, 1. & Sanglier, M., eds) pp. 129-156. Brussels: Cordes.
Wn_SON, E. O. (1984). The relation between caste ratios and division of labor in Pheidole. Behav. EcoL Sociobio. 16, 89-98.
APPENDIX
Use the n o t a t i o n N j , N2, N3, N4 for the numbe r s o f act ive pa t ro l le r s , foragers , nest m a i n t e n a n c e and m i d d e n workers , respect ively, and n l , n2, n3, n4 for the corre- s p o n d i n g inact ive categories . Then for large N~, n~, the c on t r i bu t i ons to the energy funct ion (7) f rom the three in te rac t ion matr ices , are
I - ~ ~ ajj, a j a k ~ ~ ~ ( N ; - n i ) 2
- ½ E fl:kb:bk'-- ½ {St(N, - N 2 ) : + (N3 - N4):] + u [ ( N , - N2) - (N3 - N4)]:}
- 4 Z yjkbjbk ~ ½ {5[(N, - N3) 2 + (Nz - N4) z] +/1 [(N, - N3) - (N2 - N4)]:}.
Where 5 = A . - p and A., ~ are the values 10 and 5, respect ively, in the matr ices . These are all pos i t ive defini te func t ions wi th a single m i n i m u m at N i = n i , Nt = Nj ,
which is the g loba l a t t r ac to r , for 5, ~ > 0. F o r the ma t r i x (8) which gives mul t ip le a t t r ac to r s , the energy func t ion becomes
- ~ • Yjk b1 bk "-- ½ { O[(N, - N3) 2 - (N2 - N4) 2] - 2~b (N~N3 - N2N4) }
where ~b = 1 7 - 0 and 0, I / a r e the ma t r ix entr ies , 5 and 20 respect ively. The overa l l energy func t ion ceases to be pos i t ive defini te and a l lows the exis tence o f local min ima , m a x ima , and sadd le poin ts , m a k i n g mul t ip le a t t r a c to r s possible .


![Elmer-Rico E. Mojicaelmericomojica.weebly.com/.../kimika_2003_19_77-82.pdf · [7], simulated annealing [8], simulated jumping [9], neural networks [101, and ant colonies [11—131](https://img.pdfslide.us/doc/110x75/5fd1302dd04c375c812a5d2e/elmer-rico-e-7-simulated-annealing-8-simulated-jumping-9-neural-networks.jpg)


![Utilizing Colored Pheromones and Helping Ants for Wireless ... Colored Phermone.pdfE. GHASEMKHANI . ET AL. 9. ant colony optimization (MACO) [26] uses multiple ant colonies, each trying](https://img.pdfslide.us/doc/110x75/5fe958d4ff966b1b2b3622c4/utilizing-colored-pheromones-and-helping-ants-for-wireless-colored-phermonepdf.jpg)