Embed Size (px)
Citation preview
A numerical simulation of A numerical simulation of urban urban
and regional meteorology and regional meteorology and assessment of its impact and assessment of its impact
on pollution transporton pollution transportA. Starchenko
Tomsk State University
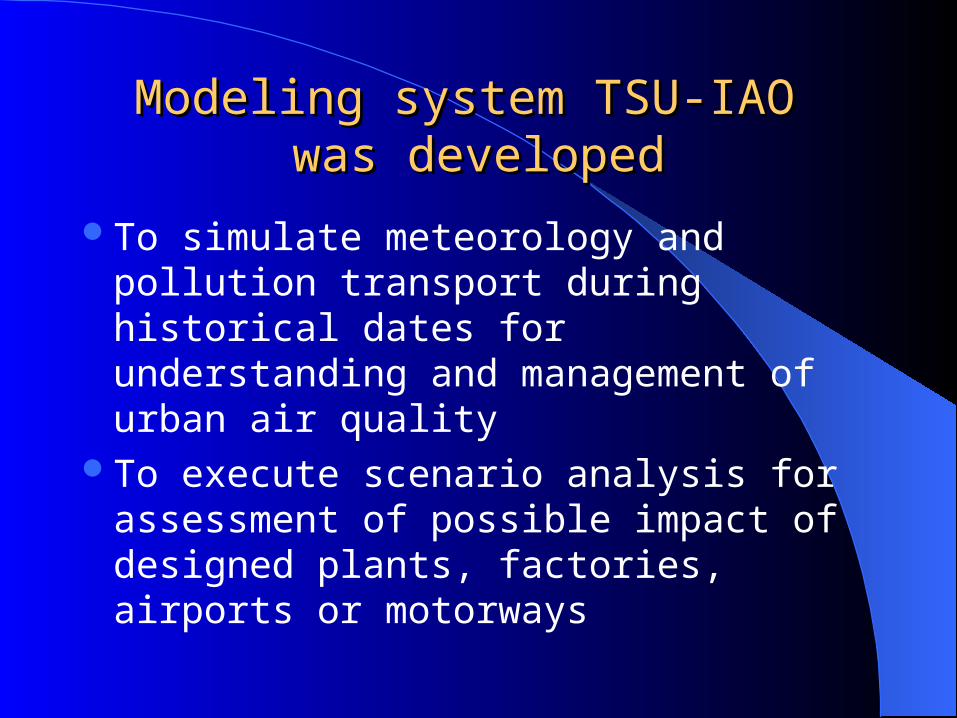
Modeling system TSU-IAO Modeling system TSU-IAO was developedwas developed
To simulate meteorology and pollution transport during historical dates for understanding and management of urban air quality
To execute scenario analysis for assessment of possible impact of designed plants, factories, airports or motorways
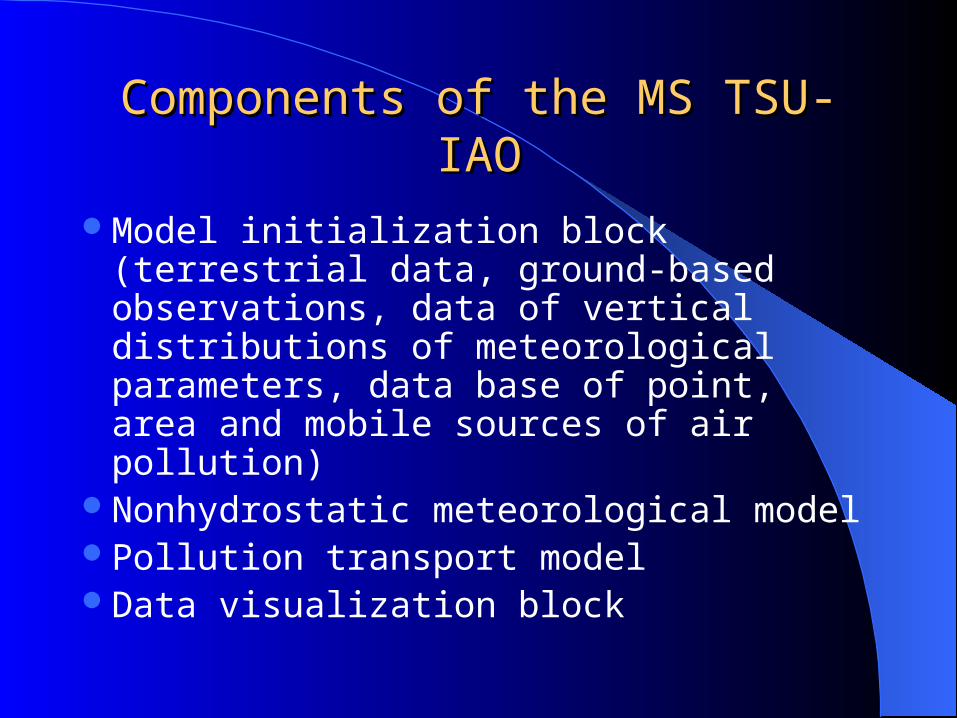
Components of the MS TSU-IAOComponents of the MS TSU-IAO
Model initialization block (terrestrial data, ground-based observations, data of vertical distributions of meteorological parameters, data base of point, area and mobile sources of air pollution)
Nonhydrostatic meteorological modelPollution transport modelData visualization block
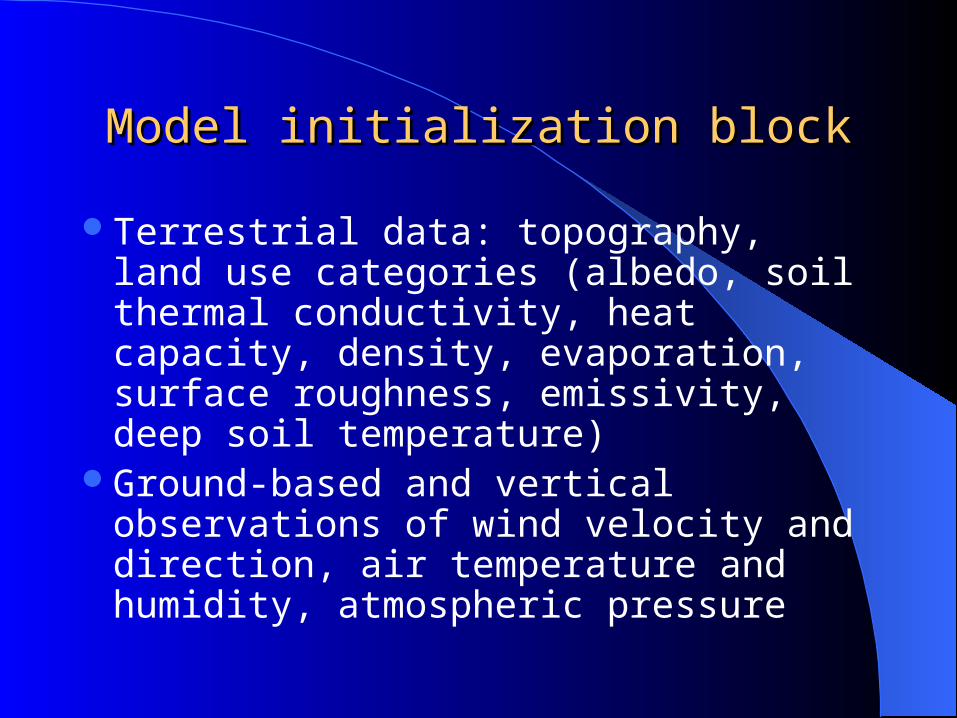
Model initialization blockModel initialization block
Terrestrial data: topography, land use categories (albedo, soil thermal conductivity, heat capacity, density, evaporation, surface roughness, emissivity, deep soil temperature)
Ground-based and vertical observations of wind velocity and direction, air temperature and humidity, atmospheric pressure
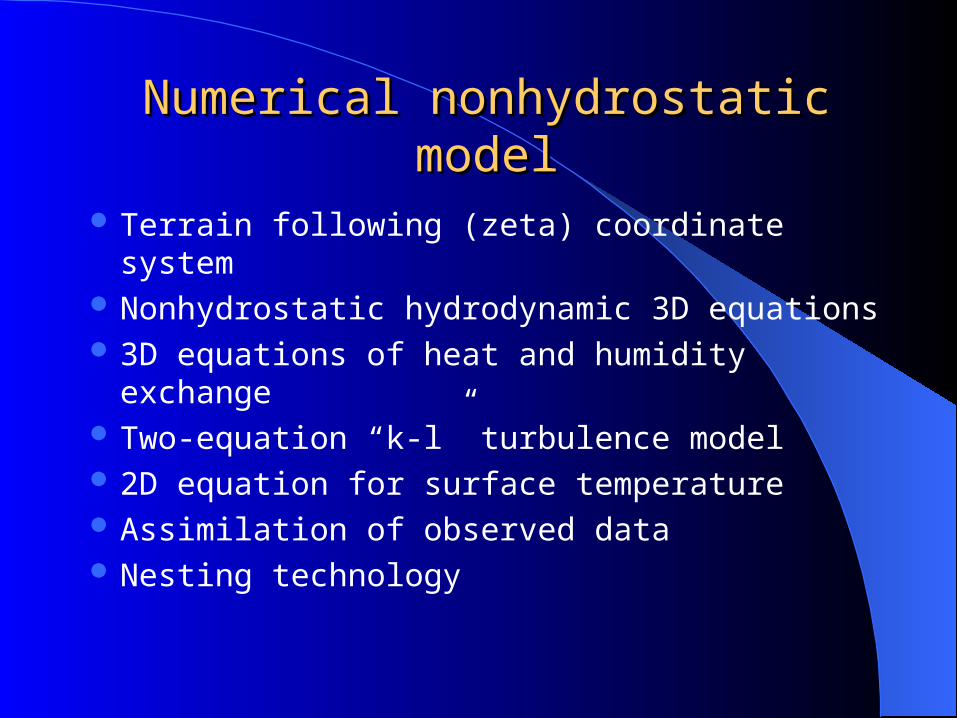
Numerical nonhydrostatic modelNumerical nonhydrostatic model
Terrain following (zeta) coordinate system Nonhydrostatic hydrodynamic 3D equations 3D equations of heat and humidity
exchange Two-equation “k-l” turbulence model 2D equation for surface temperature Assimilation of observed data Nesting technology
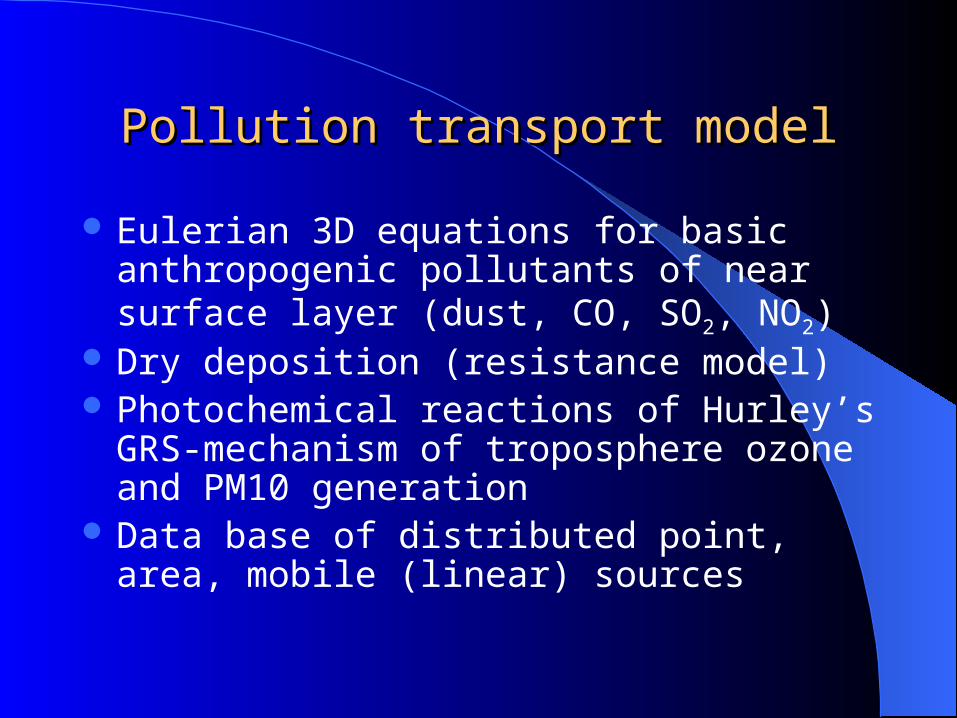
Pollution transport modelPollution transport model
Eulerian 3D equations for basic anthropogenic pollutants of near surface layer (dust, CO, SO2, NO2)
Dry deposition (resistance model) Photochemical reactions of Hurley’s
GRS-mechanism of troposphere ozone and PM10 generation
Data base of distributed point, area, mobile (linear) sources
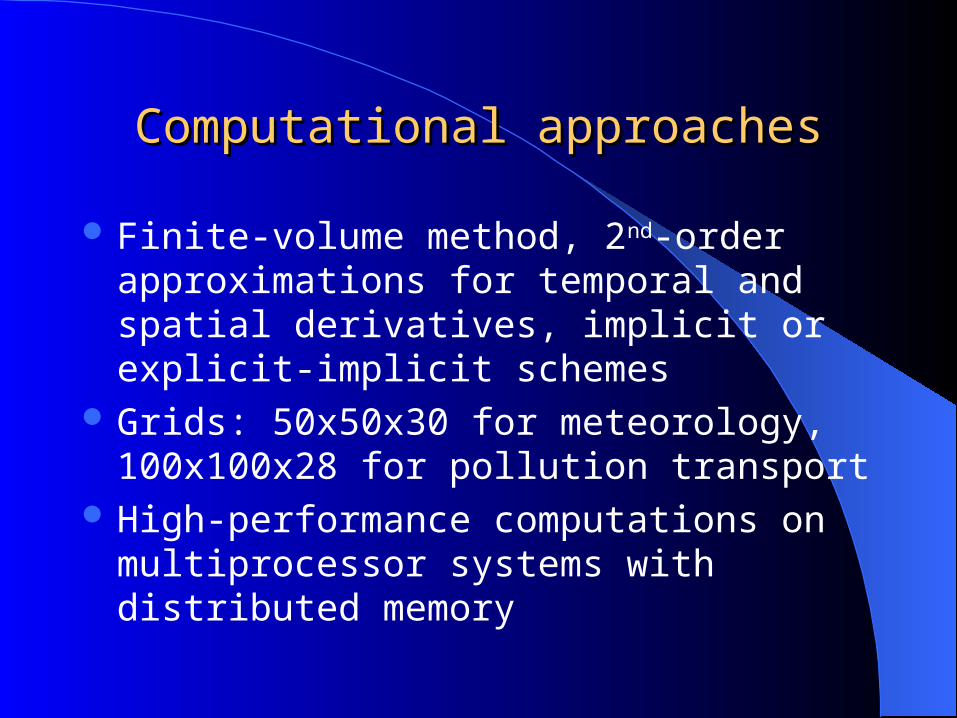
Computational approachesComputational approaches
Finite-volume method, 2nd-order approximations for temporal and spatial derivatives, implicit or explicit-implicit schemes
Grids: 50x50x30 for meteorology, 100x100x28 for pollution transport
High-performance computations on multiprocessor systems with distributed memory
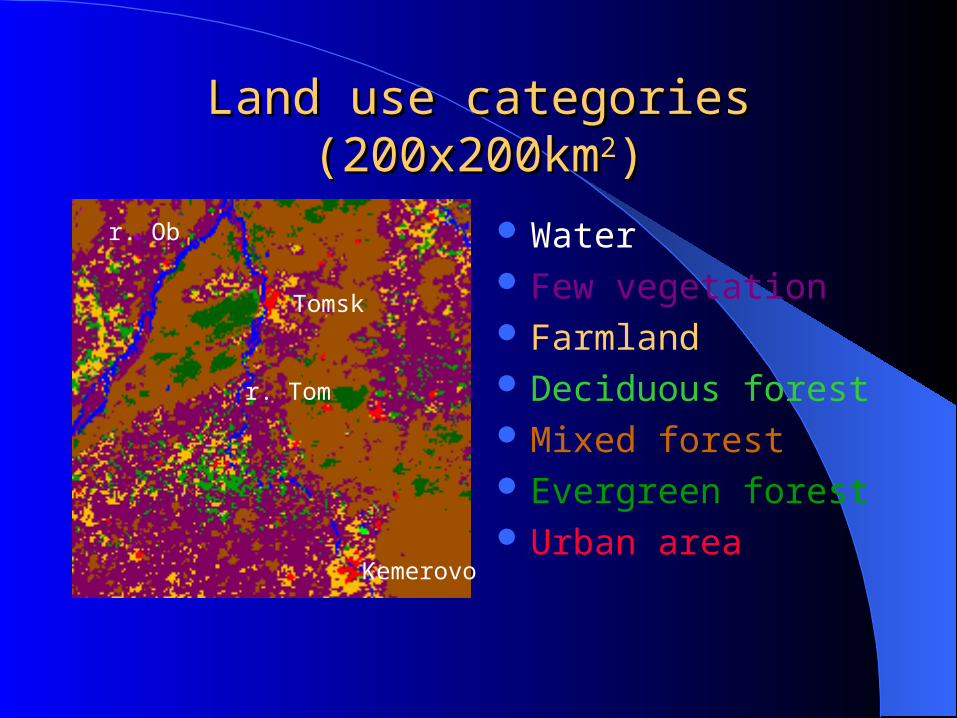
Land use categories Land use categories (200x200km(200x200km22))
WaterWater Few vegetation Farmland Deciduous forest Mixed forest Evergreen forest Urban area
Tomsk
Kemerovo
r. Tom
r. Ob
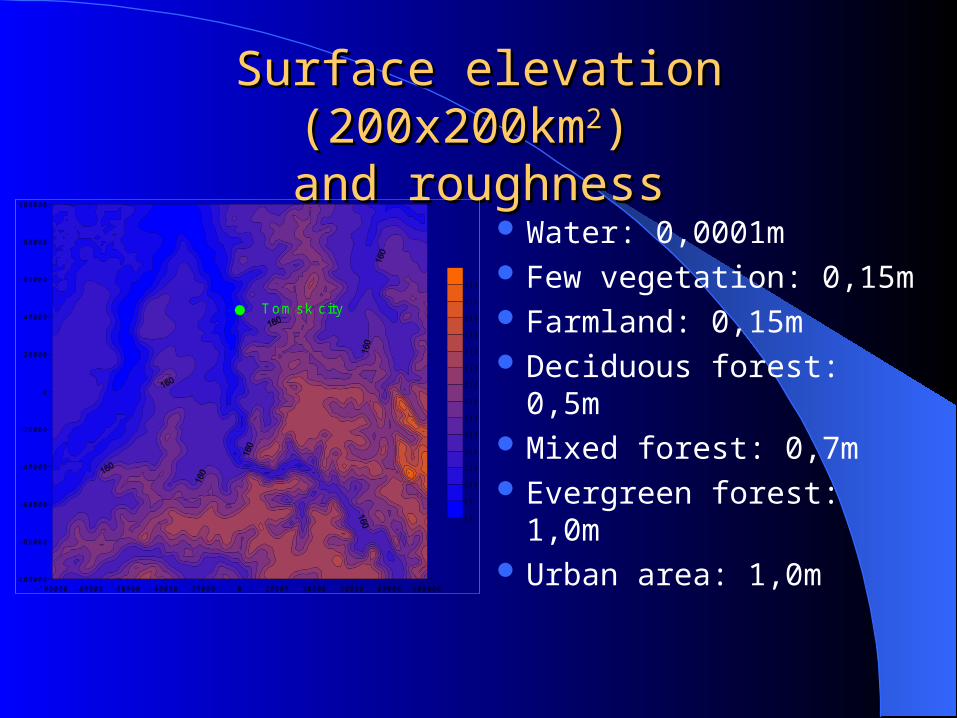
Surface elevation (200x200kmSurface elevation (200x200km22) ) and roughnessand roughness
Water: 0,0001m Few vegetation: 0,15m Farmland: 0,15m Deciduous forest: 0,5m Mixed forest: 0,7m Evergreen forest: 1,0m Urban area: 1,0m
-100000 -80000 -60000 -40000 -20000 0 20000 40000 60000 80000 100000-100000
-80000
-60000
-40000
-20000
0
20000
40000
60000
80000
100000
6 0
8 0
1 0 0
1 2 0
1 4 0
1 6 0
1 8 0
2 0 0
2 2 0
2 4 0
2 6 0
2 8 0
3 0 0
3 2 0
3 4 0
Tom sk city
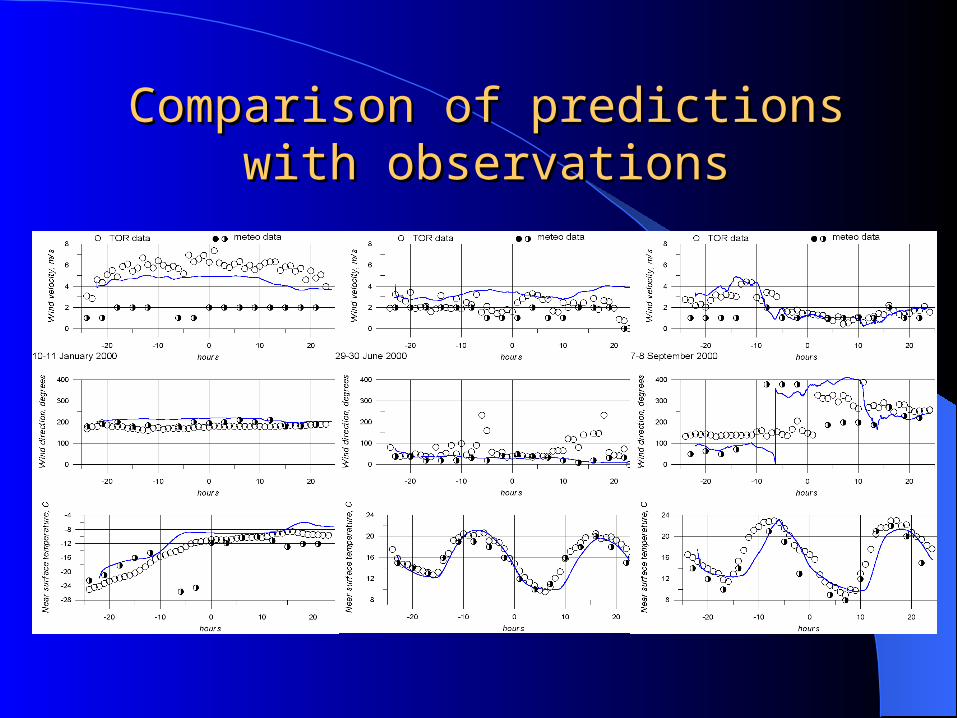
Comparison of predictions with Comparison of predictions with observationsobservations
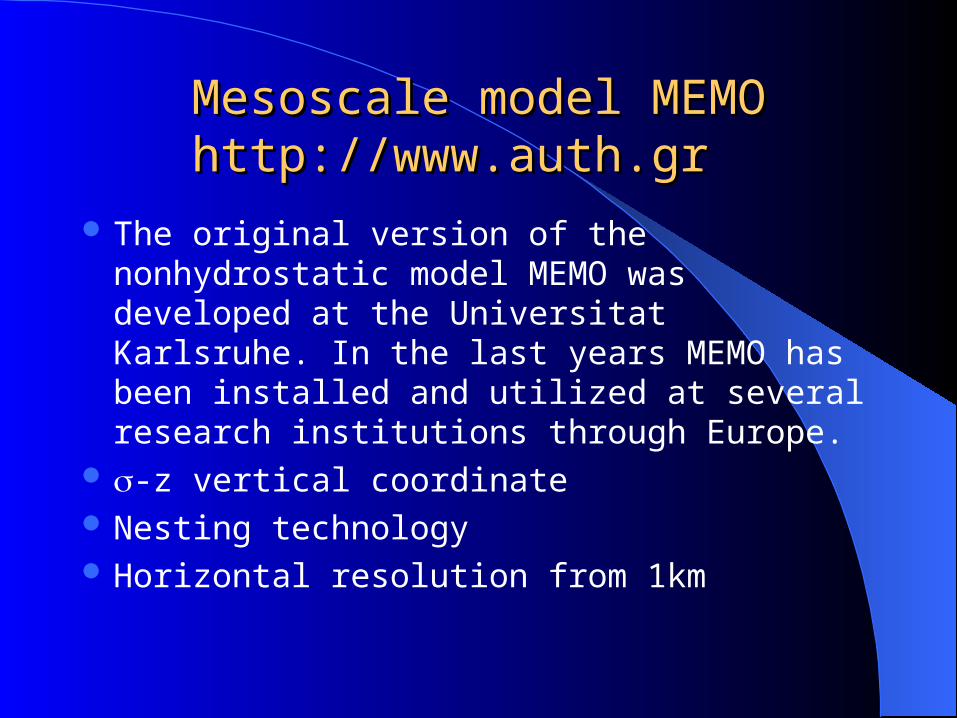
Mesoscale model MEMOMesoscale model MEMOhttp://www.auth.grhttp://www.auth.gr
The original version of the nonhydrostatic model MEMO was developed at the Universitat Karlsruhe. In the last years MEMO has been installed and utilized at several research institutions through Europe.
-z vertical coordinate Nesting technology Horizontal resolution from 1km
U r g a
T o m s k
K e m e r o v o
A n z h e r o - S u d z h e n s k
r. O
b
r. T
om
U r g a
T o m s k
K e m e r o v o
A n z h e r o - S u d z h e n s k
r. O
b
r. T
om
U r g a
T o m s k
K e m e r o v o
A n z h e r o - S u d z h e n s k
r. O
b
r. T
om
U r g a
T o m s k
K e m e r o v o
A n z h e r o - S u d z h e n s k
r. O
b
r. T
om
U r g a
T o m s k
K e m e r o v o
A n z h e r o - S u d z h e n s k
r. O
b
r. T
om
U r g a
T o m s k
K e m e r o v o
A n z h e r o - S u d z h e n s k
r. O
b
r. T
om
-100000 -80000 -60000 -40000 -20000 0 20000 40000 60000 80000 100000-100000
-80000
-60000
-40000
-20000
0
20000
40000
60000
80000
100000
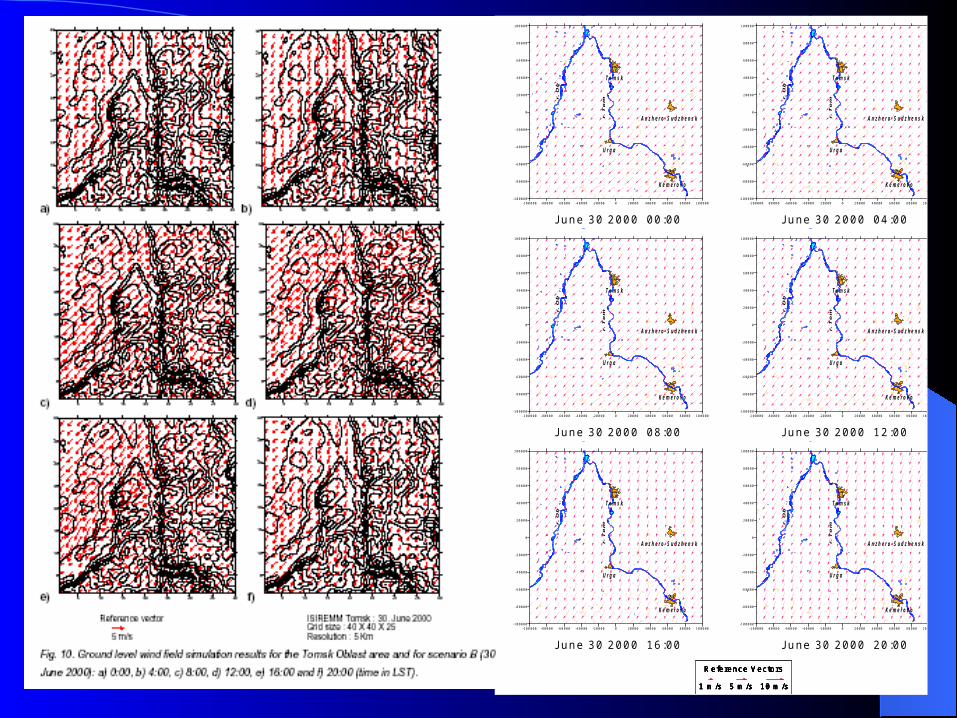
June 29 2000 04:00
Reference Vectors
1 m /s 5 m /s 10 m /s
-100000 -80000 -60000 -40000 -20000 0 20000 40000 60000 80000 100000-100000
-80000
-60000
-40000
-20000
0
20000
40000
60000
80000
100000
June 29 2000 08:00
Reference Vectors
1 m /s 5 m /s 10 m /s
-100000 -80000 -60000 -40000 -20000 0 20000 40000 60000 80000 100000-100000
-80000
-60000
-40000
-20000
0
20000
40000
60000
80000
100000
June 29 2000 12:00
Reference Vectors
1 m /s 5 m /s 10 m /s
-100000 -80000 -60000 -40000 -20000 0 20000 40000 60000 80000 100000-100000
-80000
-60000
-40000
-20000
0
20000
40000
60000
80000
100000
June 29 2000 16:00
Reference Vectors
1 m /s 5 m /s 10 m /s
-100000 -80000 -60000 -40000 -20000 0 20000 40000 60000 80000 100000-100000
-80000
-60000
-40000
-20000
0
20000
40000
60000
80000
100000
June 29 2000 20:00
Reference Vectors
1 m /s 5 m /s 10 m /s
-100000 -80000 -60000 -40000 -20000 0 20000 40000 60000 80000 100000-100000
-80000
-60000
-40000
-20000
0
20000
40000
60000
80000
100000
June 30 2000 00:00
Reference Vectors
1 m /s 5 m /s 10 m /s
U r g a
T o m s k
K e m e r o v o
A n z h e r o - S u d z h e n s k
r. O
b
r. T
om
U r g a
T o m s k
K e m e r o v o
A n z h e r o - S u d z h e n s k
r. O
b
r. T
om
U r g a
T o m s k
K e m e r o v o
A n z h e r o - S u d z h e n s k
r. O
b
r. T
om
U r g a
T o m s k
K e m e r o v o
A n z h e r o - S u d z h e n s k
r. O
b
r. T
om
U r g a
T o m s k
K e m e r o v o
A n z h e r o - S u d z h e n s k
r. O
b
r. T
om
U r g a
T o m s k
K e m e r o v o
A n z h e r o - S u d z h e n s k
r. O
b
r. T
om
-100000 -80000 -60000 -40000 -20000 0 20000 40000 60000 80000 100000-100000
-80000
-60000
-40000
-20000
0
20000
40000
60000
80000
100000
June 30 2000 00:00
Reference Vectors
1 m /s 5 m /s 10 m /s
-100000 -80000 -60000 -40000 -20000 0 20000 40000 60000 80000 100000-100000
-80000
-60000
-40000
-20000
0
20000
40000
60000
80000
100000
June 30 2000 04:00
Reference Vectors
1 m /s 5 m /s 10 m /s
-100000 -80000 -60000 -40000 -20000 0 20000 40000 60000 80000 100000-100000
-80000
-60000
-40000
-20000
0
20000
40000
60000
80000
100000
June 30 2000 08:00
Reference Vectors
1 m /s 5 m /s 10 m /s
-100000 -80000 -60000 -40000 -20000 0 20000 40000 60000 80000 100000-100000
-80000
-60000
-40000
-20000
0
20000
40000
60000
80000
100000
June 30 2000 12:00
Reference Vectors
1 m /s 5 m /s 10 m /s
-100000 -80000 -60000 -40000 -20000 0 20000 40000 60000 80000 100000-100000
-80000
-60000
-40000
-20000
0
20000
40000
60000
80000
100000
June 30 2000 16:00
Reference Vectors
1 m /s 5 m /s 10 m /s
-100000 -80000 -60000 -40000 -20000 0 20000 40000 60000 80000 100000-100000
-80000
-60000
-40000
-20000
0
20000
40000
60000
80000
100000
June 30 2000 20:00
Reference Vectors
1 m /s 5 m /s 10 m /s
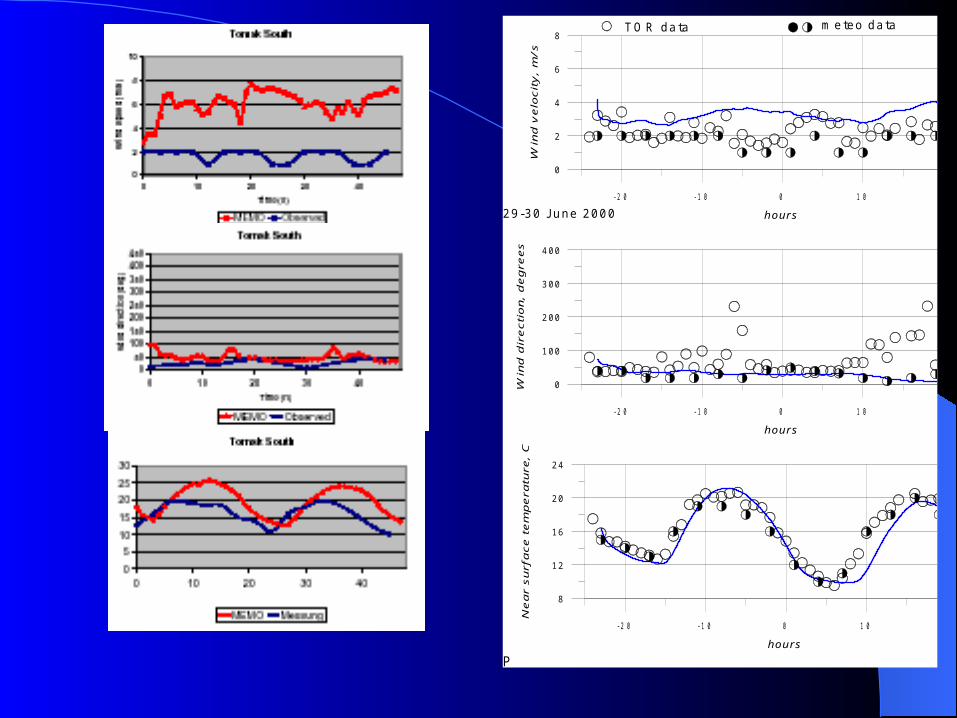
-20 -10 0 10 20
hour s
0
2
4
6
8
Win
d v
elo
city
, m/s
-20 -10 0 10 20
hour s
0
100
200
300
400
Win
d d
irec
tio
n, d
egre
es
-20 -10 0 10 20
hour s
8
12
16
20
24
Nea
r su
rfac
e te
mp
erat
ure,
С
29-30 June 2000
TO R data m eteo data
Р
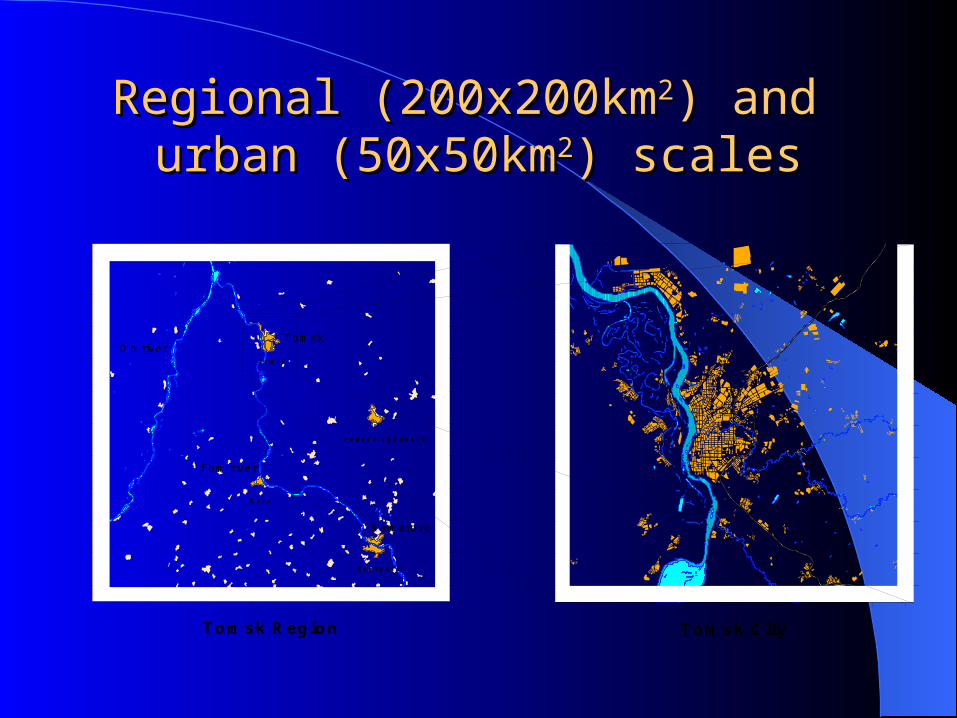
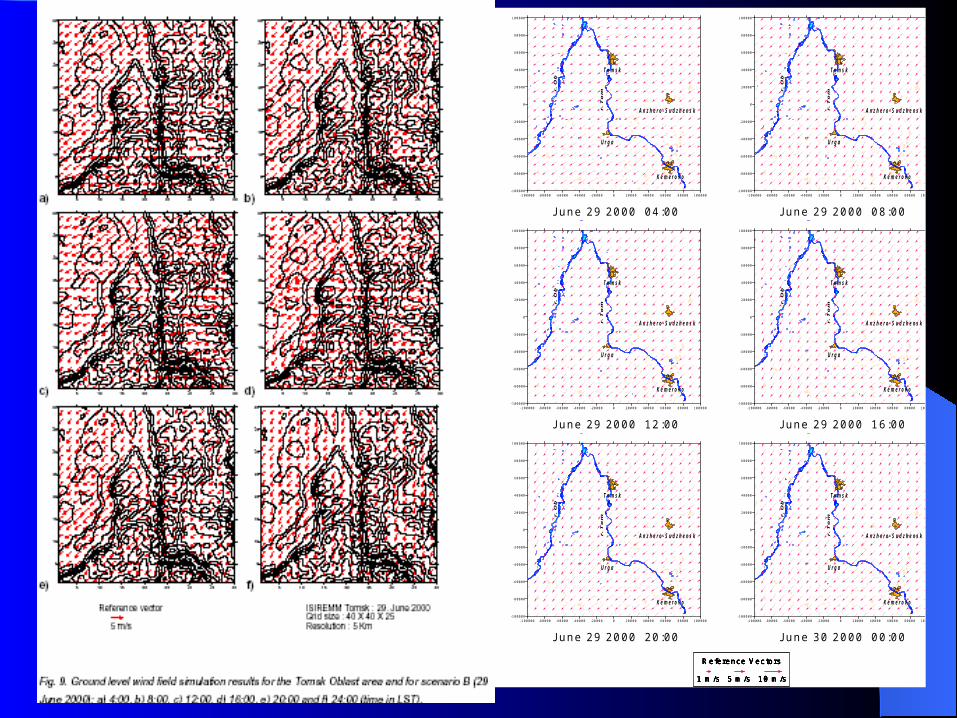
Regional (200x200kmRegional (200x200km22) and ) and urban (50x50kmurban (50x50km22) scales) scales
Т о м с кТ о м с к
Ю р г аЮ р г а
К е м е р о в оК е м е р о в о
А н ж е р о - С у д ж е н с кА н ж е р о - С у д ж е н с к
Tomsk Region Tomsk City
Tom skO b river
Tom river
Kem erovo
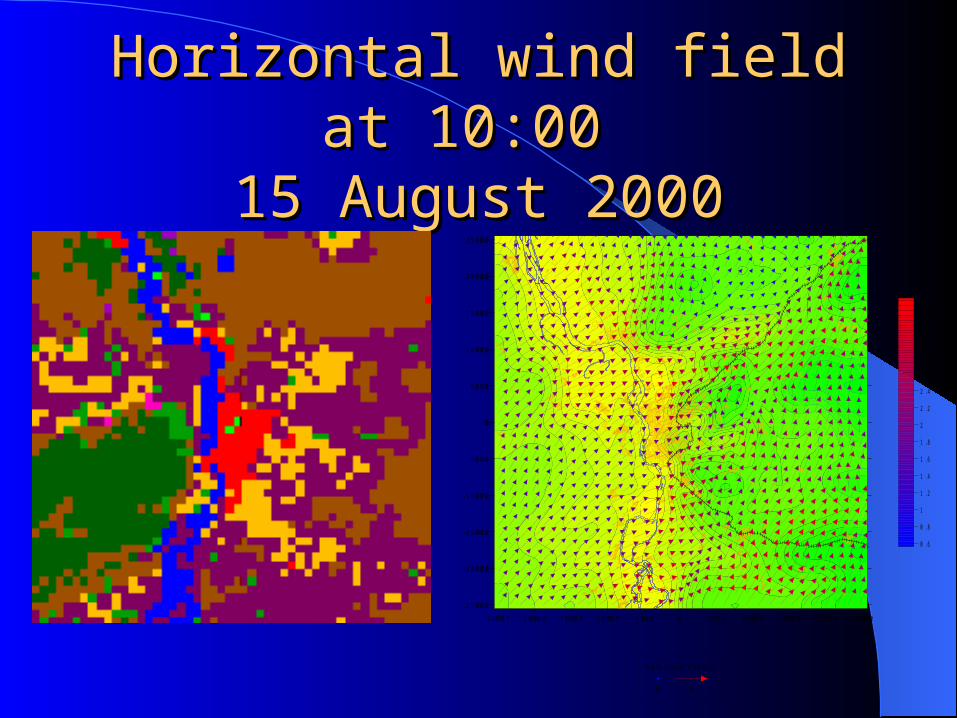
Horizontal wind field at Horizontal wind field at 10:00 10:00
15 August 200015 August 2000
-25 -20 -15 -10 -5 0 5 10 15 20 25
-25
-20
-15
-10
-5
0
5
10
15
20
25
0.6
0.8
1
1.2
1.4
1.6
1.8
2
2.2
2.4
2.6
2.8
3
3.2
3.4
-25000 -20000 -15000 -10000 -5000 0 5000 10000 15000 20000 25000
-25000
-20000
-15000
-10000
-5000
0
5000
10000
15000
20000
25000
R eference Vectors
0 5
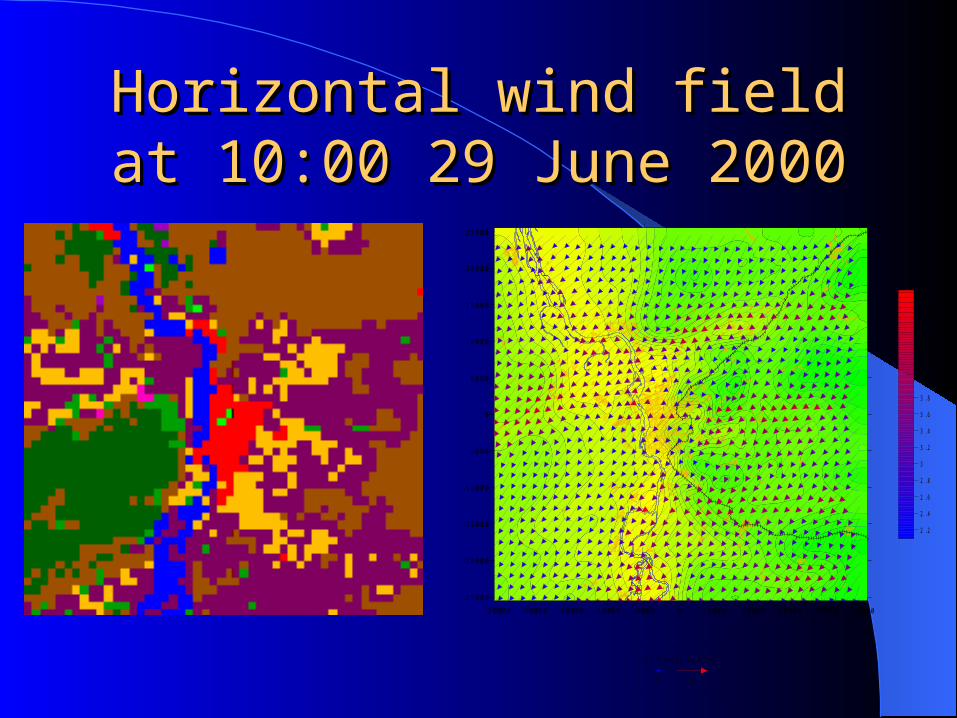
Horizontal wind field at Horizontal wind field at 10:00 29 June 200010:00 29 June 2000
-25 -20 -15 -10 -5 0 5 10 15 20 25
-25
-20
-15
-10
-5
0
5
10
15
20
25
-25000 -20000 -15000 -10000 -5000 0 5000 10000 15000 20000 25000
-25000
-20000
-15000
-10000
-5000
0
5000
10000
15000
20000
25000
2.2
2.4
2.6
2.8
3
3.2
3.4
3.6
3.8
4
4.2
4.4
4.6
4.8
5
R eference Vectors
0 5
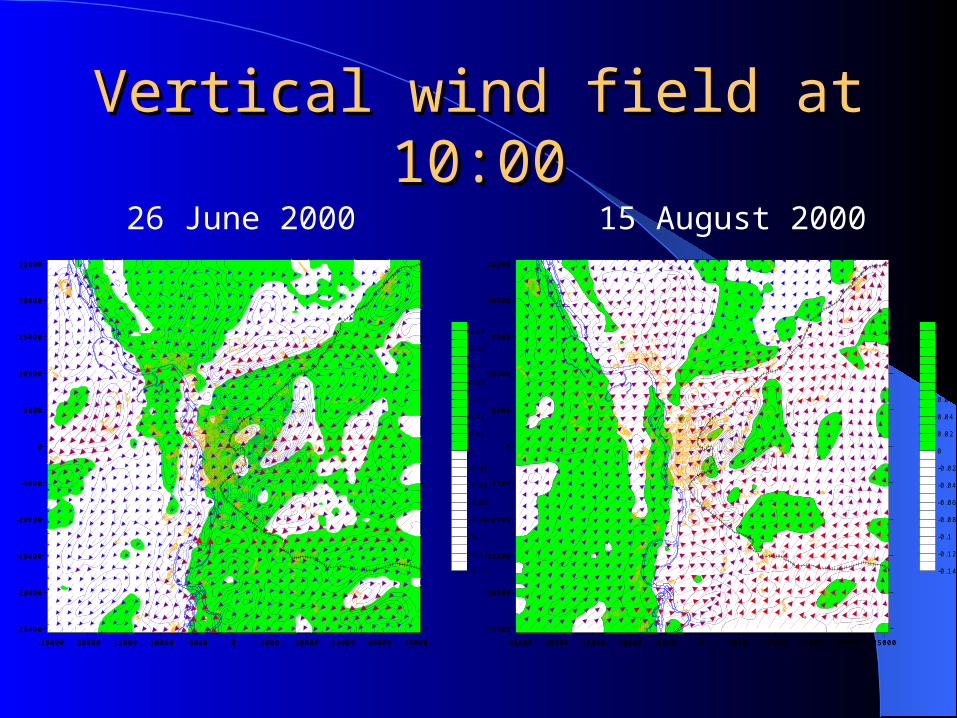
Vertical wind field at 10:00Vertical wind field at 10:0026 June 2000 15 August 2000
-25000 -20000 -15000 -10000 -5000 0 5000 10000 15000 20000 25000
-25000
-20000
-15000
-10000
-5000
0
5000
10000
15000
20000
25000
-0.14
-0.12
-0.1
-0.08
-0.06
-0.04
-0.02
0
0.02
0.04
0.06
0.08
0.1
0.12
0.14
-25000 -20000 -15000 -10000 -5000 0 5000 10000 15000 20000 25000
-25000
-20000
-15000
-10000
-5000
0
5000
10000
15000
20000
25000
-25000 -20000 -15000 -10000 -5000 0 5000 10000 15000 20000 25000
-25000
-20000
-15000
-10000
-5000
0
5000
10000
15000
20000
25000
-0.14
-0.12
-0.1
-0.08
-0.06
-0.04
-0.02
0
0.02
0.04
0.06
0.08
0.1
0.12
0.14
-25000 -20000 -15000 -10000 -5000 0 5000 10000 15000 20000 25000
-25000
-20000
-15000
-10000
-5000
0
5000
10000
15000
20000
25000
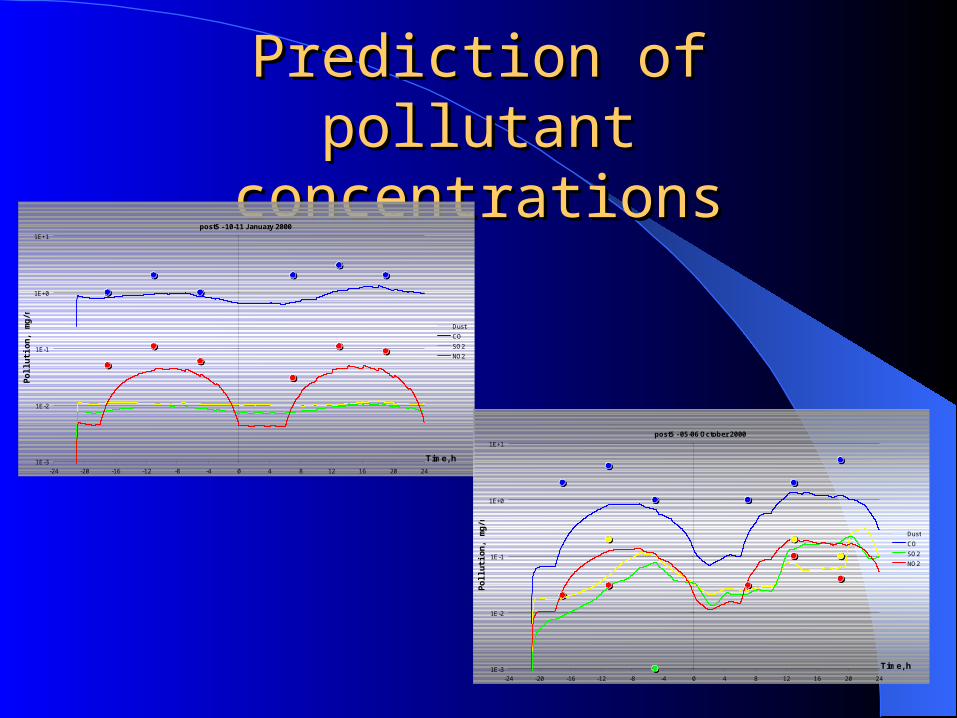
Prediction of pollutant Prediction of pollutant concentrationsconcentrations
post5 - 10-11 January 2000
1E-3
1E-2
1E-1
1E+0
1E+1
-24 -20 -16 -12 -8 -4 0 4 8 12 16 20 24
Time, h
Po
lluti
on
, mg
/m3
Dust
CO
SO2
NO2
post5 - 05-06 October 2000
1E-3
1E-2
1E-1
1E+0
1E+1
-24 -20 -16 -12 -8 -4 0 4 8 12 16 20 24
Time, h
Po
lluti
on
, mg
/m3
Dust
CO
SO2
NO2
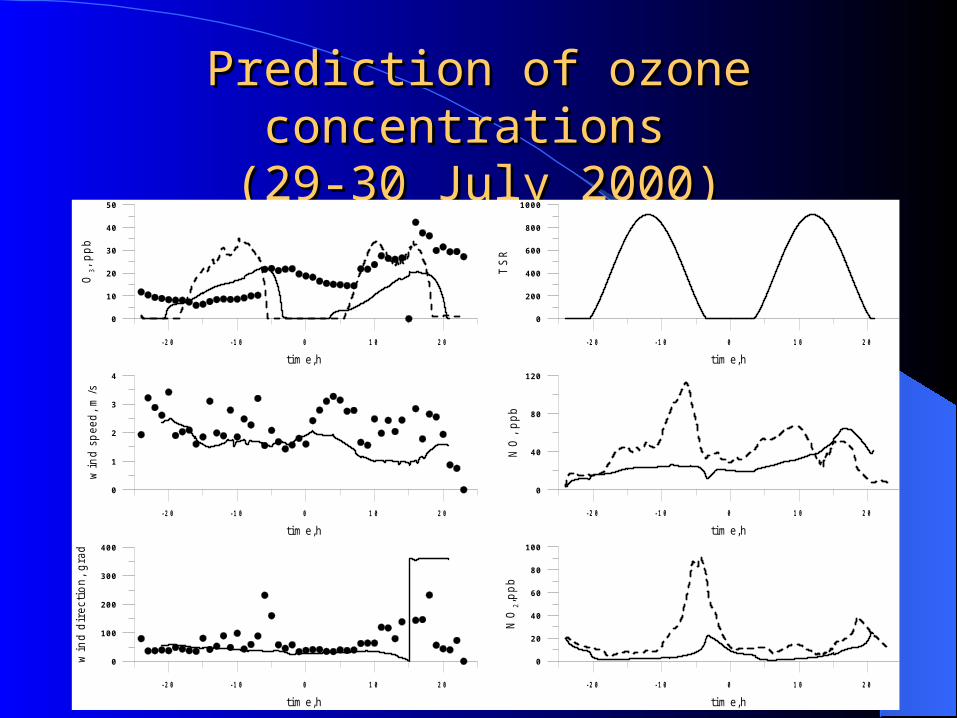
Prediction of ozone Prediction of ozone concentrations concentrations
(29-30 July 2000)(29-30 July 2000)
- 2 0 - 1 0 0 1 0 2 0
tim e ,h
0
10
20
30
40
50
O3,
ppb
- 2 0 - 1 0 0 1 0 2 0
tim e ,h
0
1
2
3
4
win
d sp
eed,
m/s
- 2 0 - 1 0 0 1 0 2 0
tim e ,h
0
100
200
300
400
win
d di
rect
ion,
gra
d
- 2 0 - 1 0 0 1 0 2 0
tim e ,h
0
40
80
120
NO
, ppb
- 2 0 - 1 0 0 1 0 2 0
tim e ,h
0
20
40
60
80
100
NO
2,ppb
- 2 0 - 1 0 0 1 0 2 0
tim e ,h
0
200
400
600
800
1000
TS
R

-20 -10 0 10 20
tim e, hrs
0
0.2
0.4
0.6
0.8
1
Inde
x
-20 -10 0 10 20
tim e, hrs
0
0.2
0.4
0.6
0.8
1
Inde
x
-20 -10 0 10 20
tim e, hrs
0
0.2
0.4
0.6
0.8
1
Inde
x
Index of pollution Index of pollution (CO+NO(CO+NO22+SO+SO22))
ConclusionsConclusions
The developed modeling system was applied to investigate a wind field and pollution dispersion nearby Tomsk industrial center
The predictions showed a close connection between a local meteorology and air quality in the city and suburban area.Undesirable meteorological situation is calm wind in conjunction with temperature inversion