Embed Size (px)
Citation preview

- 7 NASr-2 1- (0 7 ) . >
MEMORANDUM RM-5110-NASA DECEMBER 1966
A NUMERICAL GENERAL CIRCULATION EXPERIMENT FOR
THE ATMOSPHERE O F MARS
C. B. Leovy and Y. Mintz
L1 0
I 0 a ( T H R U I
N67-15280
PREPARED FOR
NATIONAL AERONAUTICS AND SPACE ADMINISTRATION
GPO PRICE $
CFSTl PRICE(S) $ 7h RR n D- S A N T A M O N I C A C A L I F O R N I A
Microfiche (M F) /4 65
https://ntrs.nasa.gov/search.jsp?R=19670005951 2018-07-30T10:22:43+00:00Z

December i966 RB-5110
RM-5110-NASAY A Numerical General C i rcu la t ion Experiment f o r t h e AtmosDhere of Mars. C . B . Leovv and Y . Mintz. RAND Memorandum,
- I _.
December 1966, 51 pp.
PURPOSE: To d e s c r i b e a numerical experiment t o s imula t e t h e gene ra l c i r c u l a t i o n of t h e atmosphere of Mars.
THE MODEL: The dynamical model used was Mintz and Arakawa's two-level p r i m i t i v e equat ion model, which had a l r e a d y demonstrated i t s a b i l i t y t o s imula t e t h e g ross f e a t u r e s of t h e gene ra l c i r c u l a t i o n p a t t e r n of t h e e a r t h . The most i m - p o r t a n t problem i n adapt ing t h e model t o Mars was t h e s p e c i f i c a t i o n of t h e hea t ing f u n c t i o n s , s i n c e t h e s e g e n e r a t e and maintain t h e c i r c u l a t i o n . Based mainly on r e c e n t s t u d i e s of t h e Martian atmosphere and spectrum, i t was assumed t h a t t h e atmosphere was composed e n t i r e l y of C02 and had an i n i t i a l s u r f a c e p r e s s u r e of 5 m i l l i b a r s . Fac to r s taken i n t o account included hea t ing e f f e c t s of abso rp t ion of s o l a r r a d i a t i o n by t h e atmosphere and by t h e ground, exchange of i n f r a r e d r a d i a t i o n between atmospheric l a y e r s and between t h e atmosphere and t h e ground, conduction i n t o t h e ground, convect ive exchange between t h e ground and t h e atmosphere, convect ive t r a n s f e r between atmospheric l a y e r s , and l a t e n t h e a t release due t o carbon d iox ide condensation a t t h e ground.
THE NUMERICAL EXPERIMENT: Ca lcu la t ion was s t a r t e d from t h e i n i t i a l c o n d i t i o n of a r e s t i n g i so the rma l atmosphere wi th a temperature of 2000K. The i n i t i a l ground temperature was taken t o be t h e same. The subso la r p o i n t was i n i t i a l l y pu t a t Oo l ong i tude and 24.80 sou th l a t i t u d e , corresponding t o t h e southern hemisphere summer s o l s t i c e . i n i t i a l l y t o be ze ro .
The mass of s o l i d C 0 2 on t h e ground was assumed
F I N D I N G S : The f i r s t poss ib ly important f e a t u r e i n d i c a t e d by t h e model was t h e development of a f l u c t u a t i n g wave regime i n t h e win te r hemisphere. These upper- level waves had r ap id i n i t i a l growth r a t e s , and t h e i r i n i t i a l phase speeds corresponded reasonably w e l l w i t h t h e t h e o r e t i c a l speed f o r a baro- t r o p i c Rossby wave. A l a r g e amplitude d i u r n a l t i d e was a l s o noted . Perhaps of g r e a t e s t i n t e r e s t , however, was t h e condensation of C 0 2 t o form a win te r p o l a r i c e cap whose width was c l o s e t o t h e maximum width of t h e observed Mars i c e c a p .
FUTURE PLANS: An at tempt w i l l be made t o improve t h e phys ica l model by reformu- l a t i n g t h e lower boundary c o n d i t i o n s , changing t h e pa rame te r i za t ion of t h e s u r f a c e convect ive h e a t f l u x , and consider ing t h e e f f e c t of c louds on t h e r a d i a t i v e h e a t i n g .
I
BACKGROUND: Th i s RAND s tudy f o r NASA was motivated by i n t e r e s t i n t h e wind s y s t e m s on Mars, a r i s i n g from proposed exp lo ra t ion mis s ions , and by t h e a b i l i t y t o s imula t e t h e c i r c u l a t i o n of p l a n e t a r y atmospheres by numerical i n t e g r a t i o n of t h e governing p h y s i c a l equat ions. t i v e Equi l ibr ium Ca lcu la t ions f o r a Two-layer Mars Atmosphere, May 1966 . )
(See a l s o RM-5017-NASAY Rad ia t ive Convec- -_I
NASr-21407)
MEMORANDUM RM-5 110-NASA DECEMBER 1966
A NUMERICAL GENERAL CIRCULATION EXPERIMENT FOR
THE ATMOSPHERE OF MARS C. B. Leovy and Y. Mintz
This research is supported by the National Aeronautics and Space Administration under Contract No. NASr-21. This report does not necessarily represent the views of the National Aeronautics and Space Administration.
1700 M A I N S l * S A N l A M O N I C A f C A L I I O R N I A ,0106

PREFACE
The experiment reported here is, in part, a result of RAND'S long-
time interest in computer models of atmospheric dynamics. The goal in
this effort was to simulate the global circulation of Mars by applica- tion of basic dynamical equations. This Memorandum should be of interest
to those concerned with the Mars atmosphere in general, and in particular
to persons concerned with atmospheric parameters for Mars lander missions.

‘V-
ABSTRACT
A numerical model f o r s imulat ing t h e g e n e r a l c i r c u l a t i o n of t h e
atmosphere o f Mars i s desc r ibed and prel iminary r e s u l t s from an i n i t i a l experiment a r e given.
n o r t h e r n hemisphere w i n t e r s o l s t i c e on a p l a n e t , i n t h e o r b i t of Mars,
having an atmosphere composed e n t i r e l y of CO
p re s su re of 5 mb.
(1) development of a f l u c t u a t i n g wave regime i n t h e win te r hemisphere,
(2) a l a r g e amplitude d i u r n a l t i d e , and (3) condensat ion of C02 t o form
a w i n t e r p o l a r ice-cap.
i s s t r e s s e d and some f u t u r e improvements are proposed.
The experimental cond i t ions correspond t o t h e
and an i n i t i a l s u r f a c e
The important f e a t u r e s i n d i c a t e d by t h e model are 2
The prel iminary c h a r a c t e r of t h i s experiment

-vii-
ACKNOWLELZMENTS
The a u t h o r s wish t o thank D r . Gerard de Vaucouleurs f o r providing
t h e t a b l e of a lbedo va lues , and D r . Akio Arakawa f o r h i s va luab le ad-
v i c e during t h e p repa ra t ion of t h e experiment.
t o t h e Jet Propuls ion Laboratory for providing t h e computer time f o r
t h e experiment, and p a r t i c u l a r l y t o Charles Campen, Robert McClatchey,
and Frank Herron of JPL f o r t h e i r kind cooperat ion.
t h e experiment was c a r r i e d ou t by M r . A. B. Nelson of RAND, and we
have b e n e f i t e d from t h e adv ice o f M r . Daniel Sabsay du r ing t h e pro-
gramming phase.
Task Order Contract NASr-Zl(07).
We are deeply indebted
P r o g r a m i n g of
We a l s o wish t o acknowledge t h e support o f NASA under

-ix-
CONTENTS
PREFACE ......................................................... iii
ABSTRACT ........................................................ v
ACKNOWLEDGMENTS ................................................. v i i
I . INTRODUCTION .............................................. 1
11. THE GOVERNING PHYSICAL EQUATIONS AND NUMERICAL MODEL ...... 2
111. APPLICATION OF THE MODEL TO MARS .......................... 5
I V . THE NUMERICAL EXPERIMENT .................................. 1 2
V. DISCUSSION ................................................ 38
REFERENCES ...................................................... 41

I. INTRODUCTION
I n t e r e s t i n t h e wind sys t ems on Mars, a r i s i n g from proposed explo-
r a t i o n missions t o t h e p l a n e t , and t h e a b i l i t y t o s imula t e t h e c i r c u -
l a t i o n of p l ane ta ry atmospheres by numerical i n t e g r a t i o n of t h e governing
p h y s i c a l equa t ions have motivated t h i s s tudy. I'
Recent i n v e s t i g a t i o n s , by Kaplan, Munch, and Spinrad and by K l i o r e
and h i s co-workers, have provided new estimates of t h e mass and compo-
s i t i o n of t h e Mars atmosphere. We use t h e s e new estimates, toge the r
w i t h t h e known s i z e , s u r f a c e g rav i ty , r o t a t i o n per iod, a x i a l t ilt ,
e c c e n t r i c i t y of o r b i t , and s o l a r constant f o r Mars. We assume t h a t t h e
s u r f a c e i s l e v e l ; t h a t i s , t h a t t h e r e are no l a r g e - s c a l e mountains on
t h e p l a n e t . Albedo v a r i a t i o n s according t o a t a b u l a t i o n prepared f o r
us by G. de Vaucouleurs have been taken i n t o account , but through an
i n a d v e r t e n t t r a n s p o s i t i o n of coord ina te s , t hose a c t u a l l y used i n the
experiment do no t correspond p r e c i s e l y wi th de Vaucouleurs' va lues (see
f o o t n o t e on p. 8).
The dynamical model we use i s the two-level p r i m i t i v e equa t ion model
of Mintz and Arakawa. This model has a l r e a d y demonstrated i t s a b i l i t y
t o s i m u l a t e t h e gross f e a t u r e s of the g e n e r a l c i r c u l a t i o n of t h e e a r t h ' s
atmosphere. The c a l c u l a t i o n s were done on t h e IBM 7094 computer a t the
J e t P ropu l s ion Laboratory, Pasadena. Only p re l imina ry r e s u l t s from t h e
f i r s t of several contemplated numerical experiments f o r Mars a r e d i scus -
s ed he re .
-2 -
11. THE GOVERNING PHYSICAL EQUATIONS AND NUMERICAL MODEL
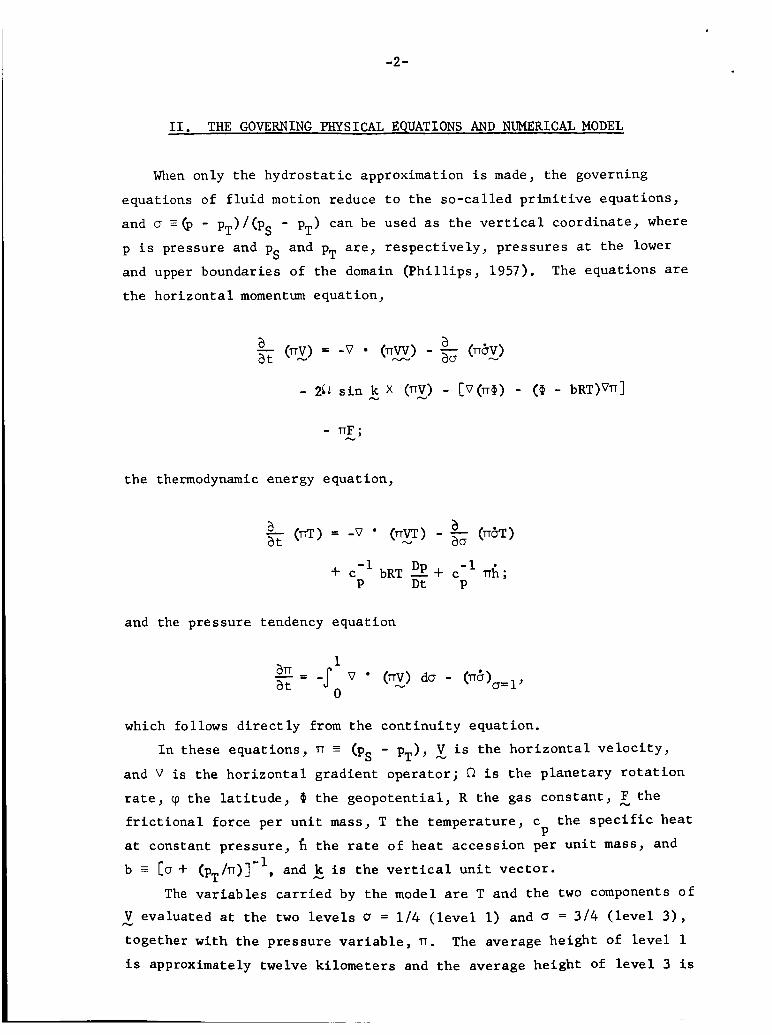
When only t h e h y d r o s t a t i c approximation i s made, t h e governing
equat ions of f l u i d motion reduce t o t h e s o - c a l l e d p r i m i t i v e equa t ions ,
and a -(p - pT)/(ps - pT) can be used as t h e v e r t i c a l coord ina te , where
p i s pressure and p and p a r e , r e s p e c t i v e l y , p r e s s u r e s a t t h e lower S T and upper boundaries of t h e domain ( P h i l l i p s , 1957). The equa t ions are
t h e h o r i z o n t a l momentum equat ion,
a (TThV) a - (nx) = -v (TTW) - - a t - a0 -
t h e thermodynamic energy equa t ion ,
- a (nT) = -v (TTVT) - a (TTzrT) a t N
-1 Dp -1 -t c bRT - 4 - c nk; P D t P
and the p re s su re tendency equa t ion
1
0 an = -J V (TTV) do - a t N
which follows d i r e c t l y from t h e c o n t i n u i t y equa t ion .
I n t h e s e equa t ions , n = (p, - p,), i s t h e h o r i z o n t a l v e l o c i t y ,
and V i s t h e h o r i z o n t a l g r a d i e n t ope ra to r ; R i s t h e p l a n e t a r y r o t a t i o n
rate, cp t h e l a t i t u d e , @ t h e g e o p o t e n t i a l , R t h e gas c o n s t a n t ,
f r i c t i o n a l fo rce pe r u n i t mass, T t h e temperature , c
a t constant p re s su re , h t h e rate of h e a t a c c e s s i o n per u n i t m a s s , and
b E [a + (pT/n)]
N V evaluated a t t h e two levels 0 = 1 / 4 ( l e v e l 1) and CJ = 314 ( l e v e l 3 ) ,
t oge the r w i t h t h e p r e s s u r e v a r i a b l e , n. The average h e i g h t of l e v e l 1
i s approximately twelve k i lome te r s and t h e average h e i g h t Of l e v e l 3 i s
t h e
t h e s p e c i f i c h e a t P
-1 , and 5 i s t h e ve r t i ca l u n i t v e c t o r .
The v a r i a b l e s c a r r i e d by t h e model are T and t h e two components o f
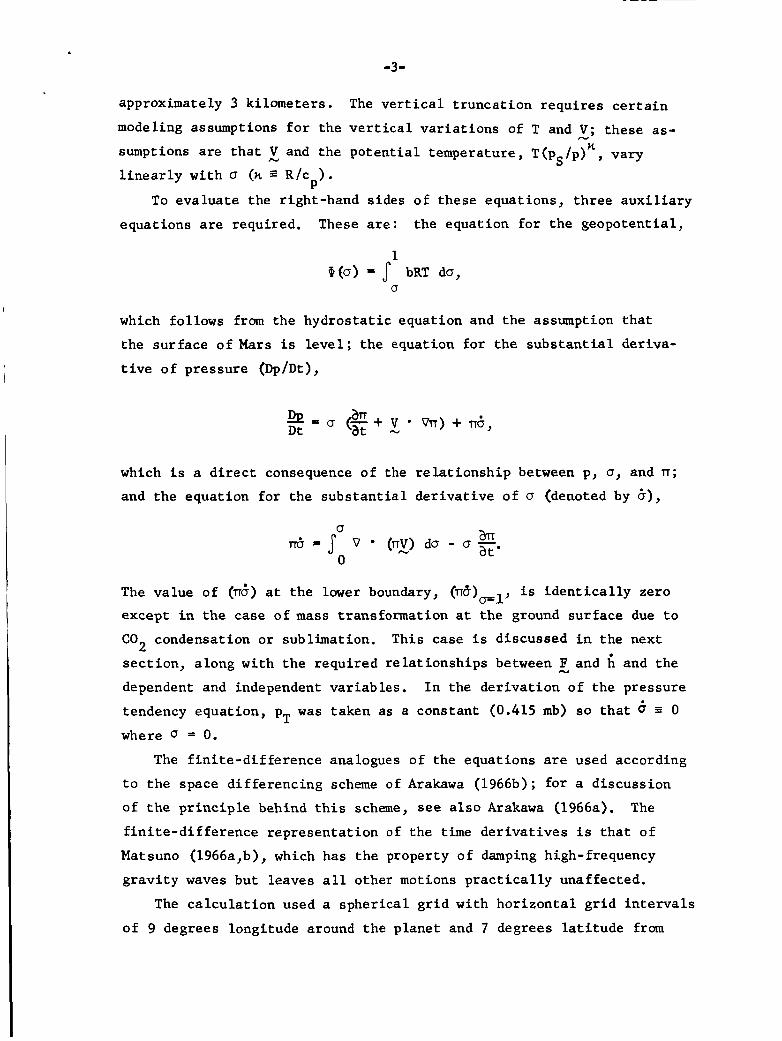
approximately 3 k i lome te r s .
modeling assumptions f o r t h e v e r t i c a l v a r i a t i o n s of T and V; t h e s e a s -
sumptions are t h a t
l i n e a r l y w i t h CY (n B R/cp) .
equa t ions are required. These are: t h e equat ion f o r t h e g e o p o t e n t i a l ,
The v e r t i c a l t r u n c a t i o n r e q u i r e s c e r t a i n
N
and t h e p o t e n t i a l temperature , T(pS/p) n , vary
To e v a l u a t e t h e r ight-hand s i d e s o f t hese equa t ions , t h r e e a u x i l i a r y
which fol lows from t h e h y d r o s t a t i c equa t ion and t h e assumption t h a t
t he s u r f a c e o f Mars i s l e v e l ; t h e equat ion f o r t h e s u b s t a n t i a l de r iva -
t i v e o f p r e s s u r e (Dp/Dt),
which i s a d i r e c t consequence of the r e l a t i o n s h i p between p, 0, and n; and t h e equa t ion f o r
The va lue of (n;) a t
t h e s u b s t a n t i a l d e r i v a t i v e o f a (denoted by b) ,
t h e lower boundary, (na),,, i s i d e n t i c a l l y ze ro
excep t i n t h e case o f m a s s t r ans fo rma t ion a t t h e ground s u r f a c e due t o
CO condensation o r subl imat ion. Th i s case i s d i scussed i n t h e next
s e c t i o n , a long wi th t h e r equ i r ed r e l a t i o n s h i p s between and and t h e
dependent and independent v a r i a b l e s .
tendency equa t ion , pT w a s t aken as a cons t an t (0.415 mb) so t h a t 6 where 0 = 0.
2
I n the d e r i v a t i o n of t h e p re s su re
0
The f i n i t e - d i f f e r e n c e analogues of t he equa t ions are used according
t o t h e space d i f f e r e n c i n g scheme of Arakawa (1966b); f o r a d i scuss ion
of t h e p r i n c i p l e behind t h i s scheme, see a l s o Arakawa (1966a). The
f i n i t e - d i f f e r e n c e r e p r e s e n t a t i o n of t h e t i m e d e r i v a t i v e s i s t h a t o f
Matsuno (1966a,b), which has t h e property o f damping high-frequency
g r a v i t y waves b u t l eaves a l l other motions p r a c t i c a l l y una f fec t ed .
The c a l c u l a t i o n used a s p h e r i c a l g r i d wi th h o r i z o n t a l g r i d i n t e r v a l s
of 9 degrees long i tude around t h e p l a n e t and 7 degrees l a t i t u d e from

-4-
77" South t o 77' North, p lus t h e two poles . This provides va lues fo r
each v a r i a b l e , a t each l e v e l , a t about 1000 poin ts . The 9-by-7-degree
i n t e r v a l s make the zonal and mer id iona l l i n e a r scales equa l a t l a t i t u d e
39".
-5 -
111. APPLICATION OF THE MODEL TO MARS
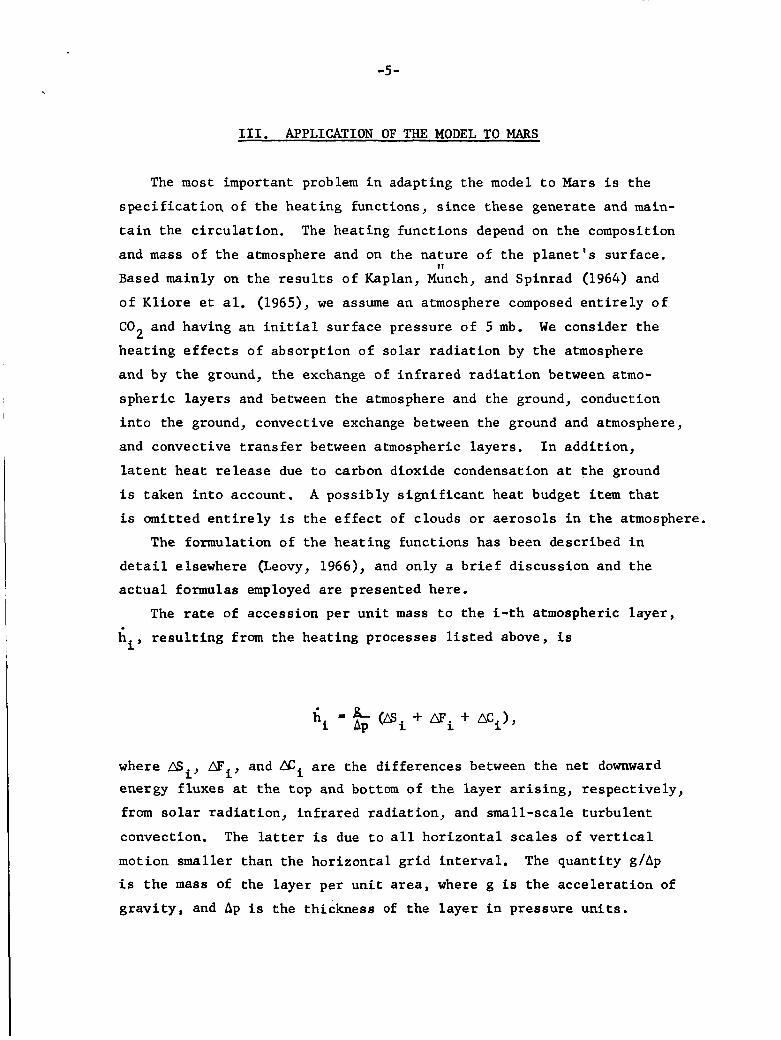
The most important problem i n adapt ing t h e model t o Mars i s t h e
s p e c i f i c a t i o n of t h e h e a t i n g funct ions, s i n c e t h e s e gene ra t e and main-
t a i n t h e c i r c u l a t i o n . The h e a t i n g func t ions depend on t h e composition
and mass of t h e atmosphere and on the n a t u r e of t h e p l a n e t ' s su r f ace .
Based mainly on t h e r e s u l t s o f Kaplan, Munch, and Spinrad (1964) and
o f K l i o r e e t al. (1965), we assume a n atmosphere composed e n t i r e l y o f
C02 and having an i n i t i a l s u r f a c e p re s su re o f 5 mb.
h e a t i n g e f f e c t s o f abso rp t ion of s o l a r r a d i a t i o n by t h e atmosphere
and by t h e ground, t h e exchange of i n f r a r e d r a d i a t i o n between atmo-
s p h e r i c l a y e r s and between t h e atmosphere and t h e ground, conduction
i n t o t h e ground, convective exchange between t h e ground and atmosphere,
and convect ive t r a n s f e r between atmospheric l a y e r s . I n a d d i t i o n ,
l a t e n t h e a t release due t o carbon dioxide condensation a t t h e ground
i s t aken i n t o account. A poss ib ly s i g n i f i c a n t h e a t budget i t e m t h a t
i s omit ted e n t i r e l y i s t h e e f f e c t of c louds o r a e r o s o l s i n t h e atmosphere.
The formulat ion of the h e a t i n g func t ions has been desc r ibed i n
I'
W e cons ide r t h e
d e t a i l elsewhere (Leovy, 1966), and only a b r i e f d i s c u s s i o n and t h e
a c t u a l formulas employed are presented here.
The rate of access ion pe r u n i t mass t o t h e i - t h atmospheric l a y e r ,
hi , r e s u l t i n g from the h e a t i n g processes l i s t e d above, i s
'i =L Ap (asi + AFi + mi),
where ai, mi, and Si are t h e d i f f e r e n c e s between t h e n e t downward
energy f l u x e s at t h e t o p and bottom of t h e l a y e r a r i s i n g , r e s p e c t i v e l y ,
from s o l a r r a d i a t i o n , i n f r a r e d r a d i a t i o n , and small-scale t u r b u l e n t
convect ion. The lat ter i s due t o a l l h o r i z o n t a l s c a l e s o f ver t ical
motion smaller than t h e h o r i z o n t a l g r i d i n t e r v a l .
i s the mass of t h e l a y e r pe r u n i t a r e a , where g is t h e a c c e l e r a t i o n of
g r a v i t y , and Ap i s t h e th i ckness of t h e l a y e r i n p r e s s u r e u n i t s .
The q u a n t i t y g/Ap
-6-
The method employed by Houghton (1963) f o r computing s t r a t o s p h e r i c
h e a t i n g r a t e s due t o C02 i s used t o compute t h e Si.
formulas a r e
The r e s u l t i n g
2
% = ( s i n Q')1/2{389 + ( s i n + [2006 + 449 an (csc C Y ) ] 3 ,
f o r t h e upper l a y e r , and
2 1 /2]
Ds3 = [>) ( s i n C~)' /~[316 + 550(sin CY) ,
f o r t h e lower l aye r . I n t h e s e formulas (rm/r) i s t h e r a t i o of Mars'
mean d i s t ance from t h e sun t o i t s a c t u a l d i s t a n c e , CY i s t h e l o c a l
s o l a r e l e v a t i o n ang le , and t h e u n i t s of S1 and CS3 are ergs/cm sec.
S u b s c r i p t s 1 and 3 refer, r e s p e c t i v e l y , t o t h e l e v e l s a t which u = 1 / 4
and 3/4.
2
To compute t h e i n f r a r e d hea t ing , w e assume t h a t t h e temperature
v a r i e s l i n e a r l y with geometric he igh t up t o t h e l e v e l of t h e t ropo-
pause (a = 0) , where p --= 0.415 mb (Leovy, 1966). Above t h i s l e v e l t h e
temperature i s assumed t o be cons t an t w i t h h e i g h t , and equa l t o t h e
temperature a t B = 0 obtained from t h e l i n e a r e x t r a p o l a t i o n of t h e t e m -
p e r a t u r e s at B = 1/4 and u = 3/4. I n a d d i t i o n , w e assume t h a t a t h i n
l a y e r , which can have a l a r g e s t a b l e o r u n s t a b l e l a p s e r a t e , l i e s be-
tween the ground and t h e res t of t h e atmosphere.
t h i s l aye r is no t c r i t i c a l ; i t i s t aken t o be 5 meters.
T
The assumed dep th of
The t r ansmiss ion func t ions of Prabhakara and Hogan (1965) a r e
used t o e v a l u a t e the i n f r a r e d f l u x e s . The r e s u l t i n g formulas f o r t h e
f l u x d i f f e r e n c e s a r e
= -1.473 X lo%@,) + [1.204T2 - 349 + 2320Ol';'l[Tl - T3] Dl
f o r t h e upper l a y e r , and
-7 -
= -0.455 X 10 6 YOt) + [1.710T2 + 195 - 588OT~'][T1 - T3] AF3
6 -1.800 X 10 Cy(T4) - Y ( T G ) I
+ 1.30 X 10 8 T4 -2 exp (964. 1/T4)[Y (T4)2][T4 - TG],
3' f o r t h e lower layer. Here, i n a d d i t i o n t o t h e temperatures T and T
and t h e ground temperature, T,, which are computed by t h e model, appear
t h e tropopause temperature, Tt, and t h e s u r f a c e a i r temperature,
obtained by l i n e a r e x t r a p o l a t i o n from T
i n t h e s e expres s ions i s
1
T4' and T3. The func t ion Yo) 1
Y(T) = [exp (964.1/T) - 13-l.
-2 -1 Again, t h e u n i t s o f AF1 and AF a r e e r g s cm s e c . Temperatures are
expressed i n degrees Kelvin. 3
To e v a l u a t e t h e hea t balance a t t h e ground, w e r e q u i r e t h e n e t
upward i n f r a r e d r a d i a t i o n f l u x a t the ground, F,.
t h i s q u a n t i t y i s The expres s ion f o r
FG = 5.67 X - 1.929 X IO%@,)
+ [13.2T2 - 1560 - 18900T;1][Tl - T31
+ 1.30 x 10 T4 exp (964.1/T4)rY(T4)] [T4 - TG]. 8 -2 2
Convective h e a t exchange between ground and atmosphere, CG, i s
formulated i n two ways, depending on whether t h e d i f f e r e n c e between
t h e ground temperature , TG, and the s u r f a c e a i r temperature, T4, i s
p o s i t i v e o r nega t ive .
assumed t o be uns t ab ly s t r a t i f i e d , and w e take
For (T, - T ) > 0, t he s u r f a c e a i r layer i s 4

-a -
where ?5 i s t h e mean s u r f a c e a i r dens i ty .
have a constant va lue of 26 cm/sec. This va lue was de r ived from t h e
observed Mars d i u r n a l s u r f a c e temperature wave (Leovy, 1966). Because
r a d i a t i v e t r a n s f e r processes dominate t h e s u r face h e a t balance, t h e
value is not very r e l i a b l e ; it c o n s t i t u t e s one of t h e major unce r t a in -
t i e s of our experiment. This po in t i s considered i n more d e t a i l i n t h e
f i n a l s e c t i o n .
The parameter U i s taken t o M
When (TG - T ) < 0, t h e s u r f a c e a i r l aye r i s assumed t o be s t a b l y 4 s t r a t i f i e d and t h e convect ive hea t t r a n s f e r dominated by tu rbu lence
induced by t h e s u r f a c e wind. Under t h e s e cond i t ions ,
where IV I i s t h e magnitude of t h e s u r f a c e wind, l i n e a r l y e x t r a p o l a t e d
from the winds a t 0 = 1 / 4 and 3 / 4 , and Ch i s a drag c o e f f i c i e n t f o r
h e a t t r a n s f e r having t h e va lue 0,010.
s
Convective h e a t t r a n s f e r between l e v e l s 1 and 3 i s assumed t o t a k e
p l ace only i f t h e l apse rate determined by T and T i s s t a t i c a l l y
uns t ab le . I f t h e l apse rate i s u n s t a b l e , an upward convect ive h e a t
f l u x i s assumed t o t a k e p l ace a t a very r a p i d rate, warming t h e upper
l e v e l and cool ing t h e lower l e v e l , such t h a t t h e t i m e cons t an t f o r ad-
justment t o the a d i a b a t i c l a p s e r a t e i s approximately one computational
t i m e s t e p (1/240 of a Mars day, o r 6 Mars minutes) .
1 3
To eva lua te upward r a d i a t i v e and convect ive t r a n s f e r , t h e ground
temperature , TG, i s r equ i r ed .
i n t h e program, and i t s rate of change i s determined by t h e h e a t balance
cond i t ion a t t h e ground,
T h i s i s c a r r i e d as a n a u x i l i a r y v a r i a b l e
(1 - A)SG - FG - CG - DG + L = 0,
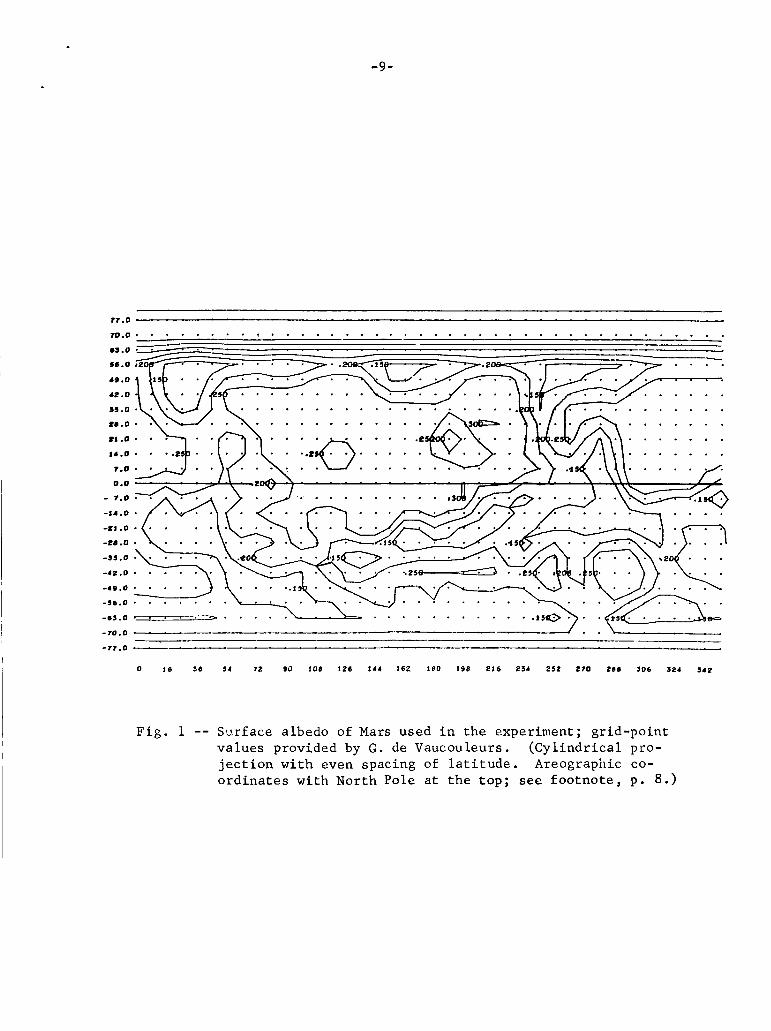
where A i s t h e albedo of t h e ground. The a lbedo v a l u e s used i n t h i s
experiment, and shown i n F i g . 1, were prepared f o r us by D r . Gerard
de Vaucouleurs,
* **
based on h i s s tudy (1964). I n t h i s e q u a t i o n , t h e h e a t
* The coordinates were i n a d v e r t e n t l y used w i t h l o n g i t u d e i n c r e a s i n g
The e f f e c t of t h i s w a s counterclockwise a s viewed from t h e North Po le . t h a t t h e sun ' s l o n g i t u d i n a l motion re la t ive t o a lbedo f e a t u r e s was t h e r e v e r s e of i t s a c t u a l motion.
Jrk Personal comnunication.
-9-
17.0 - 70.0
6 3 . 0
5 6 . 0
49.0
42.0
35.0
t 6 . 0
ti .o 14.0
7.0
0.0
- 7.0
-14.0
-?l .o -ea. a
4 5 . 0
-42.0
-49 .0
-56 .0
-61.0
-70 .0
-77 .0
F i g . 1 -- Surface albedo of Mars used i n t h e experiment; g r id-poin t va lues provided by G . de Vaucouleurs. (Cy l ind r i ca l pro- j e c t i o n wi th even spacing of l a t i t u d e . Areographic co- o r d i n a t e s wi th North Pole a t t h e t o p ; s e e foo tno te , p . 8 . )

-10-
balance components a t t h e air-ground i n t e r f a c e a r e t h e downward f l u x
of s o l a r r a d i a t i o n , SG; t h e n e t upward f l u x of i n f r a r e d r a d i a t i o n , FG; t h e upward convect ive h e a t f l u x from t h e ground t o t h e a i r , CG; con-
duc t ion of hea t downward i n t o t h e s o i l , DG; and l a t e n t h e a t r e l e a s e
a t the s u r f a c e , L .
subl imat ion (L < 0 ) .
The l a t t e r i s due t o C 0 2 condensat ion (L > 01, o r
When t h e r e i s no s o l i d CO on t h e s u r f a c e , and no condensat ion o r 2 subl imat ion of CO t h e s u r f a c e temperature change i s determined by t h e
s o i l heat f l u x , D Leovy (1966) has shown t h a t when t h e major p a r t of
t h e s u r f a c e temperature v a r i a t i o n i s p e r i o d i c wi th a known p e r i o d , a s
i s the case f o r Mars, t hen DG can be expressed w i t h s a t i s f a c t o r y accuracy
i n terms of t h e s u r f a c e temperature and i t s t i m e d e r i v a t i v e ,
2'
G '
DG M p s s c & , W / ~ ) ~ ' ~ [ O . S ( T , - T,) -+ 1.2 w - l @ T G / a t ) l ,
where p s , c s , and k f u s i v i t y of t h e s o i l , and w i s t h e predominant frequency i n t h e temper-
a t u r e v a r i a t i o n ; i n t h i s c a s e , w i s t h e d i u r n a l frequency.
temperature a t g r e a t depth i n t h e s o i l .
allowed t o a d j u s t t o T with a time c o n s t a n t of 5 days. The parameter
are t h e d e n s i t y , s p e c i f i c h e a t , and thermal d i f - S
Ta i s a
I n our model, T, i s a r b i t r a r i l y
G 'j2) i s assumed t o be t h e same f o r t h e e n t i r e p l a n e t and h a s (PsCsks
been evaluated from t h e d i u r n a l s u r f a c e temperature wave given by
S in ton and Strong (1960). The va lue we use i s 8 X 10 e r g s cm K
s e c . 4 -2 0 -1
-1
The mass of CO condensed on t h e s u r f a c e i s accounted f o r i n t h e 2 c a l c u l a t i o n .
t h e condensation temperature (143.6 K ) , o r when any condensed C 0 2 i s
already p resen t on t h e s u r f a c e , w e l e t (aT / a t ) = 0 , so t h a t t h e s u r -
f a c e temperature remains f i x e d a t 143.6'K; t h i s enab le s L and t h e co r -
responding r a t e of mass t r ans fo rma t ion a t t h e s u r f a c e t o be computed
a s the r e s i d u a l of t h e terms i n t h e s u r f a c e h e a t balance equa t ion . The
mass t ransformation i s r e f l e c t e d i n t h e dynamics by al lowing a c o r r e -
sponding mass f l u x through t h e s u r f a c e .
determines t h e va lue of 6 a t U = 1.
t h e albedo t a k e s on t h e v a l u e 0.6.
Whenever t h e s u r f a c e temperature s t a r t s t o f a l l below 0
G
I n o t h e r words, t h e va lue of L
When s o l i d c02 is on t h e s u r f a c e ,

-11-
P o t e n t i a l energy produced by the h e a t i n g func t ions i s converted
The k i n e t i c energy i s d i s s i p a t e d by t h e model i n t o k i n e t i c energy.
i n t h e model i n four ways: by f r i c t i o n a t t h e ground, by v e r t i c a l
shea r stresses by la te ra l d i f f u s i o n , and by the t i m e d i f f e r e n c i n g
scheme . I n the e a r t h ' s atmosphere, a t l e a s t i n middle and h igh l a t i t u d e s ,
one does n o t observe l a r g e amounts of energy i n space s c a l e s t h a t a r e
sma l l bu t s t i l l r e s o l v a b l e by the usual f i n i t e d i f f e r e n c e g r i d s . The
p h y s i c a l reason f o r t h i s i s not c l e a r . I n numerical g e n e r a l c i r c u l a t i o n
experiments , t h i s r e s u l t can be obtained by d i s s i p a t i n g t h e energy of
t h e h igh wave numbers by a l a t e r a l d i f f u s i o n term. We have done t h i s
i n t h e Mars experiment, u s ing t h e l a t e r a l d i f f u s i o n c o e f f i c i e n t A =
6 X 1 0 4 ( A s / 3 0 0 )
meters . This i s t h e d i f f u s i o n c o e f f i c i e n t va lue used by Mintz (1965)
i n h i s experiment s imula t ing the e a r t h ' s atmosphere.
4 / 3 2 m / s e c , where As i s t h e l o c a l g r i d d i s t a n c e i n k i l o -
Su r face stress, T i s accounted f o r by a drag l a w formulation, "s'
= 0.9 x f o r cD For t h e drag c o e f f i c i e n t , CD, two values are used:
s t a b l e s u r f a c e a i r (T
a i r 0, > T4).
C varies only slowly with s u r f a c e roughness when i t i s def ined i n terms
of t h e geos t roph ic s u r f a c e wind, and t h e values w e use are based on
h i s f i n d i n g s f o r moderately rough su r faces and s t a b l e and u n s t a b l e con-
d i t i o n s .
5 T ), and CD = 3.6 X f o r u n s t a b l e su r face G 4
L e t t a u (1959) found t h a t f o r t h e e a r t h ' s atmosphere,
D
Pa rame te r i za t ion of t h e momentum exchange between t h e two atmos-
p h e r i c l e v e l s i s one of t h e major u n c e r t a i n t i e s of our model. We
a r b i t r a r i l y l e t t h i s exchange be p ropor t iona l t o t h e v e c t o r d i f f e r e n c e
between t h e v e l o c i t i e s a t t h e two l e v e l s , w i th t h e p r o p o r t i o n a l i t y con-
s t a n t equa l t o 2 X 10 sec when t h e temperature d i f f e r e n c e between
t h e two l e v e l s corresponds t o stable s t r a t i f i c a t i o n , and equa l t o
4 X lom6 sec
-7 -1
-1 when t h e d i f f e r e n c e corresponds t o u n s t a b l e s t r a t i f i c a t i o n .

-12-
I V . THE NUMERICAL EXPERIMENT
The c a l c u l z t i o n w a s s t a r t e d from t h e i n i t i a l c o n d i t i o n of a r e s t i n g
The i n i t i a l ground i so the rma l atmosphere, with a temperature o f 200'K.
temperature was a l s o taken as 200'K. The subso la r po in t was i n i t i a l l y
put a t 0' longi tude and 24.8' South l a t i t u d e , corresponding t o t h e
southern hemisphere summer s o l s t i c e . The mass of s o l i d C02 on t h e
ground was assumed i n i t i a l l y t o be zero.
Some d i f f i c u l t y w a s experienced i n the v i c i n i t y of t he south pole.
A nearly zona l ly symmetric one-grid-point o s c i l l a t i o n , which damped
r ap id ly away from t h e pole , was observed. Th i s o s c i l l a t i o n e v i d e n t l y
a r o s e from a computational i n s t a b i l i t y a s s o c i a t e d wi th the s p e c i a l
t reatment of t h e po la r p o i n t s i n t h i s p a r t i c u l a r v e r s i o n of Arakawa's
f i n i t e - d i f f e r e n c e scheme. Because t h e h e a t i n g i s concen t r a t ed i n t h e
southern hemisphere, and has a very s t r o n g d i u r n a l v a r i a t i o n , an i n -
t e n s e t i d a l flow d i r e c t l y a c r o s s the pole was generated.
t h e s t a t i c s t a b i l i t y near t h i s summer pole r a p i d l y became ve ry small,
favoring t h e development of high-frequency g r a v i t y waves. The cause
of t h e computational i n s t a b i l i t y may be a n a l i a s i n g of t h e g r a v i t y
waves due t o t h e change i n t h e no r th - sou th spacing o f t he g r i d next t o
t h e pole, although o t h e r a s p e c t s of t h e f i n i t e - d i f f e r e n c e t r ea tmen t o f
t h e polar po in t may a l s o be involved.
I n a d d i t i o n ,
I n order t o c o n t r o l t h i s computat ional problem, t h e h e a t i n g f i e l d
near the south pole was smoothed i n t h r e e d i f f e r e n t ways :
1. During t h e e n t i r e experiment, t h e albedo was smoothed f o r t h e
p o l a r po in t and f o r t h e four a d j a c e n t g r i d po in t l a t i t u d e s .
This had t h e e f f e c t o f smoothing t h e s o l a r r a d i a t i o n r ece ived
a t t he ground and t h e consequent h e a t f l u x i n t o t h e atmosphere.
It a l s o e l imina ted t h e r e s i d u a l s m a l l south po la r summer ice cap
t h a t appears i n de Vaucouleursl d a t a . Th i s device slowed consid-
e r a b l y t he growth r a t e of t h e p o l a r o s c i l l a t i o n .
2. During the f i r s t 15 days (Mars days) of t h e experiment, t h e
atmospheric h e a t i n g rates Over t h e po le and over t h e fou r
ad jacen t g r i d po in t l a t i t u d e s were a l s o smoothed d i r e c t l y ,

-13-
causing a decrease i n t h e t i d a l fo rc ing near t h e pole.
technique f u r t h e r diminished t h e growth rate of t h e o s c i l l a t i o n .
From Day 12 u n t i l t he conclusion of t h e experiment on Day
24, d i r e c t smoothing of t he h e a t i n g was not used. I n s t e a d , t h e
thermal conduc t iv i ty of t h e ground a t t h e pole w a s i nc reased by
a f a c t o r of f i v e ; on the four ad jacen t g r i d po in t l a t i t u d e s , i t
was inc reased by p rogres s ive ly smaller f a c t o r s . Again t h e goal
w a s t o decrease smoothly the ra te of h e a t input t o t h e atmosphere
nea r t h e pole. This technique w a s no t as s u c c e s s f u l i n c o n t r o l -
l i n g the p o l a r o s c i l l a t i o n a s t h e d i r e c t smoothing o f t h e hea t ing .
There i s a 3-day interval--from Day 12 t o Day 15--when t h e two
techniques can be compared. Although t h e problem reg ion i n t h e
v i c i n i t y o f t h e south pole behaved very d i f f e r e n t l y i n t h e two
cases, t h e c l o s e s imi la r i ty of t h e flow everywhere e l s e suppor t s
our b e l i e f t h a t t h i s computational d i f f i c u l t y d i d no t s i g n i f i -
c a n t l y i n f h e n c e t h e r e s u l t s except i n t h e immediate v i c i n i t y
of t h e south pole.
Th i s
3.
F igu re 2 i l l u s t r a t e s the growth o f t h e energy during t h e experiment.
The "mean t o t a l k i n e t i c energy'' i s de f ined by
where M i s t h e t o t a l mass of t h e troposphere and a i s t h e r a d i u s of
Mars. The "mean zonal k i n e t i c energy" i s
where t h e b a r o p e r a t o r i s def ined by
and
-14-
I I I I I I I I I D
Time after start (days)
N s E
e - 2.
c u 0
C Y
.- c
.-
0 I I I I I I I 1 1 I 1 12 13 14 15 16 17 18 19 20 21 22 23 24
Time after start (days)
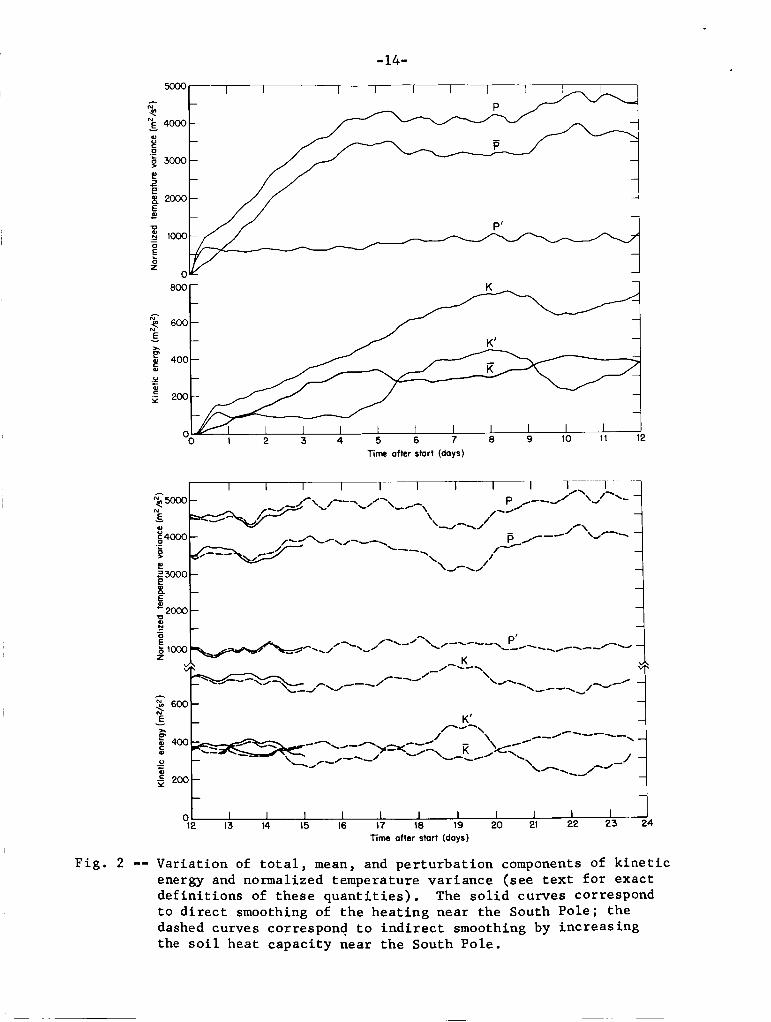
F i g . 2 -- Variation of total, mean, and perturbation components of kinetic energy and normalized temperature variance (see text for exact definitions of these quantities). The solid curves correspond to direct smoothing of the heating near the South Pole; the dashed curves correspond to indirect smoothing by increasing the soil heat capacity near the South Pole.

-15-
The "mean p e r t u r b a t i o n k i n e t i c energy" i s
The i n t e g r a t i o n s are over l a t i t u d e , cp, and longi tude, A.
S i m i l a r l y , w e show t h e va r i ance of t h e temperature from i t s h o r i -
z o n t a l m e a n , normalized so as t o y i e l d a n approximation t o t h e average
a v a i l a b l e p o t e n t i a l energy per u n i t mass.
The "normalized t o t a l temperature var iance" i s
where
H = R/c
'hormalized zona l temperature variance' ' i s
and !? i s t h e g l o b a l mean temperature f o r t h e l e v e l . The P J
The "normalized p e r t u r b a t i o n temperature var iance" i s
The lower t h r e e curves i n Fig. 2 show, r e s p e c t i v e l y , t h e mean t o t a l - k i n e t i c energy, K ; t h e mean zonal k i n e t i c energy, K ; and t h e mean p e r t u r -
b a t i o n k i n e t i c energy, K'. r e s p e c t i v e l y , P, P, and P ' .
The upper t h r e e curves i n t h e f i g u r e show, - The ove r l ap of t h e curves, from Day 12 t o Day 15, i l l u s t r a t e s t h e
e f f e c t on t h e e n e r g i e s of t h e two techniques used f o r c o n t r o l l i n g t h e
s o u t h p o l a r i n s t a b i l i t y .

-16-
I n i t i a l l y t h e r e i s a r a p i d growth of t h e temperature va r i ances and
t h e k i n e t i c ene rg ie s .
thermally d r iven d i u r n a l t i d e .
du r ing t h e f i r s t day.
f i r s t 4 days i s e n t i r e l y due t o t h i s t i d e and i t s h ighe r harmonics.
During t h e f i r s t 4 days t h e r e i s n e a r l y l i n e a r growth i n both P and K.
Between Days 4 and 7 , t h e r e i s a r a p i d growth i n K ' and a l e v e l i n g o f f ,
o r s l i g h t decrease, i n P. Th i s suggests t h a t t h e d i s tu rbances respon-
s i b l e for t h e inc rease i n k i n e t i c energy are t r a n s p o r t i n g h e a t toward
t h e winter pole and reducing t h e mer id iona l temperature g r a d i e n t .
energy curves f u r t h e r suggest t h a t some kind of s t a t i s t i c a l equ i l ib r ium
has been reached by Day 7. s t eady s ta te , bu t , l i k e t h e e a r t h ' s atmosphere, i s s u b j e c t t o f l u c t u a -
t i o n s between zonal and p e r t u r b a t i o n k i n e t i c energy as w e l l as t o
f l u c t u a t i o n s of t h e t o t a l k i n e t i c energy. I n s p e c t i o n o f t h e curves
shows t h a t the t o t a l and the p e r t u r b a t i o n k i n e t i c e n e r g i e s have a s t r o n g
p o s i t i v e c o r r e l a t i o n , bu t t h a t t h e r e i s a n e g a t i v e c o r r e l a t i o n between
P and K, on t h e one hand, and K' on t h e o t h e r .
pe r iod i n t h e energy f l u c t u a t i o n s .
These are a s s o c i a t e d wi th t h e d i u r n a l h e a t i n g and
The maximum i n t e n s i t y of t h e t i d e occurs
The mean p e r t u r b a t i o n k i n e t i c energy du r ing t h e
- -
-
The
The equ i l ib r ium i s not c h a r a c t e r i z e d by a
- There i s a marked 6-day
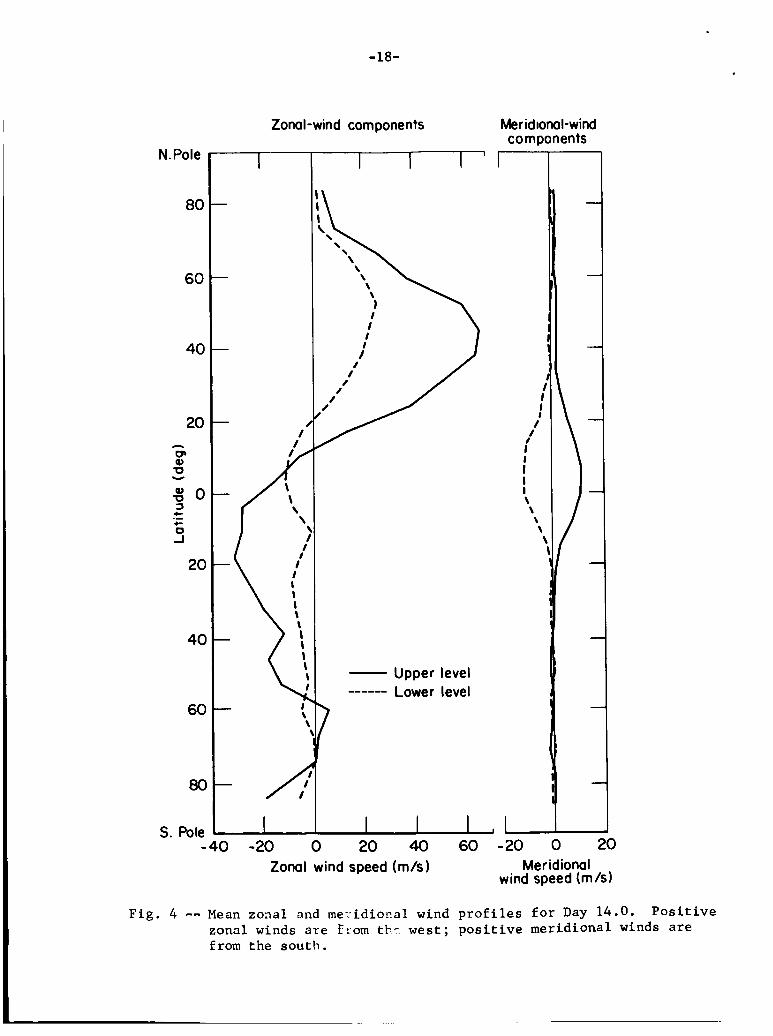
P r o f i l e s of zonal ly averaged wind are shown i n Figs . 3 and 4 , f o r
both the meridional and zonal components. There i s a ve ry i n t e n s e
thermally d i r e c t mer id iona l c i r c u l a t i o n i n low l a t i t u d e s , w i t h r i s i n g
motion i n t h e southern hemisphere s u b t r o p i c s and descending motion i n
t h e northern hemisphere.
a t t he upper l e v e l s i n m i d - l a t i t u d e s of t h e w i n t e r hemisphere, w i th
weaker e a s t e r l y winds i n t h e summer hemisphere.
c h a r a c t e r of t he p r o f i l e s a t high sou the rn l a t i t u d e s i s i n p a r t , a t
least , a consequence of t h e computational i n s t a b i l i t y d i scussed above.
Figure 3 , f o r Day 10 of t h e experiment, corresponds t o t h e phase of
t h e energy f l u c t u a t i o n cyc le a t which t h e mean zona l k i n e t i c energy i s
a r e l a t i v e maximum, wh i l e Day 14 corresponds t o a r e l a t i v e minimum i n
mean zonal k i n e t i c energy. On Day 10, when t h e e d d i e s are r e l a t i v e l y
weak, the w e s t e r l y j e t i s i n t e n s e wi th s t r o n g l a t e ra l s h e a r ; on Day 14,
the eddies a r e r e l a t i v e l y s t r o n g and t h e j e t i s weaker and broader .
The zonal winds have an i n t e n s e w e s t e r l y j e t
The r a t h e r no i sy

-17-
N. Pole
80
60
40
20 - c3, W U Y
s o 3
O 1
4-
.I-
.-
20
40
60
80
S. Pole
Zonal -w i nd corn ponen ts
I I I
Upper level Lower level -----
Meridional-wind components
-40 -20 0 20 40 60 80 -20 0 20
wind speed (m/s) Zonal wind speed (m/s) Meridional
Fig. 3 -- Mean zonal and meridional wind profiles for Day 10. Positive zonal winds are from the west; positive meridional winds are frox the south.
N. Pol
80
60
40
20 A
c1, al U Y
$ 0 3
0 J
c c .-
20
40
60
8c
S. Pole
-18-
Zonal -wind com ponen ts Meridional-wind components
/ ' /
- A
Fig. 4
- 40
-- Mean zonal from
4 I I I
/ I
/
I I I I \ \ \ \ \
Upper level ------ Lower level
-20 0 Zonal wind
zonal and me winds are f: the south.
20 40 speed h / s )
7.0 id i o n a 1 wind ::om tb- west;
60 -20 O 20 Meridional
wind speed (rnls)
profiles for Day 14.0. positive meridional wi
Positive .nds are

-19-
This characteristic behavior is typical of the same phases during other cycles of the energy fluctuation.
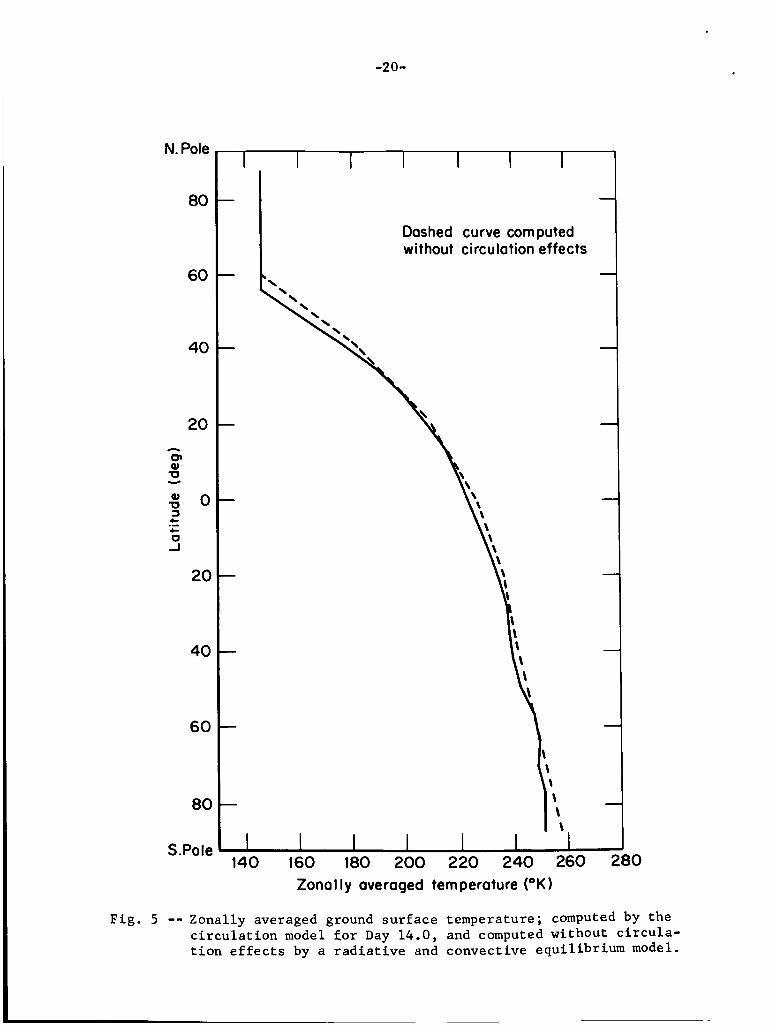
Figures 5 and 6 show meridional profiles of zonally averaged
ground and atmospheric temperatures for Day 14.
days, subsequent to the intial transient phase of the experiment, are very similar. The temperature profiles computed in this experiment
can be compared with similar profiles that were computed without any
circulation effects (Leovy, 1966). The ground surface temperature is
seen to be almost uninfluenced by the circulation; this is to be ex-
pected in view of the very small mass of the atmosphere and its corre-
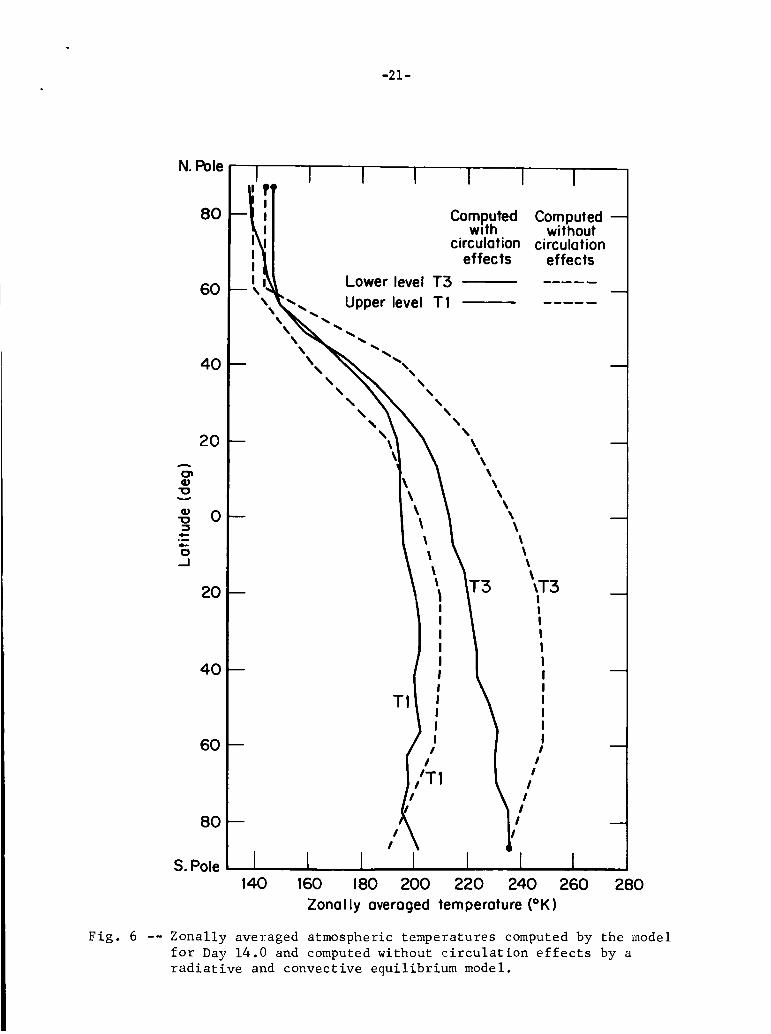
spondingly poor ability to transport heat. On the other hand, the
atmospheric temperatures are noticeably modified by the circulation.
The lapse rate in tropical latitudes is reduced by the circulation
from nearly adiabatic (which is approximately 5O/km, or 45' between
the two levels) to less than half that value. In middle latitudes of the winter hemisphere, the lapse rate is reduced by the circulation from about two-thirds of the adiabatic rate to a nearly isothermal con-
dit ion.
Profiles for other
The circulation reduces the meridional temperature gradients in
the atmosphere, especially in the tropics of both hemispheres. No direct comparison can be made to show the effect of the circulation
on the temperatures of the atmosphere over the polar cap because, in
the calculation without circulation (Leovy, 1966), the atmospheric
temperatures were not allowed to fall below the CO frost point, where- 2 as in the circulation experiment no such constraint is put on the atmo-
spheric temperatures.
2 ice cap (shown by the flat portion of the ground temperature curve in
high winter latitudes). This ice cap begins to form during the second
day of the experiment and its area is stabilized by the sixth day. Its
width is close to the maximum width of the observed Mars ice cap
(Slipher, 1962) and is essentially the same as that computed without
an atmospheric calculation (Leovy, 1966). In the current experiment, the atmospheric temperatures at the two levels over the ice cap remain
near (but are never very much below) the C02 vapor pressure equilibrium temperatures, despite the face that radiation cools the air.
because of the compensating warming produced by the circulation.
One of the most interesting features is the development of a CO
This is
-20-
N. Pole
80
60
40
20 A
0, Q) 0 Y
$ 0 3
0 -I
c c .-
20
40
60
80
S.Pole
Fig. 5 -- Zonally averaged ground surface temperature; computed by the circulation model for Day 14.0, and computed without circula- tion effects by a radiative and convective equilibrium model.
-21-
I
N. Fble
80
60
40
20 A
Q, Q) U Y
s o 3
0 1
c c .-
20
40
60
80
S. Pole I I
\ \ \ I
T1 \,T I / I
I /
I /
\ \T3 lT3 . I
I I I : I I I I I I I I I I
I I I
I \ I 140 160 180 200 220 240 260 280
Zonally averaged temperature ( O K )
Fig. 6 -- Zonally averaged atmospheric temperatures computed by the model for Day 14.0 and computed without circulation effects by a radiative and convective equilibrium model.
-22-
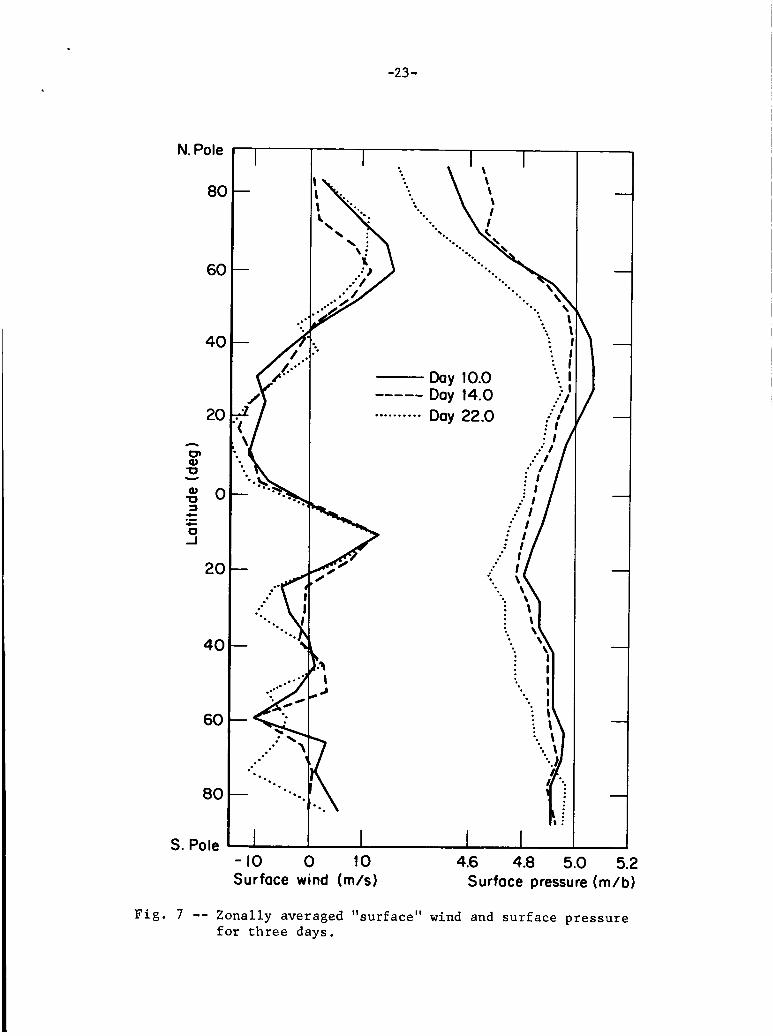
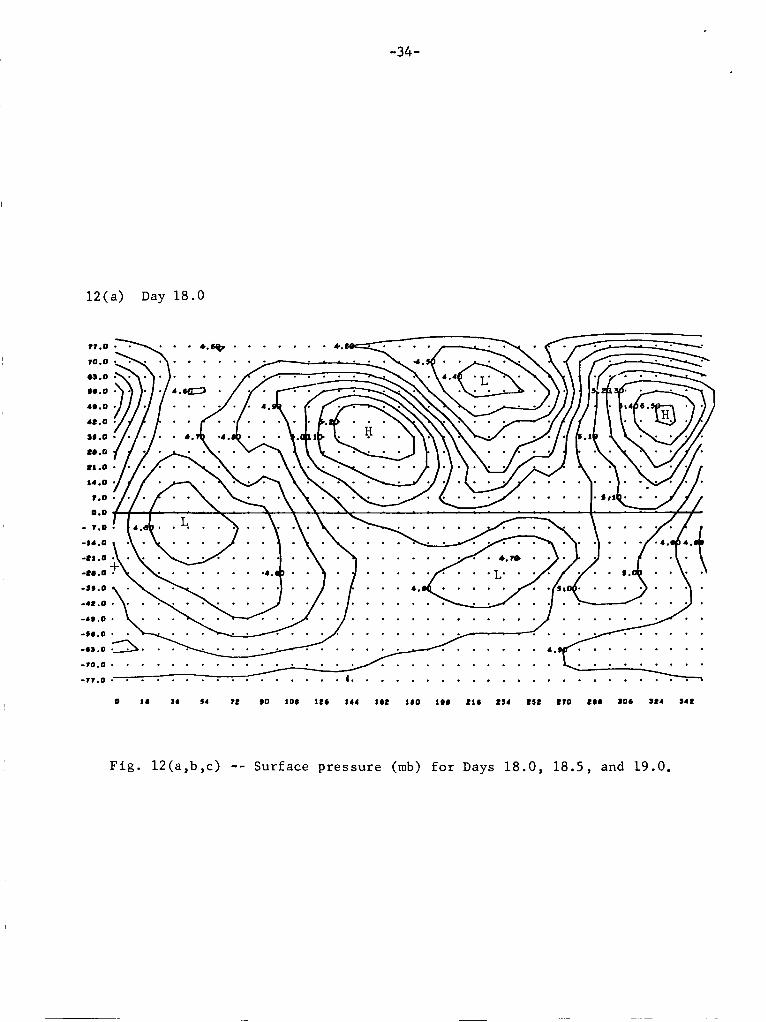
P r o f i l e s of s u r f a c e p r e s s u r e and s u r f a c e wind are shown, i n Fig.
7 , f o r Days 10, 14, and 22. They show a p res su re minimum nea r t h e
subsolar l a t i t u d e , a b e l t of h igh p res su re centered nea r 35'N, and a
p o l a r low.
t h e r e i s a marked tendency toward geostrophy. The most prominent
f e a t u r e s a r e t h e w e s t e r l i e s i n t h e h ighe r l a t i t u d e s of t h e w i n t e r
hemisphere; t h e easter l ies i n t h e lower l a t i t u d e s of t h e w i n t e r hemi-
sphe re ; t h e narrow b e l t of westerlies near t h e equator i n t h e summer
hemisphere, produced by t h e eastward r ecu rv ing of t h e flow a c r o s s t h e
equa to r ; and t h e predominantly e a s t e r l y flow over most of t h e sumner
hemisphere.
densat ion i n t h e w i n t e r i c e cap i s c l e a r l y shown i n t h e r i g h t h a l f o f
Fig. 7. Formation of t h e i c e cap produces an average drop of 0.01 mb
p e r day i n t h e g l o b a l mean s u r f a c e p re s su re .
Su r face mean zona l winds a r e not e x a c t l y geos t roph ic , bu t
The s u r f a c e p r e s s u r e drop produced by carbon d iox ide con-
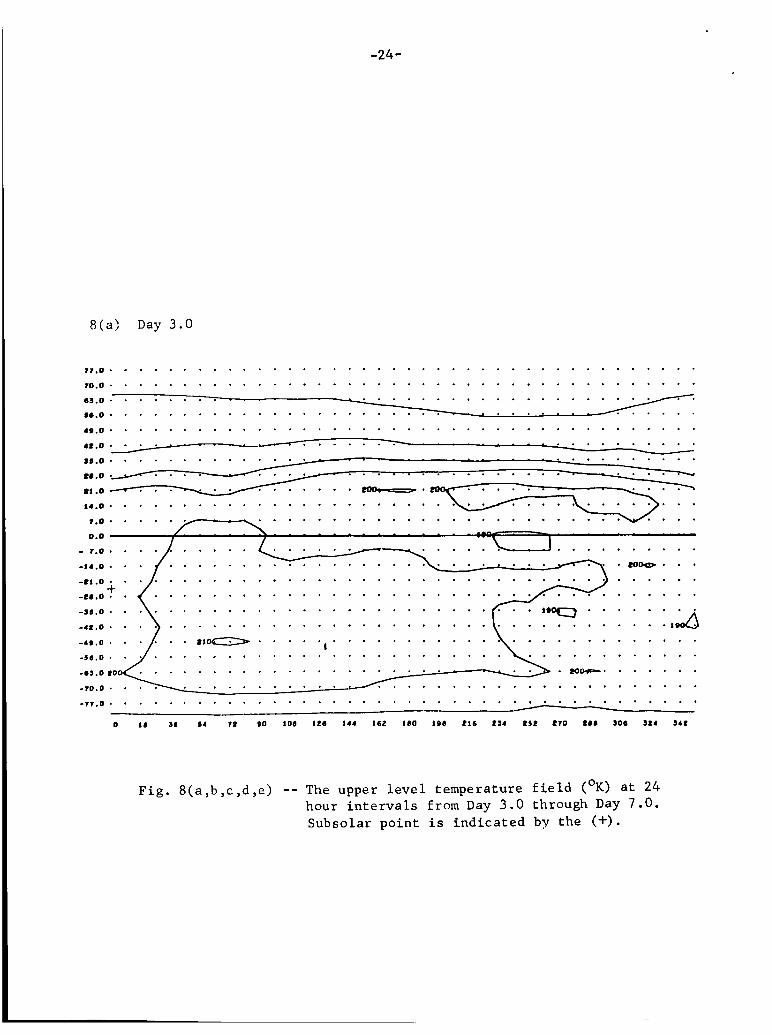
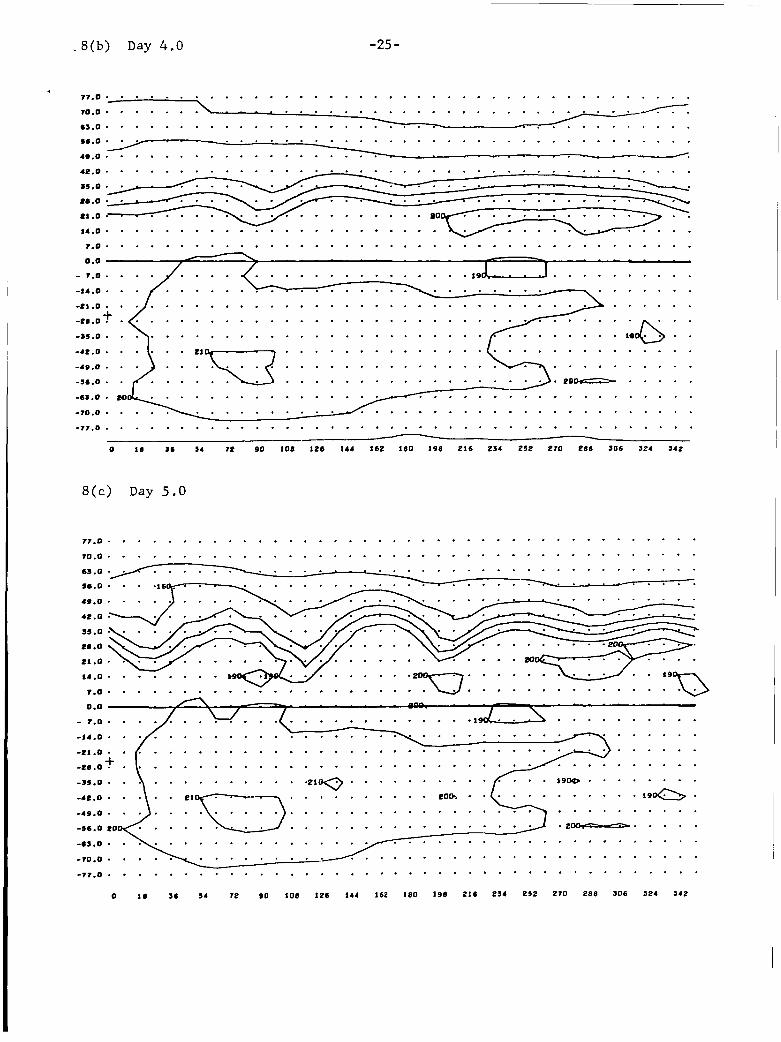
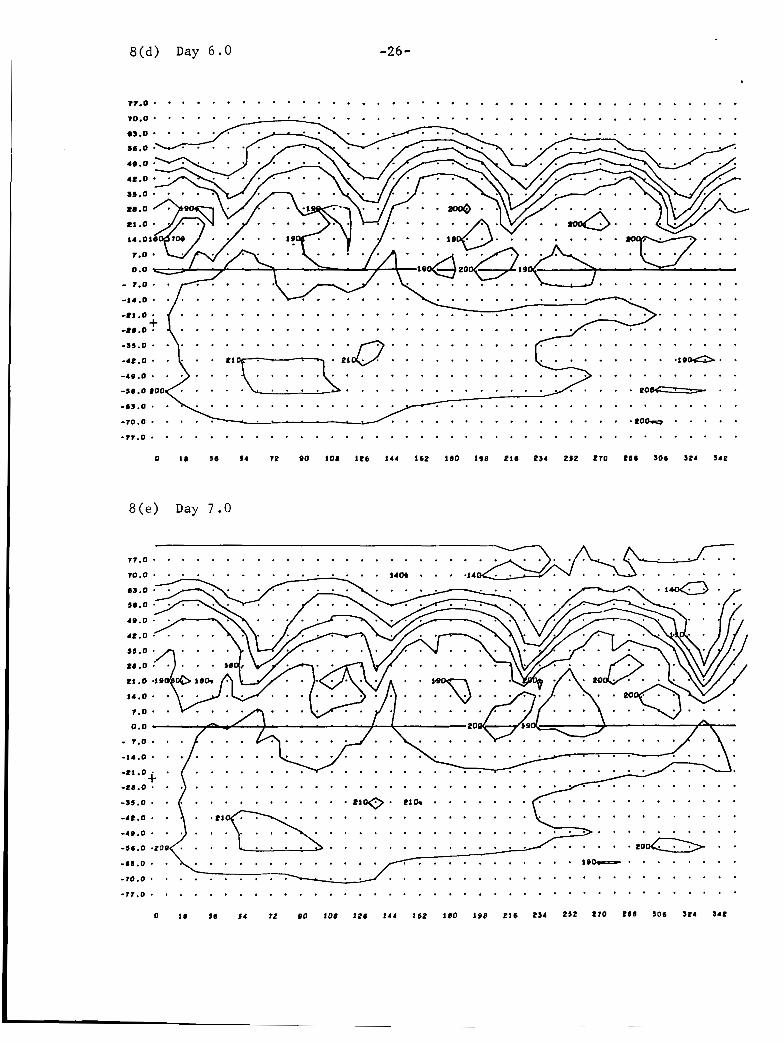
The kind of d i s t u r b a n c e s t h a t begin t o dominate i n t h e p e r -
t u r b a t i o n p a r t of t h e temperature v a r i a n c e , and t h e p e r t u r b a t i o n
k i n e t i c energy a f t e r t h e f o u r t h day of t h e experiment may b e s t
be seen i n t h e upper l e v e l temperature f i e l d . F igu re 8(a-e) shows
t h e development of d i s tu rbances i n t h e t r a n s i t i o n t o a wave regime
i n t h e winter hemisphere. The maps, a t 24-hour i n t e r v a l s s t a r t i n g
wi th Day 3, show the beginning of a wave formation i n t h e r e g i o n of
maximum temperature g r a d i e n t nea r areographic longi tude 60'. Eventual ly
four waves appear , w i th i n i t i a l growth r a t e s such t h a t t h e ampli tude
appears t o a t least double i n one day. I n t h e ear ly s t a g e s , t h e waves
move eastward wi th phase speeds from 15 t o 30 m e t e r s / s e c ; as they
reach the mature s t a g e , however, they t end t o s t a g n a t e and, i n some
c a s e s , t o r e t rog rade . A t later s t a g e s of t he experiment, wave number
t h r e e becomes t h e most prominent, and t h e r e i s a more confused S t a t e
of developing s h o r t waves moving i n t o and r e i n f o r c i n g s t a t i o n a r y
mature troughs.
Figure 9(a-c) , f o r Days 18.0, 18.5, and 19.0, i l l u s t r a t e s t h e
mature s t age o f t h e waves.
upper l e v e l temperature.
broad summer hemisphere w a r m b e l t i n 1 2 hours .
It a l s o shows t h e d i u r n a l v a r i a t i o n i n t h e
T h i s i s most marked i n t h e 180' s h i f t o f t h e
F igu re lO(a-c) shows
-23-
N. Pole
8C
6C
4c
2c h
e Q) U Y
* c 3
0 J
c c .-
2c
40
60
80
S. Pole
. . I t I 2. I Day 10.0
Day 14.0 .../ Day 22.0
: I ----- ...I
I I * I . . . . . . . . . .
4.6 4.8 5.0 5.2 Surface pressure (m/b)
- IO 0 10 Surface wind (m/s)
F i g . 7 -- Zonal ly averaged "surface" wind and s u r f a c e p r e s s u r e f o r t h r e e days.
-24-
8 ( a ) Day 3.0
. . . . . . . . . . . . . . . . . . . . . . . . . . . . . . . . . . . . . . . . . . . . 70.0 . . . . . . . . . . . . . . . . . . . . . . . . . . . . . . . . . . . . . . . . 6 1 . 0 ’ . . . . . . . . . . . . . . . . . I 6 . 0 . . . . . . . . . . . . . . . . . . . . . . . .. . . . . . . . . A L . 0 - - - . - +
. . . . m.0 -/
) A . O . . . . . . . . .
I . . . . . . . . . . . . . . . . . . . . -7- - - -’ . . . . . . . . . . . . . . . . . . . . El- . , . . . . . .
. . . . . . . . .
. . . . . . . . .
. . . . . . . . . . . . . . . . . . . . . . . . . . . . . . . . .
I . . . . . . . . . . . . . . . . .
. . . . . . . . . . . . . e<: : : : : :
. . . . . . . . . . a,-. . . . . .
. . . . . . . . . . . . . .
. . . . . . . . . . . . . . . . . . . .
. . . . . . . . . . . . . . . . . .
. . . . . m - . . . . . . . . . . . . . . . . . . . . . . . . . . . . . . . . . . . . . . . .
- ~ ~ ~ 0 . . . . . . . . . . . . . . . . . . . . . . . . . . . . . . . . . . . . . . . . / -
o 11 36 14 72 so IOI i t a 144 162 180 i s 8 ti6 r14 r s t t 7 0 218 106 324 14r
Fig . 8 ( a , b , c , d , e ) -- The upper l e v e l temperature f i e l d (OK) a t 24 hour i n t e r v a l s from Day 3.0 through Day 7.0. Subsolar po in t i s i n d i c a t e d by t h e (+).
. 8 (b ) Day 4.0 -25 -
7 7 . 0 . . . . . . . . . . . . . . . . . . . . . . . . . . . . . . . . . . . . . . . .
70.0 . . . . . . . . . . . . . . . . . . . 63.0. . . . . . /. . . . . . . . . . . .
p . . . . . . . . . . . . . . . . . . . . . . . . . . . . . . . 4s .0 . . . . . . . . . . . . . . . . - . r'
4 p . o . . . . . . . . . . . . . . . . . . . . . . . . . . . . . . . . . . . . . . . .
0.0
- 7 . 0 . . . . . . . . . . . . . . . . . . -14.0 * - . . . . . . .
. . . . . . . . . . . . . . . . . . . . . . 1::::- :{. . . . . . . . . . . . . . . . . . . . . . . -11.0. . . . . . . . . . . . . . . . . . . . . . . . . * - * 1 9
-42.0. . .j : : ;'cyr2. . . . . . . . . . . . . . & . . . . . . . . . . -49.0 . . . . . . . . . . . . . . . . . . . . . . . . . . .
. . . . . . . . . . . . . . . . . . . . . . . . . .
. . . . . . . . . . . . . . . . . . . . . . . . . . -63.0 w )
. . . . . . . . . . . . . . . . . . . . . . . . . . . . . . . . -77. 0 . . . . . . . . . . . . . . . . . . . . . . . . . . . . . . . . . . . . . . . . -
0 I 8 36 54 7O 90 108 126 144 162 180 198 216 234 252 270 286 306 324 342
8(c) Day 5.0
7 1 . 0 . " . . . . . . . . . . . . . . . . . . . . . . . . . . . . . . . . . . . . . 7 0 . 0 . . . . . . . . . , . . . . . . . . . . . . . . . . . . . . . . . . . . . . . .
7 . 0 . . . . . . . . . . . . . . . . . . . . . "m. . . . . . . . . . . . . . . . . . . . . . . .
. . . . . . . . . .
.z-. . . . .
- 7 7 . ~ . . . . . . . . . . . . . . . . . . . . . . . . . . . . . . . . . . . . . . . . O 16 36 54 TO 90 108 126 144 162 180 198 216 234 252 270 288 306 I24 342
8(d ) Day 6.0 -26-
7 7 . 0 " ' . . . . . . . . . . . . . . . . . . . . . . . . . . . . . . . . . . . . . . . . . . . . . . . . . . . . . . . . . . . . . . . . . . . . . . . . . .
. . . . . - 7.0
. ~ ~ * ~ . . . . . . . . . . . . . . . . . . . . . . . . . . . . . . . . . " . . . . . 0 18 3 6 5 4 72 SO 108 126 144 162 160 198 216 214 252 270 L O 6 306 1 2 4 3 4 9
8(e) Day 7.0
. . . . . . .
. . . .
. . . . . . . . . . - 7 . 0 . *
. . . . . . . . . . . . . . . . . . . . . . . . - 7 7 . 0 . . . . . . . . . . . . . . . . . . . . . . . . . . . . . ' . ' ' ' . ' . ' ' '
o 18 I6 54 T Z 90 108 I26 1 4 4 162 100 198 P I 6 234 2 s t w o 008 a06 324 1 4 2

-27 -
9(a) Day 18.0
. . . . . . 14.0 - - - - ,*a . . . . .
. . . . . . . .
. . . . . . . . -42.0
. . . . . . . . . . . . .
. . . . . . . . . . . . . . . . . . . . . . 0 18 36 54 72 90 100 126 144 162 100 190 216 234 252 270 208 106 124 342
F i g . 9 ( a , b , c ) -- Upper l e v e l temperature f i e l d (OK) a t 12 hour i n t e r v a l s f o r Days 18.0, 18.5, 19.0. Subsolar po in t i s ind ica ted by t h e (+).

9 ( b ) Day 18.5 -28-
9(c) Day 19.0

-29-
10(a ) Day 18.0
F i g . l O ( a , b , c ) -- Upper l e v e l wind f i e l d a t 1 2 hour i n t e r v a l s f o r Days 18.0, 18.5, and 19.0. The winds blow i n t h e d i r e c t i o n toward t h e do t s and t h e magnitudes a r e s c a l e d according t o the s t r o n g e s t wind on the map which i s 146.2 m/s i n ( a ) , 162.4 m / s i n (b) , and 144.1 m / s i n ( c ) .
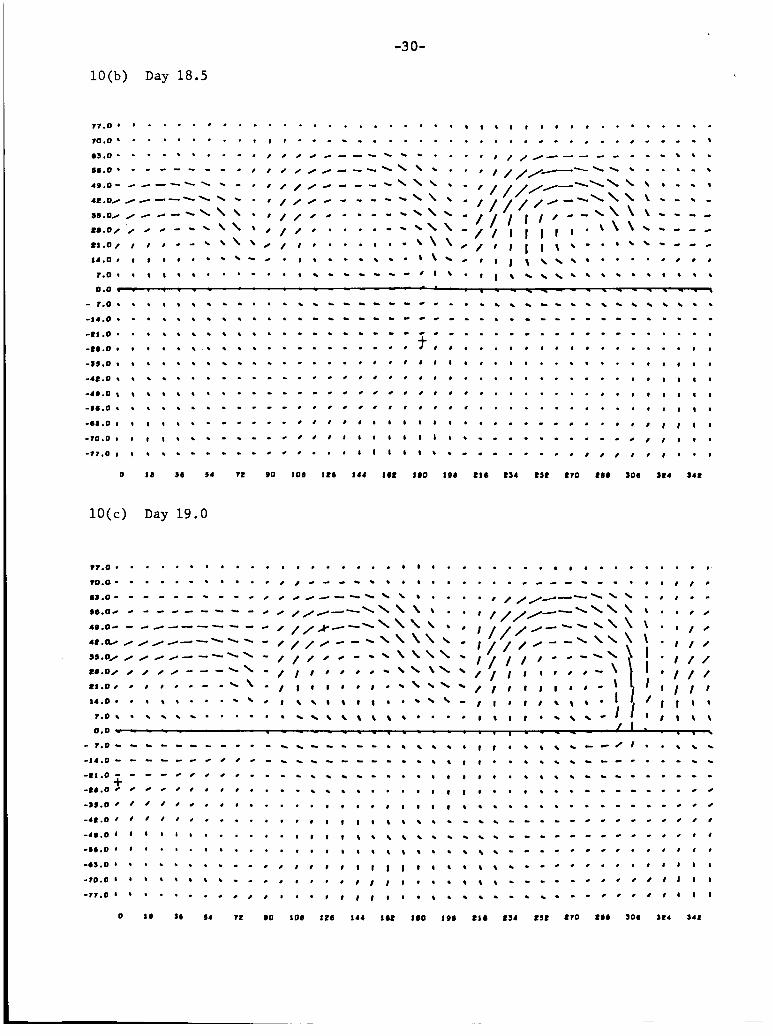
-30-
10(b) Day 18.5
lO(c) Day 19.0
7 7 . ~ . . . . . . ' . . . . , , . . . . . . 1 . . . . . . . . . . . . . . . . . . . . .

-3 1-
t h e corresponding upper l e v e l wind vec to r s .
t h e r e i s c l o s e correspondence between t h e upper l e v e l wind and t h e
temperature p a t t e r n s . The 5ummer hemisphere, however, i s dominated
by t h e d i u r n a l t ide--with an almost p e r f e c t r e v e r s a l of t h e winds i n
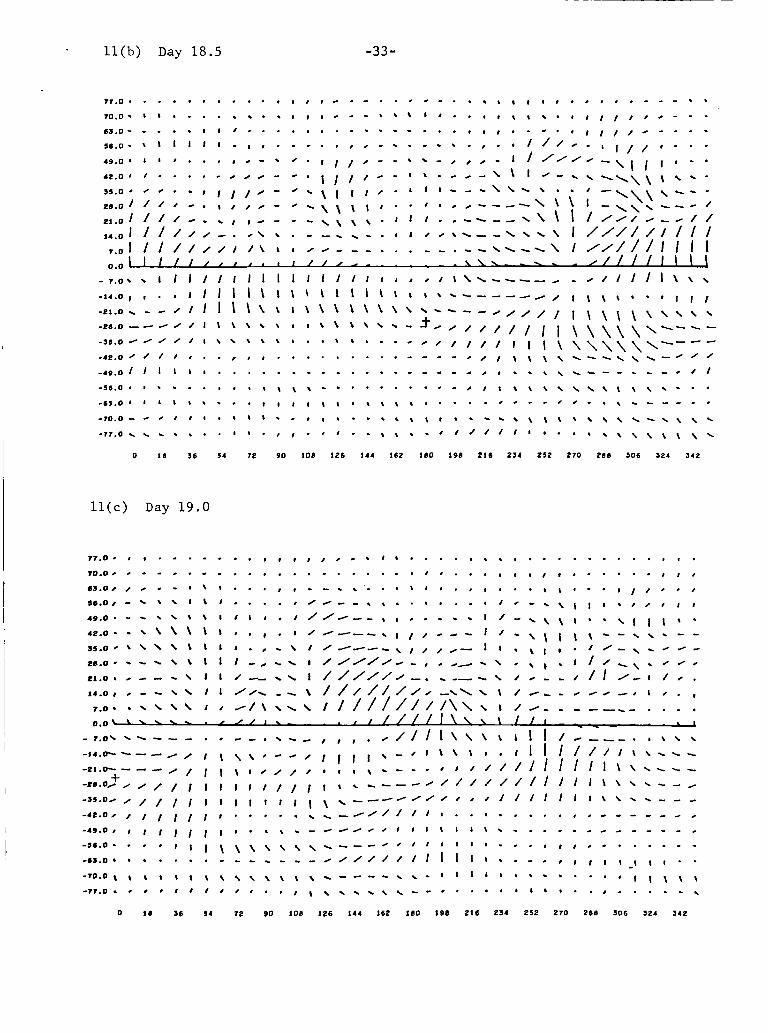
1 2 hours. The "surface" wind and t h e s u r f a c e p r e s s u r e are shown f o r
t h e same t h r e e t i m e s i n F igs . l l ( a - c ) and 12(a-c) . The "surface" winds a r e
t h e winds e x t r a p o l a t e d downward from 0 = 1 /4 and 0 = 314 and should r ep re -
s e n t winds near t he t o p of a boundary l aye r . According t o d a t a given
by L e t t a u (1959), t h e s e winds should be about twice as s t r o n g as winds
2 meters above t h e su r face . Both the s u r f a c e wind and t h e s u r f a c e
p r e s s u r e are dominated by t h e d i u r n a l t i d e .
s u r f a c e wind, and t h e l a r g e amplitude of t he s u r f a c e p r e s s u r e o s c i l l a t i o n
(* 0.35 mb), a r e probably s e n s i t i v e t o t h e r a t e of convect ive h e a t ex-
change between ground t o atmosphere. As d i scussed i n t h e previous
s e c t i o n , t h i s ra te of h e a t t r a n s f e r i s l a r g e compared wi th t e r r e s t r i a l
expe r i ence , and w e t h e r e f o r e suspect t h a t t h e i n t e n s i t y of t h e computed
s u r f a c e winds i n t h i s experiment r ep resen t s an upper l i m i t f o r t h e
i n t e n s i t y of t h e a c t u a l l a rge - sca l e s u r f a c e winds on Mars.
I n t h e w i n t e r hemisphere,
The high v e l o c i t y of t h e
L a s t l y , F i g . 13(a-c) shows t h e ground temperature d i s t r i b u t i o n s
The l i m i t s of t h e p o l a r i c e cap (143.6'K) f o r t h e same t h r e e t i m e s .
are c l o s e to- t h e p r i n t o u t contour of TG = 150°K.

-32-
l l ( a ) Day 18.0
F ig . l l ( a , b , c ) -- "Surface" wind f i e l d f o r Days 18.0, 18.5, 19.0. Wind v e c t o r s a r e s c a l e d a g a i n s t t h e s t r o n g e s t winds of 87.5 m/s i n ( a ) , 74.3 m/s i n ( b ) , and 69.8 m/s i n ( c ) .
* l l ( b ) Day 18.5 -33-
I l ( c ) Day 19.0
-34-
12(a) Day 18.0
- 1 0 . 0 . . . . . . . . . . . . . . . . . . . . . . . . . . . . . . . - ? ? . O . . . . . . . . . . . . . . . . . . . . . . . . . . . . . . . . . L
o 10 IO 54 v t so 108 ILC 144 l o t 180 i a o t i e t 1 4 ZIL 270 LOO so6 s t 4 S ~ L
Fig. 12(a ,b ,c ) -- Surface p re s su re (mb) f o r Days 18 .0 , 18.5, and 19.0.
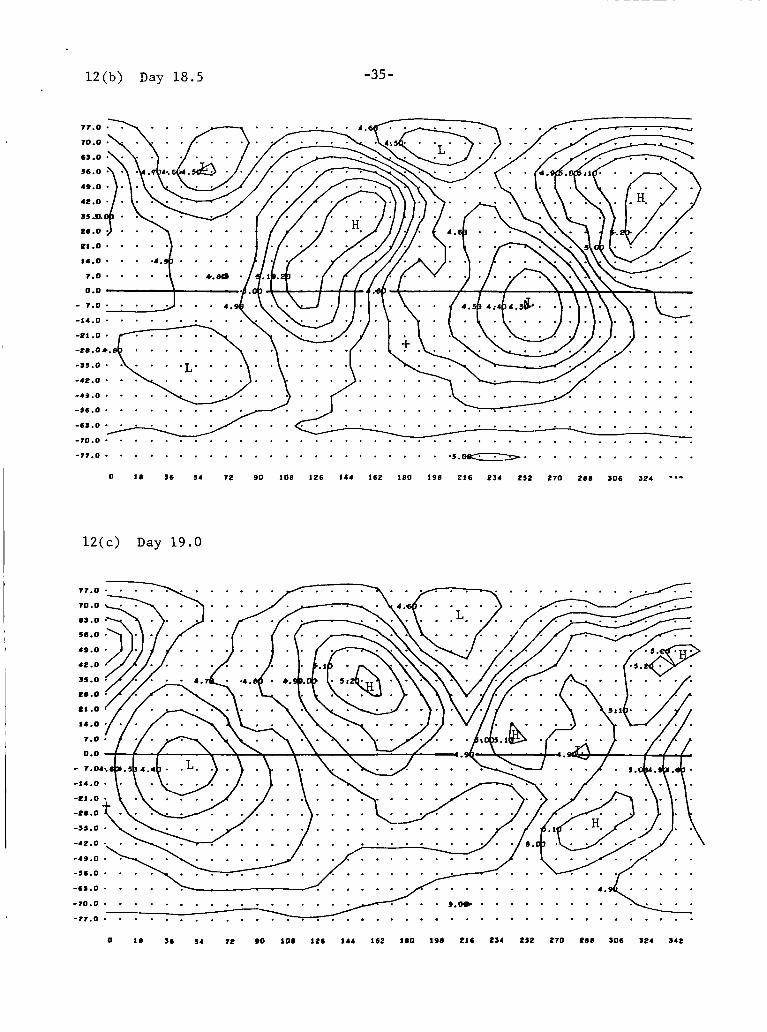
12(b ) Day 18.5 -35 -
. . . . .
. . . . . . . . . . . . . . . . . . . . . . . . . . . . . . . . . . . . . . . . -77.0. . . . . . . . . . . . . . . . . . . . . . . . . . . . . . . . . .
0 18 36 54 72 90 108 126 144 162 180 198 216 234 252 270 288 306 324 - * -
12(c) Day 19.0
. . . . . . . . .
. . . .
. . . .
. . . . . . . . . . . . . . . . . . . .
. . . .
. . . . -70.0 . . . . . . . . . . . . . . . . .,.o). . . . . . . . .
. . . . . . . . . . . . . . . . . . .

-36 -
13(a) Day 18.0
. . . . . . . . . . . . . . . . . . . . . . . . . . . . . . . . . . . . . . . . . . . .
. . . . . . . . . . . . . . . . . . . . . . . . . . . . . . . . . . . . . . . . . . . . b1.0
51.0
4s.o
4L.0
15.0
LI.0
I1 .o 14 .O
1.0
0.0
- 1.0
-14.0
4 1 . 0
-em.o -19 .0
-41 .o -49.0
-96.0
-II.O
-10.0
- 1 7 . 0
Fig. 13(a,b,c) -- Ground surface temperature (OK) for Days 18.0, 18.5, and 19.0.

13(b) Day 18.5 -37 -
70.0 . . . . . . . . . . . . . . . . . . . . . . . . . . . . . . . . . . . . . . . .
V. DISCUSSION
This s tudy i s intended t o be only a b r i e f i n t r o d u c t i o n t o t h e
behavior of t h e c u r r e n t physical-dynamical model as a p p l i e d t o t h e Mars
c i r c u l a t i o n .
Ignoring f o r t h e moment ques t ions of shortcomings i n t h e model, w e can
a s k a number of i n t e r e s t i n g ques t ions r ega rd ing t h e s e r e s u l t s . For
example, What i s t h e n a t u r e of t h e upper l e v e l waves t h a t appear i n
t h e winter hemisphere?
i n i t i a l l y , and t h e i r i n i t i a l phase speeds correspond reasonably
w e l l wi th t h e t h e o r e t i c a l speed f o r a b a r o t r o p i c Rossby wave (about
20 meters/sec t o t h e east f o r wave number t h r e e a t l a t i t u d e 45'). A t a l a t e r s t a g e i n t h e i r development, we see t h a t t he waves s t a g n a t e ,
and even r e t r o g r a d e i n a few cases . The dominant wave number, 3, which
w e see on most o f t h e maps, corresponds t o the wave of maximum growth
rate p red ic t ed by t h e l i n e a r geos t roph ic theo ry of b a r o c l i n i c i n s t a b i -
l i t y app l i ed a t l a t i t u d e 45O. But t h e s e are s u p e r f i c i a l a s p e c t s , and
the exact dynamical c h a r a c t e r of t h e s e waves must await a more complete
induc t ive and deduct ive t h e o r e t i c a l a n a l y s i s .
No d e t a i l e d a n a l y s i s of t h e r e s u l t s w i l l be given he re .
These d i s tu rbances have r a p i d growth r a t e s
The t i d a l motion produced by t h e model raises ano the r important
quest ion. It i s expected t h a t t h e ampli tude of t h e d i u r n a l t i d e ought
t o depend s t r o n g l y on t h e va lue of t h e s u r f a c e h e a t exchange parameter,
UM. t r a n s f e r over t h e Mart ian s u r f a c e and h e a t t r a n s f e r over a s h o r t g r a s s
su r face on t h e e a r t h , i t i s of i n t e r e s t t o compare t h e va lue of U used
i n t h i s study wi th t h e corresponding parameter t h a t can be de r ived from
the O ' N e i l d a t a taken under u n s t a b l e c o n d i t i o n s (Let tau and Davidson,
1957). Assuming t h a t t h e measured temperature a t 16 me te r s corresponds
t o t h e s u r f a c e a i r temperature , T4, and e x t r a p o l a t i n g measured s u b s o i l
temperatures t o t h e s u r f a c e by means of t h e measured s o i l h e a t f l u x and
thermal conduc t iv i ty , one f i n d s t h a t t h e assumption i s f a i r l y w e l l sa t is- f i e d t h a t t he h e a t f l u x i s p r o p o r t i o n a l t o t h e temperature d i f f e r e n c e ; i t
e x h i b i t s only a v e r y weak dependence on t h e f r i c t i o n v e o l o c i t y , d s
The quan t i ty Um de r ived from t h e s e d a t a i s 2 cm/sec, which i s only 1/13 Of the value used i n t h e above-described Mars experiment.
Although t h e r e i s no reason t o expect much resemblance between h e a t
M
We have

-39-
c a r r i e d out another Mars experiment, u s ing t h i s smaller va lue of V
as w e l l as the smaller va lue , 0.003, f o r t h e thermal d rag c o e f f i c i e n t
parameter iz ing t h e h e a t t r a n s f e r under s t a b l e cond i t ions . This new
experiment r an f o r 8 days, s t a r t i n g from Day 1 2 of t h e experiment des-
c r i b e d above. The d e t a i l s w i l l not be given he re , inasmuch as t h e
d i s tu rbances of t h e w i n t e r hemisphere c i r c u l a t i o n had no t y e t reached
t h e long-term ( s t a t i s t i ca l ) s teady state. A s expected, t h e d i u r n a l
t i d e was weaker than i n t h e f i r s t experiment, bu t i t was s t i l l a promi-
nent f e a t u r e on t h e maps of t h e summer hemisphere and t h e t r o p i c s .
seems l i k e l y t h a t t h e d i u r n a l t i d e i s an important f e a t u r e o f t h e a c t u a l
Mars c i r c u l a t i o n . I n a d d i t i o n t o the u s u a l s t u d i e s of atmospheric
energy t r ans fo rma t ions (see, f o r example, Smagorinsky, Manabe, and
Holloway (1966)), i t w i l l be o f some i n t e r e s t , i n t h e Mars experiments,
t o examine t h e i n t e r a c t i o n s between the t i d a l and t h e n o n t i d a l components
o f t h e flow.
M'
It
The 6-day o s c i l l a t i o n s of energy mentioned i n S e c t i o n IV may be
analogous t o t e r r e s t r i a l index cycles . Study of t h e t i m e v a r i a t i o n of
t h e energy t r ans fo rma t ions i n t h i s r e l a t i v e l y simple atmosphere would be
i n t e r e s t i n g . S i m i l a r l y , t h e c l o s e analogy between t h e zonal winds a t t h e
upper l e v e l i n t h i s Mars experiment and those observed i n t h e upper s t r a t o -
sphe re of t h e e a r t h ' s atmosphere suggests t h a t d e t a i l e d s tudy of a Mars-
t ype experiment may a i d i n understanding t h e upper s t r a t o s p h e r e .
r eg ions have s imi l a r d i s t r i b u t i o n s of h e a t i n g i n t h e north-south d i r e c t i o n .
The two
There are s e v e r a l shortcomings i n t h e phys ica l model. W e b e l i e v e
t h a t t h e most s e r i o u s of t h e s e a r e the formulation of t h e lower boundary
c o n d i t i o n s and t h e n e g l e c t o f t h e e f f e c t o f clouds and dust on t h e
r a d i a t i v e hea t ing .
W e p l a n t o r e fo rmula t e t h e treatment of t he su r face stress t o include
a boundary layer o f Elanan t y p e .
p a r a m e t e r i z a t i o n o f t h e s u r f a c e convective h e a t f l ux .
A t t h e same t i m e w e w i l l change t h e
The a i r temperatures computed i n t h e p re sen t experiment i n d i c a t e
t h a t formation of CO 2 occur . Although w e do not t h i n k t h a t t he e f f e c t s o f such clouds on t h e
c i r c u l a t i o n would be important , they could be taken i n t o account i n t h e
clouds over and near t h e p o l a r caps may occas iona l ly

-40-
model,
formation of water-ice clouds. These could form a t h i g h e r temperatures
than C02 clouds, and although they would be so tenuous t h a t t h e i r
l a t e n t h e a t e f f e c t s would not be important , they could have a s i g n i f i -
cant r a d i a t i v e e f f e c t on t h e s u r f a c e h e a t balance, e s p e c i a l l y i n w i n t e r
i n the p o l a r region.
s i b l e except ion of r a d i a t i o n from wa te r i c e c louds , t h a t would change t h e
conclusion t h a t CO condenses on t h e s u r f a c e i n the p o l a r caps.
Of g r e a t e r p o t e n t i a l s i g n i f i c a n c e i s t h e p o s s i b i l i t y o f t h e
We can t h i n k of no l i k e l y mechanism, w i t h the POS-
2 With r e spec t t o t h e computational i n s t a b i l i t y t h a t a r o s e nea r t h e
summer pole , an improved v e r s i o n of t h e f i n i t e d i f f e r e n c e scheme has
been worked out by Arakawa (1966b) and w i l l be a v a i l a b l e f o r f u t u r e
Mars experiments.
One p o s s i b l y important i t e m t h a t has been neg lec t ed i n t h e p re sen t
experiment i s t h e h e a t s t o r a g e i n t h e s m a l l summer-hemisphere i c e cap--
i f t h i s i s , i n f a c t , composed l a r g e l y of CO To p rope r ly handle t h e
seasonal h e a t s t o r a g e e f f e c t s of t h e i c e caps, one should c a r r y t h e
experiment through an e n t i r e Mart ian yea r . This would be c o s t l y i n
computer t i m e . But because of t h e l a r g e r a d i a t i v e h e a t i n g and c o o l i n g
ra tes , t h e atmospheric response t i m e i s r a p i d , which may make it p o s s i b l e
t o s imulate t h e Mars yea r adequately by a c c e l e r a t i n g t h e annual s o l a r
cyc le by a f a c t o r of 5 o r 10. We hope t o t r y t h i s i n a f u t u r e experiment.
2'
The complete f i e l d s of t he time-dependent v a r i a b l e s have been kept
on magnetic t a p e f o r every o t h e r t i m e s t e p (every 12 Mars m i n u t e s ) , and
anyone i n t e r e s t e d i n more d e t a i l e d r e s u l t s i s i n v i t e d t o communicate
wi th the au tho r s .
I
-42-
S l i p h e r , E. C. (1962): A Photographic Hi s to ry of Mars, Lowell Obser- va tory , F l a g s t a f f , Arizona (Library o f Congress Cata log No. 62-21127) , 168 pp.
Smagorinsky, J., S. Manabe, and J. L. Holloway, Jr. (1965).: "Numerical R e s u l t s from a Nine- leve l General C i r c u l a t i o n Model of t h e Atmosphere," Monthlv Weather Rev., 93, 727-768.
-41-
REFERENCES
Arakawa, . (1966a) : "Computational Design for Long-term Numerical Integration of the Equations of Fluid Motion : Two-dimensional Incompressible Flow, Part 1," J. Computational Phys., 1, 114-143.
Arakawa, A. (1966b) : "Horizontal and Vertical Differencing of the Primitive Equation Model, with CJ as the Vertical Coordinate," Technical Report, Department of Meteorology, University of California at Los Angeles (in preparation).
the Terrestrial Planets,'' Icarus, 3, 187-235. de Vaucouleurs, G. (1964) : "Geometric and Photometric Parameters of
Houghton, J. T. (1963) : "The Absorption of Solar Infrared Radiation by the Lower Stratosphere," Quart. J. Roy. Meteorol. SOC.. 89, 319-331.
II
Kaplan, L. D., G. Munch, and H. Spinrad (1964): "An Analysis of the
Kliore, A. , et al. (1965) : "Results of the First Direct Measurement
Spectrum of Mars," Astrophys. J., 139, 1-15.
of Occultation Experiment: Science, 149, 1243-1248.
Two-layer Mars Atmosphere, RM-5017-NASAY The RAND Corporation.
Coefficients in the Atmospheric Surface Layer," Advances in Geophysics, - 6, Atmospheric Diffusion and Air Pollution, 241-258. Lettau, H., and B. Davidson (1957): Exploring the Atmosphere's First Mile, Vols. I and 11, Pergamon Press, New York, 578 pp.
Matsuno, T. (1966a): "Integrations of the Primitive Equations by Simulated Backward Difference Method," J. Meteorol. SOC. Japan, Ser. 11, 44, 76-84.
Matsuno, T. (1966b) : "Scheme for Time Integrations of Oscillatory Equations with Second Order Accuracy and Sharp Cut-off for High Frequencies," ,J. Meteorol. SOC. Japan, Ser. I1 , 44, 85-88.
Mintz, Y. (1965) : Very-long-term Global Integration of the Primitive Equations of Atmospheric Motion, WMO-IUGG Symposium on Research and Development Aspects of Long-range Forecasting, Geneva, WMO Technical Note No. 66, 141-167.
for Numerical Forecasting," J. Meteorol. , 14, 184-185.
Mars' Atmosphere and Ionosphere,"
Leovy, C. (1966): Radiative Convective Equilibrium Calculations for a
Lettau, H. (1959) : "Wind Profile, Surface Stress and Atmospheric Drag
Phillips, N. A. (1957): 11 A Coordinate System Having Some Advantages
Prabhakara, C. P., and J. S . Hogan, Jr. (1965): "Ozone and Carbon - ,
Dioxide Heating- in the Martian Atmosphere,"- J. Atmospheric Sci. , 22, 97-106.
Sinton, W. M., and J. Strong (1960) : "Radiometric Observations of Mars," Astrophys. J. , 131, 459-469.