Embed Size (px)
Citation preview
RESEARCH ARTICLE Open Access
A novel tp53-associated nomogram topredict the overall survival in patients withpancreatic cancerXun Liu, Bobo Chen, Jiahui Chen and Shaolong Sun*
Abstract
Background: Gene mutations play critical roles in tumorigenesis and cancer development. Our study aimed toscreen survival-related mutations and explore a novel gene signature to predict the overall survival in pancreaticcancer.
Methods: Somatic mutation data from three cohorts were used to identify the common survival-related genemutation with Kaplan-Meier curves. RNA-sequencing data were used to explore the signature for survival prediction.First, Weighted Gene Co-expression Network Analysis was conducted to identify candidate genes. Then, the ICGC-PACA-CA cohort was applied as the training set and the TCGA-PAAD cohort was used as the external validation set.A TP53-associated signature calculating the risk score of every patient was developed with univariate Cox, leastabsolute shrinkage and selection operator, and stepwise regression analysis. Kaplan-Meier and receiver operatingcharacteristic curves were plotted to verify the accuracy. The independence of the signature was confirmed by themultivariate Cox regression analysis. Finally, a prognostic nomogram including 359 patients was constructed basedon the combined expression data and the risk scores.
Results: TP53 mutation was screened to be the robust and survival-related mutation type, and was associated withimmune cell infiltration. Two thousand, four hundred fifty-five genes included in the six modules generated in theWGCNA were screened as candidate survival related TP53-associated genes. A seven-gene signature wasconstructed: Risk score = (0.1254 × ERRFI1) - (0.1365 × IL6R) - (0.4400 × PPP1R10) - (0.3397 × PTOV1-AS2) + (0.1544 ×SCEL) - (0.4412 × SSX2IP) – (0.2231 × TXNL4A). Area Under Curves of 1-, 3-, and 5-year ROC curves were 0.731, 0.808,and 0.873 in the training set and 0.703, 0.677, and 0.737 in the validation set. A prognostic nomogram including359 patients was constructed and well-calibrated, with the Area Under Curves of 1-, 3-, and 5-year ROC curves as0.713, 0.753, and 0.823.
Conclusions: The TP53-associated signature exhibited good prognostic efficacy in predicting the overall survival ofPC patients.
Keywords: TP53 mutation, Survival prediction, WGCNA, Nomogram, Pancreatic Cancer
© The Author(s). 2021 Open Access This article is licensed under a Creative Commons Attribution 4.0 International License,which permits use, sharing, adaptation, distribution and reproduction in any medium or format, as long as you giveappropriate credit to the original author(s) and the source, provide a link to the Creative Commons licence, and indicate ifchanges were made. The images or other third party material in this article are included in the article's Creative Commonslicence, unless indicated otherwise in a credit line to the material. If material is not included in the article's Creative Commonslicence and your intended use is not permitted by statutory regulation or exceeds the permitted use, you will need to obtainpermission directly from the copyright holder. To view a copy of this licence, visit http://creativecommons.org/licenses/by/4.0/.The Creative Commons Public Domain Dedication waiver (http://creativecommons.org/publicdomain/zero/1.0/) applies to thedata made available in this article, unless otherwise stated in a credit line to the data.
* Correspondence: [email protected] of Pancreas and Endocrine Surgery, Shengjing Hospital of ChinaMedical University, No. 36 Sanhao Street, Heping District, Shenyang 110004,Liaoning, China
Liu et al. BMC Cancer (2021) 21:335 https://doi.org/10.1186/s12885-021-08066-2

IntroductionPancreatic cancer (PC) has been the 11th most commoncancer in 2012. Both the incidence and mortality rates ofPC have been increasing in developed countries. PC wasthe 3rd leading cause of cancer-related mortality in theUnited States in 2017, and will grow to be the 2nd lead-ing cause of cancer-related mortality in 2030 [1, 2]. Asthe malignancy with the highest mortality, the survivalrate of PC has not been increased despite years of inves-tigation [3]. The primary treatment approach is still sur-gery, though only 20% of patients will survive over 5years after pancreatectomy [4]. The main reasons in-clude delayed diagnosis at an advanced stage, ineffectivetreatment, and poor prognosis. The diagnosis of pancre-atic cancer has been generally difficult because itdepended on the clinical symptoms, which were not in-dicative during onset and gradual progression over years.There may be only midepigastric pain, weight loss, mal-aise, nausea, and fatigue. Most patients diagnosed withPC have developed metastases, leading to poor prognos-tic outcomes [5]. The detection of pancreatic cancer atearly and resectable stage has been proved to have bene-ficial effects on long-term survival.Numerous studies have tried to explore the risk factors
for PC. Smoking, Alcohol consumption, Obesity andDietary factors have been proved to increase the risk ofPC [2]. Except for the clinical symptoms, biomarkers inblood or biospy have been also developed for PC screenand monitor. Serum cancer antigen 19–9 (CA 19–9) isthe only approved marker for clinical management ofPC patients [6]. With the advances of proteome and ge-nomes, some specific expression profiles have been re-vealed in PC patients [7]. These expression profiles mayassist in interpreting the hereditary incidence, unpredict-able efficacy of clinical treatment, as well as the pooroutcomes. A recent study has summarized the selectedprotein biomarkers in tissue, serum, plasma, and pancre-atic juice. The combination of CA 19–9 and other emer-ging biomarkers improved clinical management of PC[7]. The genetic alterations have also been investigatedin PC patients. The study proposed several known fre-quently mutated genes (including KRAS and TP53) andrevealed mutations in critical signaling pathways [4].Further, a recent meta-analysis involving 9040 patientsand 12,496 controls reported five new susceptibility locifor PC [8]. The emerging genetic alterations assisted inthe better characterization of the complex diseases.PC is a heterogeneous disease with various subtypes
[9]. More understanding may help in improving the dis-ease management [10]. Here, from another point ofview, we explored the gene alterations in tumorigenesisand cancer development of PC based on comprehensivebioinformatic analysis. Overall survival-related mutationswere screened and a novel gene signature was developed
to predict the overall survival for patients with PC. Itmay be beneficial to improve the prognosis predictionand post-surgery management.
Materials and methodsData sourcesA total of three cohorts were included in this study.Somatic mutation data (n = 124) and RNA-sequencingdata (n = 178) with corresponding clinical data of theTCGA-PAAD cohort were downloaded from the CancerGenome Atlas (https://cancergenome.nih.gov/). Somaticmutation data of the ICGC-PACA-CA cohort (n = 263)and the ICGC-PACA-AU cohort (n = 373) with corre-sponding clinical data were downloaded from the Inter-national Cancer Genome Consortium (ICGC) database(https://www.icgc.org). RNA-sequencing data of theICGC-PACA-CA cohort (n = 182) with correspondingclinical data were also downloaded from the Inter-national Cancer Genome Consortium (ICGC) database(https://www.icgc.org).
Data processing and normalizationSomatic mutation data of the TCGA-PAAD cohort werebased on VarScan2 [11]. Somatic mutation data of theICGC-PACA-AU cohort were based on qsnp [12]. Som-atic mutation data of the ICGC-PACA-CA cohort werebased on MuTect [13]. Synonymous variant data whichcould not cause the change of amino acid sequence werefiltered out. The RNA-sequencing data of the ICGC-PACA-CA and the TCGA-PAAD cohorts were normal-ized data (FPKM). All expression values were log2-transformed. The batch effect was eliminated with theSVA R package in R 3.6.1. The somatic mutation data ofthe three cohorts were used to identify the commonsurvival-related gene mutation. The RNA-sequencingdata of the ICGC-PACA-CA and the TCGA-PAAD co-horts were used to explore and validate the multi-genesignature to predict the overall survival in patients withpancreatic cancer.
Identification of survival-related mutationsSomatic mutation data of the three cohorts were ex-tracted and sorted with Perl 5.32.0 (https://www.perl.org/). Mutational frequencies were calculated by thecounting method. The top 30 genes with the highestmutation frequency were acquired from the three co-horts separately. Waterfall plots of the mutational land-scape were generated with the GenVisR R package [14].The common mutations were selected and drawn by theVenn diagram. In order to identify robust mutationswhich were associated with the overall survival, Kaplan-Meier (KM) curves comparing the mutated group withthe wild group were plotted by the Survival R package inthree cohorts separately. P < 0.05 were considered to be
Liu et al. BMC Cancer (2021) 21:335 Page 2 of 15

indicative of significance. Finally, only TP53 mutationwas indicated to be significantly related to the overallsurvival in all the three cohorts.
Association between TP53 mutation and tumor mutationburden (TMB)TMB is an important genetic factor in mediating antitu-mor immunity. In this study, number of non-synonymous single nucleotide polymorphism (SNP) ofeach sample was calculated with Perl 5.32.0. TMB scoreswere estimated as number of variants/the length ofexons (38 million). Wilcoxon tests were conducted tocompare the differences of TMB between the TP53 mu-tated and wild groups in the three cohorts.
Gene set enrichment analysis (GSEA)To reveal functional differences between PC patientswith and without TP53 mutations, GSEA was done inGSEA 4.0.1 software with the gene set c2 (cp.kegg.v.6.2.-symbols.gmt). A total of 65 patients without TP53 muta-tions and 77 patients with TP53 mutations in theTCGA-PAAD cohort were included. The normalizedRNA-sequencing data (FPKM) were used in the GSEA.The threshold was set at FDR (false discovery rate) <0.05 and NES (normalized enrichment score) > 1.5. Theresults were drawn with the ggplot2 R package.
Analysis of total leucocyte infiltration and 22 immune celltypes’ infiltration pattensTo explore the differences in tumor immune infiltratingcells between TP53-mutated and TP53-wild patients, theestimations of total leucocyte infiltration were performedby the ESTIMATE R package [15], and the fractions of22 immune cell types (B cells naïve, B cells memory,Plasma cells, T cells CD8, T cells CD4 naïve, T cellsCD4 memory resting, T cells CD4 memory activated, Tcells follicular helper, T cells regulatory (Tregs), T cellsgamma delta, NK cells resting, NK cells activated,Monocytes, Macrophages M0, Macrophages M1, Macro-phages M2, Dendritic cells resting, Dendritic cells acti-vated, Mast cells resting, Mast cells activated,Eosinophils and Neutrophils) were calculated withCIBERSORT R script v1.03 [16]. Sixty-five patients with-out TP53 mutations and 77 patients with TP53 muta-tions in the TCGA-PAAD cohort were included.Immune scores generated from the ESTIMATE algo-rithm were used to reflect and compare the total leuco-cyte infiltrations. The CIBERSORT analysis wasconducted by using the default signature matrix at 1000permutations. Results with P ≥ 0.05 were excluded. 35wild and 60 mutated patients were included for the fur-ther analysis. Differentially analysis was performed withthe Wilcoxon test and plotted by the vioplot R package.P < 0.05 were considered to be statistically significant.
Pearson’ correlations among the infiltrations of the 22immune cell types and the immune scores were plottedwith the corrplot R package in the wild and mutatedgroups separately.
Screening of survival related TP53-associated genesTo screen candidate genes which were both associatedwith TP53 mutations and overall survival, WGCNA wasapplied with the WGCNA R package [17]. There were67 wild and 82 mutated patients in the TCGA-PAADcohort with complete overall survival data included.First, outlier samples were excluded by sample cluster-ing. The sample dendrogram and the clinical-traits heat-map were plotted. Then, the scale-free network wasconstructed with the appropriate soft-threshold power(β) value. The scale-free topology was plotted to showthe constructed scale-free network.The co-expression modules generated from the scale-
free network were further plotted with dynamic tree cut-ting. Modules were merged if their similarity was greaterthan 0.75 according to dendrogram height. The Pear-son’s correlation coefficients between each module andclinical traits were further calculated and plotted. Mod-ules with correlations with TP53 mutation greater than0.2 (P < 0.05) and significantly associated with overallsurvival (P < 0.05) were considered as survival-relatedTP53-associated modules. The genes included in themodules were screened as candidate survival relatedTP53-associated genes.
Developing and validation of TP53-associated prognosticsignatureIn this study, the gene expression data of the ICGC-PACA-AU cohort were mainly based on microarrayplatform. While, the gene expression data of the ICGC-PACA-CA and the TCGA-PAAD cohorts were all basedon RNA- sequencing platforms. The sample size of theICGC-PACA-CA cohort was larger than the TCGA-PAAD cohort. So, the ICGC-PACA-CA cohort was ap-plied as the training set and the TCGA-PAAD cohortwas used as the external validation set. First, the univari-ate Cox regression analysis was done to further identifythe survival related TP53-associated genes in the train-ing set with the cutoff of P < 0.05. The LASSO and step-wise regression analyses were applied to construct thebest-fit TP53-related prognostic signature, which couldestimate the risk score of every patient. Based on themedian risk score of the training set, all patients were di-vided into high- and low-risk groups in both sets.Kaplan-Meier (KM) curves were used to perform thesurvival analysis which could compare the overall sur-vival of different groups. The predictive performances atdifferent endpoints (1, 2, 3, 4, and 5 years) were assessedwith the receiver operating characteristic (ROC) curves
Liu et al. BMC Cancer (2021) 21:335 Page 3 of 15

in both cohorts. The alteration trends of risk score, sur-vival time, survival status, and expression levels of thegenes included in the signature were further plotted withthe pheatmap R package in both cohorts separately.
Independent prognostic prediction analysisTo explore the independence of the TP53-related signa-ture, univariate and multivariate Cox regression analyseswere conducted with the Survival R package. One hun-dred forty-three patients with complete clinical informa-tion of the age, gender, stage, and risk score wereincluded in the ICGC-PACA-CA cohort. One hundredand seventy-five patients with complete clinical informa-tion of the age, gender, grade, stage, alcohol, family his-tory, and risk score were included in the TCGA-PAADcohort. The hazard ratio (HR) and P values were plotted.P < 0.05 were considered statistically significant. 5-yearReceiver Operating characteristic Curves (ROC) of therisk score and other clinical features were plotted withthe survivalROC R package. Area Under Curves (AUCs)were applied to compare the accuracies of different fac-tors’ prediction abilities.
Construction of the prognostic NomogramBased on the multivariate Cox regression analysis in theindependent prognostic prediction analysis, the riskscore was the only robust factor significantly (P < 0.05)associated with overall survival in both cohorts. The ex-pression data and the risk scores of the two cohorts werecombined. A total of 359 patients were included and theprognostic nomogram was constructed with the rms Rpackage. The survival analysis was carried out by KMplotter. The calibration curve was further plotted usingthe calibrate function. ROC curves of 1, 3, and 5 yearswere plotted with the survivalROC R package. Then, weconducted the performance comparison of the signaturein our study (referred to as TP53Sig) with eight recentlypublished signatures: 6-mRNA signature from Hou’sstudy (referred to as HouSig) [18], 4-mRNA signaturefrom Meng’s study (referred to as MengSig) [19], 8-mRNA signature from Meng’s study (referred to asMengSig) [20], 5-mRNA signature from Wu’s study (re-ferred to as WuSig) [21], 7-mRNA signature from Wu’sstudy (referred to as WuSig) [22], 10-mRNA signaturefrom Yue’s study (referred to as YueSig) [23], 2-mRNAsignature from Zhou’s study (referred to as ZhouSig)[24] and 6-LncRNA signature from Deng’s study (re-ferred to as DengSig) [25]. ROC curves of 3 years wereplotted and AUC values were calculated using the survi-valROC R package.
Survival analysis in subgroupsTo evaluate the predictive level of TP53-related prog-nostic score in different subgroups (Age>65, Age ≤ 65,
Male, Female, Stage I, Stage II, Stage III-IV, Grade 1,Grade 2 and Grade 3–4), Kaplan-Meier (KM) curveswere plotted with the Survival R package.
Relevance with clinical featuresThe relationships between the risk score and the otherclinical features (Age, Gender, Stage and Grade) wereexplored by using the ggpubr R package in the combinedcohort with Kruskal-Wallis test. P < 0.05 indicated statis-tically significant.
Immune cell infiltration analysis and GSEATo explore the differences in tumor immune infiltratingcells between the high-risk patients (n = 183) and thelow-risk patients (n = 176), the estimations of totalleucocyte infiltration were performed by the ESTIMATER package and the fractions of 22 immune cell typeswere estimated with CIBERSORT in R 3.6.1. Immunescores generated from the ESTIMATE algorithm wereused to reflect and compare the total leucocyte infiltra-tions with Wilcoxon test. The CIBERSORT analysis wasconducted by using the default signature matrix at 1000permutations. Results with P ≥ 0.05 were excluded. Then,according to the previous Charoentong’s study [26], wefurther explored the differential expression analysis of 96immunotherapy-related genes between the 183 high-riskand 176 low-risk patients with Wilcoxon Test. Finally,the functional differences between the high-risk andlow-risk groups were explored with gene set enrichmentanalysis in GSEA 4.0.1 software.
Statistical analysisThe Kaplan–Meier method was used to perform survivalanalysis, and the log-rank test was used to assess the dif-ference. Differentially analysis of TMB values, immunescores and 22 immune cell types’ infiltrations were con-ducted with the Wilcoxon test. Univariate and multivari-ate Cox regression analysis were used to assess theindependence of the risk score. The performances of thesignatures were evaluated by the ROC curves. The rela-tionships between the risk score and the other clinicalfeatures were explored with Kruskal-Wallis test. P < 0.05indicated statistically significant.
ResultsScreening TP53 mutation to be robust and survival-related mutation typeMutational landscapes of the top 30 genes with the high-est mutation frequency in the three cohorts were plottedseparately (Fig. 1a-c). As shown in the results, KRAS andTP53 mutations were the top two mutation types. Themutation frequencies of SMAD4, CDKN2A, and TTNmutations ranked the third to the fifth in the three co-horts. The common ten (KRAS, TP53, SMMAD4,
Liu et al. BMC Cancer (2021) 21:335 Page 4 of 15

CDKN2A, TTN, RNF43, MUC16, ARID1A, KMT2C,and RYR1) mutations were drawn by the Venn diagram(Fig. 1d). In order to explore whether these mutationswere associated with the overall survival robustly,Kaplan-Meier (KM) curves comparing the mutatedgroup with the wild group were performed in the threecohorts separately. Finally, TP53 mutation was indicatedto be the only robust and survival-related mutation type.Kaplan-Meier (KM) curves were shown (Fig. 2a-c).TP53-mutated patients had significantly worse overallsurvival in the three cohorts (P < 0.05).
Association between TP53 mutation and tumor mutationburden (TMB)TMB values of TP53-mutated group were significantlyhigher in TCGA-PAAD cohort (P = 0.001) and ICGC-PACA-AU cohort (P < 0.001). However, no significantdifference was found in the ICGC-PACA-CA cohort(P = 0.93) (Fig. 2d). Whether TP53 mutation affectsTMB needs to be further explored.
TP53 mutation was associated with immune cellinfiltrationGSEA results indicated that the B cell receptor signalingpathway and leukocyte transendothelial migration weresignificantly enriched in the TP53-mutated patients(Fig. 2e). Immune scores reflecting the total leucocyteinfiltrations by ESTIMATE showed no significant
difference between the two groups (Fig. 3a). However,fraction pattens of the 22 immune cell types by CIBER-SORT were different. In details, the fractions of plasmacells (P = 0.023), T cells CD8 (P = 0.049), Monocytes(P = 0.047) and Mast cells resting (P = 0.03) in TP53-mutated patients were significantly lower than those inTP53-wild patients (Fig. 3b). Moreover, the immunescore had the most positive correlation with the fractionof Neutrophils (R = 0.33) and the most negative correl-ation with the fraction of Macrophages M0 (R = − 0.41)in the wild group (Fig. 3c). And the immune score hadthe most positive correlation with the fraction of T cellsCD4 memory activated (R = 0.31) and the most negativecorrelation with the fraction of B cells naïve (R = − 0.27)in the mutated group (Fig. 3d).
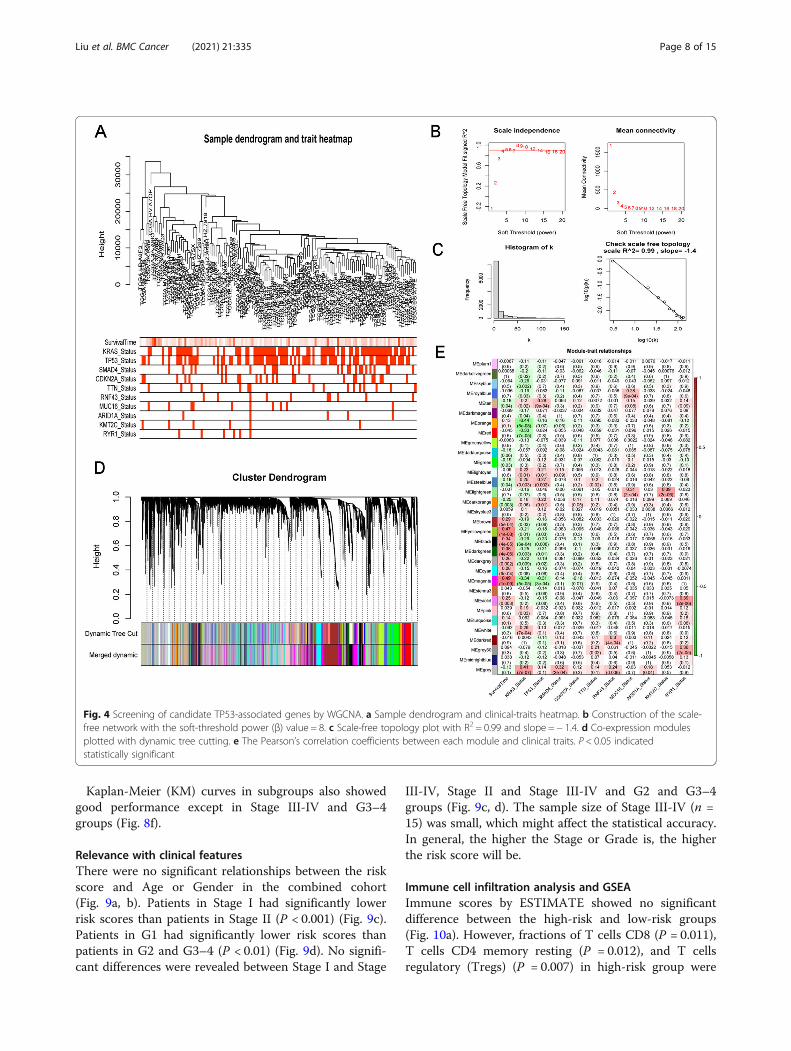
Screening of candidate TP53-associated genes by WGCNATo screen candidate TP53-associated genes, WGCNAwas performed in the TCGA-PAAD cohort. First, sixoutlier samples were excluded by sample clustering. Thesample dendrogram and the clinical-traits heatmap wasplotted (Fig. 4a). Then, the scale-free network was con-structed with the soft-threshold power (β) value as 8(Fig. 4b). The constructed scale-free network was shownby the scale-free topology, with R2 = 0.99 and slope = −1.4 (Fig. 4c). The co-expression modules generated fromthe scale-free network were further plotted with dynamictree cutting (Fig. 4d). The Pearson’s correlation
Fig. 1 The mutational landscapes of the top 30 genes with the highest mutation frequency. a TCGA-PAAD. b ICGC-PACA-CA. c ICGC-PACA-AU. dVenn diagram
Liu et al. BMC Cancer (2021) 21:335 Page 5 of 15

coefficients between each module and clinical traits(Additional file 1) were plotted (Fig. 4e). Six Modules(magenta, darkgreen, black, darkorange, steelblue, tan)with correlations with TP53 mutation greater than 0.2(P < 0.05) and significantly related with the overall sur-vival (P < 0.05) were considered as survival related TP53-associated modules. A total of 2455 genes included inthe six modules were screened as candidate survival re-lated TP53-associated genes.
Developing and validation of TP53-related prognosticsignatureThe ICGC-PACA-CA cohort (n = 182) was applied asthe training set and the TCGA-PAAD cohort (n = 177)was used as the external validation set. Patient character-istics in the training and the testing cohorts were shown(Table 1). First, univariate cox regression analysis wasdone in the training set and a total of 316 genes wereidentified with P < 0.05. LASSO regression analysis wasfurther applied and 10 genes were screened (Fig. 5a, b).Then, the stepwise regression analysis was used and con-structed the best-fit TP53-related prognostic signaturecalculating the risk score of each patient. Seven geneswere included in the signature calculating the risk score
with the formula: risk score = (0.1254 × ERRFI1) -(0.1365 × IL6R) - (0.4400 × PPP1R10) - (0.3397 ×PTOV1-AS2) + (0.1544 × SCEL) - (0.4412 × SSX2IP) –(0.2231 × TXNL4A). The hazard ratios (HRs) were plot-ted (Fig. 5c). Based on the median risk score 1.005987 ofthe training set, all patients were divided into high- andlow-risk groups in both training and external validationsets. Kaplan-Meier (KM) curves showed the overall sur-vival of the high-risk patients was worse than that of thelow-risk patients (P < 0.001) (Fig. 5d-e). The ROC curvesof 1-, 2-, 3-, 4-, and 5-year were plotted, with the AUCof 0.731, 0.765, 0.808, 0.774, and 0.873 in the trainingset (Fig. 5f) and the AUC of 0.703, 0.648, 0.677, 0.714,and 0.737 in the external validation set (Fig. 5g). Alter-ation trends of risk score, survival time, survival statusand the included genes’ expression levels were furtherplotted separately (Fig. 6a-f).
Independence of the TP53-related prognostic signatureUnivariate and multivariate Cox regression analyses wereperformed to explore the independence of the TP53-related prognostic signature from other clinical features.The hazard ratio (HR) and P values were plotted. The 5-year Receiver Operating Characteristic Curves (ROC) of
Fig. 2 TP53 mutation’s associations with overall survival, TMB and GSEA. a Kaplan-Meier curve of TCGA-PAAD cohort. b Kaplan-Meier curve ofICGC-PACA-AU cohort. c Kaplan-Meier curve of ICGC-PACA-CA cohort. d Tumor mutation burden (TMB) analysis. e Differences in biologicalfunctions between TP53-mutated and TP53-Wild patients by GSEA
Liu et al. BMC Cancer (2021) 21:335 Page 6 of 15

the risk score and other clinical features were plotted.The risk score was proved to be the only variable signifi-cantly associated with overall survival in the univariate(P < 0.001) and multivariate (P < 0.001) Cox regressionresults in the ICGC-PACA-CA cohort (Fig. 7a, b). The5-year ROC curve was plotted with the highest value of0.844 than that of the other clinical features included(Fig. 7c). The risk score (P < 0.001), age (P = 0.012), andgrade (P = 0.007) were the three variables significantlyassociated with overall survival in the univariate analysisof the TCGA-PAAD cohort (Fig. 7d). The risk score(P < 0.001) and age (P = 0.038) were the two significantvariables in the multivariate analysis of the TCGA-PAAD cohort (Fig. 7e). The 5-year ROC curve was alsoplotted with the highest value of 0.717 than that of theother clinical features included (Fig. 7f). These results in-dicated that the risk score based on the TP53-related
prognostic signature was independent from other clinicalfeatures.
Construction of the prognostic NomogramThe risk score was the only robust factor significantly(P < 0.05) associated with overall survival in both co-horts. The expression data and the risk scores of the twocohorts were combined. Three hundred and fifty-ninepatients were included and the prognostic nomogramwas conducted (Fig. 8a). The survival analysis was car-ried out by KM plotter (Fig. 8b). The calibration curveof 3 years was well calibrated (Fig. 8c). The ROC curvesof 1-, 3-, and 5-year were plotted, with the AUC of0.713, 0.753, and 0.823 (Fig. 8d).ROC curves of 3 years indicated that the signature in
our study had the highest AUC value (Fig. 8e).
Fig. 3 TP53 mutation was associated with immune cell infiltration. a Comparison of the immune scores. b Differences of 22 immune cell types’infiltrations between TP53-mutated and TP53-Wild patients. c The Pearson’ correlations among the 22 immune cell types’ infiltrations and theimmune scores in TP53-Wild patients. d The Pearson’ correlations among the 22 immune cell types’ infiltrations and the immune scores in TP53-mutated patients. P < 0.05 indicated statistically significant. Note: ns: not significant
Liu et al. BMC Cancer (2021) 21:335 Page 7 of 15
Kaplan-Meier (KM) curves in subgroups also showedgood performance except in Stage III-IV and G3–4groups (Fig. 8f).
Relevance with clinical featuresThere were no significant relationships between the riskscore and Age or Gender in the combined cohort(Fig. 9a, b). Patients in Stage I had significantly lowerrisk scores than patients in Stage II (P < 0.001) (Fig. 9c).Patients in G1 had significantly lower risk scores thanpatients in G2 and G3–4 (P < 0.01) (Fig. 9d). No signifi-cant differences were revealed between Stage I and Stage
III-IV, Stage II and Stage III-IV and G2 and G3–4groups (Fig. 9c, d). The sample size of Stage III-IV (n =15) was small, which might affect the statistical accuracy.In general, the higher the Stage or Grade is, the higherthe risk score will be.
Immune cell infiltration analysis and GSEAImmune scores by ESTIMATE showed no significantdifference between the high-risk and low-risk groups(Fig. 10a). However, fractions of T cells CD8 (P = 0.011),T cells CD4 memory resting (P = 0.012), and T cellsregulatory (Tregs) (P = 0.007) in high-risk group were
Fig. 4 Screening of candidate TP53-associated genes by WGCNA. a Sample dendrogram and clinical-traits heatmap. b Construction of the scale-free network with the soft-threshold power (β) value = 8. c Scale-free topology plot with R2 = 0.99 and slope = − 1.4. d Co-expression modulesplotted with dynamic tree cutting. e The Pearson’s correlation coefficients between each module and clinical traits. P < 0.05 indicatedstatistically significant
Liu et al. BMC Cancer (2021) 21:335 Page 8 of 15
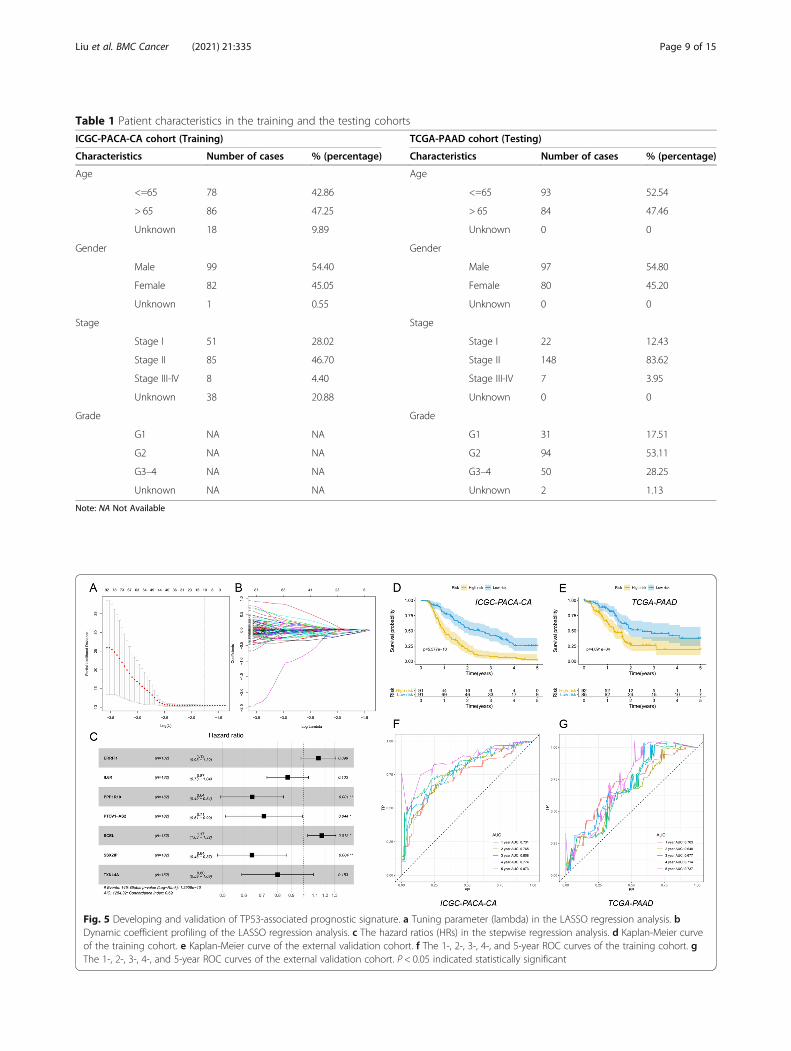
Table 1 Patient characteristics in the training and the testing cohorts
ICGC-PACA-CA cohort (Training) TCGA-PAAD cohort (Testing)
Characteristics Number of cases % (percentage) Characteristics Number of cases % (percentage)
Age Age
<=65 78 42.86 <=65 93 52.54
> 65 86 47.25 > 65 84 47.46
Unknown 18 9.89 Unknown 0 0
Gender Gender
Male 99 54.40 Male 97 54.80
Female 82 45.05 Female 80 45.20
Unknown 1 0.55 Unknown 0 0
Stage Stage
Stage I 51 28.02 Stage I 22 12.43
Stage II 85 46.70 Stage II 148 83.62
Stage III-IV 8 4.40 Stage III-IV 7 3.95
Unknown 38 20.88 Unknown 0 0
Grade Grade
G1 NA NA G1 31 17.51
G2 NA NA G2 94 53.11
G3–4 NA NA G3–4 50 28.25
Unknown NA NA Unknown 2 1.13
Note: NA Not Available
Fig. 5 Developing and validation of TP53-associated prognostic signature. a Tuning parameter (lambda) in the LASSO regression analysis. bDynamic coefficient profiling of the LASSO regression analysis. c The hazard ratios (HRs) in the stepwise regression analysis. d Kaplan-Meier curveof the training cohort. e Kaplan-Meier curve of the external validation cohort. f The 1-, 2-, 3-, 4-, and 5-year ROC curves of the training cohort. gThe 1-, 2-, 3-, 4-, and 5-year ROC curves of the external validation cohort. P < 0.05 indicated statistically significant
Liu et al. BMC Cancer (2021) 21:335 Page 9 of 15

Fig. 6 Alteration trends of risk score, survival and expression levels of the genes included in the signature. a, d The distribution of calculated riskscores. b, e The survival time and status of high- and low- risk patients. c, f Expression heatmap of the seven genes included in the signature
Fig. 7 Independence of the TP53-related prognostic signature. a Univariate Cox regression results of ICGC-PACA-CA. b Multivariate Cox regressionresults of ICGC-PACA-CA. c The 5-year ROC curve of clinical features in ICGC-PACA-CA. e Univariate Cox regression results of TCGA-PAAD. fMultivariate Cox regression results of TCGA-PAAD. g The 5-year ROC curve of clinical features in TCGA-PAAD. P < 0.05 indicatedstatistically significant
Liu et al. BMC Cancer (2021) 21:335 Page 10 of 15

significantly lower (Fig. 10b). The fraction of Macro-phages M0 in high-risk group was significantly higher(Fig. 10b). We further explored the differential expres-sion analysis of 96 immunotherapy-related genes (Add-itional file 2). A total of 31 genes were identified, ofwhich 26 genes’ expression levels were lower in thehigh-risk group. This might indicate that the immuneactivity in the high-risk group was weaker than that inthe low-risk group (Fig. 10c). GSEA results indicatedthat Epithelial-Mesenchymal Transition and Hypoxiawere the most significantly enriched functions in thehigh-risk patients (Fig. 10d).
DiscussionGene alterations have been determined in 97% of pa-tients with PDAC, including point mutations, amplifica-tions, deletions, translocations, and inversions [27]. TP53encoded tumor suppressor TP53, which transcriptionallyactivated target genes for resisting cellular stresses, theninducing growth arrest or apoptosis [28]. TP53 mutationhas been observed in 50–75% of PDAC cases, whichwould initiate activating mutation of the KRAS gene.Mutant TP53 promoted lymph node metastasis and es-caped from KrasG12D-induced growth arrest/senes-cence in PDAC [29]. In clinical practices, the detection
Fig. 8 Construction of the prognostic nomogram and the prediction accuracy. a The prognostic nomogram including 359 patients. b KM curveof the nomogram in the combined cohort. c The calibration curve of 3 years. d The 1-, 3-, and 5-year ROC curves. e The ROC analysis at 3 years ofoverall survival for the signature in our study (referred to as TP53Sig) and other published signatures. f Kaplan-Meier (KM) curves in subgroups.P < 0.05 indicated statistically significant
Liu et al. BMC Cancer (2021) 21:335 Page 11 of 15

of mutant and expression profile of TP53 and associatedgenes may improve the diagnosis and screen for PC [30,31]. The sample can be the pancreatic Juice, less-invasiveserum exosomes or even non-invasive stool [32, 33]. How-ever, until now, although TP53 have been closely associatedwith PC, the roles of TP53 have not been elucidated. Moreinformation on its upstream and downstream genes wouldbe required [27]. Our bioinformatic analysis has also provedthe roles of TP53 in PDAC. Firstly, KRAS and TP53 muta-tions were observed as the top two genes with the highestmutation frequency. Secondly, TP53 mutation was indi-cated to be the only robust and survival-related mutationtype. Thirdly, TP53-mutated patients showed significantlyworse overall survival than TP53-wild patients in includedcohorts.Based on above results, more genes associated with
TP53 mutations were further identified. Key modules in-cluding 2455 genes were preliminarily screened withWGCNA and Pearson’s correlation. The key 316 geneswere secondly screened with univariate Cox regressionanalysis. Then, 10 most critical genes were identifiedwith LASSO. Finally, the best-fit TP53-related prognos-tic signature involved 7 genes were constructed withstepwise regression analysis, as well as corresponding co-efficients. In the formula for calculating risk score, the
high levels of ERRFI1, SCEL increased risk of poor prog-nosis, while the high levels of IL6R, PPP1R10, PTOV1-AS2, SSX2IP, TXNL4A suggested decreasing risk. Theidentified 7 genes were potential candidates of bio-markers for prognosis prediction of PDAC [34].In previous studies, ERBB receptor feedback inhibitor 1
(ERRFI1) was reported as an important regulatory gene.It regulated AKT/EGFR signaling in an EGFR-dependentmanner. In EGFR-low cells, ERRFI1 activated AKT andpromoted proliferation and chemotherapy resistance. InEGFR-high cells, reduced ERRFI1 led to active EGFRand increased cell proliferation [35]. As a key gene tar-geted AKT/EGFR signaling, ERRFI1 may be a bindingtarget for some miRNAs and lncRNAs in various can-cers, such as cholangiocarcinoma [36, 37]. Until now,the effects of ERRFI1 on PDAC have not been revealed,and its effects in other cancers suggested that it may bepromising therapeutic target and biomarker. Interleukin-6 receptor (IL-6R) was the receptor of IL-6. The block-ing agents that combined with IL-6 and IL-6R may bepotential anti-inflammatory drugs, and some of themmay be anti-cancer agents [38]. As an important effectorin several signaling pathways, IL6R was also proposed asa new therapeutic target for some cancers [39, 40]. Forexample, IL-6R participated IL-6R /STAT3/miR-204
Fig. 9 The relationships between risk score and clinical features. a Relationships between risk score and the Age, Gender, Stages in the combinedcohort. b Relationships between risk score and the Grade in the TCGA-PAAD cohort. P < 0.05 indicated statistically significant. Note: the data ofGrade were not provided in the ICGC-PACA-CA dataset
Liu et al. BMC Cancer (2021) 21:335 Page 12 of 15

feedback loop contributed to chemo-resistance of epi-thelial ovarian cancer cells [41]. IL-6R participated sev-eral important pathways in tumor development andchemo-resistance. The suppression of IL-6R may func-tion in these pathways thus affecting the prognosis. Thesame to ERRFI1, the roles of IL-6R in PDAC have notbeen revealed, which worth further investigation. SCELencoded Sciellin (SCEL), which was a precursor of thecornified envelope firstly identified in mammalian kera-tinizing tissue [42]. SCEL was a mesenchymal-to-epithelial transition inducer dynamically regulated dur-ing the metastasis. Thus it may be a site for regulatingthe colorectal cancer hepatic metastasis [43]. SSX2IPencoded Synovial Sarcoma X breakpoint 2 InteractingProtein (SSX2IP) has been revealed to play various rolesin human cancers. SSX2IP was known as leukaemia as-sociated antigen [44, 45]. SSX2IP promoted the tumor-genesis and progression of hepatocellular carcinoma andcontributed to the drug resistance, enabling it a new bio-marker and specific target in hepatocellular carcinoma[46]. High levels of SSX2IP were associated with aggres-sive pathological features and poor outcomes in naso-pharyngeal carcinoma [47]. Few studies have been
performed on PPP1R10, PTOV1 antisense 2 (PTOV1-AS2) and Thioredoxin-like protein 4A(TXNL4A). Con-sidering the malignancy of PDAC, relatively less studiescould be retrieved, both on the biomarkers or thera-peutic targets. The bioinformatic analysis has been auseful tool for exploring promising candidates for fur-ther investigation.
ConclusionsWith the screened gene candidates, the TP53-associatedsignature exhibited good prognostic efficacy in predict-ing the overall survival of PC patients. In the trainingand validation cohorts, the 1-, 3-, and 5-year ROCcurves were plotted according to the risk score, present-ing relatively high AUC. The prognostic nomogram in-cluding 359 patients was also constructed to calculatethe risk score, which would facilitate the further clinicalapplications. There are also some limitations in ourstudy. Firstly, the gene expression and somatic cell mu-tations data were obtained from cancerous tissues. How-ever, the results should be further verified in other typesof samples, such as serum and stool. As the less-invasiveand non-invasive specimens will tend to promote the
Fig. 10 Immune cell infiltration analysis and GSEA in high- and low-risk groups. a Comparison of the immune scores. b The fractions of 22immune cell types estimated with CIBERSORT and the differences between high- and low- risk patients. c Differential expression analysis ofimmunotherapy-related genes. d Differences in biological functions by GSEA. Note: *** P < 0.001, ** P < 0.01, * P < 0.05
Liu et al. BMC Cancer (2021) 21:335 Page 13 of 15
early screen and detection of PDAC. Secondly, the as-sociation between TP53 mutation and tumor muta-tion burden should be verified in larger cohort.Thirdly, whether the nomogram could predict im-munotherapy or chemotherapy needs further explora-tions in the future.
AbbreviationsPC: Pancreatic cancer; KM: Kaplan-Meier; TMB: Tumor mutation burden;GSEA: Gene set enrichment analysis; WGCNA: Weighted Gene Co-expressionNetwork Analysis; LASSO: Least absolute shrinkage and selection operator;ROC: Receiver operating characteristic; AUCs: Area Under Curves; TCGA: TheCancer Genome Atlas; ICGC: International Cancer Genome Consortium;FDR: False discovery rate; NES: Normalized enrichment score; HR: Hazard ratio
Supplementary InformationThe online version contains supplementary material available at https://doi.org/10.1186/s12885-021-08066-2.
Additional file 1.
Additional file 2.
Authors’ contributionsX. Liu and S. Sun designed the study. Collection and assembly of data wereperformed by B. Chen and J. Chen. Data analysis and interpretation weredone by X. Liu. Manuscript writing was finished by X. Liu and S. Sun. Allauthors approved the manuscript.
FundingNo funding was received.
Availability of data and materialsThe data used and analyzed in this study are available from thecorresponding author on reasonable request.
Declarations
Ethics approval and consent to participateNot applicable.
Consent for publicationNot applicable.
Competing interestsNone of the authors have competing interests in the manuscript.
Received: 27 December 2020 Accepted: 15 March 2021
References1. Rahib L, Smith BD, Aizenberg R, Rosenzweig AB, Fleshman JM, Matrisian LM.
Projecting cancer incidence and deaths to 2030: the unexpected burden ofthyroid, liver, and pancreas cancers in the United States. Cancer Res. 2014;74(11):2913–21. https://doi.org/10.1158/0008-5472.CAN-14-0155.
2. Ilic M, Ilic I. Epidemiology of pancreatic cancer. World J Gastroenterol. 2016;22(44):9694–705. https://doi.org/10.3748/wjg.v22.i44.9694.
3. Ansari D, Tingstedt B, Andersson B, Holmquist F, Sturesson C, Williamsson C,et al. Pancreatic cancer: yesterday, today and tomorrow. Future Oncol(London, England). 2016;12(16):1929–46.
4. Dreyer SB, Chang DK, Bailey P, Biankin AV. Pancreatic Cancer genomes:implications for clinical management and therapeutic development. ClinCancer Res. 2017;23(7):1638–46. https://doi.org/10.1158/1078-0432.CCR-16-2411.
5. McGuigan A, Kelly P, Turkington RC, Jones C, Coleman HG, McCain RS.Pancreatic cancer: a review of clinical diagnosis, epidemiology, treatmentand outcomes. World J Gastroenterol. 2018;24(43):4846–61. https://doi.org/10.3748/wjg.v24.i43.4846.
6. Kim JE, Lee KT, Lee JK, Paik SW, Rhee JC, Choi KW. Clinical usefulness ofcarbohydrate antigen 19-9 as a screening test for pancreatic cancer in anasymptomatic population. J Gastroenterol Hepatol. 2004;19(2):182–6. https://doi.org/10.1111/j.1440-1746.2004.03219.x.
7. Ansari D, Torén W, Zhou Q, Hu D, Andersson R. Proteomic and genomicprofiling of pancreatic cancer. Cell Biol Toxicol. 2019;35(4):333–43. https://doi.org/10.1007/s10565-019-09465-9.
8. Klein AP, Wolpin BM, Risch HA, Stolzenberg-Solomon RZ, Mocci E. Genome-wide meta-analysis identifies five new susceptibility loci for pancreaticcancer. Nat Commun. 2018;9(1):556.
9. Torres C, Grippo PJ. Pancreatic cancer subtypes: a roadmap for precisionmedicine. Ann Med. 2018;50(4):277–87. https://doi.org/10.1080/07853890.2018.1453168.
10. Wu J, Li Z, Zeng K, Wu K, Xu D, Zhou J, et al. Key genes associated withpancreatic cancer and their association with outcomes: a bioinformaticsanalysis. Mol Med Rep. 2019;20(2):1343–52. https://doi.org/10.3892/mmr.2019.10321.
11. Koboldt DC, Zhang Q, Larson DE, Shen D, McLellan MD, Lin L, et al. VarScan2: somatic mutation and copy number alteration discovery in cancer byexome sequencing. Genome Res. 2012;22(3):568–76. https://doi.org/10.1101/gr.129684.111.
12. Kassahn KS, Holmes O, Nones K, Patch AM, Miller DK, Christ AN, et al.Somatic point mutation calling in low cellularity tumors. PLoS One. 2013;8(11):e74380. https://doi.org/10.1371/journal.pone.0074380.
13. Cibulskis K, Lawrence MS, Carter SL, Sivachenko A, Jaffe D, Sougnez C, et al.Sensitive detection of somatic point mutations in impure andheterogeneous cancer samples. Nat Biotechnol. 2013;31(3):213–9. https://doi.org/10.1038/nbt.2514.
14. Skidmore ZL, Wagner AH, Lesurf R, Campbell KM, Kunisaki J, Griffith OL,et al. GenVisR: genomic visualizations in R. Bioinformatics. 2016;32(19):3012–4. https://doi.org/10.1093/bioinformatics/btw325.
15. Yoshihara K, Shahmoradgoli M, Martínez E, Vegesna R, Kim H, Torres-GarciaW, et al. Inferring tumour purity and stromal and immune cell admixturefrom expression data. Nat Commun. 2013;4(1):2612. https://doi.org/10.1038/ncomms3612.
16. Newman AM, Liu CL, Green MR, Gentles AJ, Feng W, Xu Y, et al. Robustenumeration of cell subsets from tissue expression profiles. Nat Methods.2015;12(5):453–7. https://doi.org/10.1038/nmeth.3337.
17. Langfelder P, Horvath S. WGCNA: an R package for weighted correlationnetwork analysis. BMC Bioinformatics. 2008;9(1):559. https://doi.org/10.1186/1471-2105-9-559.
18. Hou J, Wang Z, Li H, Zhang H, Luo L. Gene signature and identification ofclinical trait-related m (6) a regulators in pancreatic Cancer. Front Genet.2020;11:522. https://doi.org/10.3389/fgene.2020.00522.
19. Meng Z, Yuan Q, Zhao J, Wang B, Li S, Offringa R, et al. The m (6) A-relatedmRNA signature predicts the prognosis of pancreatic Cancer patients. MolTher Oncolytics. 2020;17:460–70. https://doi.org/10.1016/j.omto.2020.04.011.
20. Meng Z, Ren D, Zhang K, Zhao J, Jin X, Wu H. Using ESTIMATE algorithm toestablish an 8-mRNA signature prognosis prediction system and identifyimmunocyte infiltration-related genes in pancreatic adenocarcinoma. Aging(Albany NY). 2020;12(6):5048–70. https://doi.org/10.18632/aging.102931.
21. Wu C, Wu Z, Tian B. Five gene signatures were identified in the predictionof overall survival in resectable pancreatic cancer. BMC Surg. 2020;20(1):207.https://doi.org/10.1186/s12893-020-00856-y.
22. Wu M, Li X, Liu R, Yuan H, Liu W, Liu Z. Development and validation of ametastasis-related gene signature for predicting the overall survival inpatients with pancreatic ductal adenocarcinoma. J Cancer. 2020;11(21):6299–318. https://doi.org/10.7150/jca.47629.
23. Yue P, Zhu C, Gao Y, Li Y, Wang Q, Zhang K, et al. Development of anautophagy-related signature in pancreatic adenocarcinoma. BiomedPharmacother. 2020;126:110080. https://doi.org/10.1016/j.biopha.2020.110080.
24. Zhou S, Yan Y, Chen X, Zeng S, Wei J, Wang X, et al. A two-gene-basedprognostic signature for pancreatic cancer. Aging (Albany NY). 2020;12(18):18322–42. https://doi.org/10.18632/aging.103698.
25. Deng Z, Li X, Shi Y, Lu Y, Yao W, Wang J. A novel autophagy-relatedIncRNAs signature for prognostic prediction and clinical value in patientswith pancreatic Cancer. Front Cell Dev Biol. 2020;8:606817. https://doi.org/10.3389/fcell.2020.606817.
26. Charoentong P, Finotello F, Angelova M, Mayer C, Efremova M, Rieder D,et al. Pan-cancer Immunogenomic analyses reveal genotype-
Liu et al. BMC Cancer (2021) 21:335 Page 14 of 15

Immunophenotype relationships and predictors of response to checkpointblockade. Cell Rep. 2017;18(1):248–62. https://doi.org/10.1016/j.celrep.2016.12.019.
27. Cicenas J, Kvederaviciute K, Meskinyte I, Meskinyte-Kausiliene E, SkeberdyteA, Cicenas J. KRAS, TP53, CDKN2A, SMAD4, BRCA1, and BRCA2 mutations inpancreatic cancer. Cancers. 2017;9(5):42.
28. Levy N, Yonish-Rouach E, Oren M, Kimchi A. Complementation by wild-typep53 of interleukin-6 effects on M1 cells: induction of cell cycle exit andcooperativity with c-myc suppression. Mol Cell Biol. 1993;13(12):7942–52.https://doi.org/10.1128/MCB.13.12.7942.
29. Morton JP, Timpson P, Karim SA, Ridgway RA, Athineos D, Doyle B, et al.Mutant p53 drives metastasis and overcomes growth arrest/senescence inpancreatic cancer. Proc Natl Acad Sci U S A. 2010;107(1):246–51. https://doi.org/10.1073/pnas.0908428107.
30. Kanda M, Sadakari Y, Borges M, Topazian M, Farrell J, Syngal S, et al. MutantTP53 in duodenal samples of pancreatic juice from patients with pancreaticcancer or high-grade dysplasia. Clin Gastroenterol Hepatol. 2013;11(6):719–730.e715.
31. Ormanns S, Siveke JT, Heinemann V, Haas M, Sipos B, Schlitter AM, et al.pERK, pAKT and p53 as tissue biomarkers in erlotinib-treated patients withadvanced pancreatic cancer: a translational subgroup analysis from AIO-PK0104. BMC Cancer. 2014;14(1):624. https://doi.org/10.1186/1471-2407-14-624.
32. Kahlert C, Melo SA, Protopopov A, Tang J, Seth S, Koch M, et al.Identification of double-stranded genomic DNA spanning all chromosomeswith mutated KRAS and p53 DNA in the serum exosomes of patients withpancreatic cancer. J Biol Chem. 2014;289(7):3869–75. https://doi.org/10.1074/jbc.C113.532267.
33. Lu X, Xu T, Qian J, Wen X, Wu D. Detecting K-ras and p53 gene mutationfrom stool and pancreatic juice for diagnosis of early pancreatic cancer.Chin Med J. 2002;115(11):1632–6.
34. Mukherjee I, Powell B, Parianos M, Downs D, Ross SB. Available technologiesand clinical applications of targeted chemotherapy in pancreatic cancer.Cancer Genet. 2016;209(12):582–91. https://doi.org/10.1016/j.cancergen.2016.08.001.
35. Cairns J, Fridley BL, Jenkins GD, Zhuang Y, Yu J, Wang L. Differential roles ofERRFI1 in EGFR and AKT pathway regulation affect cancer proliferation.EMBO Rep. 2018;19(3):e44767.
36. Yu Y, Chen Q. Long noncoding RNA ANRIL promotes the malignantprogression of cholangiocarcinoma by epigenetically repressing ERRFI1expression. Cancer Sci. 2020;111(7):2297–309.
37. Migliore C, Morando E, Ghiso E, Anastasi S, Leoni VP, Apicella M, et al. miR-205 mediates adaptive resistance to MET inhibition via ERRFI1 targeting andraised EGFR signaling. EMBO Mol Med. 2018;10(9):e8746.
38. Heo TH, Wahler J, Suh N. Potential therapeutic implications of IL-6/IL-6R/gp130-targeting agents in breast cancer. Oncotarget. 2016;7(13):15460–73.https://doi.org/10.18632/oncotarget.7102.
39. Høgdall D, O'Rourke CJ, Dehlendorff C, Larsen OF, Jensen LH, Johansen AZ,et al. Serum IL6 as a prognostic biomarker and IL6R as a therapeutic targetin biliary tract cancers. Clin Cancer Res. 2020;26(21):5655–67. https://doi.org/10.1158/1078-0432.CCR-19-2700.
40. Colomiere M, Ward AC, Riley C, Trenerry MK, Cameron-Smith D, Findlay J,et al. Cross talk of signals between EGFR and IL-6R through JAK2/STAT3mediate epithelial-mesenchymal transition in ovarian carcinomas. Br JCancer. 2009;100(1):134–44. https://doi.org/10.1038/sj.bjc.6604794.
41. Zhu X, Shen H, Yin X, Long L, Chen X, Feng F, et al. IL-6R/STAT3/miR-204feedback loop contributes to cisplatin resistance of epithelial ovarian cancercells. Oncotarget. 2017;8(24):39154–66. https://doi.org/10.18632/oncotarget.16610.
42. Nagy A, Banyai D, Semjen D, Beothe T, Kovacs G. Sciellin is a marker forpapillary renal cell tumours. Virchows Archiv. 2015;467(6):695–700. https://doi.org/10.1007/s00428-015-1856-y.
43. Chou CK, Fan CC, Lin PS, Liao PY, Tung JC, Hsieh CH, et al. Sciellin mediatesmesenchymal-to-epithelial transition in colorectal cancer hepatic metastasis.Oncotarget. 2016;7(18):25742–54. https://doi.org/10.18632/oncotarget.8264.
44. Breslin A, Denniss FA, Guinn BA. SSX2IP: an emerging role in cancer.Biochem Biophys Res Commun. 2007;363(3):462–5. https://doi.org/10.1016/j.bbrc.2007.09.052.
45. Guinn B, Greiner J, Schmitt M, Mills KI. Elevated expression of the leukemia-associated antigen SSX2IP predicts survival in acute myeloid leukemia
patients who lack detectable cytogenetic rearrangements. Blood. 2009;113(5):1203–4. https://doi.org/10.1182/blood-2008-09-178848.
46. Li P, Lin Y, Zhang Y, Zhu Z, Huo K. SSX2IP promotes metastasis andchemotherapeutic resistance of hepatocellular carcinoma. J Transl Med.2013;11(1):52. https://doi.org/10.1186/1479-5876-11-52.
47. Chang SL, Lee SW, Yang SF, Chien CC, Chan TC, Chen TJ, et al. Expressionand prognostic utility of SSX2IP in patients with nasopharyngeal carcinoma.APMIS. 2020;128(4):287–97. https://doi.org/10.1111/apm.13023.
Publisher’s NoteSpringer Nature remains neutral with regard to jurisdictional claims inpublished maps and institutional affiliations.
Liu et al. BMC Cancer (2021) 21:335 Page 15 of 15


![Development and validation of a nomogram to predict ......traditional CHD risk factors (e.g., [7], hypertension disease activity [8], smoking [9] and dyslipidemia [10]) are more prevalent](https://img.pdfslide.us/doc/110x75/60264c2281eac22170243e67/development-and-validation-of-a-nomogram-to-predict-traditional-chd-risk.jpg)