Embed Size (px)
Citation preview

A Novel TCEP Removal Method for
the Synthesis of Site-specific Antibody
Drug Conjugates
By:
Sadie Alperson
A thesis submitted to Johns Hopkins University in conformity with the requirements for the degree of Master of Science in Engineering
© 2018 Sadie Alperson All Rights Reserved

Abstract
Antibody drug conjugates (ADCs) are an emerging class of biopharmaceutical drug
designed to treat cancer. They are comprised of monoclonal antibodies (mAbs) which are
conjugated (linked) to potent drugs. The monoclonal antibodies provide high levels of
specificity and are responsible for identifying and binding to antigens present on cancerous
cells. After binding, antibody drug conjugate complexes are internalized by the cell. Once
inside, the drug is released and the cell is killed. Thus, antibody drug conjugates are
designed to kill only cancerous cells, leaving healthy tissue largely unaffected. This is very
different from traditional chemotherapy methods that non discriminately kill both rapidly
dividing cancerous and healthy cells causing many side effects.
Currently, the synthesis of antibody drug conjugates requires many steps and is
time consuming. For the purposes of this project, we focused on one specific synthesis step
in the process called dialysis. During the synthesis process, the mAb must be reduced using
a small molecule called Tris(2carboxyethyl)phosphine hydrochloride (TCEP). After
reduction, TCEP is no longer necessary, but still in solution with the mAb. In order to
successfully make antibody drug conjugates, this TCEP must be separated from the mAb.
The current process to do this on a laboratory scale setting is called dialysis. Dialysis
exploits the size difference between TCEP and mAb to achieve separation. We have
identified this as one of the longest steps in the synthesis process.
We hypothesized that we can use column chromatography in flow through mode as
an alternative method to separate TCEP from mAb – TCEP mixtures. This method also
exploits the size difference between TCEP and mAb to achieve separation. We tested
microporous resins that allow small molecules like TCEP, but not large molecules like mAb
to enter the pores. After identifying top performing resins, we went through the ADC
synthesis process but implemented chromatography instead of dialysis. We concluded
that this new method does remove TCEP from solution and is a promising alternative to
dialysis.
ii

Table of Contents
Abstract ...................................................................................................................................................................... i
Introduction ............................................................................................................................................................ 1
Experimental Methods ........................................................................................................................................ 7
Results .................................................................................................................................................................... 15
Discussion ............................................................................................................................................................. 24
Conclusion............................................................................................................................................................. 27
References ............................................................................................................................................................ 29
Appendix A: Methods - Dynamic Binding Capacity of TCEP ............................................................. 31
Appendix B: Methods - Dynamic Binding Capacity of TCEP Using Microporous Resins ....... 33
Appendix C: Methods - Dynamic Binding Capacity of mAb1............................................................. 35
Appendix D: Methods – ADC Synthesis RPHPLC Conditions ............................................................. 37
Appendix E: Methods – ADC Synthesis with Column Chromatography ....................................... 38
Appendix F: Methods - ADC Synthesis with Column Chromatography and no Sample
Concentration ...................................................................................................................................................... 40
Appendix G: Results - Dynamic Binding Capacity of TCEP ................................................................ 42
Appendix H: Results - Dynamic Binding Capacity of TCEP Using Microporous Resins .......... 44
Appendix I: Results - Dynamic Binding Capacity of mAb1 ................................................................ 46
Appendix J: Results – ADC Synthesis with Column Chromatography ........................................... 48
Appendix K: Results – ADC Synthesis with Column Chromatography and no Sample
Concentration ...................................................................................................................................................... 50
Resume ................................................................................................................................................................... 51
iii

Introduction
Antibody drug conjugates (ADCs) are an important class of cancer therapeutic.
These molecules are made up of three components, a monoclonal antibody (mAb), a drug
and a linker.1 They have a highly specific mechanism of action, and are designed so that
treatment is localized at the site of the tumor, while healthy tissue is largely unaffected.
This is very different from the current standard of non selective chemotherapy, which
kills rapidly dividing cells, regardless of whether they are cancerous or not.
Currently, the synthesis of antibody drug conjugates is a lengthy multi – step
process. In this project, we focused on one step of the process called dialysis. This step
is used to purify and separate the mAb from a small molecule called
Tris(2carboxyethyl)phosphine hydrochloride (TCEP) and is necessary for optimal ADC
synthesis. Our project investigates whether an alternative, more efficient method called
column chromatography in flow through mode can achieve comparable results.
Antibody Drug Conjugates
Antibody drug conjugates are comprised
of three components, a monoclonal antibody
(mAb), a drug and a linker.1 (Figure 1) The mAb
is responsible for finding and binding to specific
antigens expressed on cancer cells. The drug is a
cytotoxic agent designed to kill cancer cells.
Finally, the linker is responsible for attaching
the antibody to the drug.
Figure 1: Antibody drug conjugate structure: antibody, linker and drug 2
1

ADC Mechanism of Action
Antibody drug conjugates are designed to kill cancer cells specifically at tumor sites.
Initially, ADC’s are released into the body and circulate until mAbs identify and bind to an
antigen receptor expressed on a cancer cell.3 (Figure 2) After binding, the ADC complex
undergoes receptor – mediated endocytosis and enters the cell. Once inside the cell, the
antibody and linker are degraded by the lysosome. Concurrently, the drug is released into
the cell and causes cell death. Other cancer cells in the vicinity may also be killed through a
process called the bystander effect.4 The mechanism of cancer cell death is dependent on
drug type. There are two very prevalent types of drug.5 The first blocks tubulin assembly,
which in turn prevents cell replication. The second binds to and damages DNA.
Figure 2: Antibody drug conjugate mechanism of action 6
ADC Synthesis
This project involves a class of ADCs known as a site – specific antibody drug
conjugates. With this type of ADC, drug load and conjugation site are specified. During the
synthesis process, a cysteine is engineered into the mAb. 7 This cysteine is capped with
2

glutathione via a disulfide bond during expression. However, we need to attach the mAb to
the linker and drug at this engineered cysteine site. Thus, the glutathione cap must be
removed. The process to do this is called reduction. (Figure 3) Figure 3: Antibody drug conjugate synthesis, reduction of disulfide bonds2
Currently, reduction is performed using a small
molecule called Tris(2carboxyethyl)phosphine
hydrochloride (TCEP). (Figure 4) The purpose of
reduction is to remove the glutathione cap from
cysteine. This is done by reducing disulfide bonds and
introducing free thiol groups.7 (Figure 5) The
antibody is then attached to the linker and drug at Figure 4: TCEP structure 8
these free thiol groups.
Figure 5: Reduction of disulfide bridges with TCEP 9
However, after reduction, TCEP is no longer necessary, but still in solution with the
mAb. In the subsequent synthesis steps, the presence of TCEP causes unwanted side
3

reactions and results in lower conjugation efficiency. Thus, it is important to remove TCEP
from the mAb-TCEP solution. The current process to do this and focus of our project is
called dialysis.
Dialysis removes TCEP from the sample and also dilutes it with buffer. For
example, it is common for mAb concentration to go from 10 mg/ml to 5 mg/ml during this
process. To get back to the initial concentration we have to concentrate the sample. After
this, the mAb undergoes reoxidation of disulfide bridges. In the previous reduction step,
TCEP is used to reduce the disulfide bonds in the mAb to introduce free thiols. This is
necessary at the engineered cysteine site where we want to connect the linker and drug to
the mAb. However, in the process, other disulfide bonds in the mAb are also reduced
(Figure 6). To reform these bonds, the mAb must undergo oxidation. After oxidation, the
final step is conjugation, which attaches the linker and drug to the mAb.
Figure 6: ADC Synthesis: (A) antibody intermediate (B) antibody intermediate after reduction (C) antibody intermediate after sample concentration and controlled oxidation (D) antibody intermediate after thiol-selective payload conjugation2
4

Dialysis
For small scale synthesis of antibody drug conjugates, dialysis is used to remove
TCEP from mAb-TCEP solutions. This separation method exploits the size difference
between TCEP and mAbs. For reference, TCEP is 287 grams/mole while the mAb is 210,000
grams/mole. Dialysis involves placing the mAb-TCEP sample in a semi – permeable dialysis
membrane, which is then placed in buffer. The small TCEP molecules diffuse out of the
membrane while the mAb remains inside and separation is achieved.10
These dialysis membranes are characterized by their molecular-weight cutoff
(MWCO). The MWCO is the smallest average molecular mass of a standard molecule that
will not effectively diffuse across the membrane. For example, a membrane with a 3K
MWCO generally retains >90% of a protein with a molecular mass of at least 3 kDA or
3,000 grams/mol. Thus, we can use the molecular weights of TCEP and mAb to determine a
MWCO that will ensure maximum separation. Currently, the dialysis process takes ~6+
hours.
Chromatography
We believe we can use column chromatography in flow through mode as an
alternative method to separate TCEP from mAb-TCEP solutions. In this process, a
chromatographic column is packed with a resin. This resin contains beads and these beads
contain pores. For efficient separation, we require a resin with beads that will retain TCEP.
Furthermore, the pores of these beads need to be small enough that the mAb cannot enter,
and instead must go around.11 Thus, separation is achieved. (Figure 7)
5

Figure 7: Separation using microporous resins (A) The mAb-TCEP sample is placed into a column filled with microporous resin (B) TCEP molecules become trapped in the beads while the mAb is too large to enter (C) mAb-TCEP separation is achieved12
We are primarily interested in microporous anion exchange resins. According to the
manufacturer, these resins generally have a microporosity less than 30 Angstroms.
Furthermore, these resins carry a positive charge. We believe that negatively charged TCEP
molecules will bind to these resins at a high degree, while the mAb will not. Furthermore, we
believe this process will take ~1 hour, which is substantially less than dialysis.
Dynamic Binding Capacity (DBC)
In order to achieve efficient separation, we must identify chromatographic resins
that bind to TCEP but don’t bind to our mAb. We use dynamic binding capacity (DBC) to
measure this property. This is the binding capacity under operating conditions (i.e. in
column under specified conditions) and is defined as the amount of target molecule that
binds to the medium (resin) under given flow conditions before a significant
breakthrough of molecule occurs.13 For our process, we require a resin with a high binding
capacity for TCEP but low binding capacity for mAb.
6

Experimental Methods
Dynamic Binding Capacity of TCEP
Initial experiments were carried out to test the dynamic binding capacity of TCEP
on multiple resins. All experiments were carried out using an AKTA Pure, GE Healthcare.
Uv-vis measurements on the AKTA Pure were taken at 195 nm. All experiments were
performed using Omnifit columns, Diba Industries. All resins were manufactured by Dow
Chemical. TCEP was prepared in a 20mM Phosphate Buffer.
Control
For this experiment, the system was on bypass mode and the sample did not
pass through a column. The method conditions and buffers are as follows:
Sample/Buffer Volume (mL) Flow rate (ml/min)
Equilibration 20 mM Phosphate 10 2
Sample Load 2 mM TCEP 10 2
Equilibration 20 mM Phosphate 8 2
7

Amberlite FPX 66
A 1.6 ml column was packed with Amberlite FPX 66 resin, a macroporous non-
functionalized adsorbent.14 The method conditions and buffers are as follows.
Sample/Buffer Column Volume Flow rate (ml/min)
Equilibration 20 mM Phosphate 10 2
Sample Load 2 mM TCEP 30 2
Regeneration 2% Methanol 10 .5
Column wash Water for injection (WFI) 5 .5
*1 Column volume = 1.6 ml
Similar experiments were performed using Amberlite FPA 98Cl, Amberlite XAD 7HP,
and Dowex 1x4.15, 16, 17 Method conditions and buffers can be found in Appendix A.
Dynamic Binding Capacity of TCEP Using Microporous Resins
Further experiments were carried out to test the dynamic binding capacity of TCEP
on microporous resins at multiple pH levels. All experiments were carried out using an
AKTA Pure, GE Healthcare. Uv-vis measurements on the AKTA Pure were taken at 195 nm.
All experiments were performed using Omnifit columns, Diba Industries.
Dowex 1x4, Dowex 1x8 and Dowex Marathon A2 resin were manufactured by Dow
Chemical.17. 18 Experiments with these resins were performed at pH 6, 6.5 and 7. Diaion
SK1B resin was manufactured by Mitsubishi Chemical Corporation.19 Experiments with
this resin were performed at pH 7. pH adjustments were made using 1M Tris and 6N HCl
buffer. TCEP was prepared in a 20mM Phosphate Buffer.
8

Dowex 1x4
A 1.9 ml column was packed with Dowex 1x4 resin. The method conditions
and buffers are as follows.
Sample/Buffer Column Volume Flow rate (ml/min)
Equilibration 20 mM Phosphate 10 2
Sample Load 2 mM TCEP 5.32 2
Equilibration 20 mM Phosphate 10 2
Regeneration .1 N NaOH 5 1.31
Column wash 20 mM Phosphate 5 .4
*1 Column volume = 1.9 ml
Method conditions and buffers for experiments using Dowex 1x8, Dowex Marathon
A2 and Diaion SK1B can be found in Appendix B.
Dynamic Binding Capacity of mAb1
Experiments were carried out to test the dynamic binding capacity of mAb1 on
microporous resins at multiple pH levels . All experiments were carried out using an
AKTA Pure, GE Healthcare. Uv-vis measurements on the AKTA Pure were taken at 280 nm.
All experiments were performed using Omnifit columns, Diba Industries.
Experiments with Dowex 1x4, Dowex 1x8 and Dowex Marathon A2 resin were
performed at pH 6, 6.5 and 7. The experiment with Diaion SK1B resin was performed at pH
7. The control experiment was performed at pH 7. pH adjustments were made using 1M
Tris and 1N Acetic Acid buffer. TCEP was prepared in a 20mM Phosphate Buffer.
9

Control
For this experiment, the system was on bypass mode and the sample did not
pass through a column. The method conditions and buffers are as follows.
Sample/Buffer Volume (mL) Flow rate (ml/min)
Equilibration 20 mM Phosphate 10 1.31
Sample Load 5 mg/ml mAb1 2 .3
Equilibration 20 mM Phosphate 10 1.31
Dowex 1x4
A 1.9 ml column was packed with Dowex 1x4. The method conditions and buffers
are as follows.
For pH 7 and 6.5
Sample/Buffer Column Volume Flow rate (ml/min)
Equilibration 20 mM Phosphate 10 1.31
Sample Load 5.66 mg/ml mAb1 1 .3
Equilibration 20 mM Phosphate 10 1.31
Regeneration .1 N NaOH 5 1.31
Column Wash 20 mM Phosphate 5 1.31
*1 Column volume = 1.9 ml
10

For pH 6
Sample/Buffer Column Volume Flow rate (ml/min)
Equilibration 20 mM Phosphate 10 1.31
Sample Load 4.53 mg/ml mAb1 1.2 .3
Equilibration 20 mM Phosphate 10 1.31
Regeneration .1 N NaOH 5 1.31
Column Wash 20 mM Phosphate 5 1.31
*1 Column volume = 1.9 ml
Method conditions and buffers for experiments using Dowex 1x8, Dowex Marathon
A2 and Diaion SK1B can be found in Appendix C.
Dynamic Binding Capacity of TCEP-mAb1 Solution
An experiment was carried out to test the dynamic binding capacity of a TCEP-
mAb1solution on Dowex 1x4 resin. This experiment was carried out using an AKTA Pure,
GE Healthcare. Uv-vis measurements on the AKTA Pure were taken at 195 nm and 280 nm.
This experiment was performed using an Omnifit column, Diba Industries packed with 1.9
ml of resin. This experiment was run at pH 6.5 and pH adjustments were made with 1M
Acetic Acid. TCEP was prepared in a 20mM Phosphate Buffer.
11

Sample/Buffer Column Volume Flow rate (ml/min)
Equilibration 20 mM Phosphate 10 1.31
Sample Load 4.44 mg/ml mAb1, 2mM TCEP 1.2 .3
Equilibration 20 mM Phosphate 10 1.31
Regeneration .1 N NaOH 5 1.31
Column Wash 20 mM Phosphate 5 1.31
*1 Column volume = 1.9 ml
ADC Synthesis
A final experiment synthesizing the antibody drug conjugate was performed to test
the success of column chromatography as an alternative to dialysis.
Control experiments:
A control experiment was performed using the current ADC synthesis method, as
described below. A negative control experiment was also performed following the
method described below. However, during the negative control, the sample did not
undergo the dialysis and sample concentration steps.
1. Antibody preparation
mAb1 stock protein at 20 mg/ml was diluted to 10 mg/ml with 1X PBS, pH 7.2. Then the
pH was adjusted to 6.8 - 7.2 with 1M Tris buffer.
12

2. Reduction
TCEP was added to the solution at 40 mole equivalents of TCEP to 1 mole of antibody.
The pH was adjusted to 6.5 - 7 with 1M Tris buffer. After, the solution was stirred at
room temperature for two hours.
3. Dialysis
The sample was filtered using a .2 um PES membrane, ThermoFisher Scientific and transferred to a 10K Slide-A-Lyzer Dialysis Cassette, ThermoFisher Scientific . Then, the membrane was transferred to 1X PBS, pH 7.2 buffer. The solution was stirred at 4 ℃ for three hours and then the membrane was transferred to new solution of 1X PBS, pH 7.2 buffer. This new solution was stirred at 4 ℃ overnight.
4. Sample concentration
The sample was removed from the membrane and filtered using a .2 um PES
membrane, ThermoFisher Scientific. It was then concentrated to 10 mg/ml using
a Vivaspin 6 MWCO 10000 Sample Concentrator, GE Healthcare.
5. Oxidation
DHAA was added to the solution at 20 mole equivalents of DHAA to 1 mole of antibody.
The solution was stirred for three hours at room temperature.
6. Conjugation
DMSO was added to the solution at 10% of the conjugation volume. The payload
was added to the solution at 7.5 mole equivalents of payload to 1 mole of antibody.
The solution was stirred for one hour at room temperature.
7. Quenching of conjugation
N-acetyl Cysteine (NAc) was added to the solution at 4 mole equivalents of NAc to 1 mole
of drug-linker. This solution was stirred for thirty minutes at room temperature. The
sample was filtered using a .2 um PES membrane, ThermoFisher Scientific.
13

8. Analysis
Analysis of the sample was performed using reverse phase high performance liquid
chromatography on an Agilent system. See Appendix D for method specifications.
ADC Synthesis with Column Chromatography
This experiment followed the same procedure as the control, however, the dialysis
step was replaced with a column chromatography step. Method conditions and buffers
for experiments with Dowex 1x4, Dowex 1x8, Dowex Marathon A2, Diaion SK1B and the
control can be found in Appendix E.
ADC Synthesis with Column Chromatography and no Sample Concentration
Negative Control without sample concentration
This experiment generally followed the same procedure as the control described
above however there were three changes.
1. In the sample preparation step mAb1 was diluted to 5 mg/ml 2. The dialysis step was removed 3. The sample concentration step was removed.
Column chromatography without sample concentration
This experiment generally followed the same procedure as the control described
above however there were three changes.
1. In the sample preparation step mAb1 was diluted to 5 mg/ml 2. The dialysis step was replaced with a column chromatography step 3. The sample concentration step was removed.
Method conditions and buffers for experiments with Dowex 1x8, Dowex Marathon
A2, Diaion SK1B and the control can be found in Appendix F.
14

Results
The results from the AKTA Pure and Agilent system came in the form of
chromatograms. Data from the AKTA Pure indicated the dynamic binding capacity of TCEP,
mAb1 and mAb1-TCEP mixtures while data from the Agilent showed successful vs failed
ADC synthesis.
Dynamic Binding Capacity of TCEP
Generally, a numerical amount of binding is determined by finding sample
concentration using the Beer-Lambert Law,
A = ɛCL,
A = absorbance
ɛ = molar extinction
coefficient C = concentration L = path length
However, in this case, the molar extinction coefficient of TCEP was unknown. As an
alternative method of identifying whether TCEP was binding to the resins, we used the
control experiment as a baseline. The control indicated the maximum absorbance increase
of the system (UV detector) if no binding occurred. After adding 10 ml of 2 mM TCEP we
found this value to be 500 mAU Thus, if the maximum absorbance increase of a resin is
near 500 mAU then we know it is not binding to TCEP.
15

Figure 8: Chromatogram of control, TCEP, maximum absorbance increase of 500 mAU
Using the results from the control experiment, and Table 1, it is clear that Amberlite
FPX66 and Amberlite XAD 7HP did not bind to TCEP. While the maximum absorbance
increase using these resins was higher than the control, we assumed they were within the
margin of error for this experiment. Amberlite FPA 98Cl bound to TCEP more tightly than
Amberlite FPX66 and Amberlite FPA 98Cl, however, the binding was still not considered
strong. Dowex 1x4 resin outperformed all other resins and bound tightly to TCEP.
Table 1: Maximum Absorbance Increase of Amberlite and Dowex Resins (TCEP)
Maximum Absorbance Increase
Amount of 2 mM TCEP added
Resin to reach maximum (mAU)
absorbance increase (ml)
Amberlite FPX 66 575 13
Amberlite FPA 98Cl 275 24
Amberlite XAD 7HP 550 13
Dowex 1x4 80 47
* See Appendix G for these results in chromatogram form
16

Dynamic Binding Capacity of TCEP Using Microporous Resins
For this experiment, the dynamic binding capacity of TCEP with Dowex 1x4,
Dowex 1x8, Dowex Marathon A2 and Diaion SK1B was tested. 10 ml of 2 mM TCEP was
added to each resin. Similarly to the previous experiment, these results were compared to
the control to determine whether TCEP bound.
At pH 7, Dowex 1x8 appeared to bind the tightest to TCEP followed by Dowex 1x4
and then Dowex Marathon A2. (Table 2) The same pattern followed for pH 6.5. At pH 6
Dowex Marathon A2 appeared to have the strongest binding to TCEP while Dowex 1x4 and
Dowex 1x8 were tied. However, once again, there was a margin of error for these
experiments and a definitive ranking could not be made. Ultimately, the take away from
this is that all three resins tested bound tightly to TCEP at pH 7, 6.5 and 6.
At pH 7, the maximum absorbance increase of Diaion SK1B was 450 mAU. While
this was lower than the control result of 500 mAU, we assumed it was within the margin of
error and concluded Diaion SK1B did not bind to TCEP.
Table 2: Maximum Absorbance Increase of Dowex and Diaion Resins (TCEP)
Resin pH Maximum Absorbance Increase (mAU)
Dowex 1x4 7 100
6.5 70
6 60
Dowex 1x8 7 75
6.5 25
6 60
Dowex Marathon A2 7 125
6.5 110
6 40
Diaion SK1B 7 450
*See Appendix H for these results in chromatogram form
17

Dynamic Binding Capacity of mAb1
To ensure separation of TCEP and mAb1, TCEP must bind to the resin in the column,
while mAb1 flows through. For this experiment, we determined the dynamic binding
capacity of mAb1 using the microporous resins. Once again, a control was used to
determine the maximum absorbance increase of the system (UV detector) after adding 10
mg of mAb1to the system if no binding occurred. We found this value to be 900 mAU.
Figure 9: Chromatogram of control, mAb1, maximum absorbance increase of 900 mAU
For this experiment, 10 mg of mAb1 was added to four separate columns with
Dowex 1x4, Dowex 1x8, Dowex Marathon A2 and Diaion SK1B. The protein did not bind to
the Dowex resins at pH 7, 6.5 or 6. (Table 3) Similarly, it also did not bind to Diaion SK1B
at pH 7. While the maximum absorbance increase did not always reach 900 mAU, the
results were within the margin of error to conclude there was no binding.
18
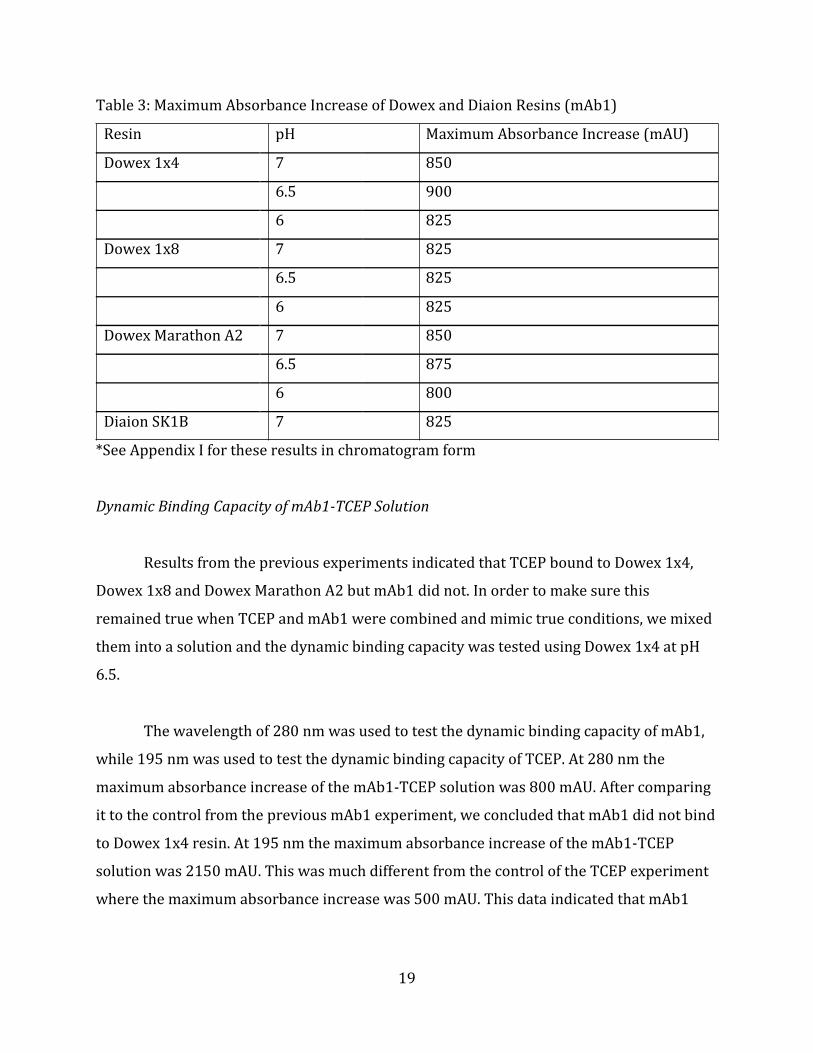
Table 3: Maximum Absorbance Increase of Dowex and Diaion Resins (mAb1)
Resin pH Maximum Absorbance Increase (mAU)
Dowex 1x4 7 850
6.5 900
6 825
Dowex 1x8 7 825
6.5 825
6 825
Dowex Marathon A2 7 850
6.5 875
6 800
Diaion SK1B 7 825
*See Appendix I for these results in chromatogram form
Dynamic Binding Capacity of mAb1-TCEP Solution
Results from the previous experiments indicated that TCEP bound to Dowex 1x4,
Dowex 1x8 and Dowex Marathon A2 but mAb1 did not. In order to make sure this
remained true when TCEP and mAb1 were combined and mimic true conditions, we mixed
them into a solution and the dynamic binding capacity was tested using Dowex 1x4 at pH
6.5.
The wavelength of 280 nm was used to test the dynamic binding capacity of mAb1,
while 195 nm was used to test the dynamic binding capacity of TCEP. At 280 nm the
maximum absorbance increase of the mAb1-TCEP solution was 800 mAU. After comparing
it to the control from the previous mAb1 experiment, we concluded that mAb1 did not bind
to Dowex 1x4 resin. At 195 nm the maximum absorbance increase of the mAb1-TCEP
solution was 2150 mAU. This was much different from the control of the TCEP experiment
where the maximum absorbance increase was 500 mAU. This data indicated that mAb1
19

was also being detected at 195 nm so we could not conclude whether TCEP was binding
to Dowex 1x4.
Figure 10: Chromatogram of mAb1-TCEP, Dowex 1x4, maximum absorbance increase of 2150 (195 nm) and 800 (280 nm)
ADC Synthesis
In order to test whether column chromatography using microporous resins was a
feasible alternative to dialysis we had to go through the ADC synthesis process described
in the methods section. The steps included sample preparation, reduction, dialysis or
column chromatography, oxidation, conjugation, quenching of conjugation and analysis.
We first performed a control experiment and negative control. The control used the
current ADC synthesis method, and resulted in successful conjugation. The negative control
used the current ADC synthesis method without the dialysis step, and resulted in failed
conjugation. These conclusions were determined using chromatograms from RPHPLC.
20

DAD1A,Sig=280,16Ref=360,50(20171201CT2017-12-0417-10-22\007-D1F-A5-SadieControl.D)
Norm.
6
4
2
0
8 10 12 14 16 18 20 min
Figure 11: RPHPLC chromatogram of control - successful ADC synthesis, dialysis
DAD1A,Sig=280,16Ref=360,50(20171201CT2017-12-0417-10-22\010-D1F-A8-SadieNegativeControl.D)
Norm.
10
8
6
4
2
0
-2
8 10 12 14 16 18 20 min
Figure 12: RPHPLC chromatogram of negative control - unsuccessful ADC synthesis, no dialysis or chromatography
ADC Synthesis with Column Chromatography
After the control, we performed another experiment following the current ADC
synthesis method but implementing column chromatography instead of dialysis. These
experiments were performed using Dowex 1x4, Dowex 1x8, Dowex Marathon A2 and Diaion
SK1B. We compared these chromatograms to the control and negative control to determine
whether conjugation was successful or not. For example, the results with Dowex 1x4 looked
similar to the control, so we concluded synthesis was successful. (Figure 13)
21

The same was true for experiments with Dowex 1x8, Dowex Marathon A2 and Diaion SK1B.
See Appendix J for chromatograms.
DAD1A,Sig=280,16Ref=360,50(RTB_08Dec172017-12-0814-22-34\005-D1F-A3-DowexFM.D)
mAU
10
8
6
4
2
0
8 10 12 14 16 18 20 min
Figure 13: RPHPLC chromatogram - successful ADC synthesis, chromatography, Dowex 1x4
ADC Synthesis with Column Chromatography and no Sample Concentration
We first performed a negative control*. This experiment followed the same
procedure as the control experiment described in the previous section but we removed
the dialysis and sample concentration steps. We compared this chromatogram to the one
from the previous control experiment and concluded the negative control* resulted in a
failed conjugation.
22
DAD1A,Sig=280,16Ref=360,50(RTB_14Dec172017-12-1409-36-15\006-D1F-A4-Control.D)
mAU
10
8
6
4
2
0
8 10 12 14 16 18 20 min
Figure 14: RPHPLC chromatogram of negative control* - unsuccessful ADC synthesis, no dialysis or chromatography
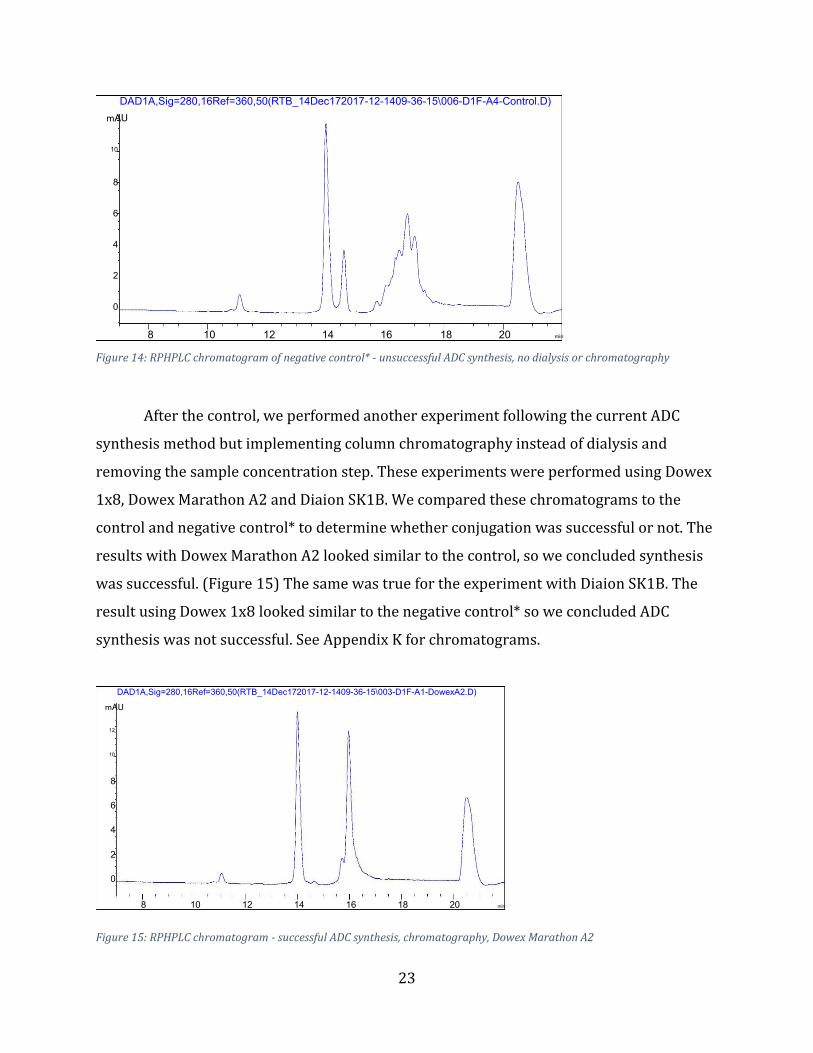
After the control, we performed another experiment following the current ADC
synthesis method but implementing column chromatography instead of dialysis and
removing the sample concentration step. These experiments were performed using Dowex
1x8, Dowex Marathon A2 and Diaion SK1B. We compared these chromatograms to the
control and negative control* to determine whether conjugation was successful or not. The
results with Dowex Marathon A2 looked similar to the control, so we concluded synthesis
was successful. (Figure 15) The same was true for the experiment with Diaion SK1B. The
result using Dowex 1x8 looked similar to the negative control* so we concluded ADC
synthesis was not successful. See Appendix K for chromatograms.
DAD1A,Sig=280,16Ref=360,50(RTB_14Dec172017-12-1409-36-15\003-D1F-A1-DowexA2.D)
mAU
12
10
8
6
4
2
0
8 10 12 14 16 18 20 min
Figure 15: RPHPLC chromatogram - successful ADC synthesis, chromatography, Dowex Marathon A2
23

Discussion
The goal of this project was to implement column chromatography in flow
through for the removal of TCEP using microporous resins. In order to do this, we first
tested the dynamic binding capacity of TCEP. After selecting top performing resins, we
tested the dynamic binding capacity of mAb1. Next, we tested the dynamic binding
capacity of a mAb1-TCEP mixture. Finally, we performed antibody drug conjugate
synthesis while implementing column chromatography instead of dialysis.
Dynamic Binding Capacity of TCEP
We started by testing a variety of resins for their ability to bind to TCEP. The first
resin we tested was Amberlite FPX66. This is a macroporous adsorbent with an aromatic
polymer backbone. We found that this resin did not bind to TCEP, most likely because it’s
comprised of a hydrophobic backbone. Amberlite XAD 7HP, another macroporous resin
also did not bind to TCEP. This resin is moderately polar, with an acrylic resin backbone. Its
main uses are to remove non polar compounds from aqueous solutions and slightly polar
compounds from non-polar solvents. However, our TCEP solution did not meet these
conditions, thus the resin was unable to adsorb and remove TCEP.
Amberlite FPA 98Cl resin, is a macroporous strong base anion exchanger and did
show some binding capacity to TCEP. This makes sense because the TCEP solution was
negatively charged. Dowex 1x4 resin showed the largest amount of TCEP binding. Like
Amberlite FPA 98Cl, Dowex 1x4 is also a strong base anion exchanger. This resin is
classified as a microporous resin, while Amberlite FPA 98Cl is a macroporous resin. Dowex
1x4 probably bound more strongly to TCEP because its pores are smaller.
24

Dynamic Binding of TCEP Using Microporous Resins
After identifying Dowex 1x4 as the resin with the highest TCEP binding capacity,
we wanted to test the dynamic binding capacity of other similar resins. We chose Dowex
1x8 and Dowex Marathon A2, which are both micrporous strong anion exchangers. As a
negative control, we also tested Diaion SK1B, which is a microporous strong cation
exchanger.
At pH 7, 6.5 and 6 TCEP is expected to have a negative charge. This agrees with our
results because TCEP was able to bind to Dowex 1x4, Dowex 1x8 and Dowex Marathon A2,
which have positively charged functional groups. Conversely, it was not able to bind to
Diaion SK1B resin, which has a negatively charged functional group.
Generally, as the pH of the TCEP solution was lowered, the binding capacity
increased. Overall, for the anion exchange resins, it was clear that there was substantial
binding at all pH levels.
Dynamic Binding Capacity of mAb1
From the previous experiments, we determined that TCEP could bind to charged
microporous resins. To ensure separation, it was essential that our protein did not bind to
these resins. Consequently, we determined the dynamic binding capacity of mAb1 using
Dowex 1x4, Dowex 1x8, Dowex Marathon A2 and Diaion SK1B.
At pH 7, 6.5 and 6 mAb1 is expected to have a positive charge. This agrees with our
results because mAb1 did not bind to Dowex 1x4, Dowex 1x8 and Dowex Marathon A2,
which have positively charged functional groups. It also was not able to bind to Diaion
SK1B resin, even though it has a negatively charged functional group. This is because
Diaion SK1B is a microporous resins and its pores are too small for protein to enter.
25

Dynamic Binding Capacity of mAb1-TCEP Solution
Based on the experiments completed so far, TCEP appeared to bind to the
negatively charged microporous resins while mAb1 did not. We combined TCEP and mAb1
into a solution to mimic true conditions. This also allowed us to test whether the previous
results still held true after the two components were mixed.
We performed this experiment at pH 6.5 and used Dowex 1x4 resin. At this pH level
TCEP is expected to be negatively charged while mAb1 is expected to be positively charged.
At 280 nm, the wavelength used to measure proteins, we saw that mAb1 did not bind to the
resin while in solution. At 195 nm, the wavelength used to measure TCEP, we could not
determine whether TCEP was binding. We found that protein was also absorbed at 195 nm,
so the reading we got was of the mAb1-TCEP solution. However, we hypothesized that
TCEP was still binding.
ADC Synthesis using Column Chromatography
In order to determine whether column chromatography could separate TCEP and
mAb1 we performed ADC synthesis. For our control, we followed the current conjugation
method to demonstrate successful synthesis. For our negative control, we also used the
current conjugation method but removed the dialysis step. This showed us what an
unsuccessful synthesis looks like. Using RPHPLC, we compared the difference in
successful vs unsuccessful synthesis chromatograms.
We then tested our new method; this followed the current synthesis method but
replaced the dialysis step with column chromatography. We achieved successful synthesis
using Dowex 1x4, Dowex 1x8, Dowex Marathon A2 and Diaion SK1B. Based on the results
of our previous experiments, we expected this method to work with the Dowex resins.
However, in past experiments, Diaion SK1B did not bind to TCEP. We hypothesized that the
sample concentration step may have removed TCEP from the solution.
26

ADC Synthesis with Column Chromatography and no Sample Concentration
We performed another ADC synthesis experiment to test whether the
sample concentration step caused the successful results while using Diaion SK1B.
First we performed another negative control*, following the current synthesis
method while removing the dialysis and sample concentration steps. This showed
us what an unsuccessful conjugation looks like.
We then tested our new method; this followed the current synthesis method but
replaced the dialysis step with column chromatography and removed the sample
concentration step. We achieved successful synthesis using Dowex Marathon A2 and
Diaion SK1B. Synthesis was unsuccessful using Dowex 1x8 resin. These results did not
align with our hypothesis. We expected positive results with Dowex Marathon A2 and
Dowex 1x8, but negative results with Diaion SK1B. The most probable explanation for
these results is human error. There’s a possibility that the Dowex 1x8 and Diaion SK1B
resins were switched or mislabeled somewhere in the process. However, due to time
constraints we were unable to repeat this experiment.
Further experiments are needed to determine the cause of this discrepancy.
These experiments should be repeated in triplicate. Furthermore, experiments using this
procedure should be performed using Dowex 1x4. Regardless of this variability, we have
shown that microporous resins do remove TCEP from mAb1-TCEP solutions.
Conclusion
Overall, this project proved that TCEP removal using column chromatography in
flow through mode is possible. Our first experiment helped us identify resins with a
strong binding capacity to TCEP. Next, we performed experiments to ensure these resins
did not also bind to mAb1. Finally, we performed antibody drug conjugate synthesis to
test our new method. By achieving successful synthesis while implementing column
27

chromatography, we demonstrated this method is a promising alternative to dialysis. This
will be particularly interesting for high-throughput conjugation screening applications, as it
allows a rapid intermediate buffer exchange after the reduction step. As discussed in the
previous section, further experiments are still warranted to delineate robustness of the
method.
28

References
1. Dimasi N., Fleming R., Zhong H., Bezabeh B., Kinneer K., Christie R., Fazenbaker C., Wu H, and Gao C., Efficient Preparation of Site-Specific Antibody–Drug Conjugates Using Cysteine Insertion. Molecular Pharmaceutics, 2017 14 (5), 1501-1516, doi: 10.1021/acs.molpharmaceut.6b00995
2. This photo was obtained with permission from an employee at Medimmune. 3. Panowski, S., Bhakta, S., Raab, H., Polakis, P., & Junutula, J. R. Site-specific Antibody Drug
Conjugates for Cancer Therapy. mAbs, 2014, 6(1), 34–45, doi: 10.4161/mabs.27022 4. Staudacher A. Antibody Drug Conjugates and Bystander Killing: Is Antigen
Dependent Internalisation Required. British Journal of Cancer, 2017, 117, 1736 -174, doi:10.1038/bjc.2017.367
5. Chalouni C, Doll S. Fate of Antibody-Drug Conjugates in Cancer Cells. Journal of
Experimental & Clinical Cancer Research, 2018, 37(20), doi:10.1186/s13046-017-0667-1.
6. Carter PJ., Senter PD., Antibody-Drug Conjugates for Cancer Therapy. The Cancer Journal
2008. 14 (3), 154 – 169, doi: 10.1097/PPO.0b013e318172d704. Image reprinted with permission
7. Zhou Q. Site-Specific Antibody Conjugation for ADC and Beyond. Biomedicines, 2017,
5(4), 64, doi:10.3390/biomedicines5040064 8. This image was obtained from
https://www.sigmaaldrich.com/catalog/substance/tris2carboxyethylphosphinehydroc hloride286655180545911?lang=en®ion=US
9. This image was obtained from http://www.biosyn.com/tew/instruction-of-
reduction-reaction-using-tcep.aspx 10. This image was obtained from https://www.thermofisher.com/us/en/home/life-
science/protein-biology/protein-biology-learning-center/protein-biology-resource-library/pierce-protein-methods/dialysis-methods-protein-research.html
11. Walch N., Jungbauer A., Continuous Desalting of Refolded Protein Solution Improves
Capturing in Ion Exchange Chromatography: A Seamless Process. Biotechnology Journal 2017, 12(6), doi 10.1002/biot.201700082
12. This image was obtained from http://technologyinscience.blogspot.com/2011/09/gel-
filtration-chromatography-gf-size.html 13. Resins & Protein Binding Capacities. GE Life Sciences 2014
http://geproteinskills.blogspot.com/2014/10/resins-protein-binding-capacities.html
29

14. Amberlite FPX66 Dow https://www.dow.com/en-us/markets-and-solutions/products/AMBERLITEIonExchangeResinsandPolymericAdsorbents/AMBERL ITEFPX66
15. Amberlite FPA98Cl Dow https://www.dow.com/en-us/markets-and-
solutions/products/AMBERLITEIonExchangeResinsandPolymericAdsorbents/AMBERL ITEFPA98Cl
16. Amberlite XAD7HP Dow
http://msdssearch.dow.com/PublishedLiteratureDOWCOM/dh_08d2/0901b803808d2 eff.pdf?filepath=liquidseps/pdfs/noreg/177-03082.pdf&fromPage=GetDoc
17. Dowex Fine Mesh Spherical Ion Exchange Resins Dow
http://msdssearch.dow.com/PublishedLiteratureDOWCOM/dh_006f/0901b8038006f2 32.pdf?filepath=liquidseps/pdfs/noreg/177-01509.pdf&fromPage=GetDoc
18. Dowex Marathon A2 Dow
http://msdssearch.dow.com/PublishedLiteratureDOWCOM/dh_08cf/0901b803808cfc c0.pdf?filepath=liquidseps/pdfs/noreg/177-02270.pdf&fromPage=GetDoc
19. Diaion SK1B Mitsubishi Chemical
http://www.diaion.com/en/products/ion_exchange_resins/strongly_acidic_cation/dat
a_sheet_sk/sk1b.html
30

Appendix A: Methods - Dynamic Binding Capacity of TCEP
Amberlite FPA 98Cl
A 1.2 ml column was packed with FPA 98 Cl resin, a macroporous strong
anion exchanger. The method conditions and buffers are as follows.
Sample/Buffer Column Volume Flow rate (ml/min)
Equilibration 20 mM Phosphate 10 2
Sample Load 2 mM TCEP 20 2
Regeneration 10% NaCl, 4% NaOH 10 .3
Column wash Water for injection (WFI) 10 .5
*1 Column volume = 1.2 ml
Amberlite XAD 7HP
A 1.4 ml column was packed with Amberlite XAD 7HP resin, a macroporous
non functionalized adsorbent. The method conditions and buffers are as follows.
Sample/Buffer Column Volume Flow rate (ml/min)
Equilibration 20 mM Phosphate 10 2
Sample Load 2 mM TCEP 30 2
Regeneration .1 N NaOH 10 .5
Column wash Water for injection (WFI) 10 .5
*1 Column volume = 1.4 ml
31

Dowex 1x4
A 1.9 ml column was packed with Dowex 1x4 resin, a microporous strong
anion exchanger. The method conditions and buffers are as follows.
Sample/Buffer Column Volume Flow rate (ml/min)
Equilibration 20 mM Phosphate 10 2
Sample Load 2 mM TCEP 25 2
Elution 1M NaCl 15 2
Regeneration 10% NaCl, 4% NaOH 15 .5
Column wash Water for injection (WFI) 10 .4
*1 Column volume = 1.9 ml
32

Appendix B: Methods - Dynamic Binding Capacity of TCEP
Using Microporous Resins
Dowex 1x8
A 1.4 ml column was packed with Dowex 1x8 resin, a microporous strong
anion exchanger. The method conditions and buffers are as follows.
Sample/Buffer Column Volume Flow rate (ml/min)
Equilibration 20 mM Phosphate 10 2
Sample Load 2 mM TCEP 7.09 2
Equilibration 20 mM Phosphate 10 2
Regeneration .1 N NaOH 5 1.31
*1 Column volume = 1.4 ml
Dowex Marathon A2
A 1.5 ml column was packed with Dowex Marathon A2 resin, a microporous
strong anion exchanger. The method conditions and buffers are as follows.
Sample/Buffer Column Volume Flow rate (ml/min)
Equilibration 20 mM Phosphate 10 2
Sample Load 2 mM TCEP 6.71 2
Equilibration 20 mM Phosphate 10 2
Regeneration 1 N NaOH 5 1.31
Column wash 20 mM Phosphate 5 .4
*1 Column volume = 1.5 ml
33

Diaion SK1B
A 1.4 ml column was packed with Diaion SK1B resin, a microporous strong cation
exchanger. The method conditions and buffers are as follows.
Sample/Buffer Column Volume Flow rate (ml/min)
Equilibration 20 mM Phosphate 10 2
Sample Load 2 mM TCEP 7.09 2
Equilibration 20 mM Phosphate 10 2
Regeneration 2 M HCl 5 1.31
*1 Column volume = 1.4 ml
34

Appendix C: Methods - Dynamic Binding Capacity of mAb1
Dowex 1x8
A 1.4 ml column was packed with Dowex 1x8 resin. The method conditions and
buffers are as follows.
Sample/Buffer Column Volume Flow rate (ml/min)
Equilibration 20 mM Phosphate 10 1.31
Sample Load 4.62 mg/ml mAb1 1.53 .3
Equilibration 20 mM Phosphate 10 1.31
Regeneration .1 N NaOH 5 1.31
*1 Column volume = 1.4 ml
Dowex Marathon A2
A 1.5 ml column was packed with Dowex Marathon A2 resin. The method
conditions and buffers are as follows.
For pH 7 and 6
Sample/Buffer Column Volume Flow rate (ml/min)
Equilibration 20 mM Phosphate 10 1.31
Sample Load 4.53 mg/ml mAb1 1.5 .3
Equilibration 20 mM Phosphate 10 1.31
Regeneration 1 N NaOH 5 1.31
Column Wash 20 mM Phosphate 5 1.31
*1 Column volume = 1.5 ml
35

For pH 6.5
Sample/Buffer Column Volume Flow rate (ml/min)
Equilibration 20 mM Phosphate 10 1.31
Sample Load 5.66 mg/ml mAb1 1.3 .3
Equilibration 20 mM Phosphate 10 1.31
Regeneration 1 N NaOH 5 1.31
Column Wash 20 mM Phosphate 5 1.31
*1 Column volume = 1.5 ml
Diaion SK1B
A 1.4 ml column was packed with Diaion SK1B resin. The method conditions
and buffers are as follows.
Sample/Buffer Column Volume Flow rate (ml/min)
Equilibration 20 mM Phosphate 10 1.31
Sample Load 4.62 mg/ml mAb1 1.53 .3
Equilibration 20 mM Phosphate 10 1.31
Regeneration 2 M HCl 5 1.31
*1 Column volume = 1.4 ml
36

Appendix D: Methods – ADC Synthesis RPHPLC Conditions
Time (min) %A %B
(Water + Trifluoroacetic Acid) (Acetonitrile + Trifluoroacetic Acid)
0 80 20
3 80 20
20 60 40
22 5 95
26 5 95
30 80 20
37

Appendix E: Methods – ADC Synthesis with Column Chromatography
Dowex 1x4
Sample/Buffer Column Volume Flow rate (ml/min)
Equilibration 20 mM Phosphate 10 1.31
Sample Load 5.49 mg/ml mAb1 1.35 .26
Equilibration 20 mM Phosphate 10 1.31
Regeneration .1 N NaOH 5 1.31
*1 Column volume = 1.8 ml
Dowex 1x8
Sample/Buffer Column Volume Flow rate (ml/min)
Equilibration 20 mM Phosphate 10 1.31
Sample Load 9.38 mg/ml mAb1 1 .26
Equilibration 20 mM Phosphate 10 1.31
Regeneration .1 N NaOH 5 1.31
*1 Column volume = 1.4 ml
38

Dowex Marathon A2
Sample/Buffer Column Volume Flow rate (ml/min)
Equilibration 20 mM Phosphate 10 1.31
Sample Load 5.39 mg/ml mAb1 1.8 .26
Equilibration 20 mM Phosphate 10 1.31
Regeneration 1 N NaOH 5 1.31
*1 Column volume = 1.7 ml
Diaion SK1B
Sample/Buffer Column Volume Flow rate (ml/min)
Equilibration 20 mM Phosphate 10 1.31
Sample Load 5.39 mg/ml mAb1 1.75 .26
Equilibration 20 mM Phosphate 10 1.31
Regeneration 2 M HCl 5 1.31
*1 Column volume = 1.4 ml
39

Appendix F: Methods - ADC Synthesis with Column Chromatography and
no Sample Concentration
Dowex 1x8
Sample/Buffer Column Volume Flow rate (ml/min)
Equilibration 20 mM Phosphate 10 1.31
Sample Load 10.25 mg/ml mAb1 1 .26
Equilibration 20 mM Phosphate 10 1.31
Regeneration .1 N NaOH 5 1.31
*1 Column volume = 1.3 ml
Dowex Marathon A2
Sample/Buffer Column Volume Flow rate (ml/min)
Equilibration 20 mM Phosphate 10 1.31
Sample Load 10.25 mg/ml mAb1 1 .26
Equilibration 20 mM Phosphate 10 1.31
Regeneration 1 N NaOH 5 1.31
*1 Column volume = 1.3 ml
40

Diaion SK1B
Sample/Buffer Column Volume Flow rate (ml/min)
Equilibration 20 mM Phosphate 10 1.31
Sample Load 10.25 mg/ml mAb1 1 .26
Equilibration 20 mM Phosphate 10 1.31
Regeneration 2 M HCl 5 1.31
*1 Column volume = 1.4 ml
41

Appendix G: Results - Dynamic Binding Capacity of TCEP
Figure 16: Chromatogram of TCEP, Amberlite FPX66, maximum absorbance increase of 575 mAU Figure 17: Chromatogram of TCEP, Amberlite 98Cl, maximum absorbance increase of 275 mAU
42

Figure 18: Chromatogram of TCEP, Amberlite XAD 7HP, maximum absorbance increase of 550 mAU
Figure 19: Chromatogram of TCEP, Dowex 1x4, maximum absorbance increase of 80 mAU
43

Appendix H: Results - Dynamic Binding Capacity of TCEP Using
Microporous Resins
Figure 20: Chromatogram of TCEP, Dowex 1x4, pH 6, 6.5, 7, maximum absorbance increase of 60, 70 and 100 mAU respectively
Figure 21: Chromatogram of TCEP, Dowex 1x8, pH 6, 6.5, 7, maximum absorbance increase of 60, 25 and 75 mAU respectively
44

Figure 22: Chromatogram of TCEP, Dowex Marathon A2, pH 6, 6.5, 7, maximum absorbance increase of 40, 110 and 125 mAU respectively
Figure 23: Chromatogram of TCEP, Diaion SK1B, pH 7, maximum absorbance increase of 450 mAU
45

Appendix I: Results - Dynamic Binding Capacity of mAb1
Figure 24: Chromatogram of mAb1, Dowex 1x4, pH 6, 6.5, 7, maximum absorbance increase of 825, 900 and 850 mAU respectively
Figure 25: Chromatogram of mAb1, Dowex 1x8, pH 6, 6.5, 7 maximum absorbance increase of 825 mAU
46

Figure 26: Chromatogram of mAb1, Dowex Marathon A2, pH 6, 6.5, 7, maximum absorbance increase of 800, 875 and 850 mAU respectively
Figure 27: Chromatogram of mAb1, Diaion SK1B, pH 7, maximum absorbance increase of 825 mAU
47

Appendix J: Results – ADC Synthesis with Column Chromatography
DAD1A, Sig=280,16Ref=360,50(20171201CT2017-12-0417-10-22\008-D1F-A6-SadieColumnSample.D)
Norm.
8
6
4
2
0
-2
8 10 12 14 16 18 20 min
Figure 28: RPHPLC chromatogram - successful ADC synthesis, chromatography, Dowex 1x8
DAD1A,Sig=280,16Ref=360,50(RTB_08Dec172017-12-0814-22-34\003-D1F-A1-DowexA2.D)
mAU
8
6
4
2
0
8 10 12 14 16 18 20 min
Figure 29: RPHPLC chromatogram - successful ADC synthesis, chromatography, Dowex Marathon A2
48

DAD1A,Sig=280,16Ref=360,50(RTB_08Dec172017-12-0814-22-34\003-D1F-A1-DowexA2.D)
mAU
8
6
4
2
0
8 10 12 14 16 18 20 min
Figure 30: RPHPLC chromatogram - successful ADC synthesis, chromatography, Diaion SK1B
49

Appendix K: Results – ADC Synthesis with Column Chromatography and
no Sample Concentration
DAD1A,Sig=280,16Ref=360,50(RTB_14Dec172017-12-1409-36-15\004-D1F-A2-Dowex8.D)
mAU
8
6
4
2
0
8 10 12 14 16 18 20 min
Figure 31: RPHPLC chromatogram - unsuccessful ADC synthesis, chromatography, Dowex 1x8
DAD1A,Sig=280,16Ref=360,50(RTB_14Dec172017-12-1409-36-15\005-D1F-A3-Diaion.D)
mAU
5
4
3
2
1
0
8 10 12 14 16 18 20 min
Figure 32: RPHPLC chromatogram - successful ADC synthesis, chromatography, Diaion SK1B
50

Resume
Sadie Alperson
3905 Canterbury Rd Baltimore, MD 21218 | 646-875-9375 | [email protected]
Education
M.S. Chemical and Biomolecular Engineering | May 2018 | Johns Hopkins University
B.S. Chemical and Biomolecular Engineering | May 2017 | Johns Hopkins University
Skills
Laboratory: HPLC, UPLC, AKTA, Column packing, Depth filtration, Dialysis membranes Software: UNICORN, OpenLAB, Empower, JMP, ELN, LIMS, MATLAB/Simulink, Microsoft Office Suite
Work Experience
Antibody Drug Conjugate Co-Op, Protein Purification | MedImmune | June 2017 – December 2017
Increasing the efficiency of antibody drug conjugate synthesis
Project 1: Improving the reduction & post-reduction purification method for the synthesis of site-specific antibody drug conjugates using DTBA and cation exchange displacement chromatography
Performed high-throughput screening for chromatographic resin optimization Chose top performing resins and tested the binding capacity of DTBA, mAb
and mAb-DTBA mixtures
Developed an assay to quantify residual DTBA levels in mAb-DTBA mixtures
Project 2: Improving the post-reduction purification method for the synthesis of site-
specific antibody drug conjugates using column chromatography on microporous resins
Tested the binding capacity of TCEP, mAb, and mAb-TCEP solutions across a range of resins at multiple pH levels
Tested the binding capacity of TCEP using a depth filter Achieved successful conjugation while implementing column
chromatography method
Demonstrated column chromatography removes as much TCEP as the current removal method while saving time
Automation Intern, Analytics | Regeneron Pharmaceuticals | June 2016 – August 2016
Designed and tested UPLC methods to automate amino acid assays
Optimized derivatization conditions using Design of Experiment to test factors
51

of interest Conducted robustness studies to determine the most accurate and repeatable operating conditions Determined automation achieved a time savings of 3 minutes/sample
Managed daily titer runs and reported data using LIMS
Protein Engineering Researcher | Ostermeier Laboratory, JHU| January 2015 – May 2016
Identified glycine betaine (GB)-activated TALE colonies from a combinatorial library expressed in E. Coli using positive and negative selection
Performed minimum inhibitory concentration assays on the colonies from selection to investigate the MIC shift for ampicillin in the presence and absence of GB Determined the relationship between the addition of multiple TALE binding sites and gene expression
Evaluated the effect of GB on fluorescent protein expression
52