Embed Size (px)
Citation preview
RESEARCH PAPER
A Novel Strategy for Pharmaceutical Cocrystal GenerationWithout Knowledge of Stoichiometric Ratio: MyricetinCocrystals and a Ternary Phase Diagram
Chao Hong & Yan Xie & Yashu Yao & Guowen Li & Xiurong Yuan & Hongyi Shen
Received: 16 March 2014 /Accepted: 10 June 2014# Springer Science+Business Media New York 2014
ABSTRACTPurpose To develop a streamlined strategy for pharmaceuticalcocrystal preparation without knowledge of the stoichiometricratio by preparing and characterizing the cocrystals of myricetin(MYR) with four cocrystal coformers (CCF).Methods An approach based on the phase solubility diagram(PSD) was used for MYR cocrystals preparation and the solid-stateproperties were characterized by differential scanning calorimetry(DSC), fourier transform-infrared spectroscopy (FT-IR), powderX-ray diffraction (PXRD), and scanning electron microscopy(SEM). The ternary phase diagram (TPD) was constructed bycombining the PSD and nuclear magnetic resonance (NMR) data.After that, the TPD was verified by traditional methods. Thedissolution of MYR in the four cocrystals and pure MYR withinthree different media were also evaluated.Results A simple research method for MYR cocrystal preparationwas obtained as follows: first, the PSD of MYR and CCF wasconstructed and analyzed; second, by transforming the curve inthe PSD to a TPD, a region of pure cocrystals formation wasexhibited, and then MYR cocrystals were prepared and identifiedby DSC, FT-IR, PXRD, and SEM; third, with the composition ofthe prepared cocrystal from NMR, the TPD of the MYR-CCF-Solvent system was constructed. The powder dissolution datashowed that the solubility and dissolution rate of MYR wassignificantly enhanced by the cocrystals.
Conclusions A novel strategy for pharmaceutical cocrystals prep-aration without knowledge of the stoichiometric ratio based onthe TPD was established and MYR cocrystals were successfullyprepared. The present study provides a systematic approach forpharmaceutical cocrystal generation, which benefits the develop-ment and application of cocrystal technology in drug delivery.
KEY WORDS dissolution . myricetin . pharmaceuticalcocrystals . preparation . ternary phase diagram
ABBREVIATIONSAPI Active pharmaceutical ingredientCAF CaffeineCCF Cocrystal coformerCYA 4-CyanopyridineDSC Differential scanning calorimetryFT-IR Fourier transform-infrared spectroscopyHTS High throughput screeningINM IsonicotinamideMYR MyricetinNIC NicotinamidePSD Phase solubility diagramPXRD Powder X-ray diffractionSEM Scanning electron microscopy
Electronic supplementary material The online version of this article(doi:10.1007/s11095-014-1443-y) contains supplementary material, which isavailable to authorized users.
C. Hong : Y. Xie (*) : Y. Yao : X. Yuan :H. ShenResearch Center for Health and Nutrition, Shanghai University ofTraditional Chinese Medicine, Shanghai 201203, Chinae-mail: [email protected]
G. LiPharmacy Department, Shanghai TCM-Integrated HospitalShanghai 200082, China
Y. YaoInstitute of Chinese Materia Medica, Shanghai University of TraditionalChinese Medicine, Shanghai 201203, China
Pharm ResDOI 10.1007/s11095-014-1443-y
TPD Ternary phase diagramUSP United states pharmacopeia
INTRODUCTION
Utilization of noncovalent interactions for the developmentand designed self-assembly of individual molecules is anemerging frontier in research, and the formation of cocrystalshas been previously explored in these fields. Pharmaceuticalcocrystals are homogeneous solid phases containing an activepharmaceutical ingredient (API) and one or more neutralmolecular components called a cocrystal coformer (CCF) ina crystal lattice with defined stoichiometry (1,2). Their designrelies on the predictability of supramolecular interactionsbetween the complementary functionalities of cocrystalcomponents and results in heteromeric interactions overtheir homomeric counterparts (3). These heteromeric interac-tions are usually formed by hydrogen bonds, aromatic π-stacking, and van der Waals forces. Cocrystallization is aparticularly attractive design strategy for solid API phasesbecause it could modify some of the physicochemicalproperties of a candidate drug, such as solubility, dissolutionrate, melting point, stability, and bioavailability (4). To date,at least 90 APIs have been targeted for pharmaceuticalcocrystallization due to their undesirable solubility, stability,and inherent hydrogen bonding capability (5).
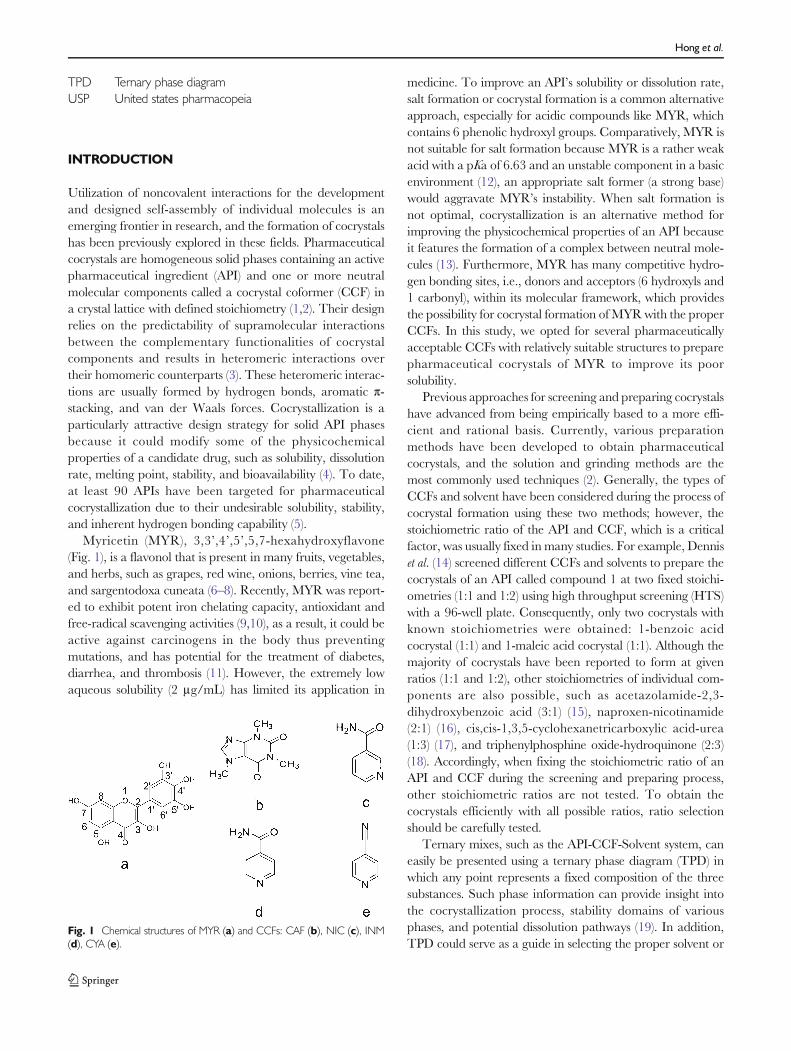
Myricetin (MYR), 3,3’,4’,5’,5,7-hexahydroxyflavone(Fig. 1), is a flavonol that is present in many fruits, vegetables,and herbs, such as grapes, red wine, onions, berries, vine tea,and sargentodoxa cuneata (6–8). Recently, MYR was report-ed to exhibit potent iron chelating capacity, antioxidant andfree-radical scavenging activities (9,10), as a result, it could beactive against carcinogens in the body thus preventingmutations, and has potential for the treatment of diabetes,diarrhea, and thrombosis (11). However, the extremely lowaqueous solubility (2 μg/mL) has limited its application in
medicine. To improve an API’s solubility or dissolution rate,salt formation or cocrystal formation is a common alternativeapproach, especially for acidic compounds like MYR, whichcontains 6 phenolic hydroxyl groups. Comparatively, MYR isnot suitable for salt formation because MYR is a rather weakacid with a pKa of 6.63 and an unstable component in a basicenvironment (12), an appropriate salt former (a strong base)would aggravate MYR’s instability. When salt formation isnot optimal, cocrystallization is an alternative method forimproving the physicochemical properties of an API becauseit features the formation of a complex between neutral mole-cules (13). Furthermore, MYR has many competitive hydro-gen bonding sites, i.e., donors and acceptors (6 hydroxyls and1 carbonyl), within its molecular framework, which providesthe possibility for cocrystal formation ofMYR with the properCCFs. In this study, we opted for several pharmaceuticallyacceptable CCFs with relatively suitable structures to preparepharmaceutical cocrystals of MYR to improve its poorsolubility.
Previous approaches for screening and preparing cocrystalshave advanced from being empirically based to a more effi-cient and rational basis. Currently, various preparationmethods have been developed to obtain pharmaceuticalcocrystals, and the solution and grinding methods are themost commonly used techniques (2). Generally, the types ofCCFs and solvent have been considered during the process ofcocrystal formation using these two methods; however, thestoichiometric ratio of the API and CCF, which is a criticalfactor, was usually fixed in many studies. For example, Denniset al. (14) screened different CCFs and solvents to prepare thecocrystals of an API called compound 1 at two fixed stoichi-ometries (1:1 and 1:2) using high throughput screening (HTS)with a 96-well plate. Consequently, only two cocrystals withknown stoichiometries were obtained: 1-benzoic acidcocrystal (1:1) and 1-maleic acid cocrystal (1:1). Although themajority of cocrystals have been reported to form at givenratios (1:1 and 1:2), other stoichiometries of individual com-ponents are also possible, such as acetazolamide-2,3-dihydroxybenzoic acid (3:1) (15), naproxen-nicotinamide(2:1) (16), cis,cis-1,3,5-cyclohexanetricarboxylic acid-urea(1:3) (17), and triphenylphosphine oxide-hydroquinone (2:3)(18). Accordingly, when fixing the stoichiometric ratio of anAPI and CCF during the screening and preparing process,other stoichiometric ratios are not tested. To obtain thecocrystals efficiently with all possible ratios, ratio selectionshould be carefully tested.
Ternary mixes, such as the API-CCF-Solvent system, caneasily be presented using a ternary phase diagram (TPD) inwhich any point represents a fixed composition of the threesubstances. Such phase information can provide insight intothe cocrystallization process, stability domains of variousphases, and potential dissolution pathways (19). In addition,TPD could serve as a guide in selecting the proper solvent or
Fig. 1 Chemical structures of MYR (a) and CCFs: CAF (b), NIC (c), INM(d), CYA (e).
Hong et al.
synthesis method for cocrystal formation and provide the basisfor developing large-scale preparative procedures using solu-tion crystallization (14). However, early methods for drawingthe TPD involved allowing an API (CCF) and cocrystal toequilibrate in a solvent with varying CCF (API) ratios (20).Thus, the cocrystals are obtained before constructing itsTPD in this method. These processes are tedious, andthe native role of TPD could not be embodied such asdirectly guiding cocrystal preparation and scale-up whencocrystal is not quite available. Therefore, anotherproblem that emerged in the study of cocrystals is howto construct the TPD before the cocrystals are successfullyprepared, simultaneously apply the TPD for preparing purepowder cocrystals.
In this paper, the cocrystallization ofMYRwith four CCFs,caffeine (CAF), nicotinamide (NIC), isonicotinamide (INM),and 4-cyanopyridine (CYA) (Fig. 1), were investigated. Briefly,a streamlined strategy based on the principles of reactioncocrystallization (21) is discussed with the aim of preparingcocrystals without knowledge of the stoichiometric ratio andby simultaneously constructing their TPDs. Furthermore, thestrategy was verified. The detailed physicochemicalcharacterization, including differential scanning calorim-etry (DSC), Fourier transform-infrared spectroscopy(FT-IR), powder X-ray diffraction (PXRD), scanningelectron microscopy (SEM), and nuclear magnetic reso-nance (NMR), are also presented and discussed with anemphasis on the future development potential of the fourcocrystals. Lastly, the dissolution ofMYR in the four cocrystalsand pure MYR was evaluated.
MATERIALS AND METHODS
Materials
The rawmaterial (MYR) was purchased from Shanghai DNDPharm-Technology Co., Inc. (Shanghai, China). CAF,NIC, INM, and CYA were obtained from SigmaAldrich Co. LLC (Shanghai, China). Methanol was pur-chased from Sinopharm Chemical Reagent Co., Ltd.(Shanghai, China). All chemicals were used as receivedwithout further purification.
Phase Solubility Diagram
The phase solubility of the MYR-CCF-solvent was deter-mined by adding excess MYR to different concentrations ofsolutions of CCF while adding excess CCF to MYR. Theresulting suspensions were allowed to reach equilibrium whilestirring at 25°C. Aliquots of solutions were withdrawn after12 h, centrifuged (13,000 rpm, 10min), and the concentration
of MYR and CCF in the supernatant were separatelydetermined by HPLC (12).
Preparation of Cocrystals
In the pre-study, many candidate CCFs such as saccharin,caffeine, nicotinamide, isonicotinamide, 4-cyanopyridine, ly-sine, histidine, arginine, etc., were considered for MYRcocrystal preparation according to the cocrystal forming prin-ciple and cambridge structural database system. Eventually,only caffeine, nicotinamide, isonicotinamide, and 4-cyanopyridine could form pharmaceutical cocrystals withMYR. The detailed process for cocrystal preparation was asfollows.
MYR-CAF. CAF (33.2 mg, 0.4% (w/w)) was dissolved in10 mL of methanol (95.5% (w/w)). After, MYR(340.0 mg, 4.1% (w/w)) was added, and the mixturewas stirred at 25°C for 12 h. The precipitate was obtain-ed by suction filtration and dried in a fume hood for 24 hat room temperature. The other three cocrystals wereprepared at the same temperature, feeding process, andpost-processing except for the percentages of API, CCF,and solvent.MYR-NIC. MYR (173.5 mg, 2.0% (w/w)), NIC(581.2 mg, 6.7% (w/w)), methanol (10 mL, 91.3%(w/w)).MYR-INM. MYR (284.1 mg, 3.3% (w/w)), INM(404.6 mg, 4.7% (w/w)), methanol (10 mL, 92.0%(w/w)).MYR-CYA. MYR (317.1 mg, 3.7% (w/w)), CYA(334.2 mg, 3.9% (w/w)), methanol (10 mL, 92.4%(w/w)).
Differential Scanning Calorimetry (DSC)
A differential scanning calorimeter (822e, DSC instruments,Mettler Toledo, Switzerland) was used to perform thermalanalysis on the samples of MYR, CCFs, and MYR cocrystals.Powder samples of approximately 3.0 mg were placed in openaluminum crucibles and heated at a rate of 10°C/min up to400°C.
Powder X-Ray Diffraction (PXRD)
The PXRD patterns of MYR, CCFs, and MYR cocrystalswere obtained at ambient temperature using aShimadzu XRD-6000X (Shimadzu, Japan). The sampleswere irradiated with Ni-filtered Cu-K (α) radiation at avoltage of 40.0 kV and a current of 40.0 mA. Thescanning rate was 2°/min over a diffraction angle of2θ ranging from 3° to 50°.
Cocrystal Generation Without Knowledge of Stoichiometric Ratio
Fourier Transform-Infrared Spectroscopy (FT-IR)
FT-IR spectra were recorded on a Nicolet FT-IR-R330 spec-trophotometer (ThermoFisher Scientific, Massachusetts,USA) over a range of 4,000 cm−1 to 450 cm−1 with a resolu-tion of 1 cm−1 and 64 scans. MYR, CCFs, and MYRcocrystals were prepared in KBr disks with a hydrostatic pressat a force of 5.2 T/cm2 for 3 min.
Scanning Electron Microscopy (SEM)
Morphological evaluation was performed using SEM (PhilipsXL-30, Eindhoven, Holland). A small piece of double-sidedadhesive tape was fixed onto an aluminum stub, and theMYRand MYR cocrystal powders were sprinkled and dispersed onthe stub surface. Prior to examination, the samples weresputter coated with gold-palladium under argon atmosphereto render them electrically conductive.
Nuclear Magnetic Resonance (NMR) Spectroscopy
1H-NMR spectra were acquired on a Bruker Avance III600 MHz spectrometer equipped with a 5-mm PABBO probe(Bruker Corporation, Fällanden, Switzerland) at 25°C.Typically, approximately 10 mg of MYR, CCFs, and MYRcocrystals were dissolved in a glass vial in 0.5 mL of DMSO-d6.After, the solution was transferred into an NMR tube. All datawere acquired and processed using Bruker Topspin 3.0 software.
Transition Concentration (Ctr) Measurement(Verification)
The transition concentration or invariant point was validatedusing a previously reported method (22). This was achieved byadding excess cocrystals to a saturated MYR solution contain-ing excess solid MYR or a saturated CCF solution with excesssolid CCF. After equilibration for 12 h, the supernatants werewithdrawn and quantified by HPLC as described in the“Phase Solubility Diagram” section, and the obtained solidphases were characterized using DSC or PXRD. The verifi-cation experiments for the two Ctr values were performed intriplicate.
Powder Dissolution Experiments
For the dissolution studies of MYR and MYR cocrystals inpowder, all samples were sieved through a 178-μm screen toproduce powders with a similar range in particle sizes. Thetests were performed on an RCZ-6C1 (Huanghai Medicine &Drug Testing Instruments, Shanghai, China) using the UnitedStates Pharmacopeia (USP) paddle apparatus II. The rota-tional speed of the paddle was set at 100 rpm and a temper-ature of the dissolution media was maintained at 25±0.5°C.
Accurately weighed powders corresponding to 50mg ofMYRwere added to dissolution vessels containing 300 mL of medi-um. Three dissolution media were studied: 0.1 mol/L HCl(pH 1.2), 0.1 mol/L acetate buffer (pH 4.5), and 0.05 mol/Lphosphate buffer (pH 6.8). Sampling was performed at 10, 20,40, 60, 120, and 240 min, and the withdrawn slurry wasfiltered using 0.45-μm cellulose filters. A 20-μL sample wasinjected into an HPLC to quantify the concentration of MYRas mentioned in the “Phase Solubility Diagram” section. Alltests were performed in triplicate.
RESULTS AND DISCUSSION
Phase Solubility and Preparation of the Solid Phases
The phase solubility diagram (PSD) shows the concentrationsof reactant in solution when different solid phases (API,cocrystal, and CCF) are at equilibrium, which was useful fordetermining the solution composition in specific phases andfor studying solution complexation (23). Thus, we can ensurethe formation of a new phase by observing the change intrends of the concentration curve in the PSD, which can alsobe used for directing the synthesis of cocrystals. The concen-tration of reactant in the PSD is the total concentration, whichis originated from the unbound reactant and bound reactant,but it actually represents the saturation concentration at equi-librium. From this point, it is presumable that the cocrystalPSD could be constructed by adding an API and CCF to aproper solvent as long as the number of reaction ratios of theAPI and CCF was enough and that excess solid existed whenthe system was at equilibrium. Here, we used NIC as anexample to explain our strategy for cocrystal preparationusing the PSD. Considering the poor aqueous solubility ofMYR and the preliminary experimental results (data notshown), methanol was selected as the solvent to prepareMYR cocrystals.
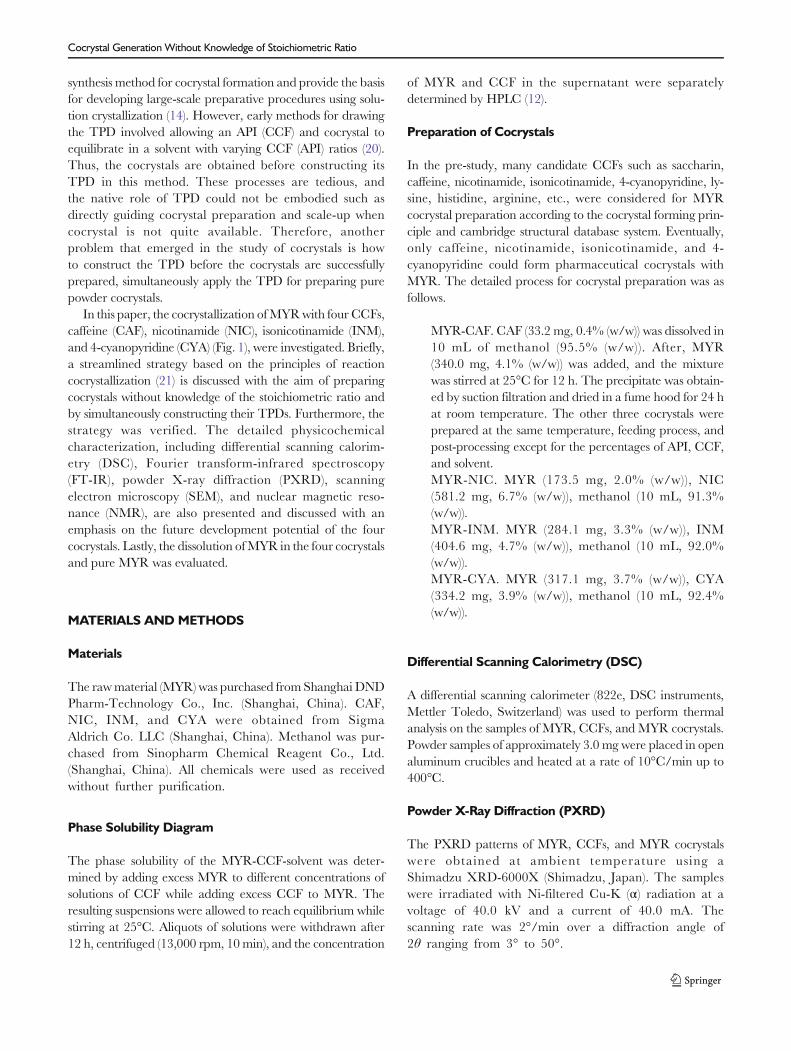
Figure 2 presents the PSD of the MYR-NIC-Methanolsystem, in which point a and b represent the solubility ofMYR and NIC in neat methanol, respectively. From theobtained points in the PSD, the concentration of MYR de-creased with the increase in NIC concentration when allphases reached equilibrium in methanol. The curve couldbe divided into three stages after all points were connected,in which the solid lines ac1 and c2b represent the solubility ofMYR and NIC in different solutions, respectively.Furthermore, the trend of ac1 and c2b were relatively smooth-er compared to c1c2, which indicated that the solubility ofMYR (ac1) and NIC (c2b) were less affected by the presence ofthe other component (NIC (ac1) or MYR (c2b)). However, asshown in line c1c2, the concentration of MYR (NIC) fallsquickly when the concentration of NIC (MYR) is increased
Hong et al.
in the system, which indicated a new cocrystal might beformed, and c1c2 should represent its solubility (24). Theintersected points c1 and c2 were called the transition concen-trations (Ctr) or invariant points, and they represent the con-centration of reactants in solution when the solid phase atequilibrium contains cocrystal and MYR (or NIC) (25).Therefore, the PSD refers to the solution composition ofMYR and NIC at equilibrium with different solid phases.
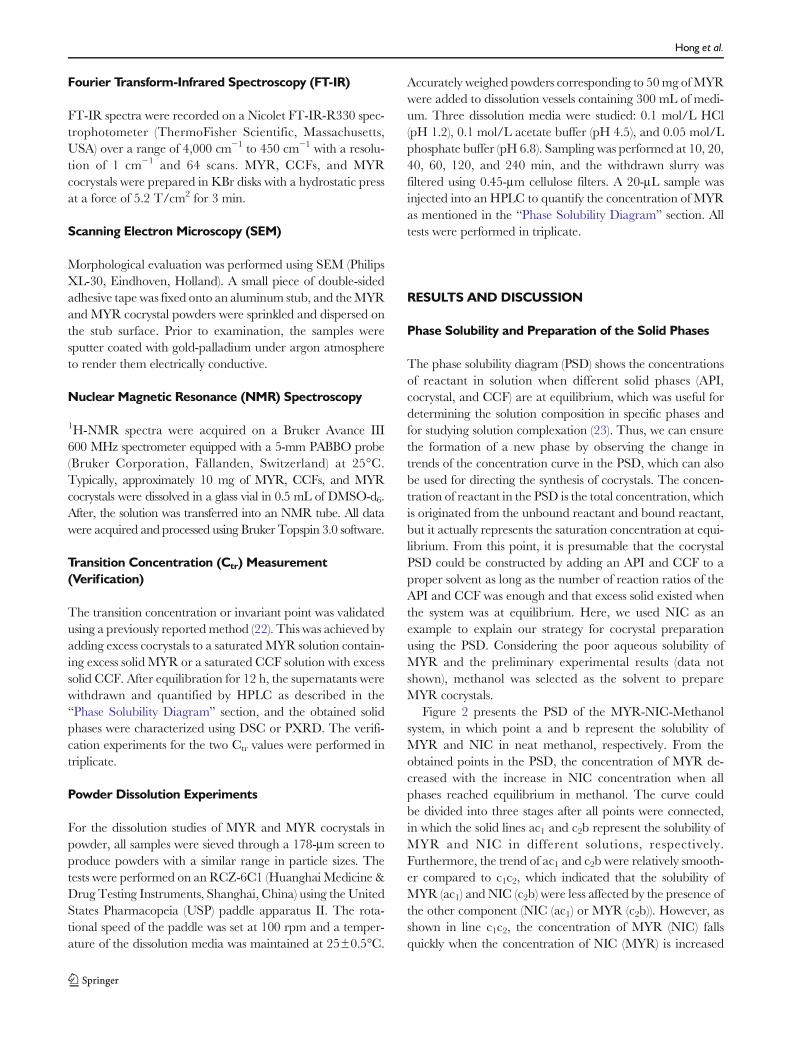
However, the reactant concentration in solution is notenough to achieve cocrystal preparation. Unlike the PSD,the TPD shows the total composition of the system, includingcomponents in the solid and liquid phases (20,26). Thus, thephase solubility curve should be transformed into the TPD(Fig. 3). Furthermore, a straight line was drawn to connectthese two points (c1, c2) and a new region appeared, which was
labeled region 0. According to the principles of a TPD, if aMYR/NIC/Methanol mixture is generated with a startingcomposition in region 0, pure solid MYR-NIC cocrystalwould be precipitated from the system, and the liquid com-position can be varied on the curved full line c1c2. Obviously,region 0 is within the pure cocrystal forming zone, whichcannot be obtained without knowledge of the cocrystal com-position. However, region 0 could be easily found by drawingthe PSD; therefore, it was useful to cocrystal preparation whenthe cocrystal composition is unknown (27–29).
We selected a point lying within region 0 of the TPD andcreated a mixture with the overall composition of 2.0% (w/w)MYR, 6.7% (w/w) NIC, and 91.3% (w/w) methanol toprepare MYR-NIC cocrystals as mentioned in the“Preparation of Cocrystals” section. Using the same method,the other three MYR cocrystals were also obtained.
Solid-State Properties
DSC
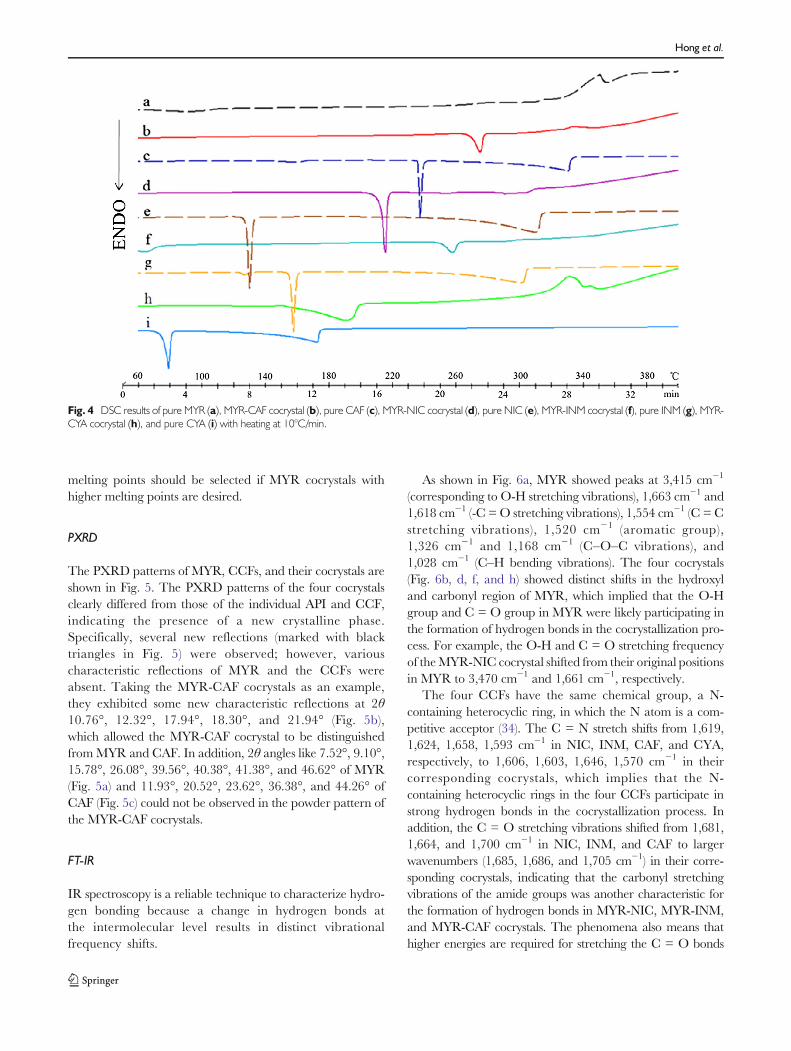
The DSC curves of MYR, CCFs, and cocrystals are shown inFig. 4, from which it can be seen that pure MYR presented asingle sharp endothermic melting peak at 356.06°C (Fig. 4a).CAF demonstrated a steep endothermic melting transition at236.29°C (Fig. 4c), which is in agreement with the reportedthermal behavior (30). Meanwhile, the DSC thermogram forMYR-CAF cocrystals showed a single endothermic transition,which was attributed to the melting transition (275.01°C) witha melting enthalpy of 142 J/g (Fig. 4b); the melting tempera-ture was markedly different than the endothermic meltingpeak of MYR or CAF, suggesting the formation of a newphase. The MYR-NIC, MYR-INM, MYR-CYA cocrystals,and their CCFs resulted in similar phenomena with MYR-CAF cocrystals and CAF. They melted at 214.46°C,257.53°C, and 191.51°C, respectively, with a melting enthal-py of 160 J/g, 59 J/g, and 232 J/g (Fig. 4d, f, and h). A singleendothermic transition for the four cocrystals demonstratesthat the new phases were stable below their melting points andindicates the absence of unbound or absorbed solvent andwater (31).
Furthermore, a direct correlation of chemical structure tothe crystalline lattice energy and melting point is a challengingtask because of several contributing factors, such as moleculararrangement in the lattice, noncovalent interactions, and con-formational flexibility for a molecule (31), and this becomesmore complex with cocrystals with multiple components. Inthe current study, an interesting pattern was found in that themelting points of all cocrystals were between that ofMYR andthe corresponding CCF, which is in agreement with theuniversal rule obtained from other cocrystals (32,33). It is clearthat the melting point of the cocrystals was altered with thetype of CCF. This information suggests that CCFs with higher
Fig. 3 The ternary phase diagram (TPD) was transformed from the PSD.The point in the TPD means the total amount of 100 g with MYR, CCF, andmethanol. The crystallization of pure cocrystal forms in solution in region 0.
Fig. 2 PSD for the MYR-NIC-Methanol system at 25°C. The concentrationsof reactant (MYR and NIC) in solution at equilibrium are shown in the PSD.“a” and “b” represent the solubility of MYR and NIC in methanol, respectively.“c1” and “c2” represent the transition concentration.
Cocrystal Generation Without Knowledge of Stoichiometric Ratio
melting points should be selected if MYR cocrystals withhigher melting points are desired.
PXRD
The PXRD patterns of MYR, CCFs, and their cocrystals areshown in Fig. 5. The PXRD patterns of the four cocrystalsclearly differed from those of the individual API and CCF,indicating the presence of a new crystalline phase.Specifically, several new reflections (marked with blacktriangles in Fig. 5) were observed; however, variouscharacteristic reflections of MYR and the CCFs wereabsent. Taking the MYR-CAF cocrystals as an example,they exhibited some new characteristic reflections at 2θ10.76°, 12.32°, 17.94°, 18.30°, and 21.94° (Fig. 5b),which allowed the MYR-CAF cocrystal to be distinguishedfromMYR and CAF. In addition, 2θ angles like 7.52°, 9.10°,15.78°, 26.08°, 39.56°, 40.38°, 41.38°, and 46.62° of MYR(Fig. 5a) and 11.93°, 20.52°, 23.62°, 36.38°, and 44.26° ofCAF (Fig. 5c) could not be observed in the powder pattern ofthe MYR-CAF cocrystals.
FT-IR
IR spectroscopy is a reliable technique to characterize hydro-gen bonding because a change in hydrogen bonds atthe intermolecular level results in distinct vibrationalfrequency shifts.
As shown in Fig. 6a, MYR showed peaks at 3,415 cm−1
(corresponding to O-H stretching vibrations), 1,663 cm−1 and1,618 cm−1 (-C =O stretching vibrations), 1,554 cm−1 (C =Cstretching vibrations), 1,520 cm−1 (aromatic group),1,326 cm−1 and 1,168 cm−1 (C–O–C vibrations), and1,028 cm−1 (C–H bending vibrations). The four cocrystals(Fig. 6b, d, f, and h) showed distinct shifts in the hydroxyland carbonyl region of MYR, which implied that the O-Hgroup and C = O group in MYR were likely participating inthe formation of hydrogen bonds in the cocrystallization pro-cess. For example, the O-H and C = O stretching frequencyof theMYR-NIC cocrystal shifted from their original positionsin MYR to 3,470 cm−1 and 1,661 cm−1, respectively.
The four CCFs have the same chemical group, a N-containing heterocyclic ring, in which the N atom is a com-petitive acceptor (34). The C = N stretch shifts from 1,619,1,624, 1,658, 1,593 cm−1 in NIC, INM, CAF, and CYA,respectively, to 1,606, 1,603, 1,646, 1,570 cm−1 in theircorresponding cocrystals, which implies that the N-containing heterocyclic rings in the four CCFs participate instrong hydrogen bonds in the cocrystallization process. Inaddition, the C = O stretching vibrations shifted from 1,681,1,664, and 1,700 cm−1 in NIC, INM, and CAF to largerwavenumbers (1,685, 1,686, and 1,705 cm−1) in their corre-sponding cocrystals, indicating that the carbonyl stretchingvibrations of the amide groups was another characteristic forthe formation of hydrogen bonds in MYR-NIC, MYR-INM,and MYR-CAF cocrystals. The phenomena also means thathigher energies are required for stretching the C = O bonds
Fig. 4 DSC results of pure MYR (a), MYR-CAF cocrystal (b), pure CAF (c), MYR-NIC cocrystal (d), pure NIC (e), MYR-INM cocrystal (f), pure INM (g), MYR-CYA cocrystal (h), and pure CYA (i) with heating at 10°C/min.
Hong et al.
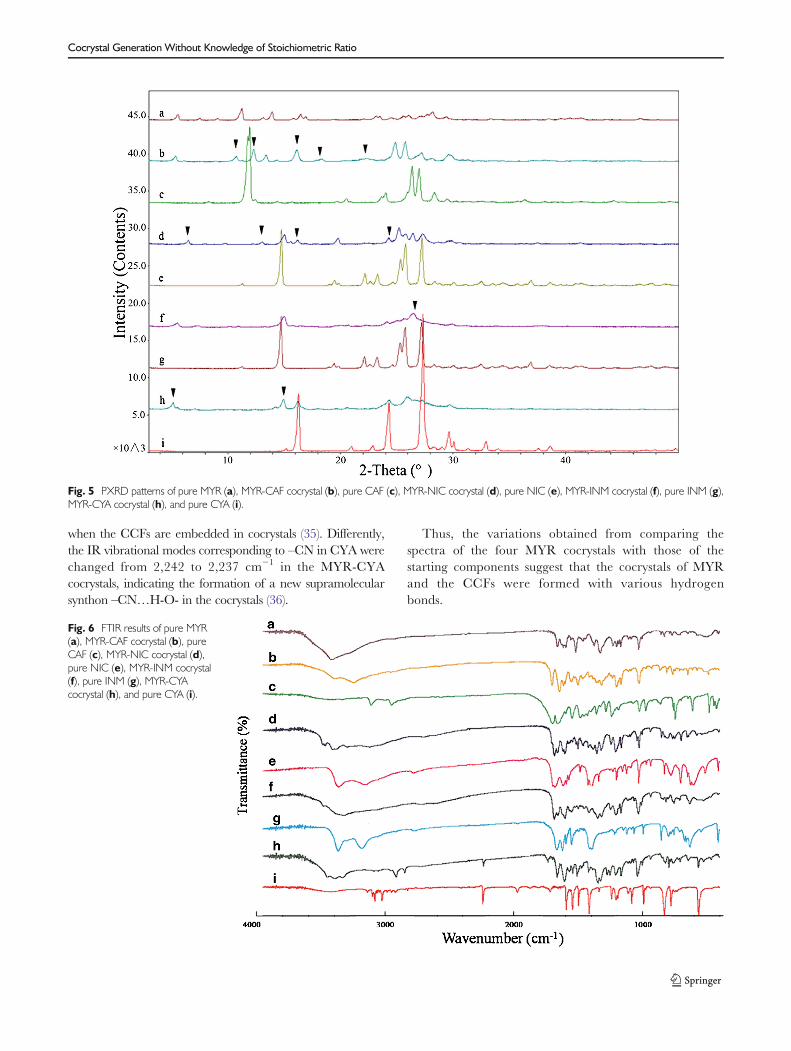
when the CCFs are embedded in cocrystals (35). Differently,the IR vibrational modes corresponding to –CN in CYA werechanged from 2,242 to 2,237 cm−1 in the MYR-CYAcocrystals, indicating the formation of a new supramolecularsynthon –CN…H-O- in the cocrystals (36).
Thus, the variations obtained from comparing thespectra of the four MYR cocrystals with those of thestarting components suggest that the cocrystals of MYRand the CCFs were formed with various hydrogenbonds.
Fig. 6 FTIR results of pure MYR(a), MYR-CAF cocrystal (b), pureCAF (c), MYR-NIC cocrystal (d),pure NIC (e), MYR-INM cocrystal(f), pure INM (g), MYR-CYAcocrystal (h), and pure CYA (i).
Fig. 5 PXRD patterns of pure MYR (a), MYR-CAF cocrystal (b), pure CAF (c), MYR-NIC cocrystal (d), pure NIC (e), MYR-INM cocrystal (f), pure INM (g),MYR-CYA cocrystal (h), and pure CYA (i).
Cocrystal Generation Without Knowledge of Stoichiometric Ratio
SEM
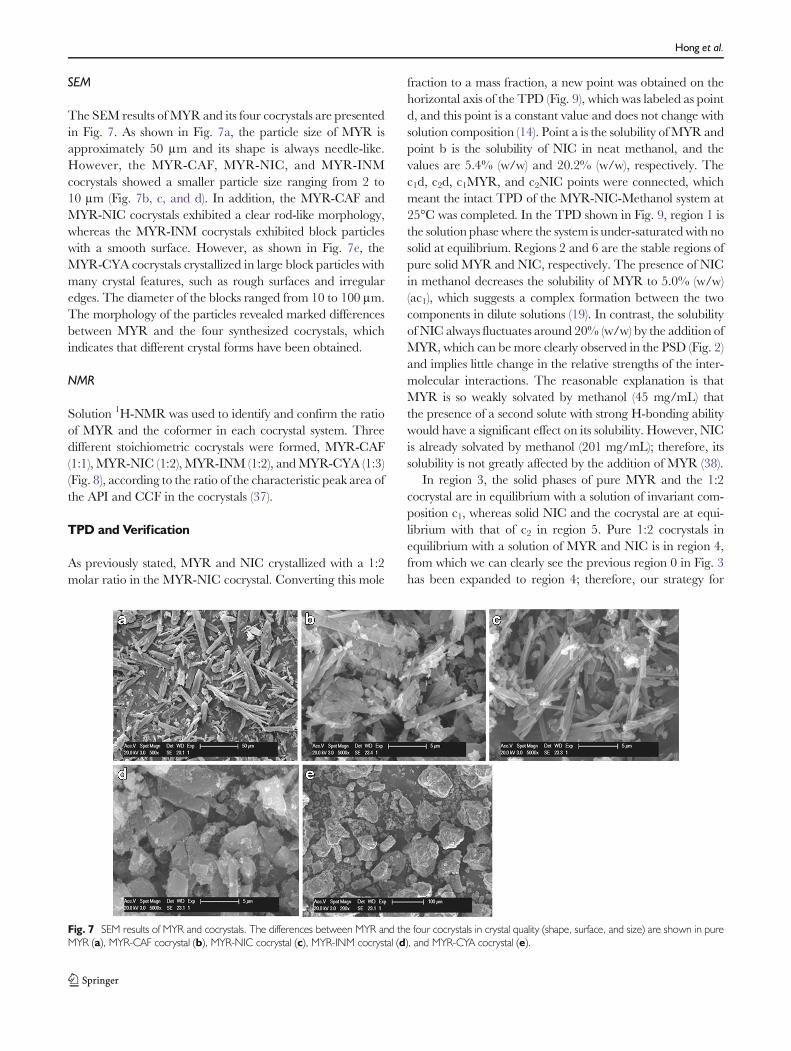
The SEM results of MYR and its four cocrystals are presentedin Fig. 7. As shown in Fig. 7a, the particle size of MYR isapproximately 50 μm and its shape is always needle-like.However, the MYR-CAF, MYR-NIC, and MYR-INMcocrystals showed a smaller particle size ranging from 2 to10 μm (Fig. 7b, c, and d). In addition, the MYR-CAF andMYR-NIC cocrystals exhibited a clear rod-like morphology,whereas the MYR-INM cocrystals exhibited block particleswith a smooth surface. However, as shown in Fig. 7e, theMYR-CYA cocrystals crystallized in large block particles withmany crystal features, such as rough surfaces and irregularedges. The diameter of the blocks ranged from 10 to 100 μm.The morphology of the particles revealed marked differencesbetween MYR and the four synthesized cocrystals, whichindicates that different crystal forms have been obtained.
NMR
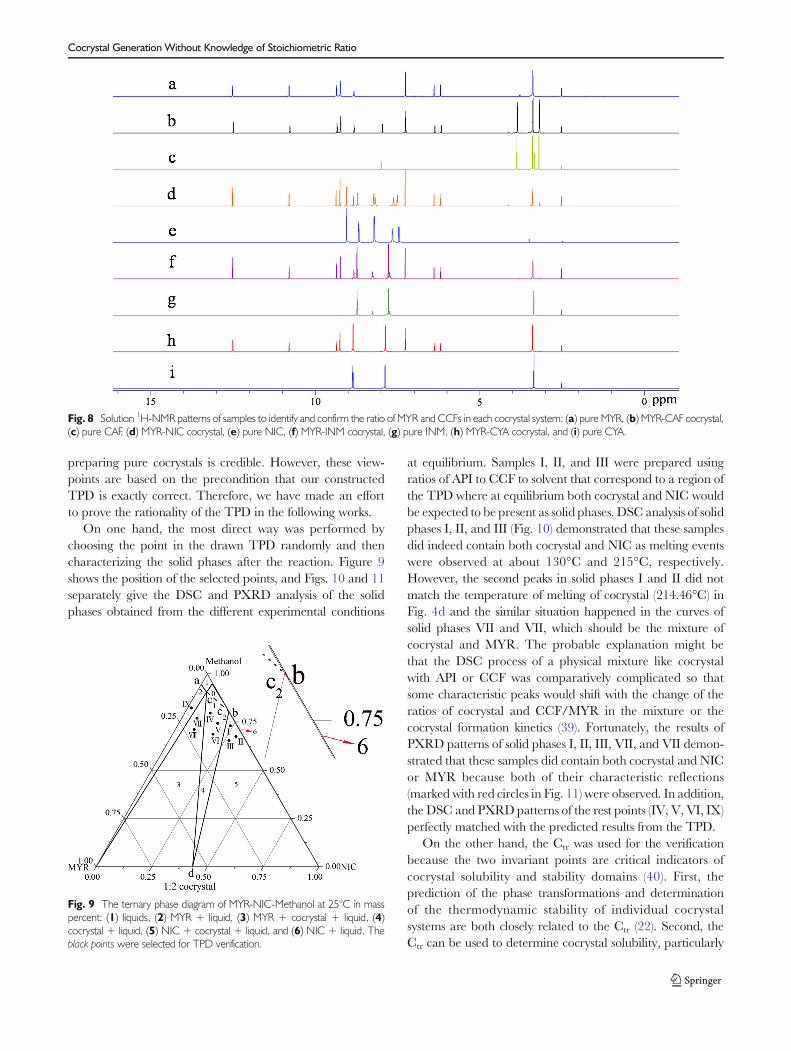
Solution 1H-NMR was used to identify and confirm the ratioof MYR and the coformer in each cocrystal system. Threedifferent stoichiometric cocrystals were formed, MYR-CAF(1:1), MYR-NIC (1:2), MYR-INM (1:2), andMYR-CYA (1:3)(Fig. 8), according to the ratio of the characteristic peak area ofthe API and CCF in the cocrystals (37).
TPD and Verification
As previously stated, MYR and NIC crystallized with a 1:2molar ratio in the MYR-NIC cocrystal. Converting this mole
fraction to a mass fraction, a new point was obtained on thehorizontal axis of the TPD (Fig. 9), which was labeled as pointd, and this point is a constant value and does not change withsolution composition (14). Point a is the solubility ofMYR andpoint b is the solubility of NIC in neat methanol, and thevalues are 5.4% (w/w) and 20.2% (w/w), respectively. Thec1d, c2d, c1MYR, and c2NIC points were connected, whichmeant the intact TPD of the MYR-NIC-Methanol system at25°C was completed. In the TPD shown in Fig. 9, region 1 isthe solution phase where the system is under-saturated with nosolid at equilibrium. Regions 2 and 6 are the stable regions ofpure solid MYR and NIC, respectively. The presence of NICin methanol decreases the solubility of MYR to 5.0% (w/w)(ac1), which suggests a complex formation between the twocomponents in dilute solutions (19). In contrast, the solubilityof NIC always fluctuates around 20% (w/w) by the addition ofMYR, which can be more clearly observed in the PSD (Fig. 2)and implies little change in the relative strengths of the inter-molecular interactions. The reasonable explanation is thatMYR is so weakly solvated by methanol (45 mg/mL) thatthe presence of a second solute with strong H-bonding abilitywould have a significant effect on its solubility. However, NICis already solvated by methanol (201 mg/mL); therefore, itssolubility is not greatly affected by the addition of MYR (38).
In region 3, the solid phases of pure MYR and the 1:2cocrystal are in equilibrium with a solution of invariant com-position c1, whereas solid NIC and the cocrystal are at equi-librium with that of c2 in region 5. Pure 1:2 cocrystals inequilibrium with a solution of MYR and NIC is in region 4,from which we can clearly see the previous region 0 in Fig. 3has been expanded to region 4; therefore, our strategy for
Fig. 7 SEM results of MYR and cocrystals. The differences between MYR and the four cocrystals in crystal quality (shape, surface, and size) are shown in pureMYR (a), MYR-CAF cocrystal (b), MYR-NIC cocrystal (c), MYR-INM cocrystal (d), and MYR-CYA cocrystal (e).
Hong et al.
preparing pure cocrystals is credible. However, these view-points are based on the precondition that our constructedTPD is exactly correct. Therefore, we have made an effortto prove the rationality of the TPD in the following works.
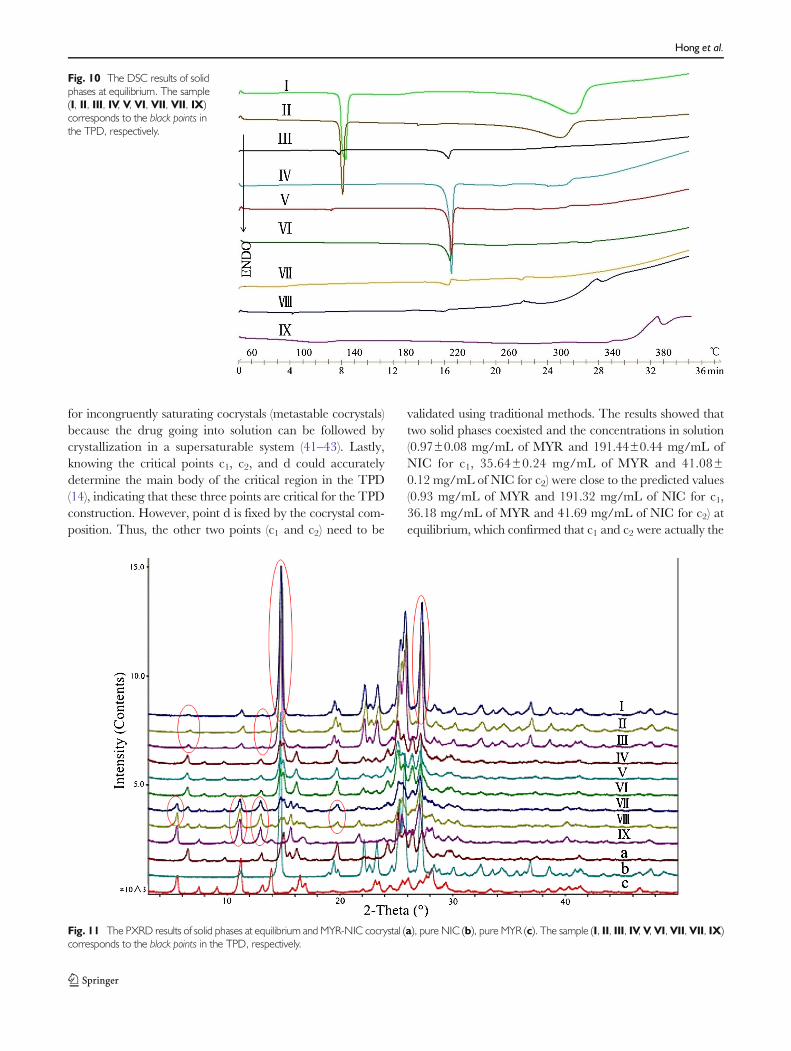
On one hand, the most direct way was performed bychoosing the point in the drawn TPD randomly and thencharacterizing the solid phases after the reaction. Figure 9shows the position of the selected points, and Figs. 10 and 11separately give the DSC and PXRD analysis of the solidphases obtained from the different experimental conditions
at equilibrium. Samples I, II, and III were prepared usingratios of API to CCF to solvent that correspond to a region ofthe TPD where at equilibrium both cocrystal and NIC wouldbe expected to be present as solid phases. DSC analysis of solidphases I, II, and III (Fig. 10) demonstrated that these samplesdid indeed contain both cocrystal and NIC as melting eventswere observed at about 130°C and 215°C, respectively.However, the second peaks in solid phases I and II did notmatch the temperature of melting of cocrystal (214.46°C) inFig. 4d and the similar situation happened in the curves ofsolid phases VII and VII, which should be the mixture ofcocrystal and MYR. The probable explanation might bethat the DSC process of a physical mixture like cocrystalwith API or CCF was comparatively complicated so thatsome characteristic peaks would shift with the change of theratios of cocrystal and CCF/MYR in the mixture or thecocrystal formation kinetics (39). Fortunately, the results ofPXRD patterns of solid phases I, II, III, VII, and VII demon-strated that these samples did contain both cocrystal and NICor MYR because both of their characteristic reflections(marked with red circles in Fig. 11) were observed. In addition,the DSC and PXRD patterns of the rest points (IV, V, VI, IX)perfectly matched with the predicted results from the TPD.
On the other hand, the Ctr was used for the verificationbecause the two invariant points are critical indicators ofcocrystal solubility and stability domains (40). First, theprediction of the phase transformations and determinationof the thermodynamic stability of individual cocrystalsystems are both closely related to the Ctr (22). Second, theCtr can be used to determine cocrystal solubility, particularly
Fig. 8 Solution 1H-NMR patterns of samples to identify and confirm the ratio of MYR and CCFs in each cocrystal system: (a) pure MYR, (b) MYR-CAF cocrystal,(c) pure CAF, (d) MYR-NIC cocrystal, (e) pure NIC, (f) MYR-INM cocrystal, (g) pure INM, (h) MYR-CYA cocrystal, and (i) pure CYA.
Fig. 9 The ternary phase diagram of MYR-NIC-Methanol at 25°C in masspercent: (1) liquids, (2) MYR + liquid, (3) MYR + cocrystal + liquid, (4)cocrystal + liquid, (5) NIC + cocrystal + liquid, and (6) NIC + liquid. Theblack points were selected for TPD verification.
Cocrystal Generation Without Knowledge of Stoichiometric Ratio
for incongruently saturating cocrystals (metastable cocrystals)because the drug going into solution can be followed bycrystallization in a supersaturable system (41–43). Lastly,knowing the critical points c1, c2, and d could accuratelydetermine the main body of the critical region in the TPD(14), indicating that these three points are critical for the TPDconstruction. However, point d is fixed by the cocrystal com-position. Thus, the other two points (c1 and c2) need to be
validated using traditional methods. The results showed thattwo solid phases coexisted and the concentrations in solution(0.97±0.08 mg/mL of MYR and 191.44±0.44 mg/mL ofNIC for c1, 35.64±0.24 mg/mL of MYR and 41.08±0.12 mg/mL of NIC for c2) were close to the predicted values(0.93 mg/mL of MYR and 191.32 mg/mL of NIC for c1,36.18 mg/mL of MYR and 41.69 mg/mL of NIC for c2) atequilibrium, which confirmed that c1 and c2 were actually the
Fig. 10 The DSC results of solidphases at equilibrium. The sample(I, II, III, IV, V, VI, VII, VII, IX)corresponds to the black points inthe TPD, respectively.
Fig. 11 The PXRD results of solid phases at equilibrium and MYR-NIC cocrystal (a), pure NIC (b), pure MYR (c). The sample (I, II, III, IV, V,VI, VII,VII, IX)corresponds to the black points in the TPD, respectively.
Hong et al.
Ctr points. These two experiments validated that our strategyfor cocrystal formation was reasonable.
Here, we introduced a novel strategy for cocrystal forma-tion. First, the PSD of MYR and CCF was constructed, fromwhich the reactant concentrations in solution at equilibriumwere obtained, and the change process of the phases waspredicted. Second, by transforming the curve in the PSD toa TPD, a new region was obtained, which could guide us toprepare pure cocrystals. Third, after determining the compo-sition of the prepared cocrystal by NMR, the TPD of the API-CCF-Solvent system was constructed.
The strategy has several advantages: (1) powder cocrystalscould be prepared without knowledge of the stoichiometricratio; therefore, this method could overcome the shortage ofthe fixed stoichiometric ratio in previous cocrystal research; (2)the TPD of the API-CCF-Solvent system was constructed bycombining the constructed PSD and NMR data before thepure cocrystal was obtained, which was convenient and dif-ferent from the traditional method; (3) cocrystal preparationand the TPD construction were simultaneously performed,indicating that this strategy was an efficient and economicmeasure for cocrystal research. However, similar to the othercocrystal research methods, it has its limitations. For example,the fact that the cocrystal of the drug and CCF could bedefinitively formed in the selected solvent was a preconditionof this strategy. Furthermore, this strategy is not suitable forcocrystals with two or more stoichiometric ratios of API andCCF in the same solvent and temperature because there couldbe three or more invariant points under that condition, whichwould make it difficult to determine their accurate positions inthe TPD. Therefore, to further optimize the strategy andsimultaneously overcome these limitations as well as enlargethemethod’s applicable scope is a critical issue and needs to befurther investigated.
Powder Dissolution Studies
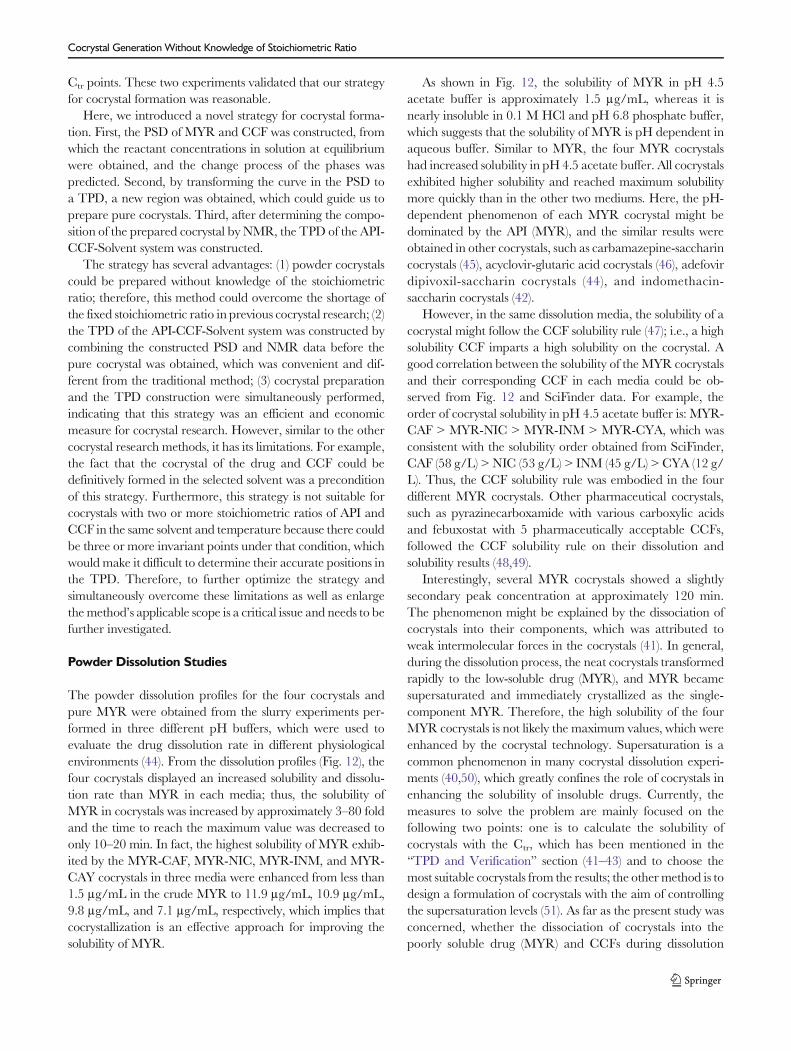
The powder dissolution profiles for the four cocrystals andpure MYR were obtained from the slurry experiments per-formed in three different pH buffers, which were used toevaluate the drug dissolution rate in different physiologicalenvironments (44). From the dissolution profiles (Fig. 12), thefour cocrystals displayed an increased solubility and dissolu-tion rate than MYR in each media; thus, the solubility ofMYR in cocrystals was increased by approximately 3–80 foldand the time to reach the maximum value was decreased toonly 10–20 min. In fact, the highest solubility of MYR exhib-ited by the MYR-CAF, MYR-NIC, MYR-INM, and MYR-CAY cocrystals in three media were enhanced from less than1.5 μg/mL in the crude MYR to 11.9 μg/mL, 10.9 μg/mL,9.8 μg/mL, and 7.1 μg/mL, respectively, which implies thatcocrystallization is an effective approach for improving thesolubility of MYR.
As shown in Fig. 12, the solubility of MYR in pH 4.5acetate buffer is approximately 1.5 μg/mL, whereas it isnearly insoluble in 0.1 M HCl and pH 6.8 phosphate buffer,which suggests that the solubility of MYR is pH dependent inaqueous buffer. Similar to MYR, the four MYR cocrystalshad increased solubility in pH 4.5 acetate buffer. All cocrystalsexhibited higher solubility and reached maximum solubilitymore quickly than in the other two mediums. Here, the pH-dependent phenomenon of each MYR cocrystal might bedominated by the API (MYR), and the similar results wereobtained in other cocrystals, such as carbamazepine-saccharincocrystals (45), acyclovir-glutaric acid cocrystals (46), adefovirdipivoxil-saccharin cocrystals (44), and indomethacin-saccharin cocrystals (42).
However, in the same dissolution media, the solubility of acocrystal might follow the CCF solubility rule (47); i.e., a highsolubility CCF imparts a high solubility on the cocrystal. Agood correlation between the solubility of the MYR cocrystalsand their corresponding CCF in each media could be ob-served from Fig. 12 and SciFinder data. For example, theorder of cocrystal solubility in pH 4.5 acetate buffer is: MYR-CAF > MYR-NIC > MYR-INM > MYR-CYA, which wasconsistent with the solubility order obtained from SciFinder,CAF (58 g/L) > NIC (53 g/L) > INM (45 g/L) > CYA (12 g/L). Thus, the CCF solubility rule was embodied in the fourdifferent MYR cocrystals. Other pharmaceutical cocrystals,such as pyrazinecarboxamide with various carboxylic acidsand febuxostat with 5 pharmaceutically acceptable CCFs,followed the CCF solubility rule on their dissolution andsolubility results (48,49).
Interestingly, several MYR cocrystals showed a slightlysecondary peak concentration at approximately 120 min.The phenomenon might be explained by the dissociation ofcocrystals into their components, which was attributed toweak intermolecular forces in the cocrystals (41). In general,during the dissolution process, the neat cocrystals transformedrapidly to the low-soluble drug (MYR), and MYR becamesupersaturated and immediately crystallized as the single-component MYR. Therefore, the high solubility of the fourMYR cocrystals is not likely the maximum values, which wereenhanced by the cocrystal technology. Supersaturation is acommon phenomenon in many cocrystal dissolution experi-ments (40,50), which greatly confines the role of cocrystals inenhancing the solubility of insoluble drugs. Currently, themeasures to solve the problem are mainly focused on thefollowing two points: one is to calculate the solubility ofcocrystals with the Ctr, which has been mentioned in the“TPD and Verification” section (41–43) and to choose themost suitable cocrystals from the results; the other method is todesign a formulation of cocrystals with the aim of controllingthe supersaturation levels (51). As far as the present study wasconcerned, whether the dissociation of cocrystals into thepoorly soluble drug (MYR) and CCFs during dissolution
Cocrystal Generation Without Knowledge of Stoichiometric Ratio
could be avoided by the above mentioned approaches isunknown and worth future study.
In short, MYR cocrystals present a pH-dependent dissolutionprofile and exhibit a complete and rapid dissolution in all
experimental aqueous media compared to pure MYR, whichis probably because of crystal packing and the process ofcocrystallization. From this research, it can be concluded thatcocrystals provide a new approach for dissolution enhancement
Fig. 12 Powder dissolution profileof MYR and its four cocrystals in0.1 M HCl aqueous solution (a),pH 4.5 acetate buffer (b), andpH 6.8 phosphate buffer (c).
Hong et al.
by forming intermolecular hydrogen bonding between MYRand CCF, which offers opportunities for MYR to be therapeuticagents.
CONCLUSION
Pharmaceutical cocrystals of MYR with CAF, NIC, INM,and CYA were successfully prepared and characterized byDSC, PXRD, IR, SEM, and NMR. A novel strategy forcocrystal preparation without knowledge of the stoichiometricratio based on the TPD principle was developed. First, thePSD of MYR and CCF was constructed and was transformedinto a TPD. Second, two invariant points were inferred and apart of the cocrystal forming region was obtained, whichguided us in preparing pure cocrystal. Third, the TPD ofthe API-CCF-solvent system was completely constructed bydetermining the composition of the cocrystal by NMR. Inaddition, the dissolution results demonstrate that the solubilityand dissolution rates of MYR were significantly improved bycocrystallization with the four CCFs, and all cocrystals exhib-ited pH-dependent solubility.
ACKNOWLEDGMENTS AND DISCLOSURES
This study was sponsored by the National Science Foundationof China (81303304), the Innovation Program of the Shang-hai Municipal Education Commission (14YZ057), the Spe-cialized Research Fund for the Doctoral Program of HigherEducation (20133107120006), and the Nano-specific Projectof the Shanghai Science and Technology Commission(12 nm0502400).
REFERENCES
1. Eddleston MD, Sivachelvam S, Jones W. Screening for polymorphsof cocrystals: a case study. Cryst Eng Comm. 2013;15(1):175–81.
2. Qiao N, Li MZ, Schlindwein W, Malek N, Davies A, Trappitt G.Pharmaceutical cocrystals: an overview. Int J Pharm. 2011;419(1–2):1–11.
3. Seliger J, Zagar V. Nuclear quadrupole resonance characterizationof carbamazepine cocrystals. Solid State Nucl Magn Reson.2012;47–48(1):47–52.
4. Yamamoto K, Tsutsumi S, Ikeda Y. Establishment of cocrystalcocktail grinding method for rational screening of pharmaceuticalcocrystals. Int J Pharm. 2012;437(1–2):162–71.
5. Lipinski CA. Drug-like properties and the causes of poor solubilityand poor permeability. J Pharmacol Toxicol Methods. 2000;44(1):235–49.
6. Ong KC, Khoo HE. Biological effects of myricetin. Gen PharmacolVasc Sys. 1997;29(2):121–6.
7. Scheidt HA, Pampel A, Nissler L, Gebhardt R, Huster D.Investigation of the membrane localization and distribution of
flavonoids by high-resolution magic angle spinning NMR spectros-copy. Biochim Biophys Acta. 2004;1663(1–2):97–107.
8. Kim H, Choi J, Jung S. Inclusion complexes of modified cyclodex-trins with some flavonols. J Incl Phenom Macrocycl Chem.2009;64(1–2):43–7.
9. Mira L, Fernandez MT, Santos M, Rocha R, Florencio MH,Jennings KR. Interactions of flavonoids with iron and copper ions:a mechanism for their antioxidant activity. Free Radic Res.2002;36(11):1199–208.
10. Roedig-Penman A, Gordon MH. Antioxidant properties ofmyricetin and quercetin in oil and emulsions. J Am Oil Chem Soc.1998;75(2):169–80.
11. Ma ZG, Liu TW. Myricetin facilitates potassium currents and in-hibits neuronal activity of PVN neurons. Neurochem Res.2012;37(7):1450–6.
12. Yao YS, Lin GB, Xie Y, Ma P, Li GW, Meng QC, et al.Preformulation studies of myricetin: a natural antioxidant flavonoid.Die Pharm. 2014;69(1):19–26.
13. Variankaval N,Wenslow R,Murry J, Hartman R, Helmy R, KwongE, et al. Preparation and solid-state characterization ofnonstoichiometric cocrystals off a phosphodiesterase-IV inhibitorannul L-tartaric acid. Cryst Growth Des. 2006;6(3):690–700.
14. Leung DH, Lohani S, Ball RG, Canfield N, Wang YL, Rhodes T,et al. Two novel pharmaceutical cocrystals of a development com-pound–screening, scale-up, and characterization. Cryst Growth Des.2012;12(3):1254–62.
15. Arenas-Garcia JI, Herrera-Ruiz D, Mondragon-Vasquez K,Morales-Rojas H, Hopfl H. Modification of the supramolecularhydrogen-bonding patterns of acetazolamide in the presence ofdifferent cocrystal formers: 3:1, 2:1, 1:1, and 1:2 cocrystals fromscreening with the structural isomers of hydroxybenzoic acids,aminobenzoic acids, hydroxybenzamides, aminobenzamides, nico-tinic acids, nicotinamides, and 2,3-dihydroxybenzoic acids. CrystGrowth Des. 2012;12(2):811–24.
16. Ando S, Kikuchi J, Fujimura Y, Ida Y, Higashi K, Moribe K, et al.Physicochemical characterization and structural evaluation of a spe-cific 2:1 cocrystal of naproxen-nicotinamide. J Pharm Sci.2012;101(9):3214–21.
17. Gangopadhyay P, Radhakrishnan TP. Visualizing supramolecular mac-rocyclic formations. Mol Cryst Liq Cryst. 2001;369(1):167–219.
18. Yenikaya C, Ogretir C. A quantum chemical study on structure ofcocrystal of triphenylphosphine oxide and hydroquinone. J MolStruct THEOCHEM. 2005;731(1–3):1–5.
19. Jayasankar A, Reddy LS, Bethune SJ, Rodriguez-Hornedo N. Roleof cocrystal and solution chemistry on the formation and stability ofcocrystals with different stoichiometry. Cryst Growth Des. 2009;9(2):889–97.
20. Chiarella RA, Davey RJ, Peterson ML. Making co-crystals–the utility of ternary phase diagrams. Cryst Growth Des.2007;7(7):1223–6.
21. Rodriguez-Hornedo N, Nehru SJ, Seefeldt KF, Pagan-Torres Y,Falkiewicz C. Reaction crystallization of pharmaceutical molecularcomplexes. Mol Pharm. 2006;3(3):362–7.
22. Good DJ, Rodriguez-Hornedo N. Cocrystal eutectic constants andprediction of solubility behavior. Cryst Growth Des. 2010;10(3):1028–32.
23. Nehm SJ, Rodriguez-Spong B, Rodriguez-Hornedo N. Phase solu-bility diagrams of cocrystals are explained by solubility product andsolution complexation. Cryst Growth Des. 2006;6(2):592–600.
24. Zhang S, Rasmuson AC. Thermodynamics and crystallization of thetheophylline-glutaric acid cocrystal. Cryst Growth Des. 2013;13(3):1153–61.
25. Grossjohann C, Eccles KS, Maguire AR, Lawrence SE, Tajber L,Corrigan OI, et al. Characterisation, solubility and intrinsic dissolu-tion behaviour of benzamide: dibenzyl sulfoxide cocrystal. Int JPharm. 2012;422(1–2):24–32.
Cocrystal Generation Without Knowledge of Stoichiometric Ratio
26. Childs SL, Rodriguez-Hornedo N, Reddy LS, Jayasankar A,Maheshwari C, McCausland L, et al. Screening strategies based onsolubility and solution composition generate pharmaceutically ac-ceptable cocrystals of carbamazepine. Cryst Eng Comm. 2008;10(7):856–64.
27. Ainouz A, Authelin JR, Billot P, Lieberman H. Modeling and predic-tion of cocrystal phase diagrams. Int J Pharm. 2009;374(1–2):82–9.
28. Croker DM, Foreman ME, Hogan BN, Maguire NM, Elcoate CJ,Hodnett BK, et al. Understanding the p-toluenesulfonamide/triphenylphosphine oxide crystal chemistry: a new 1:1 cocrystal andternary phase diagram. Cryst Growth Des. 2012;12(2):869–75.
29. Seaton CC, Parkin A, Wilson CC, Blagden N. Controlling theformation of benzoic acid: isonicotinamide molecular complexes.Cryst Growth Des. 2009;9(1):47–56.
30. Eddleston MD, Lloyd GO, Jones W. Cocrystal dissociation andmolecular demixing in the solid state. Chem Commun.2012;48(65):8075–7.
31. Vangala VR, Chow PS, Tan RBH. Co-crystals and co-crystal hy-drates of the antibiotic nitrofurantoin: structural studies and physico-chemical properties. Cryst Growth Des. 2012;12(12):5925–38.
32. Schultheiss N, Newman A. Pharmaceutical cocrystals and their phys-icochemical properties. Cryst Growth Des. 2009;9(6):2950–67.
33. Stanton MK, Bak A. Physicochemical properties of pharmaceuticalco-crystals: a case study of ten AMG 517 co-crystals. Cryst GrowthDes. 2008;8(10):3856–62.
34. Weyna DR, Shattock T, Vishweshwar P, Zaworotko MJ. Synthesisand structural characterization of cocrystals and pharmaceuticalcocrystals: mechanochemistry vs. slow evaporation from solution.Cryst Growth Des. 2009;9(2):1106–23.
35. Espinosa-Lara JC, Guzman-Villanueva D, Arenas-Garcia JI,Herrera-Ruiz D, Rivera-Islas J, Roman-Bravo P, et al. Cocrystals ofactive pharmaceutical ingredients-praziquantel in combination withoxalic, malonic, succinic, maleic, fumaric, glutaric, adipic, andpimelic acids. Cryst Growth Des. 2013;13(1):169–85.
36. Mohamed S, Tocher DA, Price SL. Computational prediction of saltand cocrystal structures-does a proton position matter? Int J Pharm.2011;418(2):187–98.
37. Alhalaweh A, George S, Basavoju S, Childs SL, Rizvi SAA, VelagaSP. Pharmaceutical cocrystals of nitrofurantoin: screening, charac-terization and crystal structure analysis. Cryst Eng Comm.2012;14(15):5078–88.
38. Guo K, Sadiq G, Seaton C, Davey R, Yin QX. Co-crystallization inthe caffeine/maleic acid system: lessons from phase equilibria. CrystGrowth Des. 2010;10(1):268–73.
39. Yamashita H, Hirakura Y, Yuda M, Teramura T, Terada K.Detection of cocrystal formation based on binary phase. PharmRes. 2013;30(1):70–80.
40. Thakuria R, Delori A, Jones W, Lipert MP, Roy L, Rodriguez-Hornedo N. Pharmaceutical cocrystals and poorly soluble drugs.Int J Pharm. 2013;453(1):101–25.
41. Bethune SJ, Huang N, Jayasankar A, Rodriguez-Hornedo N.Understanding and predicting the effect of cocrystal componentsand pH on cocrystal solubility. Cryst Growth Des. 2009;9(9):3976–88.
42. Alhalaweh A, Roy L, Rodriguez-Hornedo N, Velaga SP. pH-dependent so lub i l i ty of indomethacin-sacchar in andcarbamazepine-saccharin cocrystals in aqueous media. Mol Pharm.2012;9(9):2605–12.
43. Reddy LS, Bethune SJ, Kampf JW, Rodriguez-Hornedo N.Cocrystals and salts of gabapentin: pH dependent cocrystal stabilityand solubility. Cryst Growth Des. 2009;9(1):378–85.
44. Gao YA, Zu H, Zhang JJ. Enhanced dissolution and stability ofadefovir dipivoxil by cocrystal formation. J Pharm Pharmacol.2011;63(4):483–90.
45. Rahman Z, Samy R, Sayeed VA, Khan MA. Physicochemical andmechanical properties of carbamazepine cocrystals with saccharin.Pharm Dev Technol. 2012;17(4):457–65.
46. Bruni G, Maietta M, Maggi L, Mustarelli P, Ferrara C, Berbenni V,et al. Preparation and physicochemical characterization of acyclovircocrystals with improved dissolution properties. J Pharm Sci.2013;102(11):4079–86.
47. Bolla G, Sanphui P, Nangia A. Solubility advantage of tenoxicamphenolic cocrystals compared to salts. Cryst Growth Des. 2013;13(5):1988–2003.
48. Maddileti D, Jayabun SK, Nangia A. Soluble cocrystals of thexanthine oxidase inhibitor febuxostat. Cryst Growth Des.2013;13(7):3188–96.
49 . Luo YH, Sun BW. Pharmaceu t i c a l c o - c r y s t a l s o fpyrazinecarboxamide (PZA) with various carboxylic acids: crystal-lography, hirshfeld surfaces, and dissolution study. Cryst GrowthDes. 2013;13(5):2098–106.
50. Shiraki K, Takata N, Takano R, Hayashi Y, Terada K. Dissolutionimprovement and the mechanism of the improvement fromcocrystallization of poorly water-soluble compounds. Pharm Res.2008;25(11):2581–92.
51. Childs SL, Kandi P, Lingireddy SR. Formulation of a danazolcocrystal with controlled supersaturation plays an essential role inimproving bioavailability. Mol Pharm. 2013;10(8):3112–27.
Hong et al.


![Research Article Effect of Myricetin, Pyrogallol, and ...downloads.hindawi.com/journals/omcl/2015/782504.pdf · Effect of Myricetin, Pyrogallol, and Phloroglucinol on ... glucose]](https://img.pdfslide.us/doc/110x75/5aa7e2b77f8b9a54748c9ce1/research-article-effect-of-myricetin-pyrogallol-and-of-myricetin-pyrogallol.jpg)