Embed Size (px)
Citation preview
Zhang et al. Bioresour. Bioprocess. (2021) 8:77 https://doi.org/10.1186/s40643-021-00429-8
RESEARCH
A novel strategy for D-psicose and lipase co-production using a co-culture system of engineered Bacillus subtilis and Escherichia coli and bioprocess analysis using metabolomicsJun Zhang1,2,4 , Wen Luo1, Zhiyuan Wang1, Xiaoyan Chen1,4, Pengmei Lv1* and Jingliang Xu1,3*
Abstract
To develop an economically feasible fermentation process, this study designed a novel bioprocess based on the co-culture of engineered Bacillus subtilis and Escherichia coli for the co-production of extracellular D-psicose and intracel-lular lipase. After optimizing the co-culture bioprocess, 11.70 g/L of D-psicose along with 16.03 U/mg of lipase was obtained; the glucose and fructose were completely utilized. Hence, the conversion rate of D-psicose reached 69.54%. Compared with mono-culture, lipase activity increased by 58.24%, and D-psicose production increased by 7.08%. In addition, the co-culture bioprocess was explored through metabolomics analysis, which included 168 carboxylic acids and derivatives, 70 organooxygen compounds, 34 diazines, 32 pyridines and derivatives, 30 benzene and substituted derivatives, and other compounds. It also could be found that the relative abundance of differential metabolites in the co-culture system was significantly higher than that in the mono-culture system. Pathway analysis revealed that, tryp-tophan metabolism and β-alanine metabolism had the highest correlation and played an important role in the co-culture system; among them, tryptophan metabolism regulates protein synthesis and β-alanine metabolism, which is related to the formation of metabolic by-products. These results confirm that the co-cultivation of B. subtilis and E. coli can provide a novel idea for D-psicose and lipase biorefinery, and are beneficial for the discovery of valuable second-ary metabolites such as turanose and morusin.
Highlights
Co-cultivation was firstly carried out for the co-production of D-psicose and lipase.
The carbon source glucose and fructose were fully utilized during co-culture.
The yield of D- psicose was 11.70 g/L, and the conversion rate reached 69.54%.
Self-induced expression of lipase was realized with enzyme activity of 16.03 U/mg.
Metabolomics analyses were used to explore the co-culture effects of mixed strains.
Keywords: D-Psicose, Lipase, Escherichia coli, Bacillus subtilis, Co-culture, Metabolomics
© The Author(s) 2021. Open Access This article is licensed under a Creative Commons Attribution 4.0 International License, which permits use, sharing, adaptation, distribution and reproduction in any medium or format, as long as you give appropriate credit to the original author(s) and the source, provide a link to the Creative Commons licence, and indicate if changes were made. The images or other third party material in this article are included in the article’s Creative Commons licence, unless indicated otherwise in a credit line to the material. If material is not included in the article’s Creative Commons licence and your intended use is not permitted by statutory regulation or exceeds the permitted use, you will need to obtain permission directly from the copyright holder. To view a copy of this licence, visit http:// creat iveco mmons. org/ licen ses/ by/4. 0/.
IntroductionD-Psicose is a rare sugar and a new type of functional sweetener with excellent physiological effects such as anti-hyperglycemic and anti-hyperlipidemic effects
Open Access
*Correspondence: [email protected]; [email protected] Guangdong Provincial Key Laboratory of New and Renewable Energy Research and Development, Guangzhou Institute of Energy Conversion, Chinese Academy of Sciences, CAS Key Laboratory of Renewable Energy, Guangzhou 510640, ChinaFull list of author information is available at the end of the article
Page 2 of 18Zhang et al. Bioresour. Bioprocess. (2021) 8:77
(Chen et al. 2019; Zhang et al. 2016). Therefore, it is widely used in food, medicine, and other fields. Presently, enzymatic conversion is the most important method for the synthesis of D-psicose, and under the catalytic action of ketose 3-epimerases, D-fructose can be isomerized into D-psicose, which is the current hot spot of D-psicose synthesis (Jiang et al. 2020). However, the use of fer-mentation methods for the cultivation of engineered Bacillus subtilis, which harbors the D-tagatose 3-epime-rase (DTEase) gene, has the potential to directly produce D-psicose as reported in a previous study (Zhang et al. 2020a). The conversion rate of the substrate can reach 56.26%, which is a great advantage in realizing the cou-pling of cell growth and D-psicose production, thereby reducing the biosynthesis costs.
Lipase is a hydrolase which acts on the ester bond with catalytic diversity, and it is also one of the most widely used biocatalysts in industrial production (Melani et al. 2020). Geobacillus thermocatenulatus lipase 2 (GTL2) is a typical thermophilic enzyme with high catalytic activity and good thermal stability and has several applications in pharmaceutical and organic synthesis, chiral com-pound resolution, and bioenergy; thus, it is a promising biocatalyst with great application potential (Godoy et al. 2019; Kajiwara et al. 2020). In addition, Escherichia coli has a short culture cycle with high target protein levels, which makes it a good host for expressing GTL2. Under the induction of expensive IPTG, GTL2 achieved solu-ble expression in E. coli, and the enzyme activity reached 39.50 U/mg in a previous study (Zhang et al. 2020b). However, to enhance the fermentation economy, it is desirable to induce GTL2 expression using α-lactose.
Presently, single-bacterial fermentation of lipase may cause excessive production costs, whereas mixed-bac-terial fermentation of expensive D-psicose can reduce the fermentation costs. This innovation in traditional fermentation not only reduces the overall cost, but also improves the quality of fermentation. In addition, co-culture bioprocess can also effectively utilize glucose and fructose, which is of relevance for complex substrates, such as waste fruit and vegetable hydrolysate (Jiang et al. 2017), to achieve the goal of carbon neutrality, and the full consumption of the carbon source is conducive to the subsequent separation of D-psicose. Furthermore, in pre-vious studies, the extracellular production of D-psicose in recombinant B. subtilis (Zhang et al. 2020a) and the soluble expression of GTL2 in engineered E. coli (Zhang et al. 2020b) have been achieved. Hence, it is better to explore the possibility of co-production of D-psicose and lipase using co-culture to develop a more economical fer-mentation process.
Based on this principle of symbiosis (Wein et al. 2019), the co-culture of microorganisms is used to ferment
mixed microorganisms with complementary advan-tages (Bertrand et al. 2014; Rosero-Chasoy et al. 2021). Furthermore, it has a strong ability to tolerate harsh environments, such as infection, substrate, and prod-uct inhibition; hence, better fermentation results can be obtained. Currently, there are two main forms of co-culture systems (Wein et al. 2019): (a) the co-cultivation of unknown microbial flora isolated from nature and (b) the co-cultivation of artificially designed microbial flora. Compared with the former, the latter system is relatively fragile; therefore, there should be a careful selection of the combined strains. To ensure the efficient and stable growth of the co-culture system, the population ratio in a reasonable range and external conditions at certain stages, which are favored by priority populations, has been maintained through optimized medium compo-nents and strengthened process regulation (Klitgord and Segre 2010). B. subtilis and E. coli are Gram-positive and Gram-negative bacteria, respectively. They have a well-mapped genetic background and are commonly used as model organisms. Under optimized co-culture condi-tions, they can produce effective synergistic effects and increase the yield of target products (Faust and Raes 2012). Recently, indole (an aromatic heterocyclic organic compound) was produced by co-cultivation of E. coli and B. subtilis with significantly improved yield (Singh et al. 2020).
The construction of an artificial co-culture system is relatively easy and simple, but metabolic regulation is rel-atively complicated. Thus, it is necessary to use metabo-lomics analysis to explore the symbiotic effects of mixed strains. In general, metabolomics is defined as the study of the overall metabolite spectrum in a system (cell, tis-sue, or organism) under given conditions. It is a collection of small molecular metabolites with a molecular weight of less than 1000 in biological samples (Patti et al. 2012). A large amount of qualitative and quantitative metabolite data can be obtained and classified according to specific metabolic pathways to construct metabolic networks and infer their physiological functions to be able to more comprehensively analyze the dynamic metabolic reac-tions of organisms in response to environmental changes. Microbial metabolites, as well as the identification of metabolic variations in different environments, can easily be screened through effective analytical methods, such as liquid chromatography–mass spectrometry (LC–MS) based on the UHPLC–QE-MS nontargeted metabo-lomics approach (Cheng et al. 2020; Xia et al. 2020). However, there is limited information about the differ-ential metabolites and key metabolic pathways in the co-culture process of B. subtilis and E. coli in the exist-ing literature. Hence, the screening of major differential metabolites and metabolic pathways using metabolomics
Page 3 of 18Zhang et al. Bioresour. Bioprocess. (2021) 8:77
analysis can better manipulate the co-cultivation process of B. subtilis and E. coli, which is beneficial to the stable operation of the co-culture system.
In this study, a co-culture system of recombinant B. subtilis and E. coli was developed to explore the co-pro-duction of D-psicose and lipase. The feasibility of co-production by bacterial cultivation was verified through shake-flask cultures, and the mixed strains using a fer-mentation tank to increase D-psicose production and lipase activity were also carried out. With the help of metabolomics, a comparative analysis was performed to evaluate the metabolites of the co-culture or mono-cul-ture. Combined with the KEGG database and network analysis, the metabolic pathways that played an impor-tant role in the bioprocess were also investigated to clar-ify the metabolic regulation of the artificial co-culture system.
Materials and methodsStrains and mediaIn this study, engineered B. subtilis (Zhang et al. 2020a) and E. coli (Zhang et al. 2020b) were used to produce D-psicose and GTL2, respectively, through a co-culture bioprocess. Luria–Bertani (LB) medium containing appropriate antibiotics (50 µg/mL kanamycin) was used as a seed medium, which consisted of tryptone (10 g/L), yeast extract (5 g/L), and NaCl (10 g/L) (Sezonov et al. 2007). The fermentation medium (Studier 2005) com-prised yeast extract (15 g/L), glucose (10 g/L), fruc-tose (10 g/L), α-lactose (2 g/L), NaCl (8 g/L), KH2PO4 (3.40 g/L), Na2HPO4 (3.55 g/L), (NH4)2SO4 (6.61 g/L), MgSO4•7H2O (0.71 g/L), MnCl4•4H2O (0.99 g/L), and kanamycin (50 µg/mL). All experimental materials were supplied by Sangon Biotech Co., Ltd. (Shanghai, China).
Construction of co‑culture system using engineered B. subtilis and E. coliTo explore the feasibility of co-fermentation of recombi-nant strains, 1 mL of seed cultures for recombinant B. subtilis and E. coli were transferred into a 500-mL shake-flask containing 200 mL of LB medium and incubated at 37 °C and 200 rpm for 24 h. A cell pellet was obtained through centrifugation (8000 × g, 5 min), which was washed with deionized water. Next, a suitable amount of bacterial solution was used to prepare a smear, and the distribution of these cells was analyzed using Gram stain-ing. The resulting protein solution of bacterial co-culture through ultrasonic disruption of cell pellets was analyzed using sodium dodecyl sulfate polyacrylamide gel electro-phoresis (SDS-PAGE). In addition, the mono-culture of the engineered B. subtilis and E. coli was prepared under the same conditions as the above co-culture, and the
protein solution obtained was subjected to protein level analysis using SDS-PAGE.
Lipase activity analysisLipase activity was determined using enzymatic hydrol-ysis of ρ-nitrophenol released from the substrate ρ-nitrophenyl palmitate in Tris–HCl buffer (50 mM, pH 8.0) at 60 °C. Under the detection conditions, the amount of enzyme required to release 1 µmol of ρ-nitrophenol through hydrolysis per unit time was defined as the unit enzyme activity (U/mg). Furthermore, optical density (OD410 and OD562) analysis was also carried out for the determination of ρ-nitrophenol and protein concentra-tion according to a previous study (Zhang et al. 2020a).
Optimization of co‑culture conditions using shake‑flask culturesTo optimize the co-production of D-psicose and lipase, the effects of fermentation factors such as time (0–32 h), temperature (28–40 °C), pH (6.0–9.0), D-fructose (5–30 g/L), α-lactose (0–10 g/L), and inoculation ratio (B. subtilis: E. coli = 4:1–1:4) were investigated. Glyc-erol stock strains (200 µL) were inoculated in a 500-mL Erlenmeyer flask containing 200 mL of LB medium and were cultured at 37 °C and 180 rpm for 16–18 h as seed cultures. Then, a certain inoculation ratio of engineered B. subtilis and E. coli (B. subtilis: E. coli = 2:1) was inocu-lated in a 250-mL Erlenmeyer flask containing 50 mL of fermentation medium, which was, then cultured at 37 °C and 200 rpm for 24 h. At the end of fermentation, the supernatant and cell pellets were collected. The superna-tant was tested for the concentration of D-psicose, and the pellet was washed with deionized water and resus-pended in Tris–HCl buffer (pH 8.0). Afterwards, the ultrasonication process was employed to prepare lipase solution.
Co‑production of D‑psicose and lipase using fermentation tankSeed cultures (3%) were transferred into two identical 1-L fermenters (Applikon Biotechnology, Netherlands) containing 500 mL of fermentation medium (pH 6.0) for batch cultivation, according to the 1:2 inoculation ratio of recombinant B. subtilis and E. coli, which was then kept at 37 °C and 200 rpm for 24 h. Meanwhile, sterile dry air was introduced at a rate of 3 L/min for 10 h during the fermentation process. For comparison with the co-fer-mentation of recombinant strains, the engineered B. sub-tilis and E. coli were cultured with an inoculum of 1% and 2%, respectively, under the same conditions.
Page 4 of 18Zhang et al. Bioresour. Bioprocess. (2021) 8:77
Transmission electron microscopy (TEM) and heteronuclear single quantum coherence (HSQC) analysisTEM (FEI, Hitachi Ltd, Japan) analysis was carried out after taking appropriate recombinant cells fixed with 2.5% glutaraldehyde at the end of batch-fermentation, and this test was performed by Servicebio Co., Ltd (Wuhan, China); An appropriate amount of co-culture superna-tant was processed with a freeze dryer, fully dissolved in deuterated water, and loaded into a nuclear magnet tube. Finally, HSQC was performed using nuclear magnetic resonance (AVANCE III, Bruker, Germany).
Samples and metabolites extractionThe samples used for metabolomics analysis were obtained from the mono-culture of B. subtilis and E. coli and their co-culture (Additional file 1: Table S1). Each group contained four samples in duplicate, which were used for intracellular and extracellular metabo-lomics analyses. For extracellular metabolite collection, the culture medium was first mixed, and then a certain amount of medium was immediately centrifuged at 4 °C (1000 × g, 10 min). Afterwards, 500 µL of the superna-tant was transferred into a new centrifuge tube, placed in liquid nitrogen to quench for 30 s, and then stored at − 80 °C. For intracellular metabolite collection, the OD600 of the bacteria was first measured to calculate the volume of culture medium required for 1 × 10⁷ cells and then centrifuged at 4 °C (1000 × g, 10 min). Next, the bac-terial solution was separated; the supernatant and strain were removed, immersed in liquid nitrogen to quench for 30 s, thawed on ice, and then washed with 1 × PBS buffer (pre-cooled at 4 °C or 20 °C). PBS buffer was then removed by centrifugation and finally stored at − 80 °C. The extraction methods for intracellular and extracellular metabolites were the same. Briefly, samples (100 µL) were extracted with cold acetonitrile and methanol (400 µL, 1:1), sonicated for 10 min in an ice bath, followed by incubation for 1 h at − 40 °C and centrifugation at 4 °C (8000 × g, 15 min). Therefore, the supernatant obtained was used for LC–MS analysis. Because the analysis prin-ciple and step of the positive ion mode are the same as the negative ion mode with only slight differences in numerical values, in this study, the positive ion mode was used as an example to illustrate the metabolome data.
Metabolomics data and statistical analysisThe raw data were converted to the mzXML format using ProteoWizard and processed with an in-house program, which was developed using R and based on XCMS, for peak detection, extraction, alignment, and integration
(Dunn et al. 2011). Then an in-house MS2 database cre-ated by Shanghai Biotree Biotech Co., Ltd. (Shanghai, China) was used for metabolite annotation, and the cut-off for annotation was set at 0.3. The final dataset con-taining peak number, sample name, and normalized peak area was imported into SIMCA15.0.2 (Sartorius Stedim Data Analytics AB, Umea, Sweden) for principal com-ponent analysis (PCA) (Jolliffe and Cadima 2016) and orthogonal projections to latent structures-discriminate analysis (OPLS-DA) (Wiklund et al. 2008). The Student’s t-test (p < 0.05) was used to evaluate the variables (Sac-centi et al. 2014). In addition, commercial databases, including KEGG (http:// www. genome. jp/ kegg/) and MetaboAnalyst (http:// www. metab oanal yst. ca/) were used for the comprehensive analysis of metabolic net-works (Kanehisa and Goto 2000; Xia et al. 2015). Fur-thermore, regulatory network analyses of differential metabolites were also performed (Picart-Armada et al. 2018).
Analytic methodsThe optical densities of OD410, OD562, and OD600 were analyzed using an Eon Microplate Reader (Gene Com-pany Limited, Chai Wan, Hong Kong). Glucose, D-fruc-tose, and D-psicose were quantitatively analyzed using high performance liquid chromatography (HPLC) equipped with a Waters RID-2414 detector and a Sugar-Pak I column (Waters, Milford, MA, US). The column was eluted with water at a flow rate of 0.4 mL/min at 90 °C. The concentrations of formic, acetic, and glycolic acids were detected using HPLC equipped with RID-2414 and PDA-2998 detectors, and a sugar park SH-1011 col-umn (Waters, Milford, MA, US). The column was eluted with 5 mM sulfuric acid at a flow rate of 0.5 mL/min at 50 °C. Metabolomics analysis was performed by Shanghai Biotree biotech Co., Ltd. (Shanghai, China). Specifically, UPLC-Q-TOF–MS/Ms (Vanquish, Thermo Fisher Sci-entific) with a UPLC BEH Amide column (2.1 × 100 mm, 1.7 µm) was set at 30 °C and coupled to Q Exactive HFX mass spectrometer (Orbitrap MS, Thermo), which was used to assess the metabolites. The mobile phase con-sisted of 25 mmol/L ammonium acetate and 25 mmol/L ammonium hydroxide in water (pH = 9.75) (A) and acetonitrile (B). The analysis was performed with elu-tion gradient as follows: 0–0.5 min, 95% B; 0.5–7.0 min, 95–65% B; 7.0–8.0 min, 65–40% B; 8.0–9.0 min, 40% B; 9.0–9.1 min, 40–95% B; and 9.1–12.0 min, 95% B. The auto-sampler temperature was 4 °C, and the injection volume was 2 µL.
Page 5 of 18Zhang et al. Bioresour. Bioprocess. (2021) 8:77
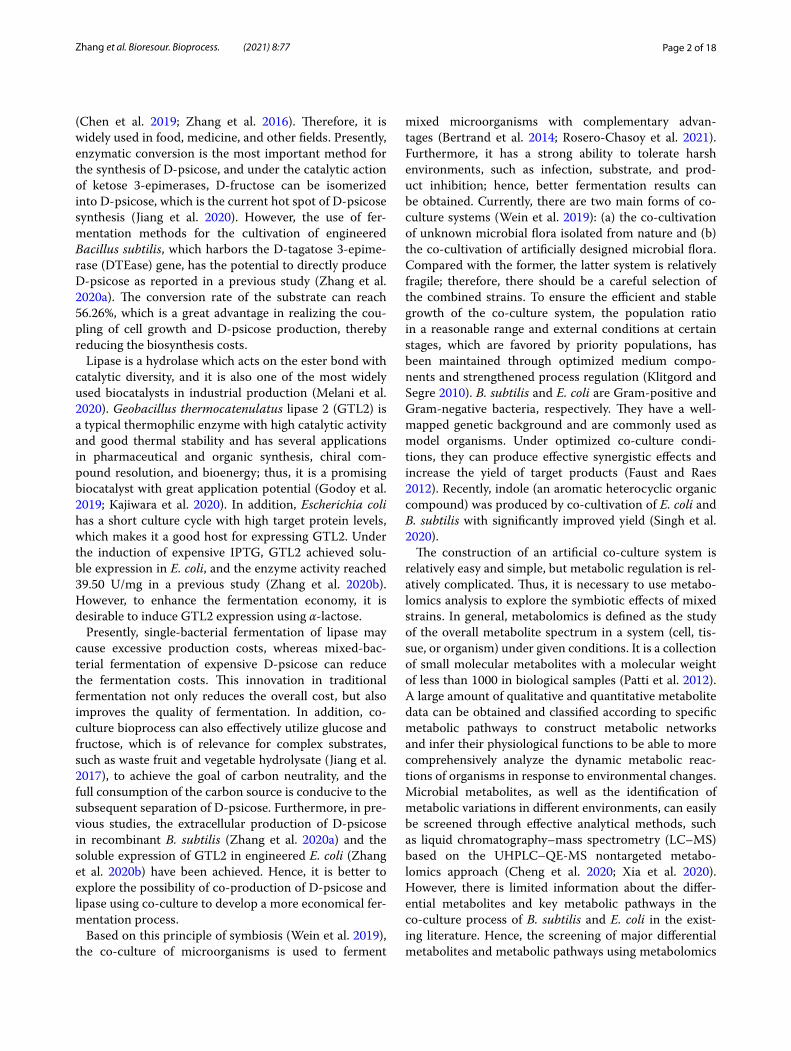
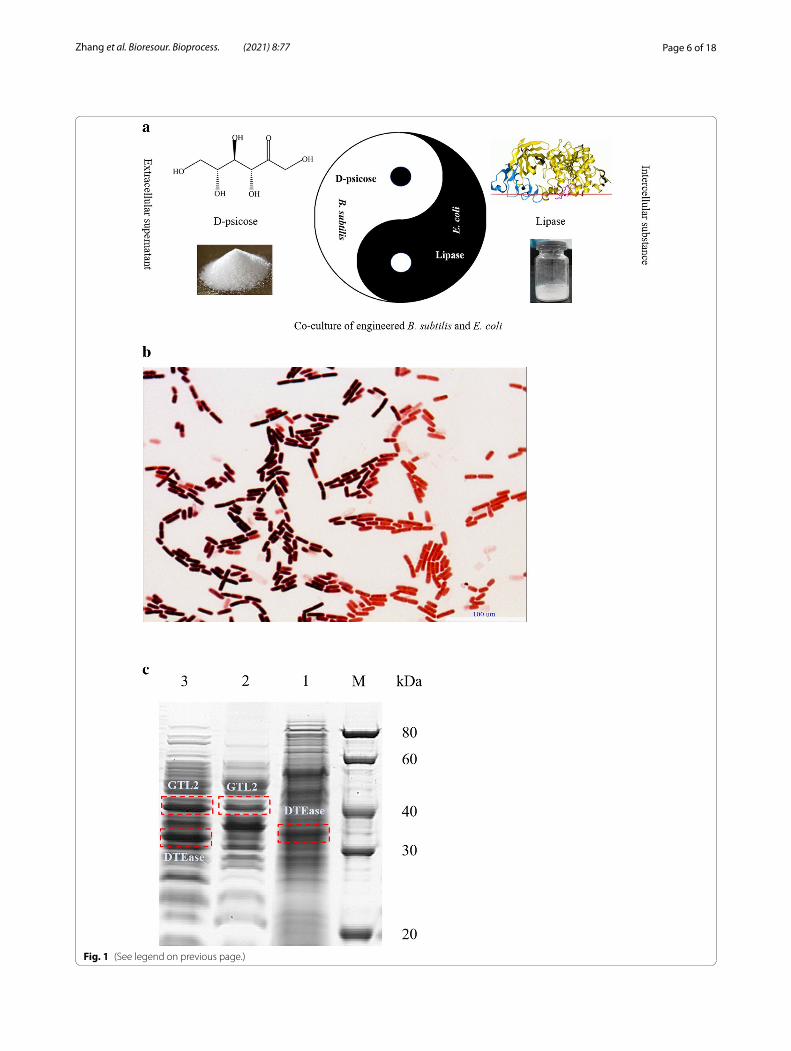
Results and discussionOptimization of the co‑culture system of engineered B. subtilis and E. coliIntracellular lipase and extracellular D-psicose produc-tion have been achieved using recombinant strains in previous studies (Zhang et al. 2020a, b). Therefore, in this study, to develop a more economical fermentation process, co-cultivation of engineered B. subtilis and E. coli for the co-production of D-psicose and lipase was used (Fig. 1a). The recombinant strains in the co-culture system were analyzed using Gram staining analysis as shown in Fig. 1b. In the co-culture process, B. subtilis and E. coli were evenly distributed, and the purple and red staining results were more prominent compared with that observed in mono-culture process showing obvious characteristics of Gram-positive and negative bacteria. This result suggests that the artificially constructed co-culture system of engineered B. subtilis and E. coli could exist stably and grow normally. In addition, it can be seen from Fig. 1c that the protein level bands of recombinant DTEase and GTL2 became wider and darker after co-cultivation of B. subtilis and E. coli, which showed that the expression of the target protein increased. It was also confirmed that the mixed bacteria had a certain syner-gistic effect on cell growth via the co-culture bioprocess, which could effectively increase the cell concentration, thereby increasing the protein content.
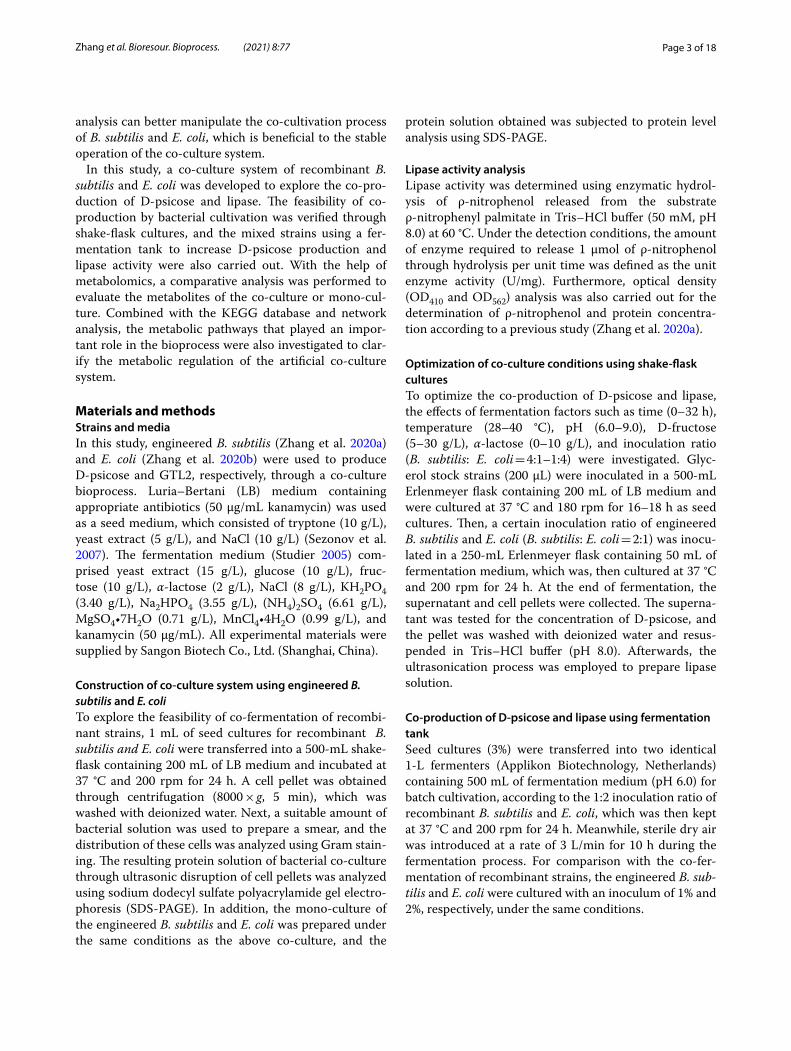
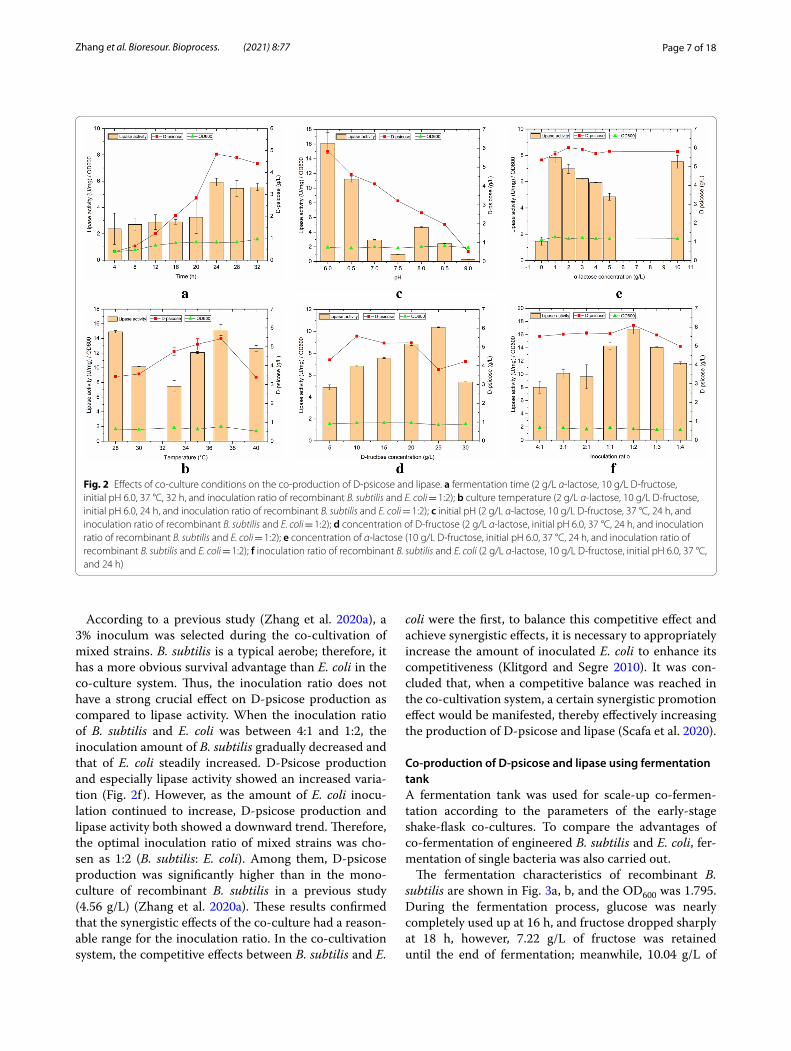
As depicted in Fig. 2a, within 0–24 h, lipase activ-ity, D-psicose, and cell concentration, increased with the extension of fermentation time, and when the time exceeded 24 h, cell growth of recombinant strains declined due to the limited growing space and nutrients. Thus, the best fermentation time was selected as 24 h, and 4.83 g/L of D-psicose together with 5.93 U/mg of lipase activity were obtained.
As shown in Fig. 2b, temperature had a significant effect on the co-culture process. This might be because the effects of temperature on co-culture not only affected the growth of recombinant cells, but also restricted the isomerization between fructose and D-psicose. In addition, temperature also affected the expression of recombinant lipase. Thus, the optimal fermentation tem-perature was 37 °C.
The effects of the initial pH of the medium on the co-culture bioprocess are depicted in Fig. 2c, which resem-ble the effects of temperature. The relatively low pH was beneficial to the increase in lipase activity and D-psicose production, with an initial pH of 6.0. This is because the
initial pH is not only closely related to enzyme activity, but also affects the absorption of external substances by cells (Fang and Liu 2002). Therefore, it was inferred that an acidic environment was conducive to the synergistic promotion of the mixed strains. Thus, D-psicose produc-tion and lipase activity were the highest at an initial pH of 6.0.
The effects of fructose concentration are demonstrated in Fig. 2d. Fructose was used as a carbon source and as a reaction substrate during the co-fermentation process. However, the lipase activity and D-psicose showed vary-ing trends at different fructose concentrations. In the range of 5–10 g/L, D-psicose production was enhanced with an increase in fructose concentration, and then with the increase in fructose concentration, D-psicose produc-tion showed a downward trend. There was a threshold for the isomerization reaction, which is catalyzed by epime-rase; however, too much fructose might be required to promote the isomerization reaction causing an inhibi-tory effect to some extent. In contrast, in the range of 5–25 g/L, lipase activity was improved with an increase in fructose concentration. This may be due to E. coli prefer-ring fructose as a carbon source. The highest lipase activ-ity was 10.37 U/mg. Meanwhile, D-psicose production (3.80 g/L) was found to be lower. This decrease strongly proved that, in the presence of an abundant quantity of fructose, E. coli attained a more competitive advantage than B. subtilis. Subsequently, the reduction in enzymatic activity occurred due to the decline in E. coli. Consider-ing the fermentation costs in the later stage, we used a 10 g/L concentration of fructose, 5.58 g/L of D-psicose, and 6.83 U/mg of lipase activity.
α-Lactose was used to achieve the self-induced expres-sion of lipase to avoid the expensive inducer IPTG (Crowley and Rafferty 2019). The effect of α-lactose on the co-culture is shown in Fig. 2e. Varying the concen-tration of α-lactose had little effect on D-psicose pro-duction; when 2 g/L of α-lactose was used, 6.01 g/L of D-psicose and 6.98 U/mg of lipase activity was obtained. The concentration of α-lactose between 1 and 5 g/L has demonstrated a greater influence on lipase activity, as the increase in lactose concentration is related to a down-ward trend in the lipase activity. The α-lactose entered the cells directly under the action of the α-lactose per-meating enzyme, and was converted into allolactose by galactosidase to act as an inducer. However, an increased concentration of α-lactose inhibits the regulation process of induction, which leads to a reduction in lipase activity.
(See figure on next page.)Fig. 1 a Schematic diagram of D-psicose and lipase co-production using co-culture strategy; b Gram staining methods to identify mixed strains; c SDS-PAGE analysis of protein level in co-culture system. (Line M, standard protein band; Line 1, the protein level band of recombinant B. subtilis; 2, the protein level band of recombinant E. coli; 3, the protein level band of recombinant B. subtilis and E. coli.)
Page 6 of 18Zhang et al. Bioresour. Bioprocess. (2021) 8:77
Fig. 1 (See legend on previous page.)
Page 7 of 18Zhang et al. Bioresour. Bioprocess. (2021) 8:77
According to a previous study (Zhang et al. 2020a), a 3% inoculum was selected during the co-cultivation of mixed strains. B. subtilis is a typical aerobe; therefore, it has a more obvious survival advantage than E. coli in the co-culture system. Thus, the inoculation ratio does not have a strong crucial effect on D-psicose production as compared to lipase activity. When the inoculation ratio of B. subtilis and E. coli was between 4:1 and 1:2, the inoculation amount of B. subtilis gradually decreased and that of E. coli steadily increased. D-Psicose production and especially lipase activity showed an increased varia-tion (Fig. 2f ). However, as the amount of E. coli inocu-lation continued to increase, D-psicose production and lipase activity both showed a downward trend. Therefore, the optimal inoculation ratio of mixed strains was cho-sen as 1:2 (B. subtilis: E. coli). Among them, D-psicose production was significantly higher than in the mono-culture of recombinant B. subtilis in a previous study (4.56 g/L) (Zhang et al. 2020a). These results confirmed that the synergistic effects of the co-culture had a reason-able range for the inoculation ratio. In the co-cultivation system, the competitive effects between B. subtilis and E.
coli were the first, to balance this competitive effect and achieve synergistic effects, it is necessary to appropriately increase the amount of inoculated E. coli to enhance its competitiveness (Klitgord and Segre 2010). It was con-cluded that, when a competitive balance was reached in the co-cultivation system, a certain synergistic promotion effect would be manifested, thereby effectively increasing the production of D-psicose and lipase (Scafa et al. 2020).
Co‑production of D‑psicose and lipase using fermentation tankA fermentation tank was used for scale-up co-fermen-tation according to the parameters of the early-stage shake-flask co-cultures. To compare the advantages of co-fermentation of engineered B. subtilis and E. coli, fer-mentation of single bacteria was also carried out.
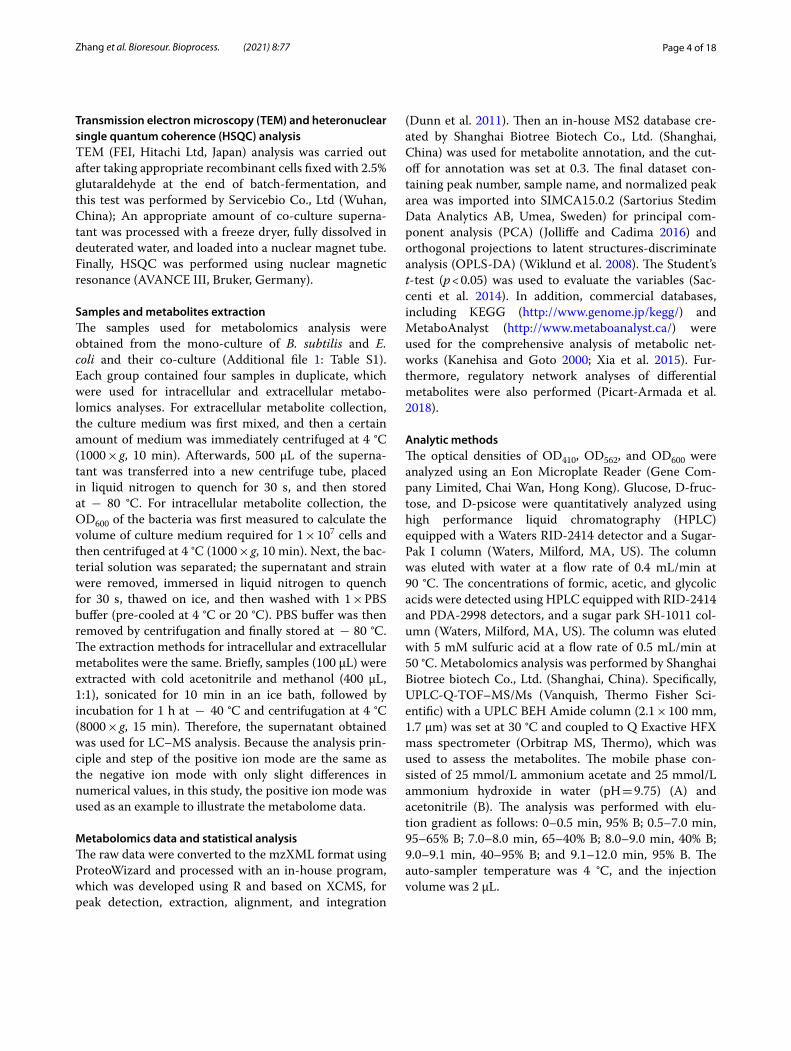
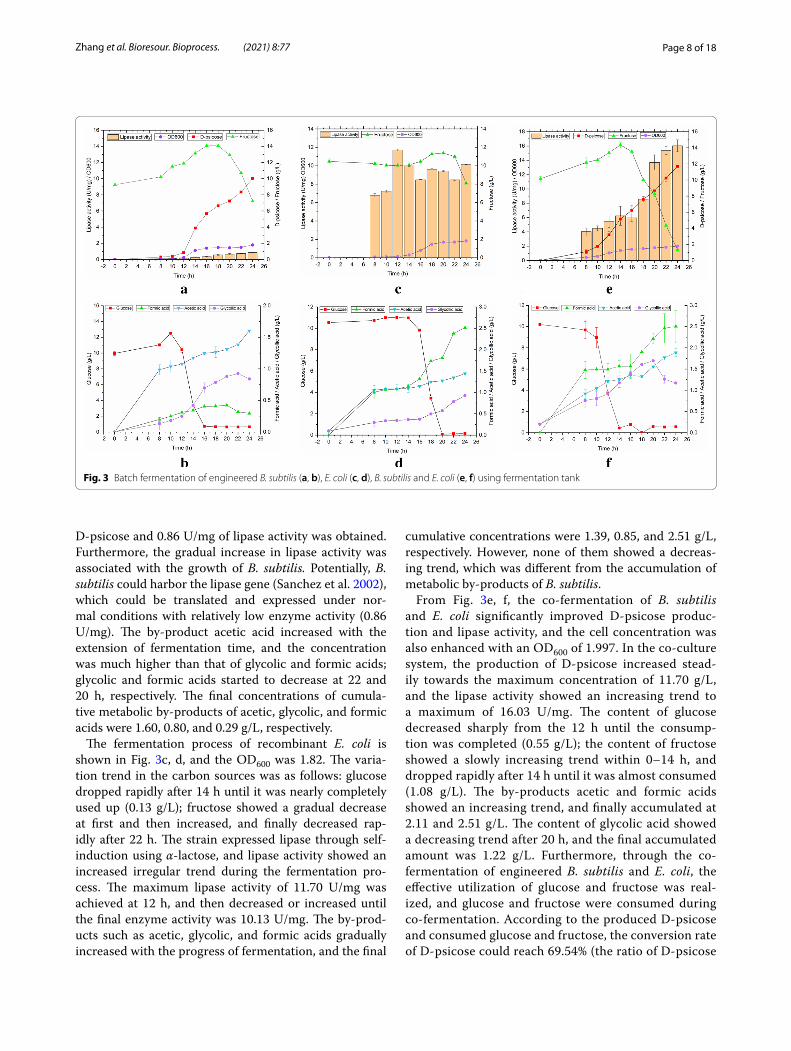
The fermentation characteristics of recombinant B. subtilis are shown in Fig. 3a, b, and the OD600 was 1.795. During the fermentation process, glucose was nearly completely used up at 16 h, and fructose dropped sharply at 18 h, however, 7.22 g/L of fructose was retained until the end of fermentation; meanwhile, 10.04 g/L of
Fig. 2 Effects of co-culture conditions on the co-production of D-psicose and lipase. a fermentation time (2 g/L α-lactose, 10 g/L D-fructose, initial pH 6.0, 37 °C, 32 h, and inoculation ratio of recombinant B. subtilis and E. coli = 1:2); b culture temperature (2 g/L α-lactose, 10 g/L D-fructose, initial pH 6.0, 24 h, and inoculation ratio of recombinant B. subtilis and E. coli = 1:2); c initial pH (2 g/L α-lactose, 10 g/L D-fructose, 37 °C, 24 h, and inoculation ratio of recombinant B. subtilis and E. coli = 1:2); d concentration of D-fructose (2 g/L α-lactose, initial pH 6.0, 37 °C, 24 h, and inoculation ratio of recombinant B. subtilis and E. coli = 1:2); e concentration of α-lactose (10 g/L D-fructose, initial pH 6.0, 37 °C, 24 h, and inoculation ratio of recombinant B. subtilis and E. coli = 1:2); f inoculation ratio of recombinant B. subtilis and E. coli (2 g/L α-lactose, 10 g/L D-fructose, initial pH 6.0, 37 °C, and 24 h)
Page 8 of 18Zhang et al. Bioresour. Bioprocess. (2021) 8:77
D-psicose and 0.86 U/mg of lipase activity was obtained. Furthermore, the gradual increase in lipase activity was associated with the growth of B. subtilis. Potentially, B. subtilis could harbor the lipase gene (Sanchez et al. 2002), which could be translated and expressed under nor-mal conditions with relatively low enzyme activity (0.86 U/mg). The by-product acetic acid increased with the extension of fermentation time, and the concentration was much higher than that of glycolic and formic acids; glycolic and formic acids started to decrease at 22 and 20 h, respectively. The final concentrations of cumula-tive metabolic by-products of acetic, glycolic, and formic acids were 1.60, 0.80, and 0.29 g/L, respectively.
The fermentation process of recombinant E. coli is shown in Fig. 3c, d, and the OD600 was 1.82. The varia-tion trend in the carbon sources was as follows: glucose dropped rapidly after 14 h until it was nearly completely used up (0.13 g/L); fructose showed a gradual decrease at first and then increased, and finally decreased rap-idly after 22 h. The strain expressed lipase through self-induction using α-lactose, and lipase activity showed an increased irregular trend during the fermentation pro-cess. The maximum lipase activity of 11.70 U/mg was achieved at 12 h, and then decreased or increased until the final enzyme activity was 10.13 U/mg. The by-prod-ucts such as acetic, glycolic, and formic acids gradually increased with the progress of fermentation, and the final
cumulative concentrations were 1.39, 0.85, and 2.51 g/L, respectively. However, none of them showed a decreas-ing trend, which was different from the accumulation of metabolic by-products of B. subtilis.
From Fig. 3e, f, the co-fermentation of B. subtilis and E. coli significantly improved D-psicose produc-tion and lipase activity, and the cell concentration was also enhanced with an OD600 of 1.997. In the co-culture system, the production of D-psicose increased stead-ily towards the maximum concentration of 11.70 g/L, and the lipase activity showed an increasing trend to a maximum of 16.03 U/mg. The content of glucose decreased sharply from the 12 h until the consump-tion was completed (0.55 g/L); the content of fructose showed a slowly increasing trend within 0–14 h, and dropped rapidly after 14 h until it was almost consumed (1.08 g/L). The by-products acetic and formic acids showed an increasing trend, and finally accumulated at 2.11 and 2.51 g/L. The content of glycolic acid showed a decreasing trend after 20 h, and the final accumulated amount was 1.22 g/L. Furthermore, through the co-fermentation of engineered B. subtilis and E. coli, the effective utilization of glucose and fructose was real-ized, and glucose and fructose were consumed during co-fermentation. According to the produced D-psicose and consumed glucose and fructose, the conversion rate of D-psicose could reach 69.54% (the ratio of D-psicose
Fig. 3 Batch fermentation of engineered B. subtilis (a, b), E. coli (c, d), B. subtilis and E. coli (e, f) using fermentation tank
Page 9 of 18Zhang et al. Bioresour. Bioprocess. (2021) 8:77
concentration to total consumed sugar concentration), and the conversion rate in this study was much higher than the previously reported enzymatic conversion rate (29.64%) (Zhang et al. 2018). Compared with single-bacterial fermentation, lipase activity was increased by 58.24%, and D-psicose production was enhanced by 7.08%, suggesting that mixed-bacterial fermentation could greatly promote the increase in yield. Further-more, these results indicate that the co-culture system of recombinant B. subtilis and E. coli is more beneficial for the growth of E. coli.
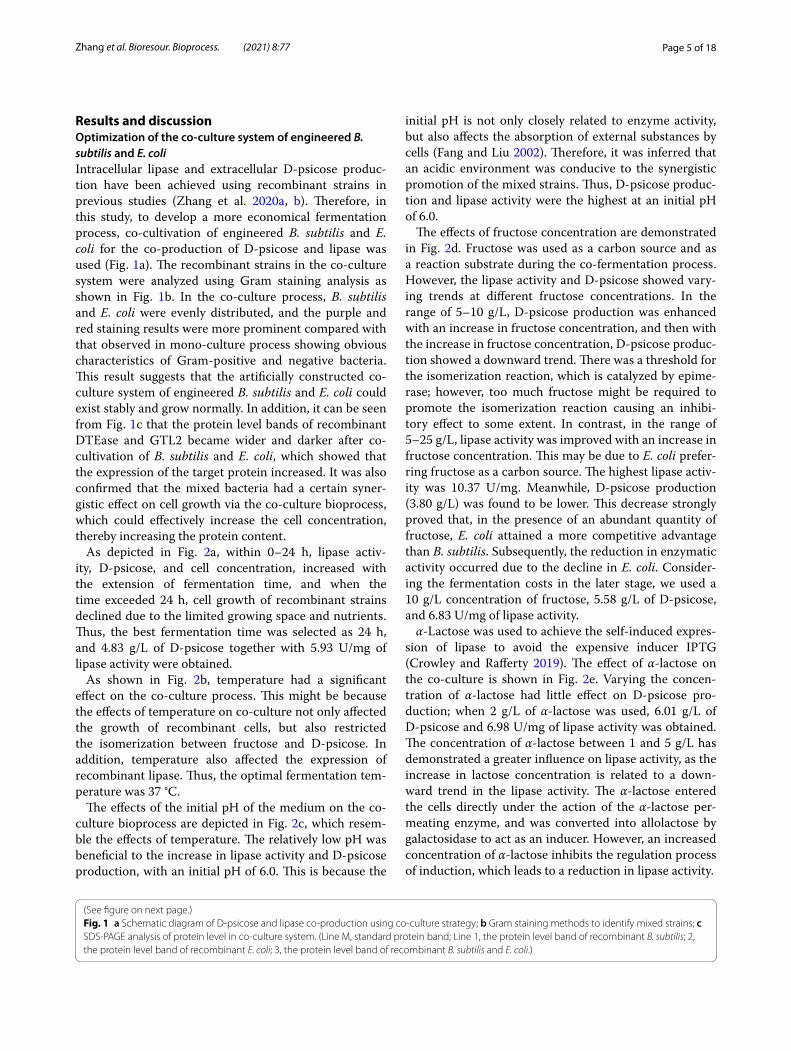
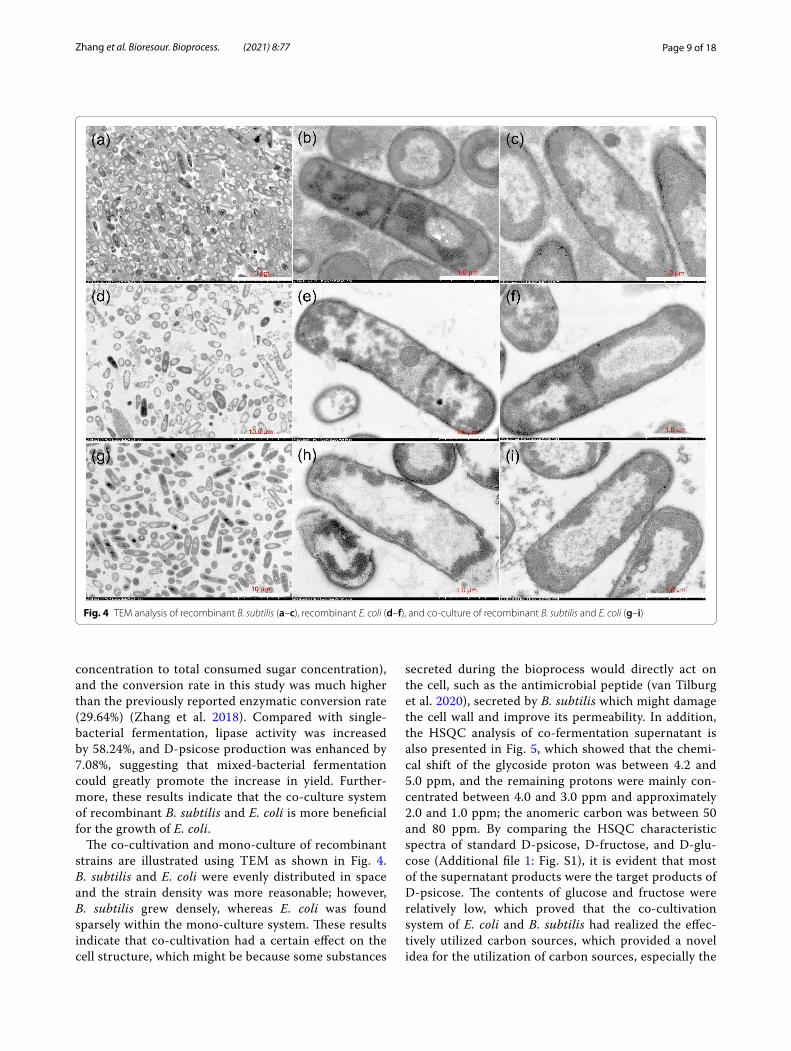
The co-cultivation and mono-culture of recombinant strains are illustrated using TEM as shown in Fig. 4. B. subtilis and E. coli were evenly distributed in space and the strain density was more reasonable; however, B. subtilis grew densely, whereas E. coli was found sparsely within the mono-culture system. These results indicate that co-cultivation had a certain effect on the cell structure, which might be because some substances
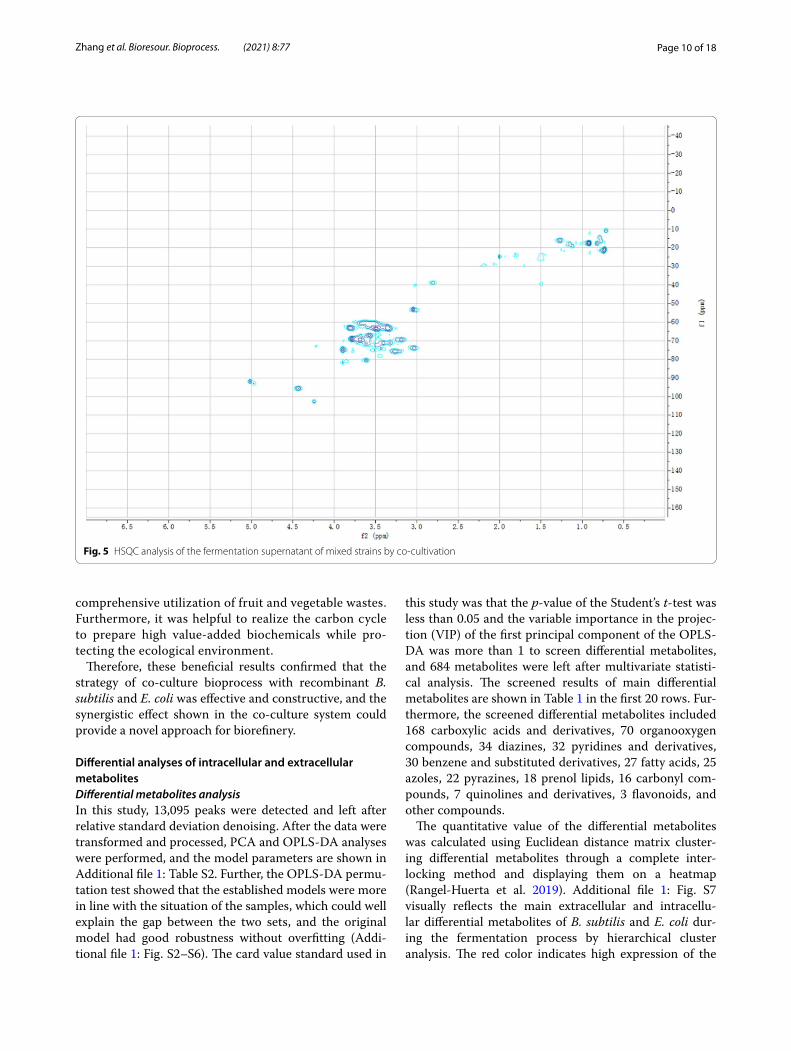
secreted during the bioprocess would directly act on the cell, such as the antimicrobial peptide (van Tilburg et al. 2020), secreted by B. subtilis which might damage the cell wall and improve its permeability. In addition, the HSQC analysis of co-fermentation supernatant is also presented in Fig. 5, which showed that the chemi-cal shift of the glycoside proton was between 4.2 and 5.0 ppm, and the remaining protons were mainly con-centrated between 4.0 and 3.0 ppm and approximately 2.0 and 1.0 ppm; the anomeric carbon was between 50 and 80 ppm. By comparing the HSQC characteristic spectra of standard D-psicose, D-fructose, and D-glu-cose (Additional file 1: Fig. S1), it is evident that most of the supernatant products were the target products of D-psicose. The contents of glucose and fructose were relatively low, which proved that the co-cultivation system of E. coli and B. subtilis had realized the effec-tively utilized carbon sources, which provided a novel idea for the utilization of carbon sources, especially the
Fig. 4 TEM analysis of recombinant B. subtilis (a–c), recombinant E. coli (d–f), and co-culture of recombinant B. subtilis and E. coli (g–i)
Page 10 of 18Zhang et al. Bioresour. Bioprocess. (2021) 8:77
comprehensive utilization of fruit and vegetable wastes. Furthermore, it was helpful to realize the carbon cycle to prepare high value-added biochemicals while pro-tecting the ecological environment.
Therefore, these beneficial results confirmed that the strategy of co-culture bioprocess with recombinant B. subtilis and E. coli was effective and constructive, and the synergistic effect shown in the co-culture system could provide a novel approach for biorefinery.
Differential analyses of intracellular and extracellular metabolitesDifferential metabolites analysisIn this study, 13,095 peaks were detected and left after relative standard deviation denoising. After the data were transformed and processed, PCA and OPLS-DA analyses were performed, and the model parameters are shown in Additional file 1: Table S2. Further, the OPLS-DA permu-tation test showed that the established models were more in line with the situation of the samples, which could well explain the gap between the two sets, and the original model had good robustness without overfitting (Addi-tional file 1: Fig. S2–S6). The card value standard used in
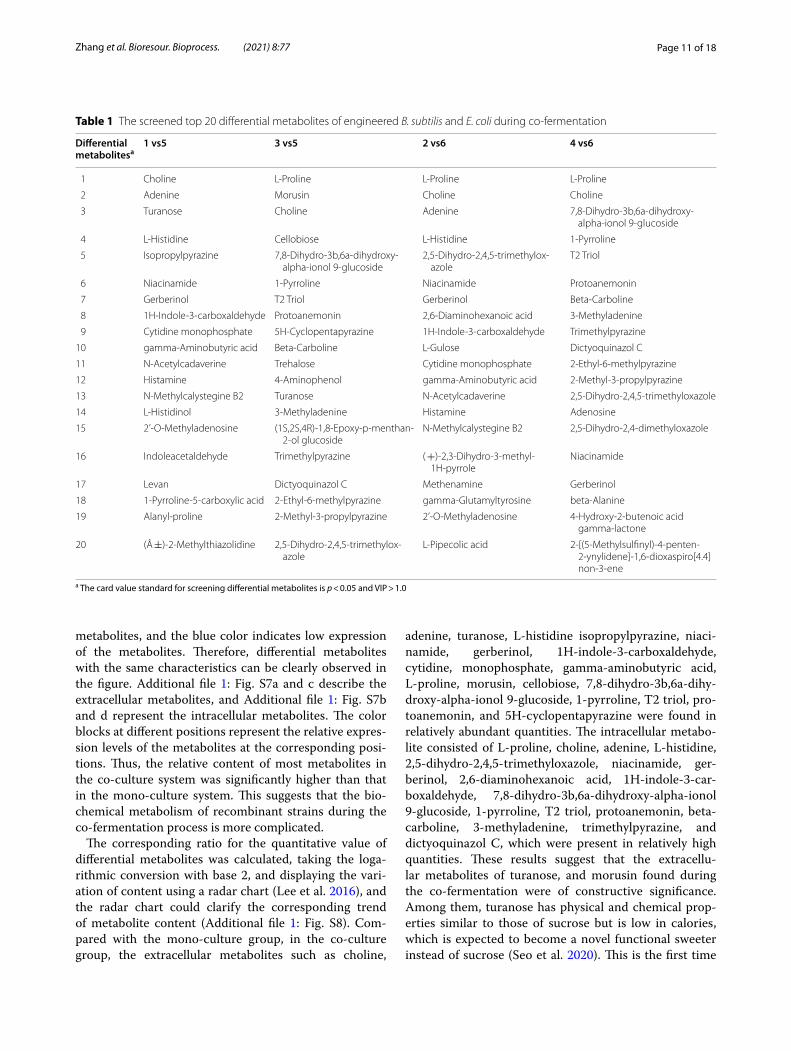
this study was that the p-value of the Student’s t-test was less than 0.05 and the variable importance in the projec-tion (VIP) of the first principal component of the OPLS-DA was more than 1 to screen differential metabolites, and 684 metabolites were left after multivariate statisti-cal analysis. The screened results of main differential metabolites are shown in Table 1 in the first 20 rows. Fur-thermore, the screened differential metabolites included 168 carboxylic acids and derivatives, 70 organooxygen compounds, 34 diazines, 32 pyridines and derivatives, 30 benzene and substituted derivatives, 27 fatty acids, 25 azoles, 22 pyrazines, 18 prenol lipids, 16 carbonyl com-pounds, 7 quinolines and derivatives, 3 flavonoids, and other compounds.
The quantitative value of the differential metabolites was calculated using Euclidean distance matrix cluster-ing differential metabolites through a complete inter-locking method and displaying them on a heatmap (Rangel-Huerta et al. 2019). Additional file 1: Fig. S7 visually reflects the main extracellular and intracellu-lar differential metabolites of B. subtilis and E. coli dur-ing the fermentation process by hierarchical cluster analysis. The red color indicates high expression of the
Fig. 5 HSQC analysis of the fermentation supernatant of mixed strains by co-cultivation
Page 11 of 18Zhang et al. Bioresour. Bioprocess. (2021) 8:77
metabolites, and the blue color indicates low expression of the metabolites. Therefore, differential metabolites with the same characteristics can be clearly observed in the figure. Additional file 1: Fig. S7a and c describe the extracellular metabolites, and Additional file 1: Fig. S7b and d represent the intracellular metabolites. The color blocks at different positions represent the relative expres-sion levels of the metabolites at the corresponding posi-tions. Thus, the relative content of most metabolites in the co-culture system was significantly higher than that in the mono-culture system. This suggests that the bio-chemical metabolism of recombinant strains during the co-fermentation process is more complicated.
The corresponding ratio for the quantitative value of differential metabolites was calculated, taking the loga-rithmic conversion with base 2, and displaying the vari-ation of content using a radar chart (Lee et al. 2016), and the radar chart could clarify the corresponding trend of metabolite content (Additional file 1: Fig. S8). Com-pared with the mono-culture group, in the co-culture group, the extracellular metabolites such as choline,
adenine, turanose, L-histidine isopropylpyrazine, niaci-namide, gerberinol, 1H-indole-3-carboxaldehyde, cytidine, monophosphate, gamma-aminobutyric acid, L-proline, morusin, cellobiose, 7,8-dihydro-3b,6a-dihy-droxy-alpha-ionol 9-glucoside, 1-pyrroline, T2 triol, pro-toanemonin, and 5H-cyclopentapyrazine were found in relatively abundant quantities. The intracellular metabo-lite consisted of L-proline, choline, adenine, L-histidine, 2,5-dihydro-2,4,5-trimethyloxazole, niacinamide, ger-berinol, 2,6-diaminohexanoic acid, 1H-indole-3-car-boxaldehyde, 7,8-dihydro-3b,6a-dihydroxy-alpha-ionol 9-glucoside, 1-pyrroline, T2 triol, protoanemonin, beta-carboline, 3-methyladenine, trimethylpyrazine, and dictyoquinazol C, which were present in relatively high quantities. These results suggest that the extracellu-lar metabolites of turanose, and morusin found during the co-fermentation were of constructive significance. Among them, turanose has physical and chemical prop-erties similar to those of sucrose but is low in calories, which is expected to become a novel functional sweeter instead of sucrose (Seo et al. 2020). This is the first time
Table 1 The screened top 20 differential metabolites of engineered B. subtilis and E. coli during co-fermentation
a The card value standard for screening differential metabolites is p < 0.05 and VIP > 1.0
Differential metabolitesa
1 vs5 3 vs5 2 vs6 4 vs6
1 Choline L-Proline L-Proline L-Proline
2 Adenine Morusin Choline Choline
3 Turanose Choline Adenine 7,8-Dihydro-3b,6a-dihydroxy-alpha-ionol 9-glucoside
4 L-Histidine Cellobiose L-Histidine 1-Pyrroline
5 Isopropylpyrazine 7,8-Dihydro-3b,6a-dihydroxy-alpha-ionol 9-glucoside
2,5-Dihydro-2,4,5-trimethylox-azole
T2 Triol
6 Niacinamide 1-Pyrroline Niacinamide Protoanemonin
7 Gerberinol T2 Triol Gerberinol Beta-Carboline
8 1H-Indole-3-carboxaldehyde Protoanemonin 2,6-Diaminohexanoic acid 3-Methyladenine
9 Cytidine monophosphate 5H-Cyclopentapyrazine 1H-Indole-3-carboxaldehyde Trimethylpyrazine
10 gamma-Aminobutyric acid Beta-Carboline L-Gulose Dictyoquinazol C
11 N-Acetylcadaverine Trehalose Cytidine monophosphate 2-Ethyl-6-methylpyrazine
12 Histamine 4-Aminophenol gamma-Aminobutyric acid 2-Methyl-3-propylpyrazine
13 N-Methylcalystegine B2 Turanose N-Acetylcadaverine 2,5-Dihydro-2,4,5-trimethyloxazole
14 L-Histidinol 3-Methyladenine Histamine Adenosine
15 2’-O-Methyladenosine (1S,2S,4R)-1,8-Epoxy-p-menthan-2-ol glucoside
N-Methylcalystegine B2 2,5-Dihydro-2,4-dimethyloxazole
16 Indoleacetaldehyde Trimethylpyrazine ( +)-2,3-Dihydro-3-methyl-1H-pyrrole
Niacinamide
17 Levan Dictyoquinazol C Methenamine Gerberinol
18 1-Pyrroline-5-carboxylic acid 2-Ethyl-6-methylpyrazine gamma-Glutamyltyrosine beta-Alanine
19 Alanyl-proline 2-Methyl-3-propylpyrazine 2’-O-Methyladenosine 4-Hydroxy-2-butenoic acid gamma-lactone
20 (Â ±)-2-Methylthiazolidine 2,5-Dihydro-2,4,5-trimethylox-azole
L-Pipecolic acid 2-[(5-Methylsulfinyl)-4-penten-2-ynylidene]-1,6-dioxaspiro[4.4]non-3-ene
Page 12 of 18Zhang et al. Bioresour. Bioprocess. (2021) 8:77
that turanose production has been found in the co-cul-ture system of B. subtilis and E. coli. It is also the first time that the flavonoid morusin is found in the co-culti-vation process of recombinant strains, and it has poten-tial medical application value (Choi et al. 2020).
Additional file 1: Fig. S9 shows the correlation analysis of differential metabolites, which is used to measure the closeness of the correlation between different metabo-lites and is quantitatively described by the correlation coefficient. The horizontal and vertical coordinates in the figure represent the different metabolites of the com-parison, and the color blocks at different positions repre-sent the correlation coefficient between the metabolites at the corresponding position. Red indicates a positive correlation, blue indicates negative correlation, a darker color indicates, a stronger correlation, and non-signifi-cant correlations are indicated by crosses. Through cor-relation analysis, the degree of correlation of differential metabolites in the co-culture process can be vividly dis-played. The intracellular metabolites were found to be more closely related than the extracellular metabolites; the correlation between the differential metabolites of E. coli was stronger than that of B. subtilis, which also indi-cates that E. coli exhibits a violent and tight biochemical reaction to obtain better competitive advantages in the co-culture system.
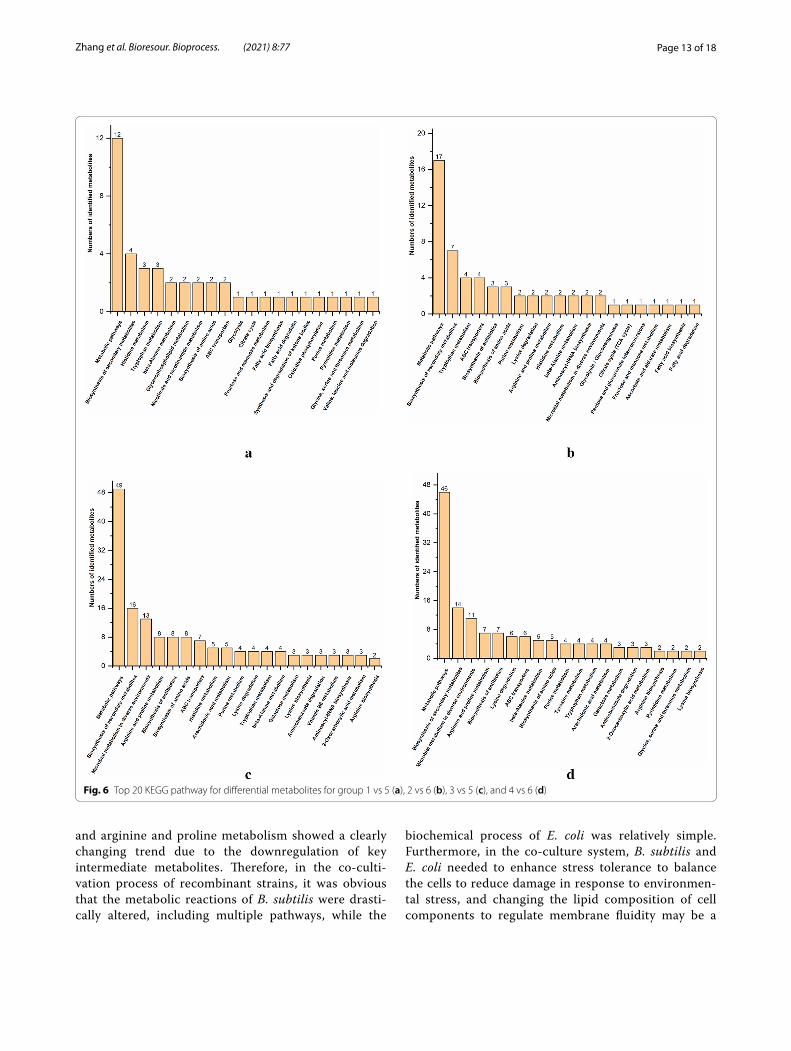
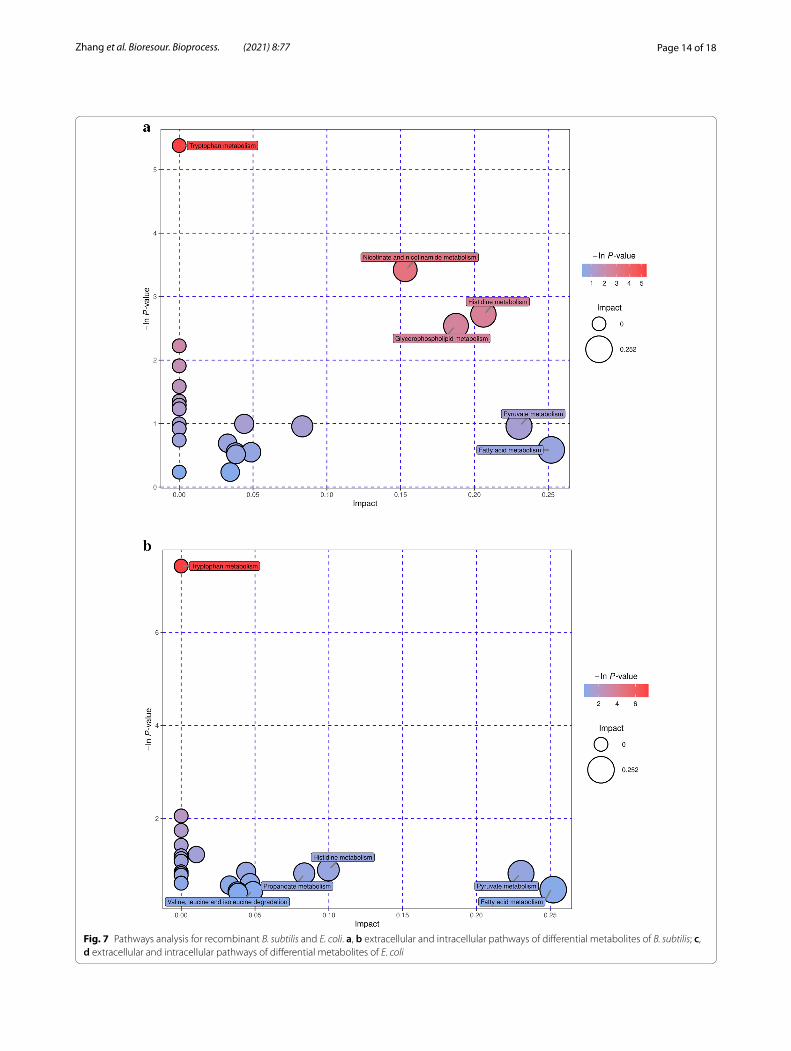
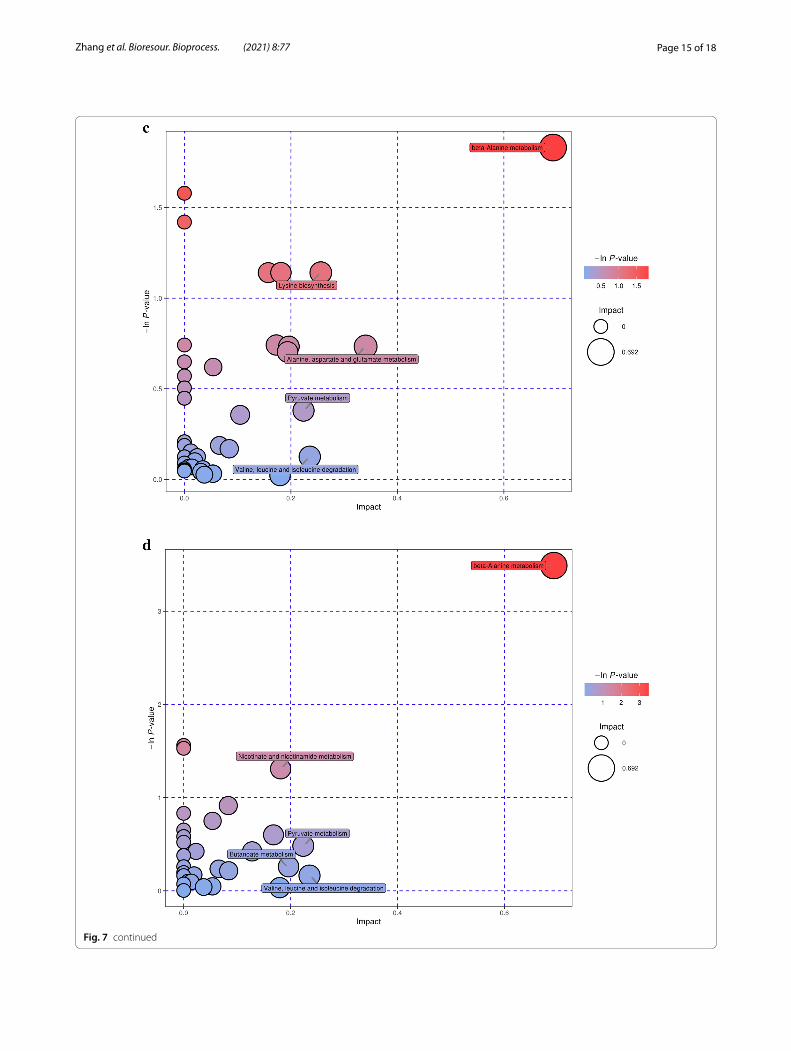
Metabolic pathway analysisUsing KEGG database annotation to identify pathways involved in differential metabolites, based on the map-ping results, 44 pathways for extracellular metabolites and 50 pathways for intracellular metabolites of B. sub-tilis were identified, and 72 pathways for extracellular metabolites and 65 pathways for intracellular metabolites of E. coli were identified. In addition, the top 20 KEGG pathways for differential metabolite are shown in Fig. 6.
Further analysis of the metabolic pathways for differen-tial metabolites could identify the key pathways with the highest correlation with metabolite differences (Addi-tional file 1: Table S3), specifically, through a compre-hensive analysis of the pathways in which the differential metabolites are located, including enrichment analy-sis and topological analysis. The results of the screened pathways are presented in bubble plots. Figure 7a, b dem-onstrates the selected extracellular and intracellular path-ways of B. subtilis, while the selected extracellular and intracellular pathways of E. coli are shown in Fig. 7c, d. Each bubble in the diagram represents a metabolic path-way. The abscissa and size of the bubble indicate the size of the impact factor of the pathway in the topology analy-sis, and the ordinate and color of the bubble express the p value (taking the negative natural logarithm, namely
-ln((p)) of the enrichment analysis. It can be seen from the bubble chart that tryptophan metabolism had the highest correlation during the co-fermentation pro-cess for B. subtilis. Similarly, beta-alanine metabolism had the highest correlation with E. coli. It is well known that, tryptophan metabolism is related to protein synthe-sis. It can participate as a signal molecule in the regula-tion of synthesis rate (Yanofsky 2007) and is also closely related to carbohydrates, vitamins, and trace elements in the metabolic process (Veldmann et al. 2019). β-Alanine metabolism is mainly used to decompose pyrimidine and is related to the formation of metabolic by-products. This also revealed an increase in D-psicose production and the by-product concentrations of formic, acetic, and gly-colic acids during the co-culture process in the metabolic pathways. The increase in D-psicose production was due to the improved expression of DTEase during the co-fermentation process, which isomerized more fruc-tose to synthesize D-psicose. As E. coli and B. subtilis are prone to produce metabolites such as acetic and formic acids during fermentation, the biochemical process is accelerated and closely related to the glycolysis, the pen-tose phosphate pathway, and the tricarboxylic acid cycle, thereby enhancing the concentration of by-products.
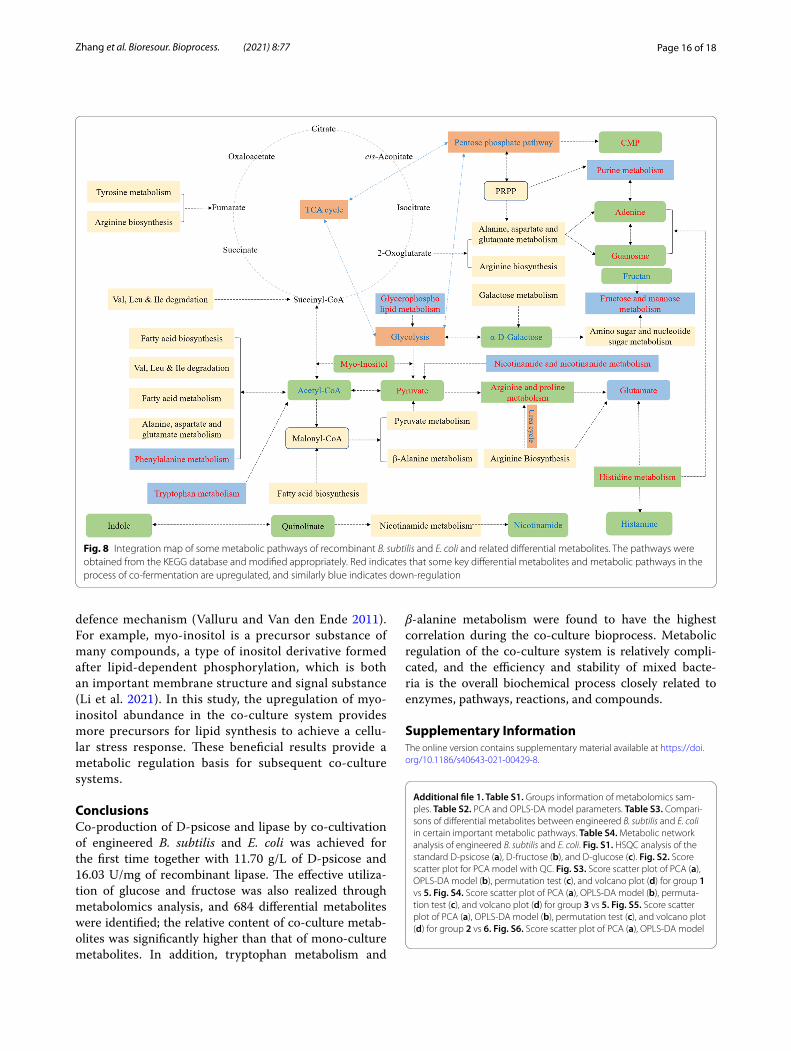
Metabolic network analysisMetabolic networks describe metabolism and physiologi-cal processes in the cell including metabolic reactions and regulatory mechanisms (De Martino et al. 2014), and the results of the network analysis are shown in Additional file 1: Fig. S10. Some integrated metabolic pathways and differential metabolites of the two recombinant strains are shown in Fig. 8. Compared with the mono-cultivation group (Additional file 1: Table S4), the extracellular fruc-tose and mannose metabolism, histidine metabolism, tryptophan metabolism, glycerophospholipid metabo-lism, and nicotinate and nicotinamide metabolism of B. subtilis in the co-culture system showed more prominent changes, and the relationship between them was rela-tively close. The intracellular purine metabolism, arginine and proline metabolism, histidine metabolism, pheny-lalanine metabolism, and tryptophan metabolism of B. subtilis during co-cultivation showed a strong metabolic reaction to form different regulation nodes.
The metabolic regulation of the co-culture system of B. subtilis and E. coli was relatively complicated, and the stability and effectiveness of its overall biochemi-cal process were closely related to enzymes, path-ways, reactions, and compounds (Weiner et al. 2017). However, compared with the mono-culture group, the regulation of extracellular and intracellular metabo-lism in the co-culture of E. coli was relatively simple,
Page 13 of 18Zhang et al. Bioresour. Bioprocess. (2021) 8:77
and arginine and proline metabolism showed a clearly changing trend due to the downregulation of key intermediate metabolites. Therefore, in the co-culti-vation process of recombinant strains, it was obvious that the metabolic reactions of B. subtilis were drasti-cally altered, including multiple pathways, while the
biochemical process of E. coli was relatively simple. Furthermore, in the co-culture system, B. subtilis and E. coli needed to enhance stress tolerance to balance the cells to reduce damage in response to environmen-tal stress, and changing the lipid composition of cell components to regulate membrane fluidity may be a
Fig. 6 Top 20 KEGG pathway for differential metabolites for group 1 vs 5 (a), 2 vs 6 (b), 3 vs 5 (c), and 4 vs 6 (d)
Page 14 of 18Zhang et al. Bioresour. Bioprocess. (2021) 8:77
Fig. 7 Pathways analysis for recombinant B. subtilis and E. coli. a, b extracellular and intracellular pathways of differential metabolites of B. subtilis; c, d extracellular and intracellular pathways of differential metabolites of E. coli
Page 15 of 18Zhang et al. Bioresour. Bioprocess. (2021) 8:77
Fig. 7 continued
Page 16 of 18Zhang et al. Bioresour. Bioprocess. (2021) 8:77
defence mechanism (Valluru and Van den Ende 2011). For example, myo-inositol is a precursor substance of many compounds, a type of inositol derivative formed after lipid-dependent phosphorylation, which is both an important membrane structure and signal substance (Li et al. 2021). In this study, the upregulation of myo-inositol abundance in the co-culture system provides more precursors for lipid synthesis to achieve a cellu-lar stress response. These beneficial results provide a metabolic regulation basis for subsequent co-culture systems.
ConclusionsCo-production of D-psicose and lipase by co-cultivation of engineered B. subtilis and E. coli was achieved for the first time together with 11.70 g/L of D-psicose and 16.03 U/mg of recombinant lipase. The effective utiliza-tion of glucose and fructose was also realized through metabolomics analysis, and 684 differential metabolites were identified; the relative content of co-culture metab-olites was significantly higher than that of mono-culture metabolites. In addition, tryptophan metabolism and
β-alanine metabolism were found to have the highest correlation during the co-culture bioprocess. Metabolic regulation of the co-culture system is relatively compli-cated, and the efficiency and stability of mixed bacte-ria is the overall biochemical process closely related to enzymes, pathways, reactions, and compounds.
Supplementary InformationThe online version contains supplementary material available at https:// doi. org/ 10. 1186/ s40643- 021- 00429-8.
Additional file 1. Table S1. Groups information of metabolomics sam-ples. Table S2. PCA and OPLS-DA model parameters. Table S3. Compari-sons of differential metabolites between engineered B. subtilis and E. coli in certain important metabolic pathways. Table S4. Metabolic network analysis of engineered B. subtilis and E. coli. Fig. S1. HSQC analysis of the standard D-psicose (a), D-fructose (b), and D-glucose (c). Fig. S2. Score scatter plot for PCA model with QC. Fig. S3. Score scatter plot of PCA (a), OPLS-DA model (b), permutation test (c), and volcano plot (d) for group 1 vs 5. Fig. S4. Score scatter plot of PCA (a), OPLS-DA model (b), permuta-tion test (c), and volcano plot (d) for group 3 vs 5. Fig. S5. Score scatter plot of PCA (a), OPLS-DA model (b), permutation test (c), and volcano plot (d) for group 2 vs 6. Fig. S6. Score scatter plot of PCA (a), OPLS-DA model
Fig. 8 Integration map of some metabolic pathways of recombinant B. subtilis and E. coli and related differential metabolites. The pathways were obtained from the KEGG database and modified appropriately. Red indicates that some key differential metabolites and metabolic pathways in the process of co-fermentation are upregulated, and similarly blue indicates down-regulation
Page 17 of 18Zhang et al. Bioresour. Bioprocess. (2021) 8:77
(b), permutation test (c), and volcano plot (d) for group 4 vs 6. Fig. S7. Heatmap of hierarchical cluster analysis for extracellular and intracellular differential metabolites. a extracellular differential metabolites between B. subtilis and mixed strains in; b intracellular differential metabolites between B. subtilis and mixed strains; c extracellular differential metabo-lites of E. coli and mixed strains; d intracellular differential metabolites of E. coli and mixed strains. Fig. S8. Radar char analysis for differential metabolites of group 1 vs 5 (a), 2 vs 6 (b), 3 vs 5 (c), and 4 vs 6 (d). Fig. S9. Correlation analysis for differential metabolites of group 1 vs 5 (a), 2 vs 6 (b), 3 vs 5 (c), and 4 vs 6 (d). Fig. S10. Network analysis for group 1 vs 5 (a), 2 vs 6 (b), 3 vs 5 (c), and 4 vs 6 (d).
AcknowledgementsNot applicable.
Authors’ contributionsJZ: conceptualization, methodology, investigation, software, data curation, writing—original draft, writing—review and editing; XC and JX: review and editing; WL, ZW, PL, and JX: data curation, funding acquisition, project administration, supervision, validation. All authors read and approved the final manuscript.
FundingThis work was supported by the National Key Research and Development Program of China (No. 2019YFB1504003), Projects of International Coopera-tion and Exchanges NSFC (No. 51861145103), Natural Science Foundation of Guangdong Province of China (No. 2020A1515010513), Guangdong Province Industrial High-tech Sector Science and Technology Project (No. 2017A010105018), Municipal Science and Technology Project of Guang-zhou (No. 201804010081), Guangdong Special Support Program (No. 2017TX04Z109), and National Natural Science Foundation of China (No. 51606201).
Availability of data and materialsThe raw/processed data required to reproduce these findings cannot be shared at this time as the data also forms part of an ongoing study.
Declarations
Ethics approvalNot applicable.
Consent to participateWe confirm that the manuscript has been read and approved by all named authors and that there are no other persons who satisfied the criteria for authorship but are not listed. We further confirm that the order of authors listed in the manuscript has been approved by all of us.
Consent for publicationThe work described has not been submitted elsewhere for publication, in whole or in part, and all the authors listed have seen the manuscript and approved the submission to your journal. We confirm that we have given due consideration to the protection of intellectual property associated with this work and that there are no impediments to publication, including the timing of publication, with respect to intellectual property.
Competing interestsThe authors declare that they have no known competing financial interests or personal relationships that could have appeared to influence the work reported in this paper.
Author details1 Guangdong Provincial Key Laboratory of New and Renewable Energy Research and Development, Guangzhou Institute of Energy Conversion, Chinese Academy of Sciences, CAS Key Laboratory of Renewable Energy, Guangzhou 510640, China. 2 College of Food Science and Technology, Guang-dong Provincial Key Laboratory of Aquatic Product Processing and Safety, Guangdong Province Engineering Laboratory for Marine Biological Products,
Guangdong Provincial Engineering Technology Research Center of Seafood, Key Laboratory of Advanced Processing of Aquatic Product of Guangdong Higher Education Institution, Guangdong Ocean University, Zhanjiang 524088 , China. 3 School of Chemical Engineering, Zhengzhou University, Zheng-zhou 450001 , China. 4 University of Chinese Academy of Sciences, Bei-jing 100049, China.
Received: 17 May 2021 Accepted: 11 August 2021
ReferencesBertrand S, Bohni N, Schnee S, Schumpp O, Gindro K, Wolfender JL (2014)
Metabolite induction via microorganism co-culture: a potential way to enhance chemical diversity for drug discovery. Biotechnol Adv 32(6):1180–1204. https:// doi. org/ 10. 1016/j. biote chadv. 2014. 03. 001
Chen J, Huang W, Zhang T, Lu M, Jiang B (2019) Anti-obesity potential of rare sugar d-psicose by regulating lipid metabolism in rats. Food Funct 10(5):2417–2425. https:// doi. org/ 10. 1039/ c8fo0 1089g
Cheng LZ, Yang QQ, Chen ZY, Zhang JR, Chen Q, Wang YF, Wei XL (2020) Dis-tinct changes of metabolic profile and sensory quality during Qingzhuan tea processing revealed by LC-MS-based metabolomics. J Agr Food Chem 68(17):4955–4965. https:// doi. org/ 10. 1021/ acs. jafc. 0c005 81
Choi DW, Cho SW, Lee S-G, Choi CY (2020) The Beneficial effects of morusin, an isoprene flavonoid isolated from the root bark of Morus. Int J Mol Sci. https:// doi. org/ 10. 3390/ ijms2 11865 41
Crowley EL, Rafferty SP (2019) Review of lactose-driven auto-induction expres-sion of isotope-labelled proteins. Protein Expres Purif 157:70–85. https:// doi. org/ 10. 1016/j. pep. 2019. 01. 007
De Martino A, De Martino D, Mulet R, Pagnani A (2014) Identifying all moiety conservation laws in genome-scale metabolic networks. PLoS ONE. https:// doi. org/ 10. 1371/ journ al. pone. 01007 50
Dunn WB, Broadhurst D, Begley P, Zelena E, Francis-McIntyre S, Anderson N, Brown M, Knowles JD, Halsall A, Haselden JN, Nicholls AW, Wilson ID, Kell DB, Goodacre R, Human Serum Metabolome HC (2011) Procedures for large-scale metabolic profiling of serum and plasma using gas chroma-tography and liquid chromatography coupled to mass spectrometry. Nature Protoc 6(7):1060–1083. https:// doi. org/ 10. 1038/ nprot. 2011. 335
Fang HHP, Liu H (2002) Effect of pH on hydrogen production from glucose by a mixed culture. Bioresource Technol 82(1):87–93. https:// doi. org/ 10. 1016/ s0960- 8524(01) 00110-9
Faust K, Raes J (2012) Microbial interactions: from networks to models. Nat Rev Microbiol 10(8):538–550. https:// doi. org/ 10. 1038/ nrmic ro2832
Godoy CA, Klett J, Di Geronimo B, Hermoso JA, Guisan JM, Carrasco-Lopez C (2019) Disulfide engineered lipase to enhance the catalytic activity: a structure-based approach on BTL2. Int J Mol Sci. https:// doi. org/ 10. 3390/ ijms2 02152 45
Jiang L-L, Zhou J-J, Quan C-S, Xiu Z-L (2017) Advances in industrial microbiome based on microbial consortium for biorefinery. Bioresour Bioprocess 4(1):11–11. https:// doi. org/ 10. 1186/ s40643- 017- 0141-0
Jiang S, Xiao W, Zhu X, Yang P, Zheng Z, Lu S, Jiang S, Zhang G, Liu J (2020) Review on D-allulose: In vivo metabolism, catalytic mechanism, engi-neering strain construction, bio-production technology. Front Bioeng Biotechnol 8:26. https:// doi. org/ 10. 3389/ fbioe. 2020. 00026
Jolliffe IT, Cadima J (2016) Principal component analysis: a review and recent developments. Philos T R Soc A. https:// doi. org/ 10. 1098/ rsta. 2015. 0202
Kajiwara S, Yamada R, Matsumoto T, Ogino H (2020) N-linked glycosylation of thermostable lipase from Bacillus thermocatenulatus to improve organic solvent stability. Enzyme Microb Tech. https:// doi. org/ 10. 1016/j. enzmi ctec. 2019. 109416
Kanehisa M, Goto S (2000) KEGG: Kyoto encyclopedia of genes and genomes. Nucleic Acids Res 28(1):27–30. https:// doi. org/ 10. 1093/ nar/ 28.1. 27
Klitgord N, Segre D (2010) Environments that induce synthetic microbial eco-systems. Plos Comput Biol. https:// doi. org/ 10. 1371/ journ al. pcbi. 10010 02
Lee D-K, Ahn S, Cho HY, Yun HY, Park JH, Lim J, Lee J, Kwon SW (2016) Meta-bolic response induced by parasitic plant–fungus interactions hinder amino sugar and nucleotide sugar metabolism in the host. Sci Rep-UK. https:// doi. org/ 10. 1038/ srep3 7434
Page 18 of 18Zhang et al. Bioresour. Bioprocess. (2021) 8:77
Li Y, Han P, Wang J, Shi T, You C (2021) Production of myo-inositol: Recent advance and prospective. Biotechnol Appl Bioc. https:// doi. org/ 10. 1002/ bab. 2181
Melani NB, Tambourgi EB, Silveira E (2020) Lipases: from production to applica-tions. Sep Purif Rev 49(2):143–158. https:// doi. org/ 10. 1080/ 15422 119. 2018. 15643 28
Patti GJ, Yanes O, Siuzdak G (2012) Metabolomics: the apogee of the omics trilogy. Nat Rev Mol Cell Bio 13(4):263–269. https:// doi. org/ 10. 1038/ nrm33 14
Picart-Armada S, Fernandez-Albert F, Vinaixa M, Yanes O, Perera-Lluna A (2018) FELLA: an R package to enrich metabolomics data. BMC Bioinformatics. https:// doi. org/ 10. 1186/ s12859- 018- 2487-5
Rangel-Huerta OD, Pastor-Villaescusa B, Gil A (2019) Are we close to defin-ing a metabolomic signature of human obesity? A systematic review of metabolomics studies. Metabolomics. https:// doi. org/ 10. 1007/ s11306- 019- 1553-y
Rosero-Chasoy G, Rodriguez-Jasso RM, Aguilar CN, Buitron G, Chairez I, Ruiz HA (2021) Microbial co-culturing strategies for the production high value compounds, a reliable framework towards sustainable biorefinery implementation—an overview. Bioresource Technol. https:// doi. org/ 10. 1016/j. biort ech. 2020. 124458
Saccenti E, Hoefsloot HCJ, Smilde AK, Westerhuis JA, Hendriks M (2014) Reflections on univariate and multivariate analysis of metabolomics data. Metabolomics 10(3):361–374. https:// doi. org/ 10. 1007/ s11306- 013- 0598-6
Sanchez M, Prim N, Randez-Gil F, Pastor FIJ, Diaz P (2002) Engineering of baker’s yeasts, E-coli and Bacillus hosts for the production of Bacillus subtilis lipase A. Biotechnol Bioeng 78(3):339–345. https:// doi. org/ 10. 1002/ bit. 10201
Scafa M, Marconi M, Germani M (2020) A critical review of symbiosis approaches in the context of Industry 4.0. J Comput Des Eng 7(3):269–278. https:// doi. org/ 10. 1093/ jcde/ qwaa0 22
Seo D-H, Yoo S-H, Choi S-J, Kim Y-R, Park C-S (2020) Versatile biotechnologi-cal applications of amylosucrase, a novel glucosyltransferase. Food Sci Biotechnol 29(1):1–16. https:// doi. org/ 10. 1007/ s10068- 019- 00686-6
Sezonov G, Joseleau-Petit D, D’Ari R (2007) Escherichia coli physiology in Luria-Bertani broth. J Bacteriol 189(23):8746–8749. https:// doi. org/ 10. 1128/ jb. 01368- 07
Singh R, Sharma S, Kareenhalli VV, Giri L, Mitra K (2020) Experimental investiga-tion into indole production using passaging of E. coli and B. subtilis along with unstructured modeling and parameter estimation using dynamic optimization: an integrated framework. Biochem Eng J. https:// doi. org/ 10. 1016/j. bej. 2020. 107743
Studier FW (2005) Protein production by auto-induction in high-density shak-ing cultures. Protein Expres Purif 41(1):207–234. https:// doi. org/ 10. 1016/j. pep. 2005. 01. 016
Valluru R, Van den Ende W (2011) Myo-inositol and beyond—emerging networks under stress. Plant Sci 181(4):387–400. https:// doi. org/ 10. 1016/j. plant sci. 2011. 07. 009
van Tilburg AY, van Heel AJ, Stulke J, de Kok NAW, Rueff AS, Kuipers OP (2020) MiniBacillus PG10 as a convenient and effective production host for lantibiotics. ACS Synth Biol 9(7):1833–1842. https:// doi. org/ 10. 1021/ acssy nbio. 0c001 94
Veldmann KH, Minges H, Sewald N, Lee JH, Wendisch VF (2019) Metabolic engineering of Corynebacterium glutamicum for the fermentative produc-tion of halogenated tryptophan. J Biotechnol 291:7–16. https:// doi. org/ 10. 1016/j. jbiot ec. 2018. 12. 008
Wein T, Picazo DR, Blow F, Woehle C, Jami E, Reusch TBH, Martin WF, Dagan T (2019) Currency, exchange, and inheritance in the evolution of symbiosis. Trends Microbiol 27(10):836–849. https:// doi. org/ 10. 1016/j. tim. 2019. 05. 010
Weiner M, Troendle J, Albermann C, Sprenger GA, Weuster-Botz D (2017) Metabolic control analysis of L-phenylalanine production from glycerol with engineered E. coli using data from short-term steady-state perturba-tion experiments. Biochem Eng J 126:86–100. https:// doi. org/ 10. 1016/j. bej. 2017. 06. 016
Wiklund S, Johansson E, Sjostrom L, Mellerowicz EJ, Edlund U, Shockcor JP, Gottfries J, Moritz T, Trygg J (2008) Visualization of GC/TOF-MS-based metabolomics data for identification of biochemically interesting com-pounds using OPLS class models. Anal Chem 80(1):115–122. https:// doi. org/ 10. 1021/ ac071 3510
Xia J, Sinelnikov IV, Han B, Wishart DS (2015) MetaboAnalyst 3.0-making metabolomics more meaningful. Nucleic Acids Res 43(W1):W251–W257. https:// doi. org/ 10. 1093/ nar/ gkv380
Xia Y, Yu J, Miao W, Shuang Q (2020) A UPLC-Q-TOF-MS-based metabolomics approach for the evaluation of fermented mare’s milk to koumiss. Food Chem. https:// doi. org/ 10. 1016/j. foodc hem. 2020. 126619
Yanofsky C (2007) RNA-based regulation of genes of tryptophan synthesis and degradation, in bacteria. RNA 13(8):1141–1154. https:// doi. org/ 10. 1261/ rna. 620507
Zhang W, Yu S, Zhang T, Jiang B, Mu W (2016) Recent advances in D-allulose: physiological functionalities, applications, and biological production. Trends in Food Sci Tech 54:127–137. https:// doi. org/ 10. 1016/j. tifs. 2016. 06. 004
Zhang W, Zhang Y, Huang J, Chen Z, Zhang T, Guang C, Mu W (2018) Ther-mostability improvement of the d-Allulose 3-epimerase from Dorea sp. CAG317 by site-directed mutagenesis at the interface regions. J Agric Food Chem. https:// doi. org/ 10. 1021/ acs. jafc. 8b012 00
Zhang J, Xu C, Chen X, Ruan X, Zhang Y, Xu H, Guo Y, Xu J, Lv P, Wang Z (2020a) Engineered Bacillus subtilis harbouring gene of d-tagatose 3-epimerase for the bioconversion of d-fructose into d-psicose through fermentation. Enzyme Microb Tech 136:109531. https:// doi. org/ 10. 1016/j. enzmi ctec. 2020. 109531
Zhang J, Tian M, Lv P, Luo W, Wang Z, Xu J, Wang Z (2020b) High-efficiency expression of the thermophilic lipase from Geobacillus thermocatenu-latus in Escherichia coli and its application in the enzymatic hydroly-sis of rapeseed oil. 3 Biotech 10(12):523. https:// doi. org/ 10. 1007/ s13205- 020- 02517-6
Publisher’s NoteSpringer Nature remains neutral with regard to jurisdictional claims in pub-lished maps and institutional affiliations.