Embed Size (px)
Citation preview
Procedia Engineering 15 (2011) 1758 – 1763
1877-7058 © 2011 Published by Elsevier Ltd.doi:10.1016/j.proeng.2011.08.328
Available online at www.sciencedirect.comAvailable online at www.sciencedirect.com
Procedia Engineering 00 (2011) 000–000
ProcediaEngineering
www.elsevier.com/locate/procedia
* Corresponding author. Tel.: +6-0142921640. E-mail address: [email protected]
Advanced in Control Engineering and Information Science
A Novel Statistical Model Assessing the Self Performance of Knowledge Management within SMEs in China
Ahmad Othmana, Liu Yaoa*, Omar R. Mahdib, Wang Jinga
aFaculty of Technology Management,University Malaysia Pahang, Kuantan25300, Malaysia bCollege of Business Management and Accounting,Tenaga Nasional University, Muadzam Shah, Malaysia
Abstract
Recently, the evaluation of knowledge management has become increasingly important. Nevertheless, few studies explicitly distinguished knowledge management self’s performance from its effectiveness. This paper introduces a new evaluation model by partitioning the process of implementing knowledge management into three stages, including: 1) the external and internal environment analysis; 2) knowledge management activity planning; and 3) the knowledge management implementation decision making. Data is collected from Chinese small and medium sized enterprises by questionnaires and semi-structured interviews. The regression results prove that the three factors positively contribute to knowledge management self’s performance with knowledge management activity planning impacts most and decision making less. Other useful factors are also indicated for enterprises to assess and predict their knowledge management self’s performance. © 2011 Published by Elsevier Ltd. Selection and/or peer-review under responsibility of [CEIS 2011] Keywords: Knowledge Management; Performance; Measurement; Sense-making; Evaluation
1. Introduction
For more than two decades, knowledge management (KM) has been considered as a crucial factor for enterprises to obtain and maintain competitive advantages to survive in the increasingly competitive business environment [16, 19]. Various evaluation measures have been proposed in a growing body of research on such topic [23, 24].
Allee (1997) partitioned organizational KM activities into four categories which can be further extended into organizational KM activity measures [2]. Teece (2000) stated that superior performance depends upon the ability of firms to innovate, to protect knowledge assets and to use these knowledge assets [22]. Kalling (2003) suggested dividing the concept of KM into three instances: development, utilization and capitalization [12]. Lee et al. (2005) defined five components (knowledge creation, accumulation, sharing, utilization, and internalization) that can be used to determine the knowledge circulation process and introduced a new knowledge management performance index for assessing the KM performance [13]. Chen and Chen (2005) summarized KM evaluation methods used in KM
1759Ahmad Othman et al. / Procedia Engineering 15 (2011) 1758 – 17632 A. Othman, et al / Procedia Engineering 00 (2011) 000–000
performance evaluation from 1995 to 2004, into eight categories [4]. Tseng (2008) partitioned the activities of KMS into three processes: KM strategic, the plan of KM, and implementation of KM plan and explored the KM system (KMS) performance indicators which are useful to assess the KMS performance [23].
Generally, much KM research that focused on identifying, storing and disseminating process related to knowledge in an organized manner has done little empirical work [1, 25]. And those empirical research on KM performance has unconscious confused KM it self’s performance (KMSP) with KM effectiveness [4, 23].
According to Sproles (2002), measure of performance measures the internal characteristics of a solution while measure of effectiveness measures external parameters that are independent of the solution, or rather, how well the problem has been solved [20]. This paper attempts to establish a model that identifies the critical factors in measuring KMSP and that can be used to comprehensively assess KMSP, that is, how KM works in itself instead of how KM contributes to the organization. Since there are evidence that KM performance positively influences organizational performance [5, 14], it is valuable to investigate how managers can initiate KM more effectively so as to transform the good impact of KM performance onto KM effectiveness.
2. Conceptual Framework and Research Hypothesis
The theoretical foundation of this paper is based upon Sense-Making (SM) Methodology [7]. Following Choo’s (1996) SM idea of managing information in organization [6], the paper frames KM practice into three SM stages: environment analysis, activity planning and decision making.
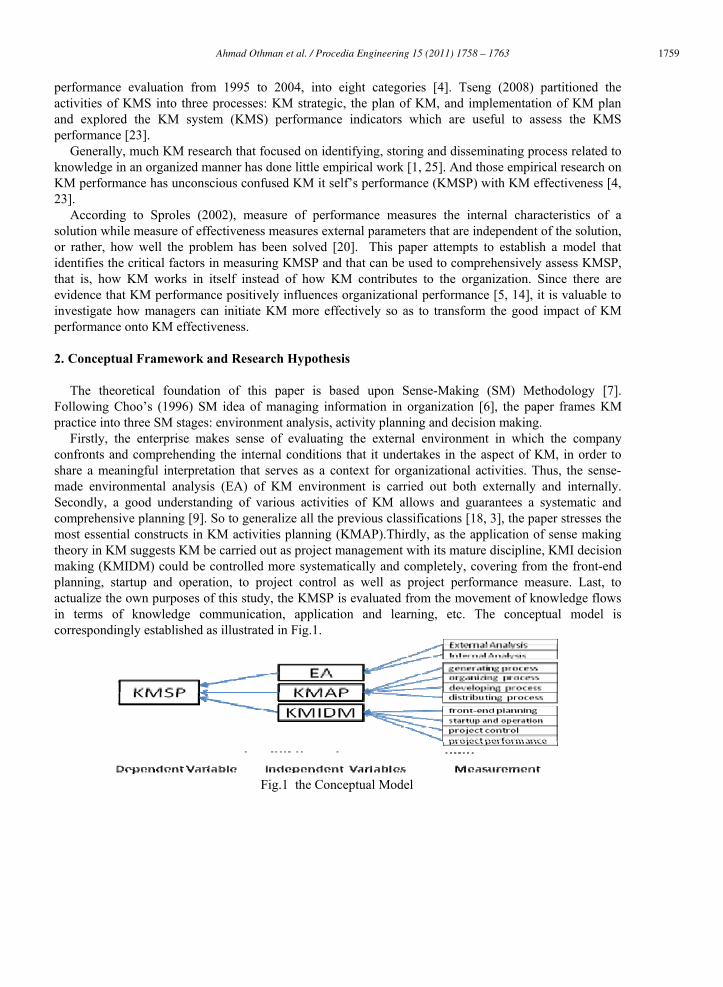
Firstly, the enterprise makes sense of evaluating the external environment in which the company confronts and comprehending the internal conditions that it undertakes in the aspect of KM, in order to share a meaningful interpretation that serves as a context for organizational activities. Thus, the sense-made environmental analysis (EA) of KM environment is carried out both externally and internally. Secondly, a good understanding of various activities of KM allows and guarantees a systematic and comprehensive planning [9]. So to generalize all the previous classifications [18, 3], the paper stresses the most essential constructs in KM activities planning (KMAP).Thirdly, as the application of sense making theory in KM suggests KM be carried out as project management with its mature discipline, KMI decision making (KMIDM) could be controlled more systematically and completely, covering from the front-end planning, startup and operation, to project control as well as project performance measure. Last, to actualize the own purposes of this study, the KMSP is evaluated from the movement of knowledge flows in terms of knowledge communication, application and learning, etc. The conceptual model is correspondingly established as illustrated in Fig.1.
Fig.1 the Conceptual Model
1760 Ahmad Othman et al. / Procedia Engineering 15 (2011) 1758 – 1763 A. Othman, et al / Procedia Engineering 00 (2011) 000–000 3
Since there are researches reveal that KM performance is significantly influenced by KM activities [15,
17, 13], it is reasonable to hypothesize firms with good environmental analysis, implementation planning and implementation decision making would obtain good KM performance. Thus, the specific research hypothesizes are formulated as follows:
RH1: If environmental analysis (EA) is good, KM performance (KMSP) is positively influenced. RH2: If activity planning (KMAP) is good, KM performance (KMSP) is positively influenced. RH3: If decision making (KMIDM) is good, KM performance (KMSP) is positively influenced.
3. Data Analysis, Regression Results and Discussion
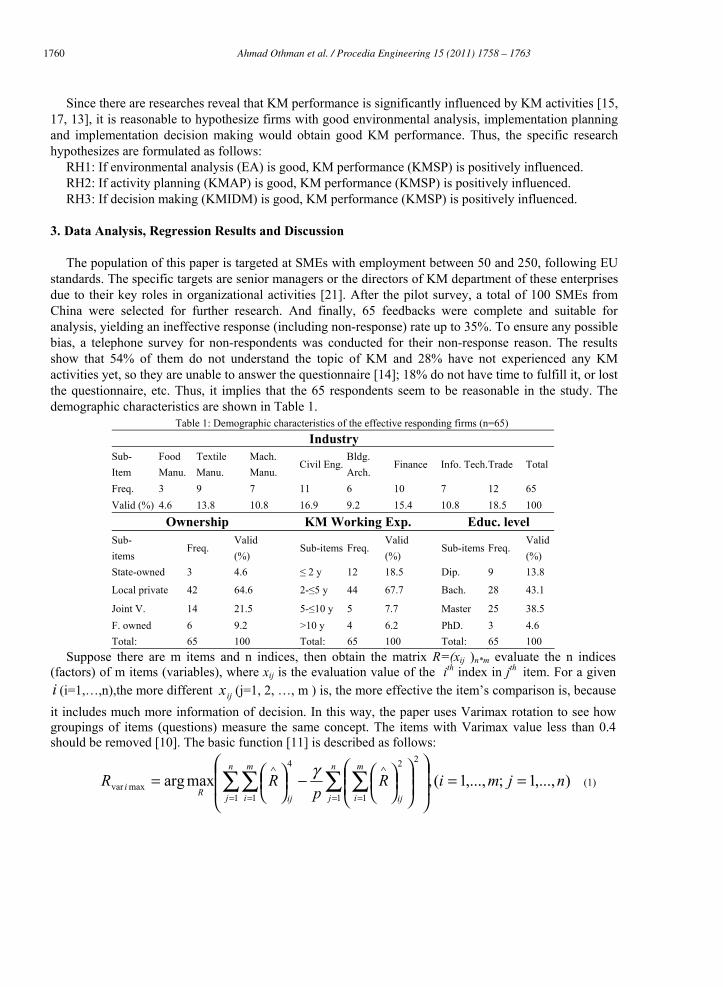
The population of this paper is targeted at SMEs with employment between 50 and 250, following EU standards. The specific targets are senior managers or the directors of KM department of these enterprises due to their key roles in organizational activities [21]. After the pilot survey, a total of 100 SMEs from China were selected for further research. And finally, 65 feedbacks were complete and suitable for analysis, yielding an ineffective response (including non-response) rate up to 35%. To ensure any possible bias, a telephone survey for non-respondents was conducted for their non-response reason. The results show that 54% of them do not understand the topic of KM and 28% have not experienced any KM activities yet, so they are unable to answer the questionnaire [14]; 18% do not have time to fulfill it, or lost the questionnaire, etc. Thus, it implies that the 65 respondents seem to be reasonable in the study. The demographic characteristics are shown in Table 1.
Table 1: Demographic characteristics of the effective responding firms (n=65) Industry
Sub- Item
Food Manu.
Textile Manu.
Mach. Manu.
Civil Eng.Bldg. Arch.
Finance Info. Tech.Trade Total
Freq. 3 9 7 11 6 10 7 12 65 Valid (%) 4.6 13.8 10.8 16.9 9.2 15.4 10.8 18.5 100
Ownership KM Working Exp. Educ. level Sub- items
Freq. Valid (%)
Sub-items Freq. Valid (%)
Sub-items Freq. Valid (%)
State-owned 3 4.6 ≤ 2 y 12 18.5 Dip. 9 13.8
Local private 42 64.6 2-≤5 y 44 67.7 Bach. 28 43.1
Joint V. 14 21.5 5-≤10 y 5 7.7 Master 25 38.5 F. owned 6 9.2 >10 y 4 6.2 PhD. 3 4.6 Total: 65 100 Total: 65 100 Total: 65 100
Suppose there are m items and n indices, then obtain the matrix R=(xij )n*m evaluate the n indices
(factors) of m items (variables), where xij is the evaluation value of the ith index in jth
item. For a given i (i=1,…,n),the more different ijx (j=1, 2, …, m ) is, the more effective the item’s comparison is, because it includes much more information of decision. In this way, the paper uses Varimax rotation to see how groupings of items (questions) measure the same concept. The items with Varimax value less than 0.4 should be removed [10]. The basic function [11] is described as follows:
),...,1;,...,1(,maxarg1 1
2
1
2
1
4
maxvar njmiRp
RRn
j
n
j
m
i ij
m
i ijR
i ==⎟⎟
⎠
⎞⎜⎜
⎝
⎛⎟⎟⎠
⎞⎜⎜⎝
⎛⎟⎠⎞⎜
⎝⎛−⎟
⎠⎞⎜
⎝⎛= ∑ ∑ ∑∑
= = =
∧
=
∧ γ (1)
1761Ahmad Othman et al. / Procedia Engineering 15 (2011) 1758 – 17634 A. Othman, et al / Procedia Engineering 00 (2011) 000–000
where γ = 1 for Varimax, ∧R is the loading of the ith variable on the jth factor after rotation.
After the reduction of indices system, Cronbach's α (alpha) is used to test the internal consistency or reliability of the system as it is widely believed to indirectly indicate the degree to which a set of items measures a single uni-dimensional latent index. Items with Cronbach’s alpha value greater than 0.7, indicate that internal consistency is guaranteed for the measurement index. Cronbach's α [8] is defined as:
⎟⎟⎟⎟
⎠
⎞
⎜⎜⎜⎜
⎝
⎛
−−
=∑
=2
1
2
11 X
k
iYi
K
K
σ
σα , (2)
where K is the number of items, 2Xσ the variance of the observed total test scores, and 2
iYσ the variance of
item i for the corresponding factor. The judgment scores for the importance/preference of criteria is based on Likert scale, with the rating
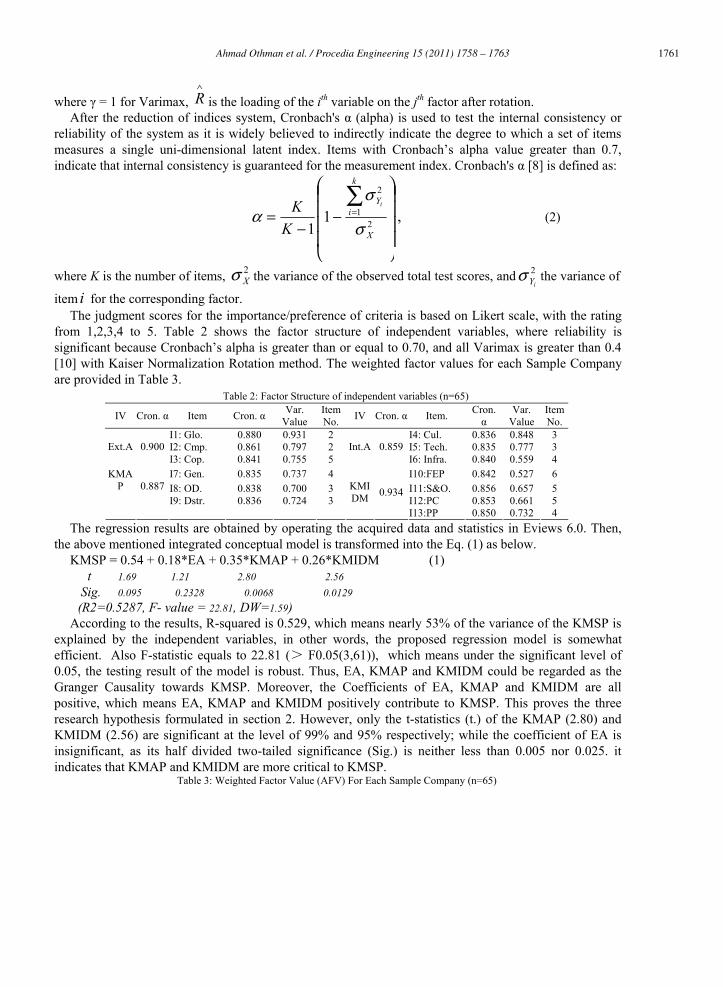
from 1,2,3,4 to 5. Table 2 shows the factor structure of independent variables, where reliability is significant because Cronbach’s alpha is greater than or equal to 0.70, and all Varimax is greater than 0.4 [10] with Kaiser Normalization Rotation method. The weighted factor values for each Sample Company are provided in Table 3.
Table 2: Factor Structure of independent variables (n=65)
IV Cron. α Item Cron. α Var. Value
Item No. IV Cron. α Item. Cron.
α Var.
Value Item No.
I1: Glo. 0.880 0.931 2 I4: Cul. 0.836 0.848 3 I2: Cmp. 0.861 0.797 2 I5: Tech. 0.835 0.777 3 Ext.A 0.900 I3: Cop. 0.841 0.755 5
Int.A 0.859I6: Infra. 0.840 0.559 4
I7: Gen. 0.835 0.737 4 I10:FEP 0.842 0.527 6 I8: OD. 0.838 0.700 3 I11:S&O. 0.856 0.657 5
KMAP
0.887 I9: Dstr. 0.836 0.724 3 I12:PC 0.853 0.661 5
KMIDM 0.934
I13:PP 0.850 0.732 4 The regression results are obtained by operating the acquired data and statistics in Eviews 6.0. Then,
the above mentioned integrated conceptual model is transformed into the Eq. (1) as below. KMSP = 0.54 + 0.18*EA + 0.35*KMAP + 0.26*KMIDM (1)
t 1.69 1.21 2.80 2.56
Sig. 0.095 0.2328 0.0068 0.0129 (R2=0.5287, F- value = 22.81, DW=1.59)
According to the results, R-squared is 0.529, which means nearly 53% of the variance of the KMSP is explained by the independent variables, in other words, the proposed regression model is somewhat efficient. Also F-statistic equals to 22.81 (> F0.05(3,61)), which means under the significant level of 0.05, the testing result of the model is robust. Thus, EA, KMAP and KMIDM could be regarded as the Granger Causality towards KMSP. Moreover, the Coefficients of EA, KMAP and KMIDM are all positive, which means EA, KMAP and KMIDM positively contribute to KMSP. This proves the three research hypothesis formulated in section 2. However, only the t-statistics (t.) of the KMAP (2.80) and KMIDM (2.56) are significant at the level of 99% and 95% respectively; while the coefficient of EA is insignificant, as its half divided two-tailed significance (Sig.) is neither less than 0.005 nor 0.025. it indicates that KMAP and KMIDM are more critical to KMSP.
Table 3: Weighted Factor Value (AFV) For Each Sample Company (n=65)
1762 Ahmad Othman et al. / Procedia Engineering 15 (2011) 1758 – 1763 A. Othman, et al / Procedia Engineering 00 (2011) 000–000 5
No. EA KMAP KMIDM No. EA KMAP KMIDM No. EA KMAP KMIDM 1 3.3523 2.6431 2.1753 23 2.3630 1.6336 2.6399 45 2.2666 2.2677 2.9482 2 3.3937 2.5836 2.4353 24 3.4414 3.2767 3.0922 46 3.0041 3.2460 2.8158 3 3.4988 3.1865 4.2743 25 3.2177 2.7591 3.1109 47 4.0195 3.5868 3.5089 4 3.2102 2.5580 2.3581 26 2.4075 2.2959 2.8529 48 4.2979 3.8339 4.0865 5 3.1324 2.4592 3.5468 27 3.3651 2.8491 3.2612 49 3.4993 3.0362 3.3952 6 2.7968 2.6943 3.2887 28 2.6431 2.2540 2.4394 50 3.4995 2.9718 2.7237 7 3.7076 4.0115 3.7634 29 3.9225 3.6759 3.4652 51 3.9154 3.3832 3.4901 8 2.4609 1.5265 2.9174 30 3.2218 1.7057 2.7747 52 2.4907 1.8919 2.4316 9 3.2930 2.6458 3.4737 31 4.3211 3.7465 2.7688 53 3.9781 3.6874 3.8711 10 2.7397 2.1187 2.5111 32 4.0164 3.8754 3.5074 54 2.8072 2.6381 2.9138 11 3.0438 3.0395 3.0081 33 3.2725 2.5251 3.1888 55 2.6948 2.0786 3.1287 12 3.6831 2.8147 3.0338 34 2.5404 1.7603 2.0792 56 3.0923 2.6594 2.9777 13 2.9115 2.1188 2.5723 35 3.0147 2.1946 2.7000 57 3.1747 2.4280 2.1042 14 3.9394 2.6419 3.3922 36 2.8439 1.9691 3.0085 58 2.9588 2.5699 2.6241 15 3.5283 2.5968 3.0366 37 2.8875 2.3840 2.2835 59 3.4805 3.1628 2.3192 16 2.8992 2.7812 3.1513 38 3.5645 2.9410 2.7631 60 2.8960 2.5591 3.4497 17 3.4408 2.3234 2.9808 39 2.8298 1.6092 2.1806 61 3.5092 2.8776 3.3193 18 2.6021 2.2292 2.3555 40 4.0299 3.0861 3.4116 62 2.7681 2.4015 2.9693 19 2.9777 3.2296 2.4452 41 2.6482 2.3822 2.6224 63 3.1538 3.4592 2.6390 20 2.8195 2.2482 3.0305 42 2.4061 2.3736 1.9097 64 3.4505 3.0873 3.0636 21 3.1637 2.5397 2.1001 43 3.7797 3.2924 3.6831 65 3.2906 2.9560 3.3907 22 2.6495 2.7475 2.4632 44 3.9642 3.6741 2.3164
4. Conclusion
In the study, the empirically proved model can be used as a comprehensive metric for enterprises to assess or predict their KMS self’s performance. From the results, the management can accordingly and properly adjust their whole strategy of KM implementation in terms of all the aspects of the three critical factors. Based on the literature review and statistical evidence, the higher the efficiency of the three factors of KM arrives, the better the self performance of KM can be achieved. Comparing the coefficient of each factor, it suggests that to enhance the self performance of KM, management shall pay more attention to KMAP and KMIDM. But EA may be more influential to the effectiveness of KM, which is beyond the scope of this study but would be verified in our future work.
References
[1]Alavi, M. and Leidner, D. E. 2001. Review: Knowledge management and knowledge management systems: Conceptual foundations and research issues. MIS Quarterly, 25(1): 107–136.
[2]Allee, V. 1997, 12 Principles of knowledge management, Training and Development, 51 (11): 71–74. [3]Beckett, R. and Murray, P. 2000. Learning by auditing: a knowledge creating approach. The TQM Magazine, 12(2): 125 –
136. [4]Chen, M. Y. and Chen, A. P. 2005. Knowledge management performance evaluation: A decade review from 1995 to 2004.
Journal of Information Science, 32(1): 15–36.

1763Ahmad Othman et al. / Procedia Engineering 15 (2011) 1758 – 17636 A. Othman, et al / Procedia Engineering 00 (2011) 000–000
[5]Choi, B. and Lee, H. 2003. An empirical investigation of KM styles and their effect on corporate performance. Information & Management, 40(5): 403–417.
[6]Choo, C. W. 1996. The Knowing Organization: How Organizations Use Information to Construct Meaning, Create Knowledge and Make Decisions. International Journal of Information Management, 16(5): 329-340.
[7]Dervin, B. 1983. An overview of sense-making research: Concepts, methods. The annual meeting of the International Communication Association. Dallas, TX. May, 1983
[8]Devellis, R.F. 1991. Scale Development, Sage Publications, 24–33. [9]Goold, M. 2005. Making peer groups effective: lessons from BP’s experiences. Long Range Planning, 38(5): 429–443. [10]Hair, J. F., Anderson, R. E., Tatham, R. L. and Black, W. C. 1998. Multivariate data analysis (5th ed.). Prentice-Hall
International Inc. [11]Kaiser, H. F. 1958. The varimax criterion for analytic rotation in factor analysis. Psychometrika, 23 (3), doi:
10.1007/BF02289233 [12]Kalling, T. 2003. Knowledge management and the occasional links with performance. Journal of Knowledge Management,
7(3): 67–81. [13]Lee, K. C., Lee, S. and Kang, I. W. 2005. KMPI: measuring knowledge management performance. Information &
Management, 42(3): 469–482. [14]Lin, C. and Tseng, S. M. 2005. Bridging the Implementation gaps in the knowledge management system for enhancing
corporate performance. Expert System with Applications, 29(1): 163–173. [15]Pfeffer, J. and Sutton, R. 1999. The knowing–doing gap. Boston: Harvard Business School Press. [16]Prahalad, C. K. and Hamel G. 1990. The core competence of the corporation. Harvard Business Review, 1990:79–91. [17]Ribiere, V. M. and Sitar, A. S. 2003. Critical role of leadership in nurturing a knowledge-supporting culture. Knowledge
Management Research & Practice, 1(1): 39–48. [18]Ruggles, R. 1998. The state of the notion: knowledge management in practice. California Management Review, 40(3): 80-
89. [19]Govind, S. I. and Ravindran, S. 2009. Usefulness, incentives and knowledge management. Journal of Knowledge
Management, 13(6): 410-430 [20]Sproles, N. 2002. Formulating Measures of Effectiveness. System Engineering, 5(4): 253-263. [21]Stoner, James, A. F., Freeman, Edward, R. Gilbert, D. 1995. Management, published by Prentice-Hall, ISBN 13:
9780131087477 [22]Teece, D. J. 2000. Strategies for managing knowledge assets: the role of firm structure and industrial context. Long Range
Planning, 33(1): 35–54. [23]Tseng, S. M. 2008. Knowledge management system performance measure index, Expert Systems with Applications, 34
(2008): 734–745 [24]Wen Yuan-Feng 2009. An effectiveness measurement model for knowledge management. Knowledge-Based Systems, 22
(2009): 363–367. [25]Yim, N. H., Kim, S. H., Kim, H. W. and Kwahkc, K. Y. 2004. Knowledge based decision making on higher level strategic
concerns: system dynamics approach. Expert Systems with Applications, 27(1): 143–158.


![Statistical Issues in Assessing Hospital Performance [PDF, 694KB]](https://img.pdfslide.us/doc/110x75/5868d6321a28abc3408c1fb2/statistical-issues-in-assessing-hospital-performance-pdf-694kb.jpg)