Embed Size (px)
DESCRIPTION
A Novel Neutrosophic Logic SVM (N-SVM) and Its Application to Image Categorization
Citation preview
A NOVEL NEUTROSOPHIC LOGIC SVM (N-SVM) AND ITS APPLICATION TO
IMAGE CATEGORIZATION
WEN JU and H. D. CHENG†
Department of Computer Science, Utah State University
Logan, Utah, 84322, U.S.A
Neutrosophic logic is a relatively new logic that is a generalization of fuzzy logic. In this paper, for the first time, neutrosophic logic is applied to the field of classifiers where a support vector machine (SVM) is adopted as the example to validate its feasibility and effectiveness. The proposed neutrosophic set is integrated into a reformulated SVM, and the performance of the obtained classifier N-SVM is evaluated under a region-based image categorization system. Images are first segmented by a hierarchical two-stage self-organizing map (HSOM), using color and texture features. A novel approach is proposed to select the training samples of HSOM based on homogeneity properties. A diverse density support vector machine (DD-SVM) framework is then applied to viewing an image as a bag of instances corresponding to the regions obtained from image segmentation. Each bag is mapped to a point in the new bag space, and the categorization is transformed to a classification problem. Then, the proposed N-SVM is used as the classifier in the new bag space. N-SVM treats samples differently according to the weighting function, and it helps to reduce the effects of outliers. Experimental results have demonstrated the validity and effectiveness of the proposed method which may find wide applications in the related areas.
Keywords: Neutrosophic set, image segmentation, image categorization, SVM, DD-SVM.
1. Introduction
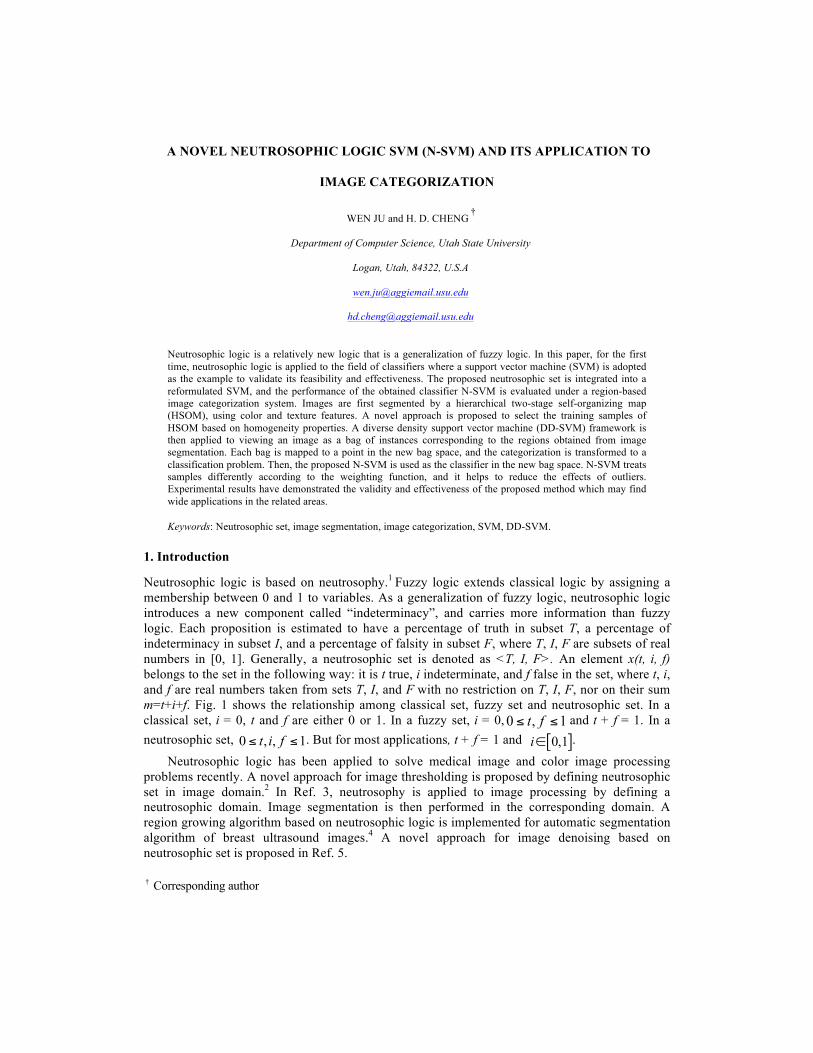
Neutrosophic logic is based on neutrosophy.1 Fuzzy logic extends classical logic by assigning a membership between 0 and 1 to variables. As a generalization of fuzzy logic, neutrosophic logic introduces a new component called “indeterminacy”, and carries more information than fuzzy logic. Each proposition is estimated to have a percentage of truth in subset T, a percentage of indeterminacy in subset I, and a percentage of falsity in subset F, where T, I, F are subsets of real numbers in [0, 1]. Generally, a neutrosophic set is denoted as <T, I, F>. An element x(t, i, f) belongs to the set in the following way: it is t true, i indeterminate, and f false in the set, where t, i, and f are real numbers taken from sets T, I, and F with no restriction on T, I, F, nor on their sum m=t+i+f. Fig. 1 shows the relationship among classical set, fuzzy set and neutrosophic set. In a classical set, i = 0, t and f are either 0 or 1. In a fuzzy set, i = 0,0 , 1t f≤ ≤ and t + f = 1. In a neutrosophic set, 0 , , 1t i f≤ ≤ . But for most applications, t + f = 1 and [ ]0,1i∈ .
Neutrosophic logic has been applied to solve medical image and color image processing problems recently. A novel approach for image thresholding is proposed by defining neutrosophic set in image domain.2 In Ref. 3, neutrosophy is applied to image processing by defining a neutrosophic domain. Image segmentation is then performed in the corresponding domain. A region growing algorithm based on neutrosophic logic is implemented for automatic segmentation algorithm of breast ultrasound images.4 A novel approach for image denoising based on neutrosophic set is proposed in Ref. 5.
† Corresponding author
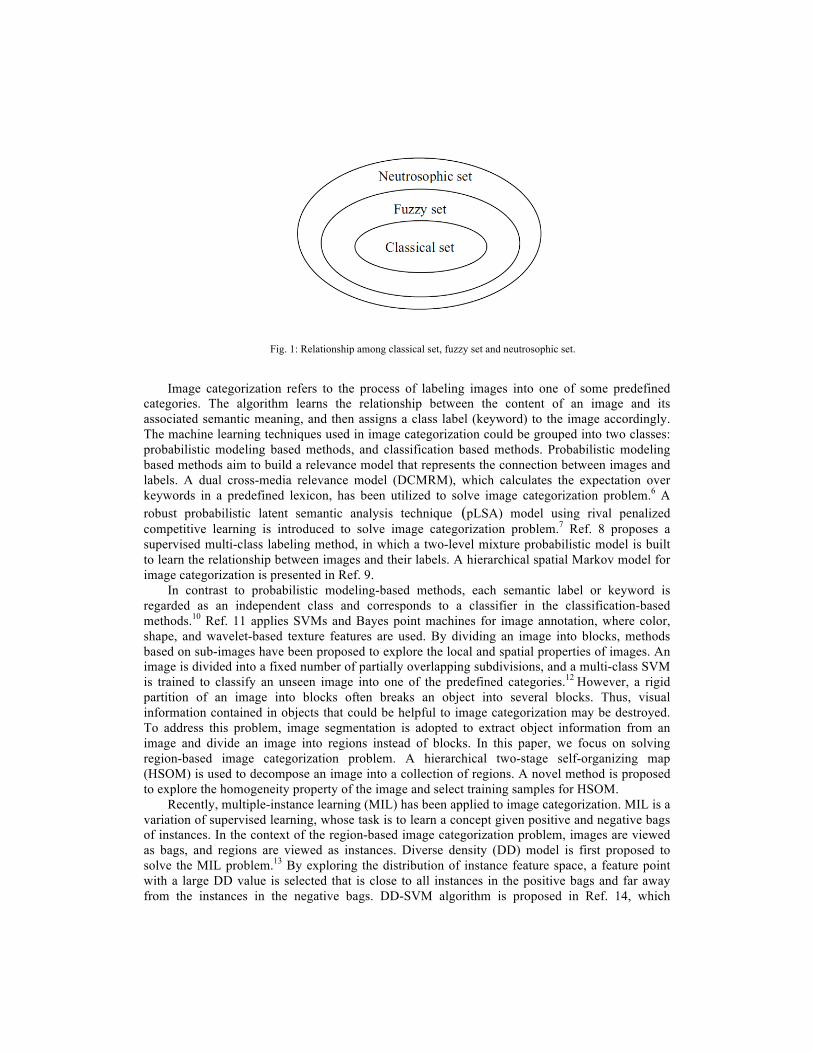
Fig. 1: Relationship among classical set, fuzzy set and neutrosophic set.
Image categorization refers to the process of labeling images into one of some predefined categories. The algorithm learns the relationship between the content of an image and its associated semantic meaning, and then assigns a class label (keyword) to the image accordingly. The machine learning techniques used in image categorization could be grouped into two classes: probabilistic modeling based methods, and classification based methods. Probabilistic modeling based methods aim to build a relevance model that represents the connection between images and labels. A dual cross-media relevance model (DCMRM), which calculates the expectation over keywords in a predefined lexicon, has been utilized to solve image categorization problem.6 A robust probabilistic latent semantic analysis technique (pLSA) model using rival penalized competitive learning is introduced to solve image categorization problem.7 Ref. 8 proposes a supervised multi-class labeling method, in which a two-level mixture probabilistic model is built to learn the relationship between images and their labels. A hierarchical spatial Markov model for image categorization is presented in Ref. 9.
In contrast to probabilistic modeling-based methods, each semantic label or keyword is regarded as an independent class and corresponds to a classifier in the classification-based methods.10 Ref. 11 applies SVMs and Bayes point machines for image annotation, where color, shape, and wavelet-based texture features are used. By dividing an image into blocks, methods based on sub-images have been proposed to explore the local and spatial properties of images. An image is divided into a fixed number of partially overlapping subdivisions, and a multi-class SVM is trained to classify an unseen image into one of the predefined categories.12 However, a rigid partition of an image into blocks often breaks an object into several blocks. Thus, visual information contained in objects that could be helpful to image categorization may be destroyed. To address this problem, image segmentation is adopted to extract object information from an image and divide an image into regions instead of blocks. In this paper, we focus on solving region-based image categorization problem. A hierarchical two-stage self-organizing map (HSOM) is used to decompose an image into a collection of regions. A novel method is proposed to explore the homogeneity property of the image and select training samples for HSOM.
Recently, multiple-instance learning (MIL) has been applied to image categorization. MIL is a variation of supervised learning, whose task is to learn a concept given positive and negative bags of instances. In the context of the region-based image categorization problem, images are viewed as bags, and regions are viewed as instances. Diverse density (DD) model is first proposed to solve the MIL problem.13 By exploring the distribution of instance feature space, a feature point with a large DD value is selected that is close to all instances in the positive bags and far away from the instances in the negative bags. DD-SVM algorithm is proposed in Ref. 14, which
assumes that the classification of bags is only related to some properties of the bags. Consequently, it solves MIL problem by transforming the original feature space to a new bag feature space, and training an SVM in the new space. The framework of DD-SVM proposed in Ref. 14 is adopted in this paper and a newly reformulated SVM based on a neutrosophic set is proposed.
In this paper, for the first time, a neutrosophic set is applied to the field of classifiers where an SVM is adopted as the example to validate the feasibility and effectiveness of the proposed approach. We propose a novel neutrosophic set for SVM inputs and combine it with the reformulated SVM which treats samples differently according to the weighting function. The proposed classifier helps to reduce the effects of outliers and is applied under a DD-SVM framework to solve MIL problem in region-based image categorization. The rest of the paper is organized as follows. Section 2 presents the image segmentation method based on homogeneity property. DD-SVM framework is introduced as an extension of MIL problem in Section 3. Section 4 describes the newly reformulated SVM based on neutrosophic set in detail. Experiment results are presented in Section 5, and conclusions are drawn in Section 6.
2. Image Segmentation
Image segmentation is the process of dividing an image into non-overlapping regions, such that each region is homogeneous but the joint of any two neighboring regions is non-homogeneous.15 It is essential to image processing and pattern recognition.
Self-organizing map (SOM), as a kind of neural network based on the idea of preserving the topology of the original input dataset, was first proposed by Kohonen.16 Unlike simple competitive learning methods where only the winning neurons are updated to learn, the neurons in the neighborhood of the winning neurons in SOM are also updated in the learning process and lead to an ordered feature-mapping that could be explored in many applications. The limitation of this method is that the final number of classes has to be specified a priori. A hierarchical SOM (HSOM) is proposed to solve the drawback.17 Arbitrarily complex clusters are formed, and the resultant clusters match the desired classes better than that using the conventional SOM.
In this section, an image segmentation method based on color and texture features using a hierarchical two-stage self-organizing map (HSOM) is presented. A novel approach for selecting training samples for HSOM, based on homogeneity, is proposed. Fig. 2 shows the outline of the proposed segmentation method.
Fig. 2: The outline of the proposed image segmentation method.
Input Image (Raw Data)
Region Merging
Feature Extraction (Color & Texture)
(Raw Data)
Selection of Training Samples
(Raw Data)
Two-stage HSOM
Segmented Image (Raw Data)
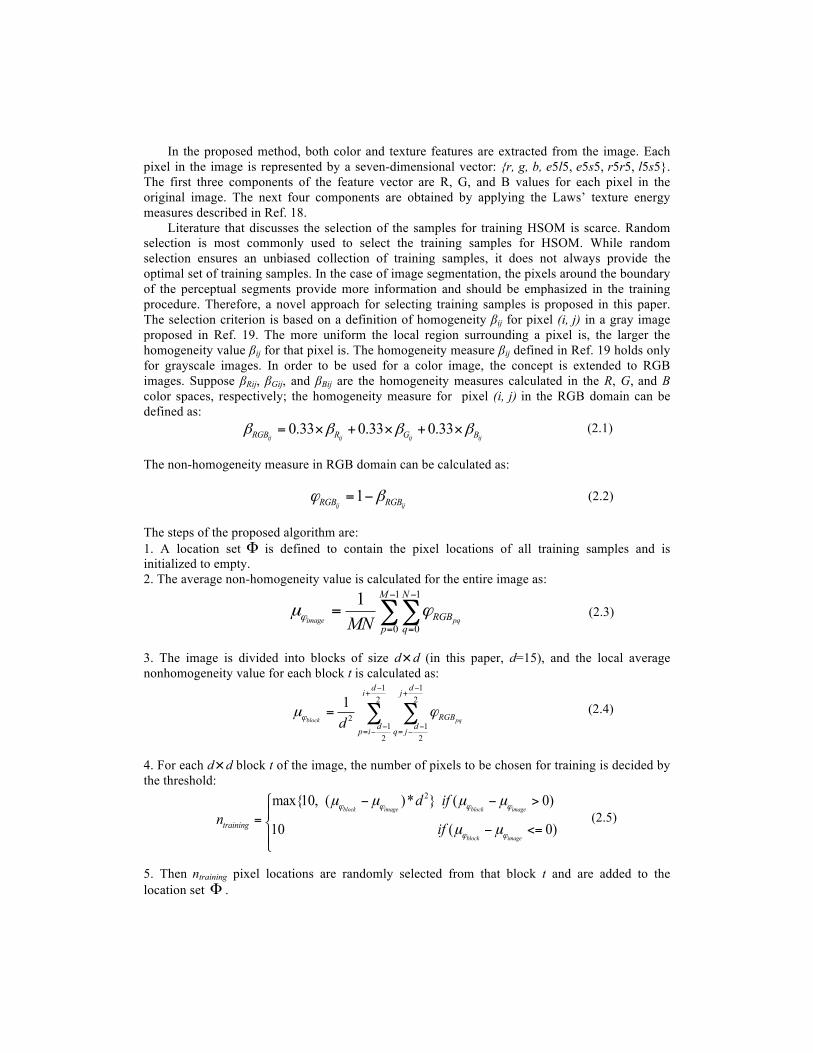
In the proposed method, both color and texture features are extracted from the image. Each pixel in the image is represented by a seven-dimensional vector: {r, g, b, e5l5, e5s5, r5r5, l5s5}. The first three components of the feature vector are R, G, and B values for each pixel in the original image. The next four components are obtained by applying the Laws’ texture energy measures described in Ref. 18.
Literature that discusses the selection of the samples for training HSOM is scarce. Random selection is most commonly used to select the training samples for HSOM. While random selection ensures an unbiased collection of training samples, it does not always provide the optimal set of training samples. In the case of image segmentation, the pixels around the boundary of the perceptual segments provide more information and should be emphasized in the training procedure. Therefore, a novel approach for selecting training samples is proposed in this paper. The selection criterion is based on a definition of homogeneity βij for pixel (i, j) in a gray image proposed in Ref. 19. The more uniform the local region surrounding a pixel is, the larger the homogeneity value βij for that pixel is. The homogeneity measure βij defined in Ref. 19 holds only for grayscale images. In order to be used for a color image, the concept is extended to RGB images. Suppose βRij, βGij, and βBij are the homogeneity measures calculated in the R, G, and B color spaces, respectively; the homogeneity measure for pixel (i, j) in the RGB domain can be defined as:
0.33 0.33 0.33ij ij ij ijRGB R G Bβ β β β= × + × + × (2.1)
The non-homogeneity measure in RGB domain can be calculated as:
1ij ijRGB RGBϕ β= − (2.2)
The steps of the proposed algorithm are: 1. A location set Φ is defined to contain the pixel locations of all training samples and is initialized to empty. 2. The average non-homogeneity value is calculated for the entire image as:
1 1
0 0
1image pq
M N
RGBp qMNϕµ ϕ− −
= =
= ∑∑ (2.3)
3. The image is divided into blocks of size d×d (in this paper, d=15), and the local average nonhomogeneity value for each block t is calculated as:
1 12 2
21 12 2
1block pq
d di j
RGBd dp i q j
dϕµ ϕ
− −+ +
− −= − = −
= ∑ ∑ (2.4)
4. For each d×d block t of the image, the number of pixels to be chosen for training is decided by the threshold:
2max{10, ( )* } ( 0)
10 ( 0)block image block image
block image
training
d ifn
ifϕ ϕ ϕ ϕ
ϕ ϕ
µ µ µ µ
µ µ
⎧ − − >⎪
= ⎨ − <=⎪⎩
(2.5)
5. Then ntraining pixel locations are randomly selected from that block t and are added to the location set Φ .
6. Repeat steps 2-4 for all the blocks in the image. 7. The vectors corresponding to the locations in set Φ are then extracted from the HSOM input matrix to form the final training set.
The algorithm ensures that the training dataset contains more pixels representing the diverse regions in the image than those representing the homogeneous regions. Therefore, a training dataset generated in this way carries more information about the image than the training dataset obtained by random selection, and it leads to better results of segmentation.
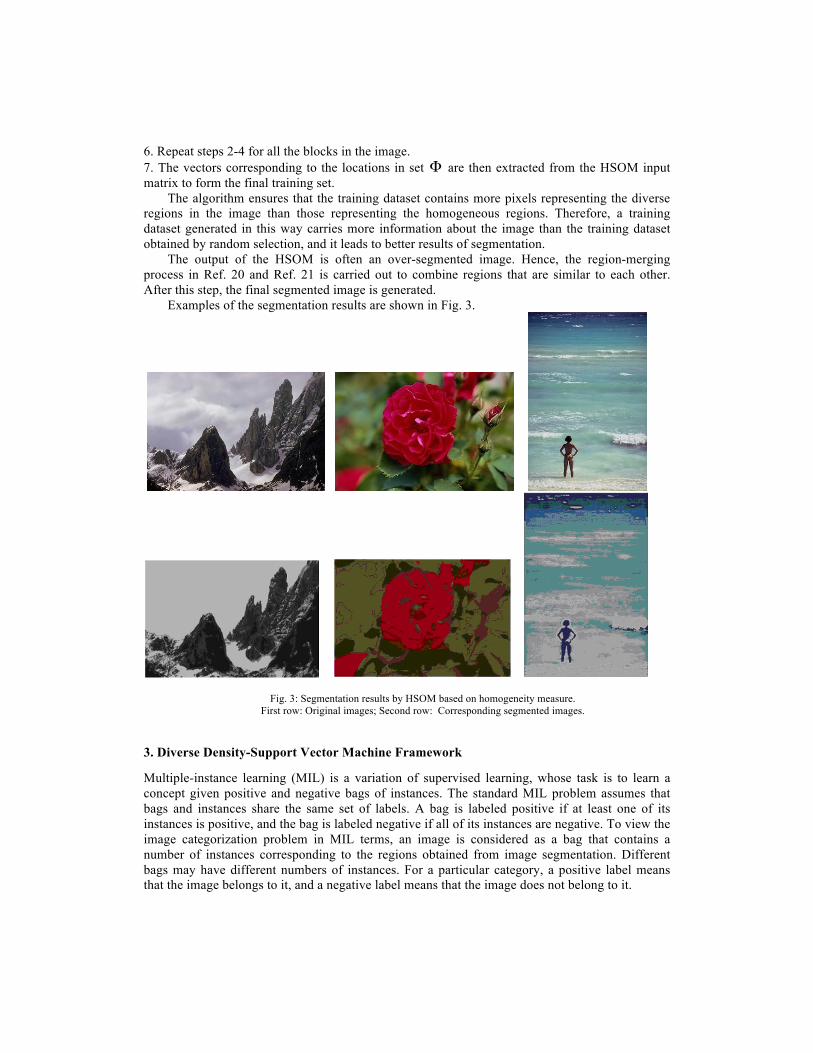
The output of the HSOM is often an over-segmented image. Hence, the region-merging process in Ref. 20 and Ref. 21 is carried out to combine regions that are similar to each other. After this step, the final segmented image is generated.
Examples of the segmentation results are shown in Fig. 3.
Fig. 3: Segmentation results by HSOM based on homogeneity measure. First row: Original images; Second row: Corresponding segmented images.
3. Diverse Density-Support Vector Machine Framework
Multiple-instance learning (MIL) is a variation of supervised learning, whose task is to learn a concept given positive and negative bags of instances. The standard MIL problem assumes that bags and instances share the same set of labels. A bag is labeled positive if at least one of its instances is positive, and the bag is labeled negative if all of its instances are negative. To view the image categorization problem in MIL terms, an image is considered as a bag that contains a number of instances corresponding to the regions obtained from image segmentation. Different bags may have different numbers of instances. For a particular category, a positive label means that the image belongs to it, and a negative label means that the image does not belong to it.
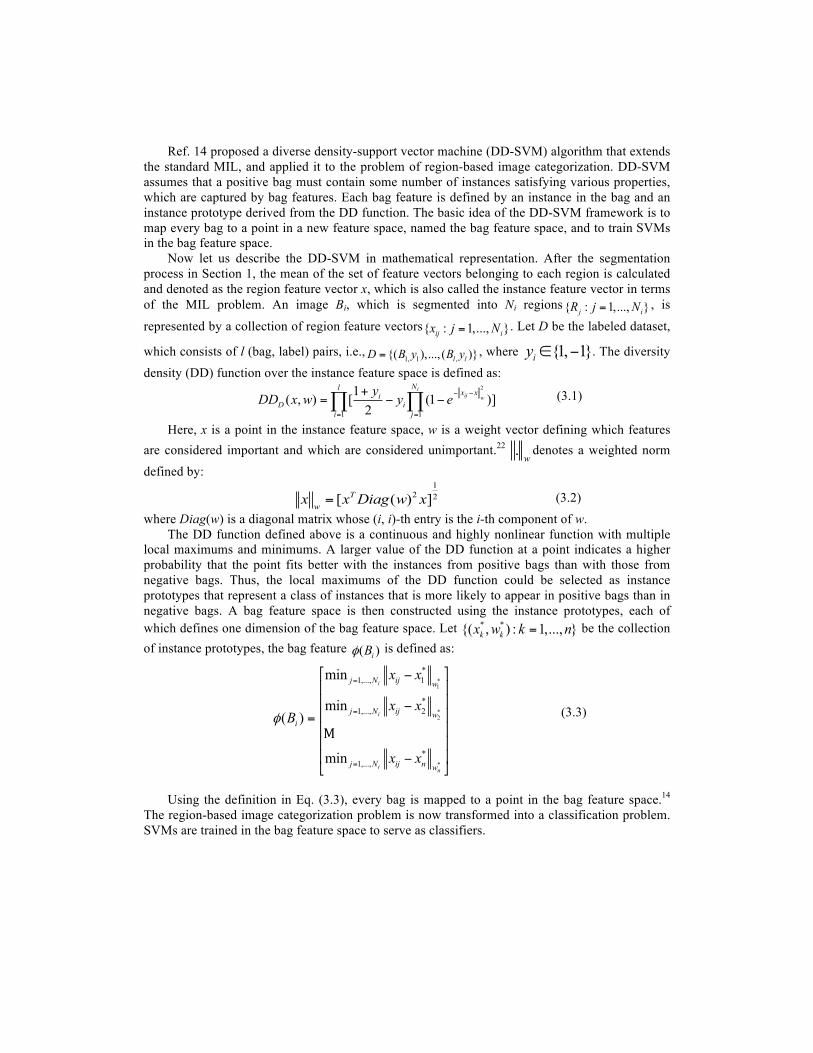
Ref. 14 proposed a diverse density-support vector machine (DD-SVM) algorithm that extends the standard MIL, and applied it to the problem of region-based image categorization. DD-SVM assumes that a positive bag must contain some number of instances satisfying various properties, which are captured by bag features. Each bag feature is defined by an instance in the bag and an instance prototype derived from the DD function. The basic idea of the DD-SVM framework is to map every bag to a point in a new feature space, named the bag feature space, and to train SVMs in the bag feature space.
Now let us describe the DD-SVM in mathematical representation. After the segmentation process in Section 1, the mean of the set of feature vectors belonging to each region is calculated and denoted as the region feature vector x, which is also called the instance feature vector in terms of the MIL problem. An image Bi, which is segmented into Ni regions{ : 1,..., }j iR j N= , is
represented by a collection of region feature vectors{ : 1,..., }ij ix j N= . Let D be the labeled dataset,
which consists of l (bag, label) pairs, i.e.,1, 1 ,{( ),..., ( )}l lD B y B y= , where {1, 1}iy ∈ − . The diversity
density (DD) function over the instance feature space is defined as: 2
1 1
1( , ) [ (1 )]2
iij w
Nl x xiD i
i j
yDD x w y e− −
= =
+= − −∏ ∏ (3.1)
Here, x is a point in the instance feature space, w is a weight vector defining which features are considered important and which are considered unimportant.22 .
wdenotes a weighted norm
defined by:
1
2 2[ ( ) ]Tw
x x Diag w x= (3.2) where Diag(w) is a diagonal matrix whose (i, i)-th entry is the i-th component of w.
The DD function defined above is a continuous and highly nonlinear function with multiple local maximums and minimums. A larger value of the DD function at a point indicates a higher probability that the point fits better with the instances from positive bags than with those from negative bags. Thus, the local maximums of the DD function could be selected as instance prototypes that represent a class of instances that is more likely to appear in positive bags than in negative bags. A bag feature space is then constructed using the instance prototypes, each of which defines one dimension of the bag feature space. Let * *{( , ) : 1,..., }k kx w k n= be the collection of instance prototypes, the bag feature ( )iBφ is defined as:
*1
*2
*
*1,..., 1
*1,..., 2
*1,...,
min
min( )
min
i
i
i n
j N ij w
j N ij wi
j N ij n w
x x
x xB
x x
φ
=
=
=
⎡ ⎤−⎢ ⎥⎢ ⎥−⎢ ⎥=⎢ ⎥⎢ ⎥⎢ ⎥−⎣ ⎦
M (3.3)
Using the definition in Eq. (3.3), every bag is mapped to a point in the bag feature space.14
The region-based image categorization problem is now transformed into a classification problem. SVMs are trained in the bag feature space to serve as classifiers.
4. Novel Reformulated Support Vector Machine Based on Neutrosophic Set
In this paper, we use the same DD-SVM framework as presented in Section 3, except that instead of using standard SVMs in the bag feature space, a novel reformulated SVM based on a neutrosophic set is proposed and employed.
4.1 Background of SVM and Fuzzy SVM
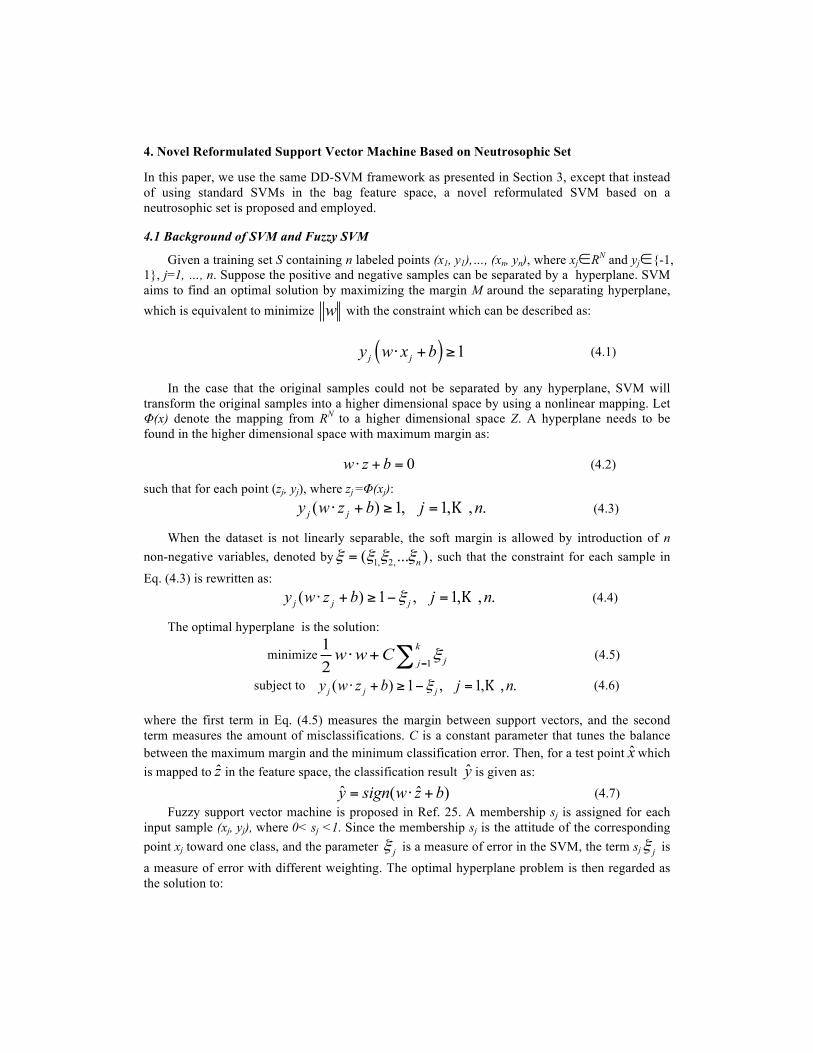
Given a training set S containing n labeled points (x1, y1),…, (xn, yn), where xj∈RN and yj∈{-1, 1}, j=1, …, n. Suppose the positive and negative samples can be separated by a hyperplane. SVM aims to find an optimal solution by maximizing the margin M around the separating hyperplane, which is equivalent to minimize w with the constraint which can be described as:
( ) 1j jy w x b⋅ + ≥ (4.1)
In the case that the original samples could not be separated by any hyperplane, SVM will transform the original samples into a higher dimensional space by using a nonlinear mapping. Let Φ(x) denote the mapping from RN to a higher dimensional space Z. A hyperplane needs to be found in the higher dimensional space with maximum margin as:
0=+⋅ bzw (4.2)
such that for each point (zj, yj), where zj =Φ(xj): ( ) 1, 1, , .j jy w z b j n⋅ + ≥ = K (4.3)
When the dataset is not linearly separable, the soft margin is allowed by introduction of n non-negative variables, denoted by 1, 2,( ... )nξ ξ ξ ξ= , such that the constraint for each sample in
Eq. (4.3) is rewritten as: ( ) 1 , 1, , .j j jy w z b j nξ⋅ + ≥ − = K (4.4)
The optimal hyperplane is the solution:
minimize1
12
kjj
w w C ξ=
⋅ + ∑ (4.5)
subject to ( ) 1 , 1, , .j j jy w z b j nξ⋅ + ≥ − = K (4.6)
where the first term in Eq. (4.5) measures the margin between support vectors, and the second term measures the amount of misclassifications. C is a constant parameter that tunes the balance between the maximum margin and the minimum classification error. Then, for a test point xwhich is mapped to z in the feature space, the classification result y is given as:
ˆ ˆ( )y sign w z b= ⋅ + (4.7) Fuzzy support vector machine is proposed in Ref. 25. A membership sj is assigned for each
input sample (xj, yj), where 0< sj <1. Since the membership sj is the attitude of the corresponding point xj toward one class, and the parameter jξ is a measure of error in the SVM, the term sj jξ is a measure of error with different weighting. The optimal hyperplane problem is then regarded as the solution to:
minimize 1
12
kj ji
w w C s ξ=
⋅ + ∑ (4.8)
subject to ( ) 1 , 1, , .j j jy w z b j nξ⋅ + ≥ − = K (4.9)
In order to use FSVM, a membership function needs to be defined for each input sample.
4.2 Reformulated SVM
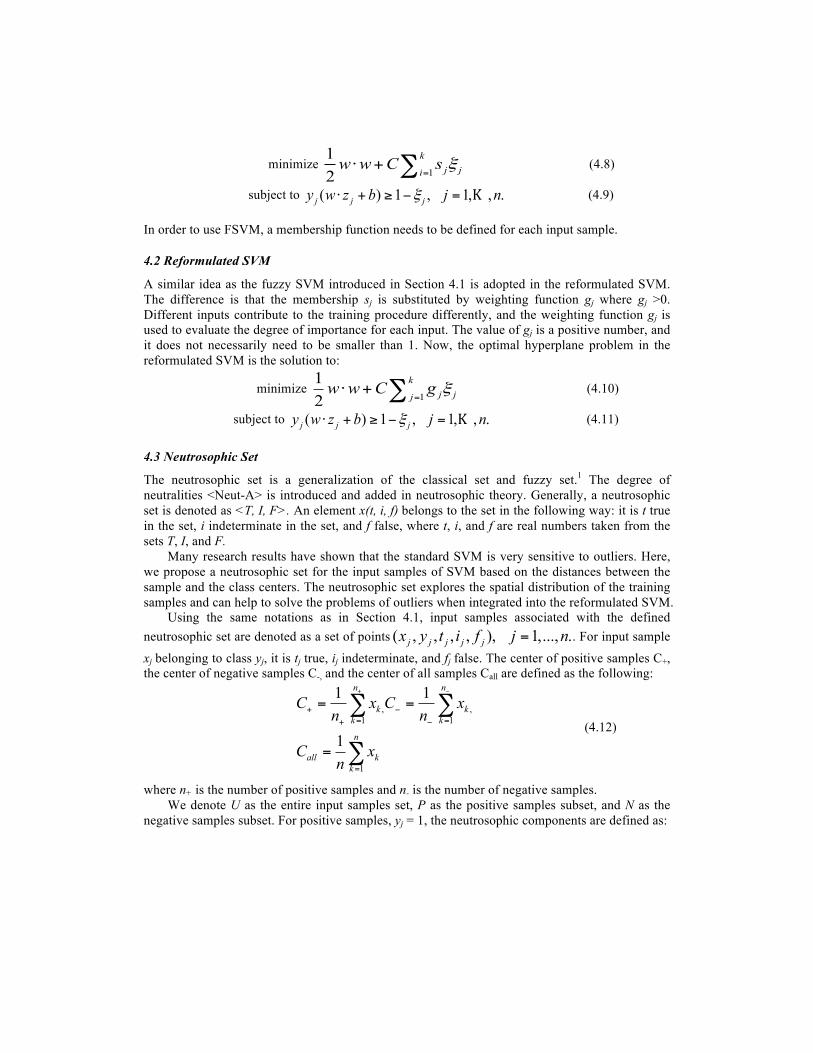
A similar idea as the fuzzy SVM introduced in Section 4.1 is adopted in the reformulated SVM. The difference is that the membership sj is substituted by weighting function gj where gj >0. Different inputs contribute to the training procedure differently, and the weighting function gj is used to evaluate the degree of importance for each input. The value of gj is a positive number, and it does not necessarily need to be smaller than 1. Now, the optimal hyperplane problem in the reformulated SVM is the solution to:
minimize 1
12
kj jj
w w C g ξ=
⋅ + ∑ (4.10)
subject to ( ) 1 , 1, , .j j jy w z b j nξ⋅ + ≥ − = K (4.11)
4.3 Neutrosophic Set
The neutrosophic set is a generalization of the classical set and fuzzy set.1 The degree of neutralities <Neut-A> is introduced and added in neutrosophic theory. Generally, a neutrosophic set is denoted as <T, I, F>. An element x(t, i, f) belongs to the set in the following way: it is t true in the set, i indeterminate in the set, and f false, where t, i, and f are real numbers taken from the sets T, I, and F.
Many research results have shown that the standard SVM is very sensitive to outliers. Here, we propose a neutrosophic set for the input samples of SVM based on the distances between the sample and the class centers. The neutrosophic set explores the spatial distribution of the training samples and can help to solve the problems of outliers when integrated into the reformulated SVM.
Using the same notations as in Section 4.1, input samples associated with the defined neutrosophic set are denoted as a set of points ( , , , , ), 1,..., .j j j j jx y t i f j n= . For input sample
xj belonging to class yj, it is tj true, ij indeterminate, and fj false. The center of positive samples C+, the center of negative samples C-, and the center of all samples Call are defined as the following:
, ,
1 1
1
1 1
1
n n
k kk k
n
all kk
C x C xn n
C xn
+ −
+ −= =+ −
=
= =
=
∑ ∑
∑ (4.12)
where n+ is the number of positive samples and n- is the number of negative samples. We denote U as the entire input samples set, P as the positive samples subset, and N as the
negative samples subset. For positive samples, yj = 1, the neutrosophic components are defined as:
1max
1max
1max
k
k
k
jj
kx P
j allj
k allx U
jj
kx P
x Ct
x C
x Ci
x C
x Cf
x C
+
+∈
∈
−
−∈
−= −
−
−= −
−
−= −
−
(4.13)
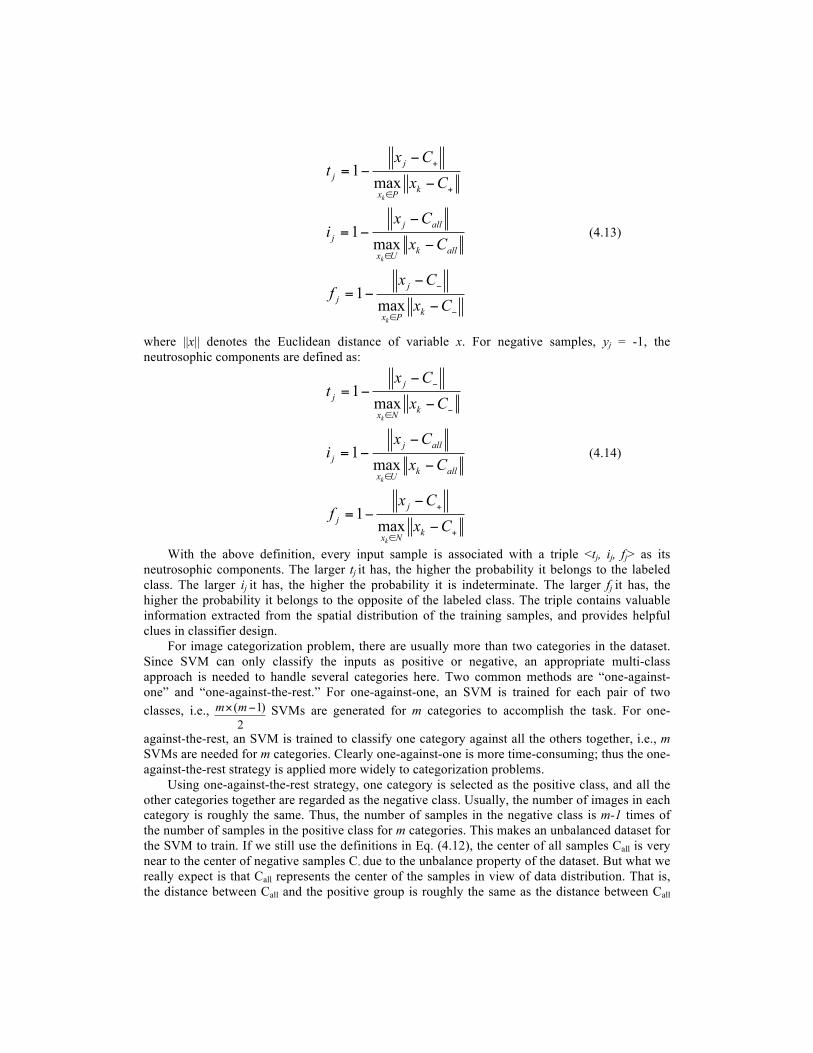
where ||x|| denotes the Euclidean distance of variable x. For negative samples, yj = -1, the neutrosophic components are defined as:
1max
1max
1max
k
k
k
jj
kx N
j allj
k allx U
jj
kx N
x Ct
x C
x Ci
x C
x Cf
x C
−
−∈
∈
+
+∈
−= −
−
−= −
−
−= −
−
(4.14)
With the above definition, every input sample is associated with a triple <tj, ij, fj> as its neutrosophic components. The larger tj it has, the higher the probability it belongs to the labeled class. The larger ij it has, the higher the probability it is indeterminate. The larger fj it has, the higher the probability it belongs to the opposite of the labeled class. The triple contains valuable information extracted from the spatial distribution of the training samples, and provides helpful clues in classifier design.
For image categorization problem, there are usually more than two categories in the dataset. Since SVM can only classify the inputs as positive or negative, an appropriate multi-class approach is needed to handle several categories here. Two common methods are “one-against-one” and “one-against-the-rest.” For one-against-one, an SVM is trained for each pair of two classes, i.e., ( 1)
2m m× − SVMs are generated for m categories to accomplish the task. For one-
against-the-rest, an SVM is trained to classify one category against all the others together, i.e., m SVMs are needed for m categories. Clearly one-against-one is more time-consuming; thus the one-against-the-rest strategy is applied more widely to categorization problems.
Using one-against-the-rest strategy, one category is selected as the positive class, and all the other categories together are regarded as the negative class. Usually, the number of images in each category is roughly the same. Thus, the number of samples in the negative class is m-1 times of the number of samples in the positive class for m categories. This makes an unbalanced dataset for the SVM to train. If we still use the definitions in Eq. (4.12), the center of all samples Call is very near to the center of negative samples C- due to the unbalance property of the dataset. But what we really expect is that Call represents the center of the samples in view of data distribution. That is, the distance between Call and the positive group is roughly the same as the distance between Call
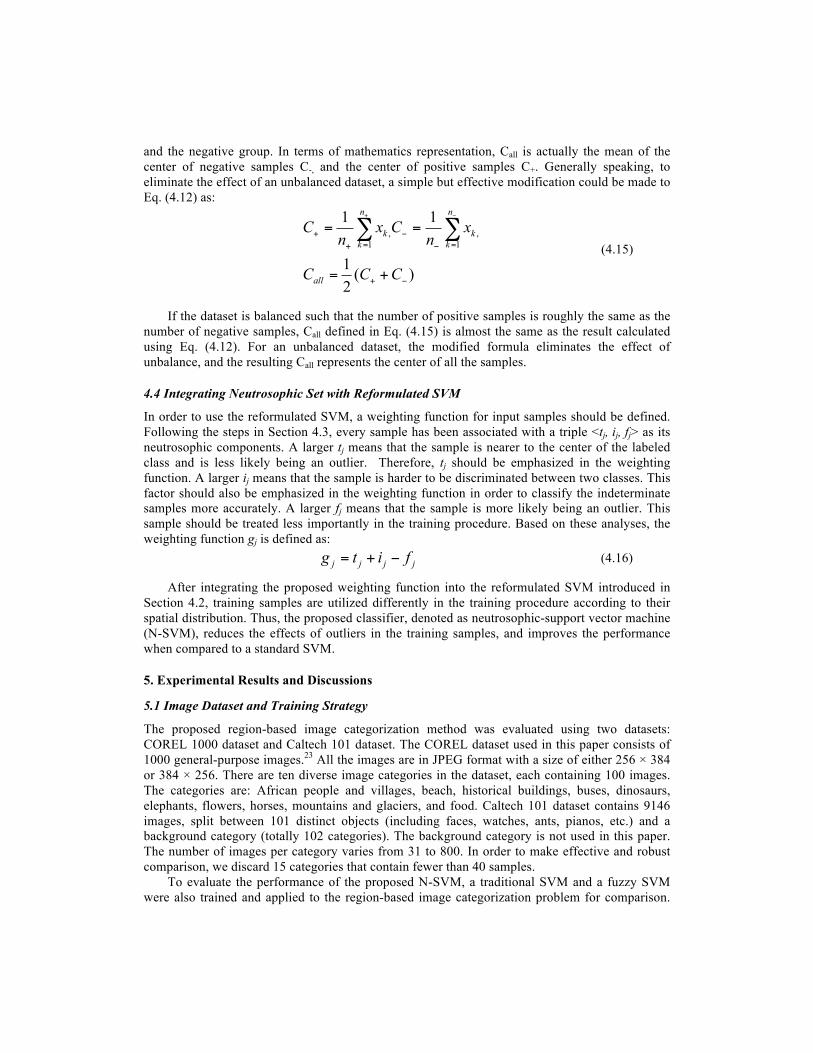
and the negative group. In terms of mathematics representation, Call is actually the mean of the center of negative samples C-, and the center of positive samples C+. Generally speaking, to eliminate the effect of an unbalanced dataset, a simple but effective modification could be made to Eq. (4.12) as:
, ,
1 1
1 1
1 ( )2
n n
k kk k
all
C x C xn n
C C C
+ −
+ −= =+ −
+ −
= =
= +
∑ ∑ (4.15)
If the dataset is balanced such that the number of positive samples is roughly the same as the number of negative samples, Call defined in Eq. (4.15) is almost the same as the result calculated using Eq. (4.12). For an unbalanced dataset, the modified formula eliminates the effect of unbalance, and the resulting Call represents the center of all the samples.
4.4 Integrating Neutrosophic Set with Reformulated SVM
In order to use the reformulated SVM, a weighting function for input samples should be defined. Following the steps in Section 4.3, every sample has been associated with a triple <tj, ij, fj> as its neutrosophic components. A larger tj means that the sample is nearer to the center of the labeled class and is less likely being an outlier. Therefore, tj should be emphasized in the weighting function. A larger ij means that the sample is harder to be discriminated between two classes. This factor should also be emphasized in the weighting function in order to classify the indeterminate samples more accurately. A larger fj means that the sample is more likely being an outlier. This sample should be treated less importantly in the training procedure. Based on these analyses, the weighting function gj is defined as:
j j j jg t i f= + − (4.16)
After integrating the proposed weighting function into the reformulated SVM introduced in Section 4.2, training samples are utilized differently in the training procedure according to their spatial distribution. Thus, the proposed classifier, denoted as neutrosophic-support vector machine (N-SVM), reduces the effects of outliers in the training samples, and improves the performance when compared to a standard SVM.
5. Experimental Results and Discussions
5.1 Image Dataset and Training Strategy
The proposed region-based image categorization method was evaluated using two datasets: COREL 1000 dataset and Caltech 101 dataset. The COREL dataset used in this paper consists of 1000 general-purpose images.23 All the images are in JPEG format with a size of either 256 × 384 or 384 × 256. There are ten diverse image categories in the dataset, each containing 100 images. The categories are: African people and villages, beach, historical buildings, buses, dinosaurs, elephants, flowers, horses, mountains and glaciers, and food. Caltech 101 dataset contains 9146 images, split between 101 distinct objects (including faces, watches, ants, pianos, etc.) and a background category (totally 102 categories). The background category is not used in this paper. The number of images per category varies from 31 to 800. In order to make effective and robust comparison, we discard 15 categories that contain fewer than 40 samples.
To evaluate the performance of the proposed N-SVM, a traditional SVM and a fuzzy SVM were also trained and applied to the region-based image categorization problem for comparison.
The differences among these classifiers are the restriction for finding the optimal hyperplane. In a fuzzy SVM, membership function sj is introduced and multiplied to the error parameter jξ in Eq. (4.8). Membership function sj is substituted by weighting function gj in N-SVM, as shown in Eq. (4.10). After the optimal hyperplane is solved, the same classification criterion is applied to all classifiers, as shown in Eq. (4.7). In our experiments, all the classifiers (SVM, fuzzy SVM, and N-SVM) are trained using the same strategy. The one-against-the-rest method is used to solve the multi-class problem: (a) for each category, a classifier is trained to separate that category from all other categories; (b) the final predicted class label is decided by the winner of all classifiers, that is, the one with the maximum value inside the ( )sign ⋅ function in Eq. (4.7). For the COREL dataset, images within each category are randomly divided into a training set (50 images) and a test set (50 images). For each category in the Caltech 101 dataset, 30 images are randomly selected as a training set and 50 (or fewer if they are the remainder) different images are randomly selected as test set. For each SVM designed for category i as positive samples, the training sets of all the categories other than category i are put together as the negative samples. Each experiment is repeated for five random splits, and the average of the classification results obtained over five different test sets is reported.
5.2 Comparison of the Proposed N-SVM with Traditional SVM and Fuzzy SVM
The proposed N-SVM is designed to reduce the effects of outliers in the training samples. Since neutrosophic logic is a generalization of classic logic and fuzzy logic, it is very meaningful to compare the performance of the proposed N-SVM with traditional SVM and fuzzy SVM. For fuzzy SVM, we use the membership function proposed in Ref. 24. To evaluate the performance, all classifiers are trained using the strategy described in Section 5.1. Thus, ten SVMs, ten fuzzy SVMs, and ten N-SVMs are generated, respectively. For each random split of the images, the same set of training data and test data is used for the corresponding SVMs, fuzzy SVMs, and N-SVMs. Since the dataset is unbalanced, Eq. (4.15) is used to calculate the parameters of the weighting function gj in N-SVM. The classification results are presented in Table 5.1.
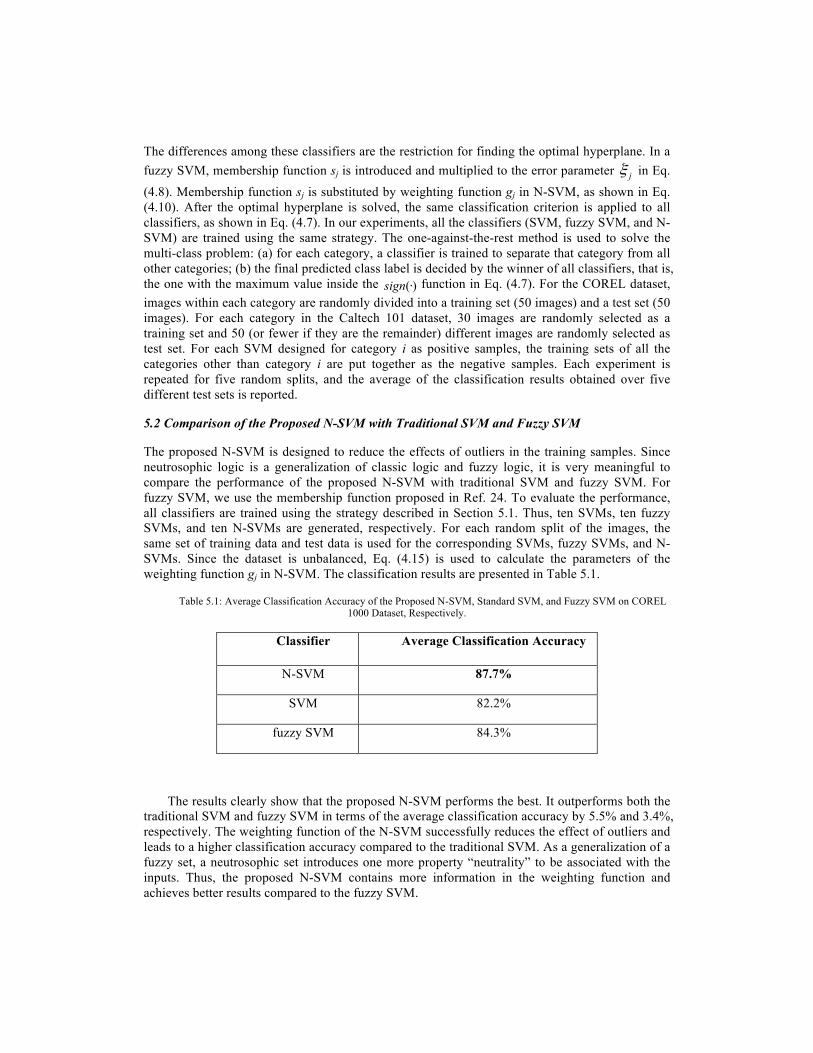
Table 5.1: Average Classification Accuracy of the Proposed N-SVM, Standard SVM, and Fuzzy SVM on COREL 1000 Dataset, Respectively.
Classifier Average Classification Accuracy
N-SVM 87.7%
SVM 82.2%
fuzzy SVM 84.3%
The results clearly show that the proposed N-SVM performs the best. It outperforms both the traditional SVM and fuzzy SVM in terms of the average classification accuracy by 5.5% and 3.4%, respectively. The weighting function of the N-SVM successfully reduces the effect of outliers and leads to a higher classification accuracy compared to the traditional SVM. As a generalization of a fuzzy set, a neutrosophic set introduces one more property “neutrality” to be associated with the inputs. Thus, the proposed N-SVM contains more information in the weighting function and achieves better results compared to the fuzzy SVM.
Next, a closer analysis of the performance is made by looking at classification results on every category in terms of the confusion matrix. The classification results are listed in Table 5.2.
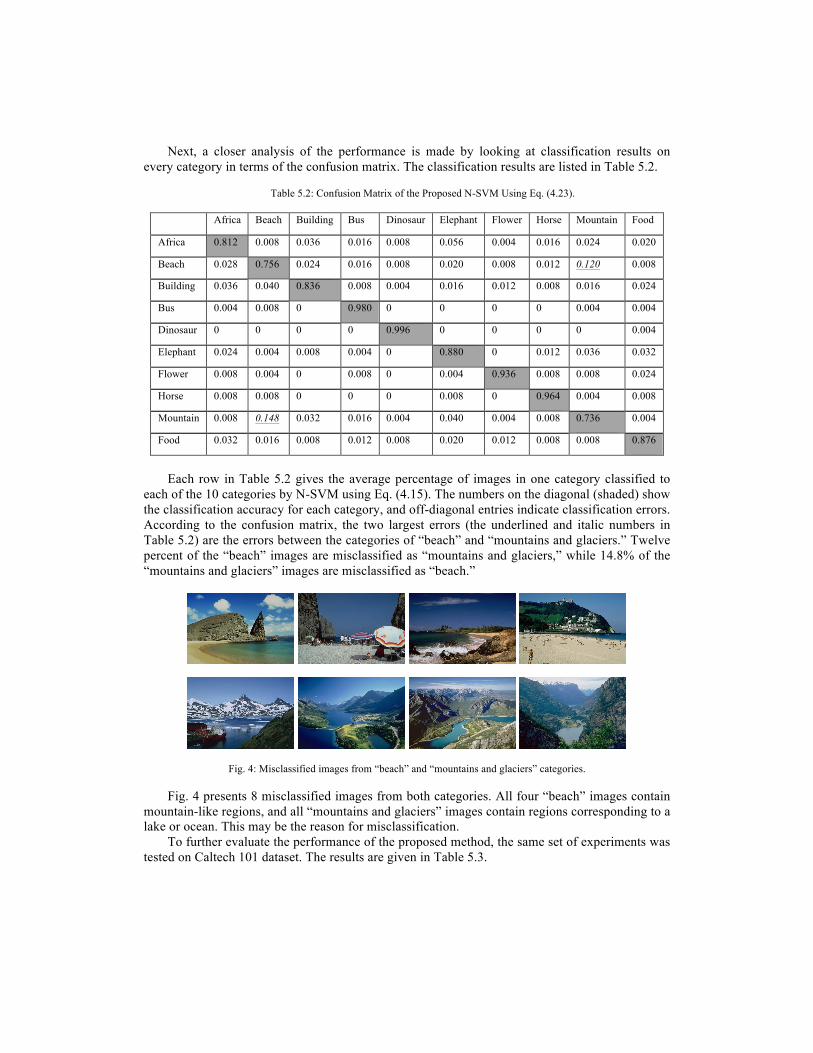
Table 5.2: Confusion Matrix of the Proposed N-SVM Using Eq. (4.23).
Africa Beach Building Bus Dinosaur Elephant Flower Horse Mountain Food
Africa 0.812 0.008 0.036 0.016 0.008 0.056 0.004 0.016 0.024 0.020
Beach 0.028 0.756 0.024 0.016 0.008 0.020 0.008 0.012 0.120 0.008
Building 0.036 0.040 0.836 0.008 0.004 0.016 0.012 0.008 0.016 0.024
Bus 0.004 0.008 0 0.980 0 0 0 0 0.004 0.004
Dinosaur 0 0 0 0 0.996 0 0 0 0 0.004
Elephant 0.024 0.004 0.008 0.004 0 0.880 0 0.012 0.036 0.032
Flower 0.008 0.004 0 0.008 0 0.004 0.936 0.008 0.008 0.024
Horse 0.008 0.008 0 0 0 0.008 0 0.964 0.004 0.008
Mountain 0.008 0.148 0.032 0.016 0.004 0.040 0.004 0.008 0.736 0.004
Food 0.032 0.016 0.008 0.012 0.008 0.020 0.012 0.008 0.008 0.876
Each row in Table 5.2 gives the average percentage of images in one category classified to
each of the 10 categories by N-SVM using Eq. (4.15). The numbers on the diagonal (shaded) show the classification accuracy for each category, and off-diagonal entries indicate classification errors. According to the confusion matrix, the two largest errors (the underlined and italic numbers in Table 5.2) are the errors between the categories of “beach” and “mountains and glaciers.” Twelve percent of the “beach” images are misclassified as “mountains and glaciers,” while 14.8% of the “mountains and glaciers” images are misclassified as “beach.”
Fig. 4: Misclassified images from “beach” and “mountains and glaciers” categories.
Fig. 4 presents 8 misclassified images from both categories. All four “beach” images contain mountain-like regions, and all “mountains and glaciers” images contain regions corresponding to a lake or ocean. This may be the reason for misclassification.
To further evaluate the performance of the proposed method, the same set of experiments was tested on Caltech 101 dataset. The results are given in Table 5.3.
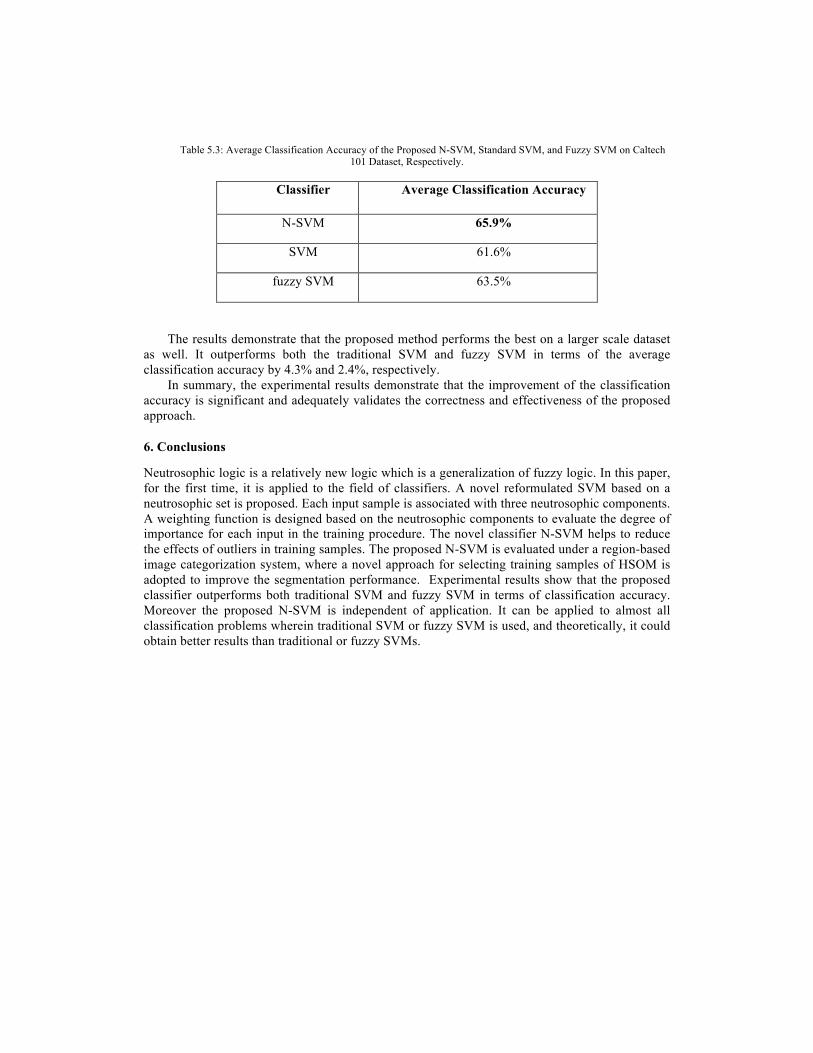
Table 5.3: Average Classification Accuracy of the Proposed N-SVM, Standard SVM, and Fuzzy SVM on Caltech 101 Dataset, Respectively.
Classifier Average Classification Accuracy
N-SVM 65.9%
SVM 61.6%
fuzzy SVM 63.5%
The results demonstrate that the proposed method performs the best on a larger scale dataset as well. It outperforms both the traditional SVM and fuzzy SVM in terms of the average classification accuracy by 4.3% and 2.4%, respectively.
In summary, the experimental results demonstrate that the improvement of the classification accuracy is significant and adequately validates the correctness and effectiveness of the proposed approach.
6. Conclusions
Neutrosophic logic is a relatively new logic which is a generalization of fuzzy logic. In this paper, for the first time, it is applied to the field of classifiers. A novel reformulated SVM based on a neutrosophic set is proposed. Each input sample is associated with three neutrosophic components. A weighting function is designed based on the neutrosophic components to evaluate the degree of importance for each input in the training procedure. The novel classifier N-SVM helps to reduce the effects of outliers in training samples. The proposed N-SVM is evaluated under a region-based image categorization system, where a novel approach for selecting training samples of HSOM is adopted to improve the segmentation performance. Experimental results show that the proposed classifier outperforms both traditional SVM and fuzzy SVM in terms of classification accuracy. Moreover the proposed N-SVM is independent of application. It can be applied to almost all classification problems wherein traditional SVM or fuzzy SVM is used, and theoretically, it could obtain better results than traditional or fuzzy SVMs.
References
1. F. Smarandache, A Unifying Field in Logics: Neutrosophic Logic. Neutrosophy, Neutrosophic Set, Neutrosophic Probability (American Research Press, 2003).
2. H. D. Cheng and Y. Guo, A new neutrosophic approach to image thresholding, New Mathematics andNatural Computation 4, 3 (2008), 291-308.
3. M. Zhang, L. Zhang and H. D. Cheng, A neutrosophic approach to image segmentation based onwatershed method, Signal Processing 90, 5 (2010), 1510-1517.
4. J. Shan, H. D. Cheng and Y. Wang, A completely automatic segmentation method for breastultrasound images using region growing, in Proceedings of the 9th International Conference onComputer Vision, Pattern Recognition, and Image Processing (2008).
5. Y. Guo, H. D. Cheng and Y. Zhang, A new neutrosophic approach to image denoising, NewMathematics and Natural Computation 5, 3 (2009), 653-662.
6. J. Liu, B. Wang, M. Li, Z. Li, W. Ma, H. Lu and S. Ma, Dual cross-media relevance model for imageannotation, in Proceedings of the 15th International Conference on Multimedia (2007).
7. Z. Lu, Y. Peng, and H. H. S. IP, Image categorization via robust pLSA, Pattern Recognition Letters31, 1 (2010), 36-43.
8. G. Carneiro, A. B. Chan, P. J. Moreno and N. Vasconcelos, Supervised learning of semantic classesfor image annotation and retrieval, IEEE Trans. Pattern Analysis and Machine Intelligence 29, 3(2007), 394-410.
9. L. Wang, Z. Lu and H. H. S. Ip, Image categorization based on a hierarchical spatial Markov model,in Proceedings of the 13th International Conference on Computer Analysis of Images and Patterns(2009).
10. S. Feng and D. Xu, Transductive multi-instance multi-label learning algorithm with application toautomatic image annotation, Expert Systems with Applications 37, 1 (2010), 661-670.
11. E. Chang, K. Goh, G. Sychay and G. Wu, CBSA: Content-based soft annotation for multimodalimage retrieval using bayes point machines, IEEE Trans. Circuits System and Video Technology 13, 1(2003), 26-38.
12. C. Cusano, G. Ciocca and R. Schettini, Image annotation using SVM, in Proceedings of InternetImaging SPIE 5304 (2004), 330-338.
13. O. Maron and T. Lozano-Perez, A framework for multiple-instance learning, in Proceedings of 11thConference of Neural Information Processing Systems (1998), 570-576.
14. Y. Chen and J. Wang, Image categorization by learning and reasoning with regions, J. MachineLearning Res. 5, 12 (2004), 913-939.
15. H. D. Cheng, M. Datar and W. Ju, Natural scene segmentation based on information fusion andhomogeneity property, in Proceedings of the 7th International Conference on Computer Vision,Pattern Recognition, and Image Processing (2006).
16. T. Kohonen, The self-organizing map, in Proceedings of the IEEE 78, 9 (1990), 1464-1480.17. J. Lampinen and E. Oja, Clustering properties of hierarchical self-organizing maps, J. Mathematical
Imaging and Vision 2, 2-3 (1992), 261-272.18. K. I. Laws, Texture energy measures, in Proceedings of Image Understanding Workshop (1979), 47-
51.19. K .I. Laws, Textured Image Segmentation, PhD Thesis, University of Southern California (1980).20. H. D. Cheng and Y. Sun, A hierarchical approach to color image segmentation using homogeneity,
IEEE Trans. Image Processing 9, 12 (2000), 2071-2082.21. H. D. Cheng, M. Xue and X. Shi, Contrast enhancement based on a novel homogeneity measurement,
Pattern Recognition 36, 11 (2003), 2687-2697.22. M. M. Gorkani and R. W. Picard, Texture orientation for sorting photos ‘at a glance’, in Proceedings
of the 12th International Conference on Pattern Recognition (1994).23. J. Z. Wang, J. Li and G. Wiederhold, SIMPLIcity: Semantics-sensitive integrated matching for
picture libraries, IEEE Trans. Pattern Analysis and Machine Intelligence 23, 9 (2001), 947-963.24. W. Ju, J. Shan and H. D. Cheng, Discrimination of outer membrane proteins using fuzzy support
vector machines, in Proceedings of the 8th International Conference on Computer Vision, PatternRecognition, and Image Processing (2007).
25. Lin, C.F. and Wang, S.D. Fuzzy support vector machines. IEEE Trans. Neural Networks 13, 2 (2002),464-471.