Embed Size (px)
Citation preview

Int. J. Production Economics 228 (2020) 107852
Available online 2 July 20200925-5273/© 2020 Elsevier B.V. All rights reserved.
A novel multi-objective co-evolutionary approach for supply chain gap analysis with consideration of uncertainties☆
Ahmad Jafarian a, Meysam Rabiee b, Madjid Tavana c,d,*
a Faculty of Management and Accounting, Allame Tabataba’i University Business School (ATUBS), Tehran, Iran b Lundquist College of Business, University of Oregon, Eugene, USA c Business Systems and Analytics Department, Distinguished Chair of Business Analytics, La Salle University, Philadelphia, PA, 19141, USA d Business Information Systems Department, Faculty of Business Administration and Economics, University of Paderborn, D-33098, Paderborn, Germany
A R T I C L E I N F O
Keywords: supply chain gap analysis Multi-objective optimization Grey theory Quality function deployment
A B S T R A C T
Supply chain gap analysis is a practical method for quantitatively measuring the gap between the current state and a desired/ideal state in a supply chain, and generating a list of corrective actions to eliminate this gap and reach a desired/ideal level in supply chain goals. We propose a novel multi-objective co-evolutionary approach for supply chain gap analysis by hybridizing two well-known algorithms of non-dominated sorting genetic algorithm II (NSGAII) and multiple objective particle swarm optimization (MOPSO). The proposed algorithm considers the best solution of NSGAII at each iteration and uses it as the initial population in MOPSO. We consider three objective functions, including the expected costs, the total time, and customer satisfaction. The house of quality and quality function deployment is used to transform customer requirements into product characteristics. We also use a response surface methodology with multi-objective decision making for tuning the parameters since meta-heuristic methods are generally sensitive to input parameters. We finally generate several random problems with different scenarios to compare the performance of our hybrid approach with singular methods. Five performance measures (i.e., mean ideal distance, diversification metric, quality metric, data envelopment analysis, and hypervolume metric) are used for this comparison. The results show the hybrid approach proposed in this study outperforms singular NSGAII and MOPSO metaheuristics in most scenarios.
1. Introduction
Companies facing heavy competition in their marketplace are forced to manage their resources effectively by periodically restructuring their supply chain management strategy (SCMS). The SCMS, introduced by Skinner (1969) and Hayes and Wheelwright (1984), is an operational strategy composed of a set of systems, technologies, and procedures for connecting a supplier to a customer (Lee, 2004; Brun and Castelli, 2008). Schnetzler et al. (2007) and Chopra and Meindl (2007) describe the SCMS as a combination of prioritized SCM operational and strategic programs designed to help organizations lead to better performance and increased productivity.
An important question related to SCMS is what kinds of strategies lead to satisfactory outcomes for supply chain (SC) components such as distribution, operations, and customer service (Chopra and Meindl,
2007). Several studies have tackled these questions (Robinson et al., 2005; Patel et al., 2013; Qi et al., 2017; Elgazzar et al., 2012; Dennis et al., 2017; Kumar et al., 2018). Morita et al. (2015) examined the relationship between product characteristics and the SCMS and explored how their alignment should be constructed. There is a universal consensus among researchers that finding the collection of suitable SCMS for each company is highly dependent on the business features of the organization (Childerhouse et al., 2002; Brun and Castelli, 2008). The strategic priorities should be translated into SC objectives to in-crease the likelihood of finding an excellent portfolio of SCMS and then converting those objectives into actionable policies. A structured pro-cedure is needed to develop an SCMS that is in alignment with organi-zational goals and objectives (Schnetzler et al., 2007).
The SC professional players (i.e., SC managers) should sporadically evaluate the difference between the desired SC performance measures
☆ The name of the company has been changed to protect the anonymity of this company. * Corresponding author. Business Systems and Analytics Department, Distinguished Chair of Business Analytics, La Salle University, Philadelphia, PA, 19141,
United States. E-mail addresses: [email protected] (A. Jafarian), [email protected] (M. Rabiee), [email protected] (M. Tavana).
Contents lists available at ScienceDirect
International Journal of Production Economics
journal homepage: http://www.elsevier.com/locate/ijpe
https://doi.org/10.1016/j.ijpe.2020.107852 Received 19 April 2019; Received in revised form 21 June 2020; Accepted 25 June 2020
International Journal of Production Economics 228 (2020) 107852
2
and the current extrapolated values of performance measures. Gap analysis quantitatively analyzes the differences, which exist between the present state and the ideal future for performance measures (Goodstein et al., 1993). The primary and chief purpose of gap analysis is to assess the strategic plans’ performance in achieving long-term goals (Eshlaghy et al., 2008).
Strategic gap analysis has not often been studied. For example, Thun (2008) studied the gap analysis and demonstrated that the general implementation strategy of a manufacturer has a considerable impact on the performance of the company and leads to a remarkable improve-ment in manufacturing strategies. Ghazinoory et al. (2007) also studied the gap analysis and proposed a new AHP-based approach to decide about accepting/rejecting the alternatives in achieving the best perfor-mance on the existing gap. They used a linear programming approach in AHP and compared the desired value and anticipated value of other options. Eshlaghy et al. (2008) proposed a predictive model for the anticipation of future performance through a hierarchical approach used to determine the relationships among strategic planning components.
The gap analysis method has been used to solve a wide range of business problems. However, to the best of our knowledge, the SCMS gap analysis has not been studied. We propose a grey multi-objective approach to reduce the gap (difference) between the present state of the SCMS and the desired/ideal state. A novel multi-objective approach is proposed by hybridizing two well-known algorithms: the non-domi-nated sorting genetic algorithm II (NSGAII) and the multiple objective par-ticle swarm optimization (MOPSO). The proposed algorithm considers the best solutions of the NSGAII method at each iteration and uses them as the initial population in the MOPSO method. We use the MOHNP ac-ronyms for naming the proposed method (Multi-Objective Hybrid NSGAII-MOPSO), which considers three objective functions, including the expected costs, the total time, and customer satisfaction. The house of quality (HOQ) and quality function deployment (QFD) is used to transform customer requirements into product characteristics. We also use the response surface methodology (RSM) for tuning the parameters. We finally use five performance measures to compare the performance of the proposed hybrid MOHNP method with singular NSGAII and MOPSO metaheuristics. The results show the hybrid method proposed in this study outperforms the competing NSGAII and MOPSO meta-heuristics in most scenarios.
The remainder of this paper is organized as follows. Section 2 pre-sents a brief literature review considering SCMS, SC performance eval-uation methods, and SC performance measures. The research goals and methodology are described in Sections 3. Section 4 presents the problem description and optimization modeling. In Section 5, we introduce metaheuristic frameworks, including multi-objective algorithms and the MOHNP method proposed in this study. Section 6 presents our data generation, parameter tuning, and comparative evaluation. In Section 7, we present a case study to demonstrate the applicability of the proposed method. Finally, in Section 8, we present our concluding remarks and future research directions.
2. Literature review
2.1. Supply chain management strategies
The principal role of SCMS is to periodically analyze the SC to make sure that it is aligned with the strategic goals of the organization (Zhang et al., 2010). Although some of the empirical studies have emphasized the substantial role of SCMS in designing the overall corporate strategy, the relationship between corporate strategy, SC strategy, and SC per-formance management is not explained in detail in the literature (Har-rison and New, 2002; Schnetzler et al., 2007). It is evident that to survive and compete in today’s competitive market, the primary goal of SCMS should be matching customers’ expectations with product characteris-tics (Chopra and Meindl, 2007). SCMS includes the specification of a relatively broad structure of SC and what many researchers and
practitioners used to call “supplier strategy,” “operational strategy,” and “logistical strategy” (Chopra and Meindl, 2007). The SCMS in a firm should include planning and analyzing the logistical activities, infor-mation flow, and material flow, not only through an internal relation at a firm but also through external links with other companies (Cooper et al., 1997; Seo, 2006).
SCMS plays a pivotal role in business strategies and has a profound effect on organizational success and competitive advantage (Kannan et al., 2013). In summary, SCMS should be analyzed to identify and improve essential operations that are not aligned with organizational goals and objectives.
2.2. Supply chain performance evaluation methods
Companies can visualize their goals using performance benchmarks. Each of these performance benchmarks includes a gauge that defines the extent that the company is close to the desired SC goal. Performance evaluation has a strong correlation with the efficiency of SC operations and can be described as a systematic process for enhancing productivity based on historical analysis and feedback. A comprehensive perfor-mance evaluation process can provide information regarding the present state of the performance measures and the gap in achieving the long- term goals of the organization (Hingoft, 2000).
Using a hierarchical structure of the SC strategies, each SCMS can support a set of operational programs towards achieving the overall organizational goals and objectives (Harland, 1996; Nie et al., 2008). The analytic hierarchy process (AHP) is one of the well-established methods for solving practical and real-world multicriteria decision-making problems. This method consists of a series of pairwise comparisons among alternatives considering some predefined criteria defined by the decision-maker. Finding the optimal criteria weights in multicriteria decision-making is an invaluable tool for aiding the decision-maker in choosing the best option among a set of feasible al-ternatives (Ghazinoory et al., 2007).
2.3. Supply chain performance measures
SC performance measures are critical for maximizing value and maintaining oversight in the SC. The following criteria and attributes are commonly used for the evaluation of SCs: the company’s competitive advantage (Dreyer & Gronhaug, 2004), customer requirements (Men-doza et al., 2007; Johnston et al., 2004; Sousa, 2003), high-level man-agement support (Li et al., 2006; Chen and Paulraj, 2004) information technology (Tseng et al., 2009; Dehning et al., 2007), and strategic purchasing (Dyer, 1996). Efficient and effective management of the SC is extremely critical to companies as SC executives rush to streamline their operations and minimize the time-to-customer for their products. The primary objective of the SC operations is to find the best course of action to cope with customer orders in the short-term and achieve organiza-tional objectives in the long-term. SC programs are intended to plan, control, and execute tactical and strategic plans (Schnetzler et al., 2007). These programs are designed and developed to eliminate the gap be-tween the current state and the desired/ideal state in SC. Li and O’Brien (2001) used a multi-objective approach to study the effect of the oper-ational parameters on manufacturing strategies. The computational re-sults from their multi-objective model demonstrated that there are some relations between the performance of SCMS and product attributes, which can be critical to both the operational and strategic levels. Tseng et al. (2009) showed that the selection of appropriate suppliers in SCMS is a challenging task requiring a multitude of evaluation criteria, which are often complex, elusive, and uncertain. The proposed hierarchical multicriteria framework used the analytic network process and a non-additive fuzzy integral to eliminate the interactivity of expert judgments. The novelties of the approach proposed in this study are fivefold. We present: (i) an SCMS gap analysis model with a hierarchical structure; (ii) a novel hybrid cooperative metaheuristic algorithm to
A. Jafarian et al.
International Journal of Production Economics 228 (2020) 107852
3
solve the SCMS gap improvement problem; (iii) a new hybrid tuning approach for improving the reliability of our proposed algorithm from a solution quality perspective; (iv) a grey approach for considering the inherent uncertainties in the strategic environment; and (v) a model that considers customer satisfaction in SCMS gap improvement. Although several studies have explored SCMS gap analysis from different per-spectives, none of them has proposed a comprehensive and structured framework that addresses all these issues concurrently.
2.4. Methodological literature review
In this section, we present a brief overview of quality function deployment, AHP, and grey theory.
2.4.1. Quality function deployment (QFD) QFD is a cross-functional planning tool proposed by Yoji Akao in
1996 to improve customer satisfaction by translating customer re-quirements into product features in the manufacturing process (Kahra-man et al., 2006). The QFD is designed to introduce higher-quality lower-cost products to market faster, achieve customer-driven prod-ucts, and develop an efficient system for future product development, and process improvement (Chen and Ko, 2009). QFD integrates various sources of organizational information such as customer requirements, product design requirements, and competitive evaluation to develop products and processes (Kahraman et al., 2006; Rajala et al., 1997). The HOQ is the central element of QFD and acts as a product planning matrix composed of two main elements of “whats” and “hows” to demonstrate how the quality characteristics satisfy the customer needs and demands (Kannan et al., 2013). Several studies have used quantitative planning and evaluation techniques in HOQ over the past decade including stra-tegic decision-making (Aya�g et al., 2013; Pandey, 2020), marketing (Chin et al., 2019), strategic planning (Dincer et al., 2019; Ojha et al., 2019), service design (Büyük€ozkan and Uztürk, 2019; Hara, 2018), mechanical industry (Bottani and Rizzi, 2006), product development (Bottani, 2009; Lee and Lin, 2011; Zheng et al., 2019), and financial planning (Kannan et al., 2013).
Crowe and Cheng (1996) introduced QFD as a strategic planning tool to translate strategic plans into appropriate operational programs. They proposed a four-phase QFD program for a hierarchical translation of business strategy to functional level strategy, manufacturing priorities, action plans, and detailed tasks. Tsai and Chang (2003) developed a fuzzy QFD model with an optimistic index for prioritizing strategic functions according to different scenarios and providing “what-if” analysis capabilities in a decision support environment. Jalham and Abdelkader (2006) developed a multi-stage model for manufacturing strategy formulation and implementation with QFD for improving effi-ciency and effectiveness in manufacturing companies. Kannan et al. (2013) developed a budget allocation framework based on organiza-tional strategic plans. They used a fuzzy QFD method to translate the weight of the strategic program to detailed tasks using HOQ matrixes.
2.4.2. Analytic hierarchy process (AHP) Multicriteria decision-making methods have evolved to solve com-
plex problems with multiple and often conflicting criteria. This complexity is intensified when the process involves qualitative judg-ments and quantitative data. Multicriteria decision-making methods have tremendous advantages in representing decision-makers’ prefer-ences, aggregating information, and capturing uncertainty (Govindan and Jepsen, 2016). In practice, multicriteria decision-making ap-proaches have been developed to solve real-world problems such as identifying barriers to sharing economy (Govindan et al., 2019); product decisions in SC management (Zhu et al., 2018); sustainable supplier selection and order allocation (Mohammed et al., 2019); identifying causal relationships in strategy maps (Moraga et al., 2020); and green SC planning (Jabbarzadeh et al., 2019). AHP is a popular and widely used multicriteria decision-making method among researchers and
practitioners due to its flexibility and simplicity (Subramanian and Ramanathan, 2012). In this study, we use AHP for pairwise comparison and calculating the importance weight for multiple SC management strategies. AHP has been widely used in strategy-related studies. For example, €Ozcan et al. (2017) used a multi-method approach using goal programming, AHP, and TOPSIS for maintenance strategy selection in hydroelectric power plants. Güler and Büyük€ozkan (2019) employed AHP to analyze digital transformation strategies. They tested their approach using a case study in the banking industry. Luthra et al. (2016) showed that the adoption and implementation of sustainability initia-tives in a supply chain could be a major challenge. They used AHP to identify and examine barriers related to the adoption of sustainability programs and strategies in supply chain management.
2.4.3. Grey theory Uncertainty plays a crucial role in the strategic planning process. A
large number of options are available to managers to cope with the issue of uncertain parameters in strategic planning (i.e., grey sets, fuzzy sets, rough sets). In this study, we employed interval parametric linear pro-gramming due to its flexibility and theoretical soundness in representing uncertain conditions (Lin et al., 2008; Sahoo et al., 2016; Sun et al., 2018; Wang, 2018). The theory of grey systems, proposed by Deng (1989), has been used widely for considering uncertain information in mathematical modeling (Liu and Lin, 2011). A large number of problems in managerial decision making can be represented with grey theory due to insufficient information and environmental uncertainties (Wei, 2010). A “grey number” can be defined as a number with an unknown value. However, its range is known. Let us assume �ðxÞ� is a grey number with a specified interval, and a known lower- and upper-bound, �ðxÞ� and � ðxÞþ, respectively. The unknown distribution of x can be defined as follows (Wei, 2010):
�ðxÞ ¼ ½ � ðxÞ� ;�ðxÞþ � ¼ fxj � ðxÞ� � � xÞ � �ðxÞþ;�ðxÞ� ;�ðxÞþ 2 R g(1)
Assume that �ðxÞ� → � ∞ and � ðxÞþ→þ ∞, in this case, �ðxÞ is considered a black number, which means it has no meaningful infor-mation to use. On the other hand, if we assume that � ðxÞ� ¼ � ðxÞþ, then �ðxÞ is regarded as a white number that has complete information (i.e., the exact value is known). Otherwise, �ðxÞ ¼ ½�ðxÞ� ;�ðxÞþ� can be defined as a grey number, which can be interpreted as uncertain and insufficient. In the following formulations, we present the basic arith-metic operations such as subtraction, addition, division, and multipli-cation for the assumed grey numbers �ðxÞ and � ðyÞ:
�ðxÞ� þ �ðyÞ� ¼ ½� ðxÞ� þ � ðyÞ� ; �ðxÞþ þ �ðyÞþ� (2)
�ðxÞ� � �ðyÞ� ¼ ½� ðxÞ� � � ðyÞþ; �ðxÞþ � �ðyÞ� � (3)
�ðxÞ� � �ðyÞ� ¼ ½min ð � ðxÞ � �ðyÞ Þ;maxð � ðxÞ � �ðyÞ Þ � � ðxÞ�
� �ðxÞ � �ðxÞþ; �ðyÞ� � �ðyÞ � �ðyÞþ; (4)
�ðxÞ� � �ðyÞ� ¼ ½min ð � ðxÞ=� ðyÞ Þ;maxð � ðxÞ=� ðyÞ Þ � � ðxÞ�
� �ðxÞ � �ðxÞþ;�ðyÞ� � �ðyÞ � �ðyÞþ (5)
�ðxÞ� � �ðyÞ� if � ðxÞ� � �ðyÞ� ; �ðxÞþ � �ðyÞþ (6)
3. Research goals and methodology
Gap analysis is a commonly used method for helping organizations understand where they are now (current state) and where they want to be (desired/ideal state). Gap analysis has been used for strategic outsourcing (Barak and Javanmard, 2019), product, process, and customer preference alignment (Schoenwitz et al., 2017), SC manage-ment (Brun et al., 2006), and strategic planning in manufacturing
A. Jafarian et al.
International Journal of Production Economics 228 (2020) 107852
4
(Hallgren and Olhager, 2006; Herron and Braiden, 2006; Rho et al., 2001). Although there are a few quantitative approaches to address the strategy gap improvement problem, determining the operational gap improvement is challenging due to the following reasons: (1) the managerial environment is often uncertain, and managers have to decide with insufficient or uncertain information, (2) most traditional strategic planning frameworks and approaches are qualitative, and finding the most suitable quantitative SCMS is often a difficult task, and (3) the number of operational programs increases combinatorically as the number of strategic plans increases.
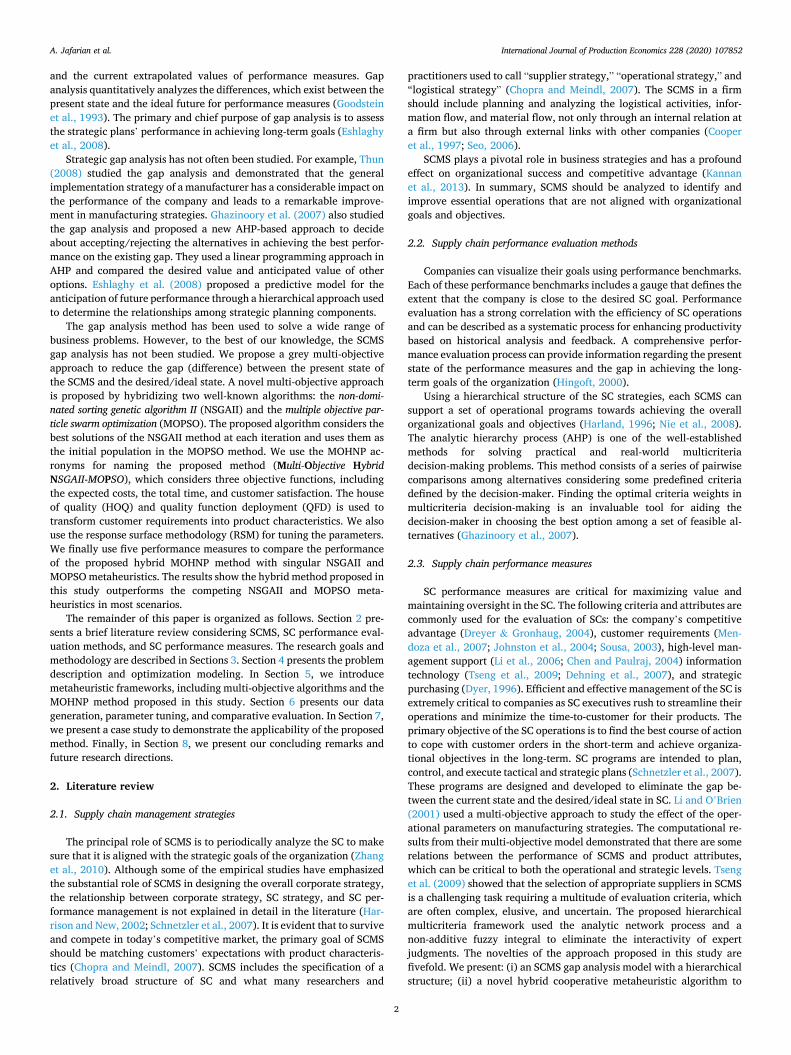
The main purpose of this study is to provide a practical approach for improving the operational programs by simultaneously minimizing re-sources (cost and time) and maximizing customer satisfaction. In this regard, the conceptual and structural framework presented in Fig. 1 is proposed for the SC gap analysis under uncertainty.
As shown in Fig. 1, gap analysis is performed to measure the gap between the current state and the desired/ideal state. First, we analyze
the current state and formulate the desired/ideal state of the operations. We then measure the distance between the current state and the desired/ ideal state to determine the amount of gap. We use the AHP to calculate the operational and strategical weights and then select the best combi-nation of the operational programs for improving the strategic position through a grey multi-objective model. We also consider the relative weight of the customers’ needs and requirements. The QFD method is used next to find the impact of the operational programs on customers’ needs and requirements. The proposed multi-objective model is used to find the amount of operational program improvement needed to mini-mize the total costs and the total time while maximizing customer satisfaction.
4. Problem description and optimization modeling
In this section, a grey multi-objective mathematical model is pro-posed to improve the SCMS gap. Let us use the mathematical notations
Fig. 1. Proposed/conceptual frameworks.
A. Jafarian et al.

International Journal of Production Economics 228 (2020) 107852
5
and parameters presented in Appendix A and consider a company with a hierarchical SC strategy CSCMS ¼ ðI;JÞ. Fig. 2 illustrates the hierarchical structure of the SCMS concerning the strategic plans ðSPiÞ; i ¼ f1;2:::; Igand operational programs ðOPjÞ;j ¼ f1;2:::;Jg. It is assumed that each of these operational programs belongs to one predefined strategy plan, and each strategy plan has at least one operational program. We find the relative importance of each element (i.e., weights) for each specific level. The weights can be determined through a direct approach or using a weight elicitation method (Eshlaghy et al., 2008). We use the grey AHP method to calculate the weights of SCMS in the goal ðωsiÞ by considering the criteria such as emphasizing competitive advantage, focusing on customer needs, strategic purchasing, top management support, and information technology. The weight of each OPj is then calculated as ωij ¼ ωsi � ωoj, where ωoj is the importance of each operational pro-gram in the related strategic plan. Each operational program has an index ðξijÞ that represents the current state of OPj; and the current state of the SCM strategy ðϕÞ is estimated as ϕ ¼
PJj¼1PI
i¼1ωij � ξij. The gap (G) between ϕ and η can be found by considering a pre-determined goal ðηÞ. Improving the operational programs at the operational level should result in improvements in the SCMS and consequently reducing or eliminating the gap.
The total time needed to perform that improvement is a summation of all the required times for the operational programs’ improvement (assuming serial requirements). As mentioned in Section 1, the purpose of this model is to determine the improvements needed in the opera-tional programs to decrease the gap:
4.1. Objective functions
OBJ1 : Min CðI; JÞ¼XJ
j¼1
XI
i¼1CijXij (7)
OBJ2 : Min TðI; JÞ¼XJ
j¼1
XI
i¼1tijXij (8)
OBJ3 : Max CS
I; J
!
¼XI
i¼1
XJ
j¼1
XK
k¼1�ωk ��Rkjþ
XI
i¼1
�XJ
j0 6¼j
�Tjj0 �
XK
k¼1�ωk � �Rkj0
!!
�Xij
!
(9)
Constraints:
1�Xij � MaxImpij 8i 2 f1; ::; Ig; j 2 f1; ::; Jg (10)
XJ
j¼1
XI
i¼1tijXij � τ (11)
XJ
j¼1
XI
i¼1�ωij ��ξij �
�Xij�� � G (12)
�ωij ¼ �ωsi ��ωoj 8i 2 f1; ::; Ig; j 2 f1; ::; Jg (13)
�G ¼ �η � �ϕ (14)
Xij 2R 8i 2 f1; ::; Ig; j 2 f1; ::; Jg (15)
ωsi; ωoj; ωk; ωij; G; ϕ; η; ξij are Grey numbers (16)
I
IJ
IJ
IJ
Fig. 2. The hierarchical structure of SCMS for an organization.
Fig. 3. The structure of the proposed HOQ.
A. Jafarian et al.
International Journal of Production Economics 228 (2020) 107852
6
We consider three objective functions (OBJ1, OBJ2, and OBJ3). OBJ1 (or Eq. (7)) minimizes the expected total cost for improvement of the existing gap, OBJ2 (or Eq. (8)) minimizes the total required time for the improvement, and OBJ3 (or Eq. (9)) maximizes customer satisfac-tion. To obtain the OBJ3’s value, the HOQ is employed to consider the customer’s expectations of the operational program’s importance. In this context, this objective function can canalize the improvement to reach the desired customer satisfaction. The HOQ is used here to convert the customer requirements (“what’s”) into suitable product character-istics “how’s” (Bottani, 2009; Tan et al., 1999).
The HOQ translates the customer’s requirement ðCRk; k¼ 1; 2; :::;KÞto operational programs ðOPjÞ, as shown in Fig. 3. By assigning proper weights ðωkÞ, a suitable ranking CRk is achievable. Rkj is the relationship matrix in HOQ. This matrix is defined as a matrix whose generic entry ðk;jÞ calculates the efficiency of the kth customer requirement, which can be satisfied by the jth operational program. Based on the original QFD, there are some graphical signs which show the relationship’s level (strong, medium, and weak, which can be translated with the two rating scales of 1-3-9 or 1-5-9) (Bouchereau and Rowlands, 2000). In this study, we translated graphical symbols into grey numbers, as shown in Table 1. After the calculation of the relationship between OPj and CRk, the relative importance of the jth operational program ðRIjÞ can be calculated as a grey-weighted average using Eq. (17):
RIj ¼XK
k¼1�ωk ��Rkj ; j ¼ 1; 2; :::; J (17)
Then, the “roof” of correlations demonstrates the correlation between the two operational programs jth and j0th called � Tjj’ . This is assumed as the progressive change of attaining level jth “how” when the attainment level of the j0th one is increased unitary (Bottani, 2009). In this study, graphical symbols with a five-level rating system are used to show the correlations, as illustrated in Table 2. Indeed, another analytical approach (Tang and YK, 2002) is employed to reflect the correlations in the computations of the final rankings of “hows.” After calculating all formulations, the final score of the jth operational program (Scorej and is the value of OBJ3) is computed as follows:
Scorej¼RIj þXJ
j0 6¼j
�Tjj0 � RIj0 ; RIj0 ¼XK
k¼1�ωk ��Rkj0 j; j’
¼ 1; 2; :::; J(18a)
In summary, OBJ3 can maximize CS, resulting in improving OPj, and ultimately improving Scorej. Eq. (10) ensures that the improvement ðXijÞ
is greater than 1 and no greater than the maximum improvement ðMaxImpijÞ: Eq. (11) ensures the sum of the total improvement times is not greater than a predefined value ðτÞ. Eq. (12) guarantees that the
SCMS state is greater than G (after the improvement), and Eqs. (13) and (14) describe how the operational programs’ grey weight and the existing gap are calculated.
5. Metaheuristic framework
In this section, we present the definition of Pareto optimality and describe the multiobjective algorithms proposed in this study. Let us consider x as a vector that has p decision variables. Augusto et al. (2006) show that an optimization problem, with N objective functions, can be formulated as:
Min/max f!ð x!Þ ¼ ½f1ð x!Þ; f2ð x!Þ; ::: ; fNð x!Þ�T
S.t.
glð x!Þ � 0; l ¼ 1; 2; :::;Lgqð x!Þ � 0; q ¼ 1; 2; :::;Q (19a)
As we mentioned earlier, x is an p-dimensional vector ð x!2 RpÞ, each x in this vector can be filled by a Boolean-value, an integer-value, or a real-value. Furthermore, there is no particular case for the objective functions fn : Rn→R ðn¼ 1; 2; : : :;NÞ and the constraints glðl¼ 1;2; : : : ; LÞ and gqðq ¼ 1;2; : : : ; QÞ. Consequently, they can be linear or non-linear functions.
There are several different solution approaches to tackle this prob-lem. One of the most popular methods is converting the objectives into a single composite goal. An utility function or transformation function should be defined based on the decision-makers’ preferences to apply this (Deb, 2001). Among all suggested methods, one of the simplest ones is assuming that preferences among the objective functions are inde-pendent of each other, and an additive utility function can be used. Alternatively, the Pareto optimum is based on the concept of non-dominance and can be employed instead of converting the multi-objective problem into a single objective one.
To briefly elaborate on the concept of domination, let us consider y ¼ðy1; y2;…; ypÞ as a vector, which includes p decision variables. Suppose that our problem is a maximization problem. In this case, solution x dominates solution y if and only if:
fnðxÞ� fnðyÞ 8n; and fnðxÞ> fnðyÞ for at least one n 2 f1; 2;…;Ng(20a)
x! is a non-dominated solution in a p-dimensional set X, if in X there isn’t any other y! 6¼ x! such that. fð y!Þ � fð x!Þ:
Accordingly, a set of all non-dominated solutions is formed, which called the Pareto frontier or Pareto optimal for the multi-objective optimization problem. In general, more choices are provided to a decision-maker with the Pareto frontier. In addition, when there is a sharp conflict among the objective functions, one can expect to find more Pareto optimal solutions, which may not be appropriate from the decision-makers’ perspective. Li et al. (2009) proposed a two-stage approach to provide a rational set of solutions for decision-makers.
5.1. Multi-objective algorithms
Multi-objective optimization represents an important class of opti-mization techniques, which can be applied directly to solve a large number of practical and real-world problems (Ding et al., 2017; Ruiz et al., 2018; Defryn and S€orensen, 2018). Many metaheuristic-based multi-objective methods have been proposed and employed by re-searchers in recent years such as NSGA (Srinivas and Deb, 1994), NSGAII (Deb et al., 2002), NPGA (Horn et al., 1994), SPEAII (Zitzler et al., 2002), SPEA (Zitzler and Thiele, 1998), MOMS-GA (Taboada et al., 2008) and MOPSO (Coello Coello and Lechuga, 2002). In this paper, a hybrid co-evolutionary multi-objective algorithm (called MOHNP) is proposed to solve the problem described here. This algo-rithm is designed by combining NSGAII and MOPSO. Furthermore, the
Table 1 Graphic symbols, relationships, and corresponding grey numbers.
Degree of correlation Graphic symbol Grey number
Strong (S) ● [0.7; 1] Medium (M) ○ [0.3; 0.7] Weak (W) ▴ [0; 0.3]
Table 2 Correlations, graphic symbols, and corresponding grey numbers.
Degree of correlation Graphic symbol Grey number
Strong positive (SP) ● [0.5; 0.7] Positive (P) ○ [0; 0.5] Not exist correlation (� ) – [0; 0] Negative (N) □ [-0.5; 0] Strong negative (SN) ■ [-0.7; � 0.5]
A. Jafarian et al.

International Journal of Production Economics 228 (2020) 107852
7
performance of the MOHNP method is evaluated and compared with the performance of singular NSGAII and MOPSO methods. The MOHNP method is used to solve the problem formulated in this study and find the best set of the operational program improvements for minimizing the total costs and the total time, while maximizing customer satisfaction. In the following section, we will describe the MOHNP method.
5.1.1. MOHNP Hybrid algorithms are often developed to find the best trade-off
between diversification and local intensification during the search in the solution space (Behnamian et al., 2009). MOPSO is a population-based meta-heuristic that keeps the best-discovered solu-tions in an external memory called the repository to find a good solution in large-scale optimization problems. MOPSO provides a considerable diversity among Pareto optimal solutions and substantially decreases the risk of falling into a local optimum (Coello Coello and Lechuga, 2002). On the other hand, NSGAII is a multi-objective evolutionary al-gorithm grounded in the genetic algorithm (GA) that utilizes GA features like selection operators, crossover, and mutation to find the best solu-tions considering a fitness function (i.e., objective function) and spread (Deb et al., 2000). The primary goal of our algorithm is to capitalize on the strengths of MOPSO and MSGAII to overcome their shortfalls and weaknesses (Tavana et al., 2016). Another reason for considering these two algorithms is that MOPSO is perceived as a practical algorithm for continuous solution space, and NSGAII is used widely for solving discrete optimization problems. The objective is to take advantage of two strong algorithms and improve the capabilities in the search process and efficiency (Govindan et al., 2015).
GA starts with creating a predefined number of solutions as an initial population. It is quite common for it to capture several Pareto-optimal solutions even after just a few iterations, which makes it a potent tool for multi-objective optimization. An elitist meta heuristic-based multi- objective algorithm known as NSGAII, proposed by Deb et al. (2002), is one of the widely used and popular algorithms among researchers. The NSGAII is configured based on the concept of the Pareto front. NSGAII employs a ranking procedure at each iteration to find different Pareto fronts. Another notable feature of NSGAII is an operator called the crowding distance, which oversees diversification. For a detailed description of the NSGAII algorithm, the readers can refer to Deb (2001) and Deb et al. (2002). A brief description of NSGAII, which is considered the main loop of our proposed algorithm (i.e., MOHNP), is presented in Appendix B.1.
a. Encoding scheme and initialization: The encoding scheme is considered the same in all three algorithms. In this regard, as illustrated in Fig. 4, the solution is a matrix with the size of all operational programs ðP0Þ,
and its values are generated in a range between 1 and ðMaxImpijÞ for each OPij. Also, for the initialization process, the initial population of P0 is generated as an array of size nPop� P0, which contains N (population size) members, each of which is a vector with length. P0:
b. Evaluate objective functions: the fitness values of the objective func-tions (OBJ1, OBJ2, and OBJ3) are calculated for everyone.
c. Non-dominated sorting: In this part of the algorithm, NSGAII sorts the entire population into the fronts that are based on the non- domination concept and assign a rank to each solution of the popu-lation. After completing the non-dominated sorting, it calculates the crowding distance for each individual at each rank (Deb et al., 2002). Consequently, each individual has it’s rank and crowding distance value. The NSGAII will use these values in the following procedures to decide about the next generations (or iterations). The calculation of the crowding distance for everyone is demonstrated in Appendix B.2.
d. Tournament selection: After sorting the individuals, the crowded- comparison-operator (CCO) plays the selection role among current solutions. The CCO carries out the selection process to help the al-gorithm find uniform Pareto optimal solutions. When there are two solutions, belonging to different ranks, the solution with a lower (better) rank is preferred. In case that both two solutions belong to the same rank, the algorithm will prefer the solution that is located in the lower crowded area. The algorithm uses the binary tournament selection with CCO until the size of the mating pool (P) is taken to fill the mating pool at each iteration.
e. Crossover and mutation: the crossover operation is used for trans-mitting the offsprings by sharing the information among selected chromosomes (i.e., Parents). The ratio of the population, which is required to do the crossover, can be shown by pc. Another important procedure in this algorithm is the mutation procedure, which is carried out to ensure the diversity of the discovered solution at a reasonable level, and decreasing the probability of sticking to a local optimum trap (Rabiee et al., 2012). A mutation is carried out on a percent of the population (pm). The crossover and mutation operators are considered as follows:
i. Crossover: We used the uniform crossover as a crossover operator. Two chromosomes are chosen to construct a new child by this operator, and then a new uniform random variable with a lower-bound of zero and an upper-bound of one with the size of the chromosome is created. Child 1 is created by the summation of two parts: (1) the product of Chro-mosome 1 and the uniform random variable, and (2) the product of Chromosome 2 and another row matrix, where all elements are calcu-lated by (1-uniform random variable). For the second child, the process is reversed (see Fig. 5). (As an example, the first operational program of
Fig. 4. The solution representation for a problem with three strategy plans (SPi) and six operational programs (OPj).
A. Jafarian et al.

International Journal of Production Economics 228 (2020) 107852
8
Child 1 is calculated as 1:86� 0:26þ 1:98� ð1 � 0:26Þ|fflfflfflfflfflfflffl{zfflfflfflfflfflfflffl}
0:74
¼ 1:95 and the
first operational program of Child 2 is calculated as 1:86� ð1 � 0:26Þ|fflfflfflfflfflfflffl{zfflfflfflfflfflfflffl}
0:74
þ
1:98� 0:26 ¼ 1:89). ii. Mutation: One chromosome is selected randomly to start the
mutation process. Then, two positions of the chromosome (1.45 and 1.34) are selected randomly (as shown in Fig. 5, 1.45). We consider three different mutation policies, which are swap, reversion, and insertion. One of the three policies should be chosen for performing mutation. In swap mutation, the position of the two elected positions is changed as the chromosome f1:86;1:45;1:23;2:3; 1:34;1:19g will change to f1:86;1:23;1:23;2:3; 1:45;1:19g by the swap operator. In reversion mutation, after picking two positions, all the positions placed between them are swapped. For example, the first chromosome will change f1:86;1:45;2:3; 1:23;1:34;1:19g by the reversion operator. In insertion, after electing two positions randomly, the second value is embedded in the first position and the first value with the values placed between them, are moved from one position to the right. As illustrated in Fig. 6, the selected chromosome will change to f1:86;1:45;1:34;2:3; 1:23;1:19gby the insertion operator.
After the crossover and mutation operations, we will have P2 (a new population, which is generated by crossover) and P3 (a new population,
which is produced by mutation). We assume that the summation of mutation and crossover probabilities is equal to one. Therefore, the summation of the number of solutions P2 and P3 is the same as in P, which is nPop: In other words, we now have 2� nPop solutions. In this stage, the algorithm applies the non-dominated sorting (ranking) to find the Pareto front and employs the crowding distance operator for its diversification (Deb et al., 2000). After completing the computations of the non-dominated sorting and crowding distance operator, the next generation (iteration) members ðPtþ1Þ are selected. The selection process is as follows: first, based on their rank and if there is not enough position for all members of specific rank to move to the next generation, then, the metaheuristic algorithm selects members exclusively based on their crowding distance and the solutions, which are located in fewer popu-lated areas. This process is terminated when the stopping criteria are met.
5.1.2. Local search The NSGAII is the base of our proposed MOHNP method, and we use
the MOPSO to improve the performance of the algorithm as a local search. The PSO was introduced by Eberhart and Kennedy (1995). This population-based meta-heuristic algorithm was inspired by the social behavior of fish schooling or bird flocking (Lian, 2010). The PSO has been used by many scholars to solve different real-world problems (Engelbrecht, 2005; Kuo and Lin, 2010; Mousavi et al., 2016; Srivastav and Agrawal, 2016; Brasileiro et al. 2017).
In PSO, a predefined number of particles (i.e., solutions) are formed in a way that each of them includes a decision variable vector (as a chromosome in GA) ( x! ¼ ½x1; x2; :::; xn�
T) representing the vector of position for each particle in the solution space. Besides the position vector, the velocity vector ( v! ¼ ½v1; v2; :::; vn�
T) is introduced to dem-onstrates the velocity of each particle. At the beginning of each iteration, the new velocity vector v! and new position vector x! are updated based on the following equations for each particle:
vmþ1��!¼ω� vm
�!þφ1� r1�ðpib � xm�!Þþφ2� r2 �
�pgb � xm
�!� (18b)
xmþ1��!¼ xm
�!þ vmþ1��! (19b)
vmin��!� vmþ1
��! � vmax��! (20b)
Fig. 5. Uniform crossover.
Fig. 6. Swap, reversion, and insertion mutations.
A. Jafarian et al.

International Journal of Production Economics 228 (2020) 107852
9
xmin��!� xmþ1
��! � xmax��! (21)
where v!m demonstrates the velocity vector of the mth particle. Another explanation for the v!m can be the distance that the mth particle should travel from its current position to its new position. x!m represents the current position vector of the mth particle pib, which is called the individual-best vector, is the position vector of the best solution that is discovered by the ith particle. pgb is considered as the leader or the global best solution among all particles thus far. ω is a multiplier used for balancing global exploration and local exploitation. In other words, by assigning a larger value for ω, we are considering the impact of local exploitation more than global exploration. Furthermore, φ1 and φ2 are considered the weights of the stochastic acceleration used to pull the current solution towards the best solutions (pib and pgb positions). r1 and r2 are considered to be the “error term” which are produced by the uniform distribution function in a range between zero and 1 (i.e., Uð0; 1Þ). In our proposed algorithm, we set the parameters ω; φ1; and φ2 with 0.9, 2, and 2, respectively, as suggested by Tseng et al. (2009).
Next, a grid-based system is used to select the leader among all particles by dividing the solution space into hypercubes (Moslemi and Zandieh, 2011). This step of MOPSO is inspired by the “external file” concept used in the Pareto archived evolution strategy algorithm (Coello
Coello and Lechuga, 2002). Finally, the algorithm needs to update the grids at each iteration based on the current solutions. It also requires eliminating some of the solutions to meet the allowable size of the leaders set. The algorithm will continue these processes after reaching a fixed number of iterations ðmax iterÞ: The pseudo-code of the MOPSO algorithm in the MOHNP method is presented in Appendix B.3. The procedure for the MOHNP algorithm proposed in this study is provided in Fig. 7.
6. Computational results
This section describes the data generation procedure and comparison of the proposed MOHNP with the competing NSGAII and MOPSO al-gorithms used to solve the SCMS gap improvement problem. This analysis has been performed based on some multi-objective performance measures that are calculated for the sets of Pareto solutions obtained by each algorithm. These algorithms are developed in MATLAB 2014b and run on three parallel PCs with 2.4 GHz and 4 GB of RAM.
6.1. Data generation
In this section, we describe our computational experiments and
Fig. 7. The MOHNP algorithm.
Table 3 Parameters and their levels.
Factors Levels
Number of strategy plans (SPi) and operational programs (OPij)
(SPi, OPij)
Scale 1, (2,8), (3,10), (3,12), (4,15) Scale 2, (4,18), (4,21), (5,23), (5,26) Scale 3, (5,28), (6,30), (6,32), (7,34)
Strategy plans weights (ωsi) Operational programs weights (ωoj) Customer requirement importance (ωk) Present status of the operational index (ξij)
U (1,7) average of 10 times (as experts)
Goal (G) U (4,7) Need time for improving operation programs (tij) U (1,8) Maximum improvement in operational programs (Maximpij) U (1.7,2.3) Operational program improvement cost (Cij) U (2,10) Ultimatum time (τ) 0.7Xsum (tij) The relative importance of the jth operational programs with kth customer’s requirements (�Rkj) U (1,3)
according to Table 1 average of 10 times (as experts)
Correlations between operational programs jth and j’th(�Tij’) U (1,5); according to Table 2 average of 10 times (as experts)
A. Jafarian et al.

International Journal of Production Economics 228 (2020) 107852
10
define how we generated these examples. The numerical experiments that have been used in this study consist of operational and strategic programs with their weights, the upper-bound for operational program (OP) improvement, the time needed to improve each OP, the total improvement time, the warning time along with the present and desired/ideal states for each OP. The numerical test examples generated for comparison among the algorithms are demonstrated in Table 3. By considering the size of SCMS and its operational components, the pro-grams are categorized into three classes of small, medium, and large problems. For each set, four problems are generated randomly (i.e., in total, there are twelve test problems). ωsj and ωoi are the weights of operational programs for the jth operational program and the ith strategic program, respectively. We define ξij as the present state of the jth oper-ation of the ith strategic program by linguistic variables with grey numbers in a seven-scale system [1,7] with a uniform distribution function. The uniform distribution function used is composed of very low (VL) ¼ [0.0, 0.1], low (VL) ¼ [0.1, 0.3], medium-low (ML) ¼ [0.3, 0.4], medium (M) ¼ [0.4, 0.5], medium-high (MH) ¼ [0.5, 0.6], high (H) ¼ [0.6, 0.9] and very high (VH) ¼ [0.9, 1.0] (G. D. Li et al., 2007).
6.2. Parameter tuning
Finding the near-optimal tuning for the input parameters of each metaheuristic algorithm has a substantial role in the improvement of the results (Behnamian et al., 2009). In connection with this point, a well-known tuning method, which is the RSM, is employed. This method has been applied to a variety of real-world and industrial setting’s parameters.
Box and Wilson (1951) proposed RSM, which is a statistical method with the ability to explore the relationship between dependent variables and one or more independent (or response) variables. The idea behind the RSM is using a sequence of designed experiments and finding the best value for the problem (Myers et al., 1971, 2009). Let us consider the response surface y ¼ fðx1; x2; …; xkÞ, where xi are the independent continuous variables that can be controlled by experiments. K is regar-ded as the number of variables, and y is an objective function (or functions) to be optimized. In this paper, y is predicted by the response surface function proposed by Neter et al. (1996) which presented in polynomial form as:
y¼ β0 þXk
j¼1βjxj þ
XX
i<jβijxixj þ
Xk
j¼1βjjx
2j þ ε (22)
where y is the dependent (response) variable to be predicted, βo is considered a constant value, and βj is regarded as a linear coefficient. βij
and βjj are a cross-product coefficient and squared coefficient, respectively.
To start the RSM, the lower-bound and upper-bound for each inde-pendent variable should be defined. The number of experiments for a function with k factors is equal to nf þ nCp þ nax (or sometimes a frac-tion of it), where nf is the number of face-centered points (which is equal to 2kÞ; nCp is the number of central points (which is equal to 2kÞ, and nax
is the number of axial points. As can be seen in Table 4, the lower- and upper-bound for each independent variable is considered. For a fair comparison among the proposed algorithms, the number of non- dominated solutions was set to be 50 (i.e., nPop in MOHNP and NSGAII and nRep in MOPSO).
The formulation used for converting the un-coded value to a coded value is:
xi¼Xi �
� �Xupper þ XLower
��2�
�Xupper � XLower
��2
(23)
where Xi is considered as the un-coded value of the ith independent variable and xi is regarded as the coded value. There are some perfor-mance metrics for comparison among the multi-objective algorithms. Some performance metrics are employed to compare the Pareto solu-tions that are obtained by each algorithm in terms of different points of view because some of these objectives conflict with each other. In this study, the following five performance metrics are used:
a. Diversification metric (DM): is used to evaluate the diversity of Pareto solutions obtained by each algorithm. The higher the value of DM is the better among algorithms (Hyun et al., 1998). The formulation for the calculation DM is as follows:
DM¼ffiffiffiffiffiffiffiffiffiffiffiffiffiffiffiffiffiffiffiffiffiffiffiffiffiffiffiffiffiffiffiffiffiffiffiffiffiffiffiffiffiffiffiffiffiffiffiffiffiffiffiffiffiffiffiffiffiffiffiffiffiffiffiffiffiffiffiffiffiffiffiffiffiffiffiffiffiffiffiffiffiffiffiffiffiffiffiffiffiffiffiffiffiffiffiffiffiffiffiffiffiffiffiffiffiffiffiffiffiffiffiffiffiffiffiffiffiffi
ðmaxf1i � minf1iÞ2þ ðmaxf2i � minf2iÞ
2þ ðmaxf3i � minf3iÞ
2q
(24)
b. Mean ideal distance (MID): is used to evaluate the closeness to the desired/ideal state. MID is calculated by Eq. (25), and the lower MID is better since it is closer to the optimal solution (Li, 2003).
MID¼
Pn
i¼1ci
n(25)
where ci ¼
ffiffiffiffiffiffiffiffiffiffiffiffiffiffiffiffiffiffiffiffiffiffiffiffiffiffiffi
f21i þ f2
2i þ f23i
q
and n is considered the number of Pareto solutions.
c. Quality metric (QM): The non-dominated solutions obtained from all algorithms are combined to create a population and calculate QM. The next step is to find the new Pareto set with these solutions and eliminate the dominated ones. Finally, the percentage of the obtained non-dominated solutions contributed by each algorithm is calculated, where a higher value of this metric is desired (Govindan et al., 2015).
d. Data envelopment analysis (DEA): We combine the Pareto solutions
Table 4 Algorithms’ parameter levels with the number of experiments.
A. Jafarian et al.

International Journal of Production Economics 228 (2020) 107852
11
of all the algorithms to calculate the effectiveness of the non-dominated solutions using a particular case of the DEA model proposed by Amin (2009). The algorithm with a higher efficiency score outperforms the lower ones. The linear programming model for this metric is illustrated in Appendix B.4.
E. Hypervolume metric (HM): is used to measure diversity and convergence. It reflects the closeness of the approximation set (or the
first rank of the Pareto set F1) to the true Pareto front ðPFÞ: In other words, it calculates the volume of the dominated portion of the objective space (Brockhoff and Zitzler, 2007).
As we mentioned before, a tuning process is defined due to the sensitiveness of our proposed algorithms to input parameters. Because this problem is not a single objective problem, the utility function pro-posed by Derringer and Suich (1980) in Eq. (26), is used to consider all five performance measures and find the near-optimal values for our proposed algorithms.
diðYiÞ¼
�Hi � Yi
Hi � Li
�S
Li �Yi � Hi (26)
where, Yi is the value of the specific performance measure for a pre-defined experiment. This value is converted to the utility function diðYiÞ. Hi and Li are the upper-bound and lower-bound of that particular metric, which is the maximum and minimum value of that metric among all designed experiments. In this function, S is considered as a severity value of that metric. The desirability shape is dependent on this value, and these severities are used to emphasize the high or the low impact of these five performance measures.
A larger value of S implies less emphasis on the goal. Parameters S for
Table 5 Tuned parameters’ values, R-squared (R2), and Desirability (D).
Algorithm Tuned parameters
R2
DM R2
MID R2
QM R2
DEA R2
HM D
NSGAII MaxIt ¼ 472, Pc
¼ 0.792, Pm ¼
0.386
64% 73% 74% 76% 66% 0.743
MOPSO MaxIt ¼ 592, nPop ¼ 110, nGrid ¼ 12
61% 68% 66% 71% 62% 0.692
MOHNP MaxIt ¼ 292, Pc
¼ 0.682, Pm ¼
0.364, MaxItp¼40, nGrid¼8
68% 58% 64% 69% 56% 0.637
Fig. 8. The most important interactions.
A. Jafarian et al.

International Journal of Production Economics 228 (2020) 107852
12
Tabl
e 6
Resu
lts o
f the
pro
pose
d al
gori
thm
s in
all
the
met
rics
.
P.i (
I,J)*
D
M
MID
Q
M
DEA
H
M
MO
PSO
N
SGA
II M
OH
NP
MO
PSO
N
SGA
II M
OH
NP
MO
PSO
N
SGA
II M
OH
NP
MO
PSO
N
SGA
II M
OH
NP
MO
PSO
N
SGA
II M
OH
NP
Smal
l P.
1 (3
,8)
1.56
7 1.
600
1.64
3 0.
956
0.98
7 0.
896
0.19
3 0.
302
0.50
5 0.
633
0.72
1 0.
820
3.25
0 3.
156
3.16
5 P.
2 (3
,10)
1.
602
1.63
5 1.
629
0.85
6 0.
841
0.82
5 0.
154
0.25
3 0.
593
0.58
6 0.
630
0.62
9 2.
990
2.86
0 2.
861
P.3
(4,1
2)
1.55
4 1.
628
1.61
1 1.
039
1.04
7 0.
949
0.11
7 0.
287
0.59
6 0.
552
0.75
2 0.
794
3.56
0 3.
211
3.22
7 P.
4 (4
,14)
1.
639
1.53
8 1.
674
1.17
6 1.
118
1.02
5 0.
089
0.30
8 0.
603
0.53
2 0.
776
0.77
5 3.
812
3.80
4 3.
484
Med
ium
P.
5 (5
,18)
1.
644
1.62
1 1.
640
1.02
9 1.
040
1.02
1 0.
133
0.35
2 0.
515
0.60
3 0.
679
0.79
1 3.
497
3.48
9 3.
472
P.6
(5,2
0)
1.58
5 1.
571
1.61
2 0.
956
0.80
4 0.
831
0.15
0 0.
210
0.64
0 0.
569
0.69
9 0.
714
3.80
3 3.
779
3.53
5 P.
7 (6
,22)
1.
506
1.62
1 1.
582
1.06
1 0.
902
0.92
9 0.
185
0.19
1 0.
624
0.65
7 0.
774
0.84
3 3.
030
3.25
1 2.
732
P.8
(6,2
4)
1.56
1 1.
620
1.59
8 0.
969
1.06
1 0.
902
0.20
0 0.
283
0.51
7 0.
508
0.77
5 0.
863
3.60
6 3.
295
3.06
6 La
rge
P.9
(7,2
8)
1.53
1 1.
623
1.69
0 1.
090
1.10
5 1.
016
0.22
3 0.
262
0.51
6 0.
679
0.71
2 0.
778
3.75
6 3.
706
3.45
4 P.
10 (
7,30
) 1.
575
1.54
6 1.
623
0.92
0 0.
993
0.83
5 0.
197
0.23
6 0.
567
0.69
4 0.
649
0.76
0 3.
127
3.37
7 2.
838
P.11
(8,
32)
1.60
8 1.
618
1.70
8 0.
955
1.00
6 0.
861
0.12
0 0.
284
0.59
7 0.
677
0.70
9 0.
811
3.41
9 3.
247
2.92
8 P.
12 (
8,34
) 1.
588
1.55
4 1.
632
0.89
5 0.
984
0.81
1 0.
219
0.29
2 0.
488
0.50
0 0.
655
0.72
2 3.
345
3.04
3 2.
759
Fig. 9. Spreading the Pareto solutions obtained by the proposed algorithms in three sizes.
A. Jafarian et al.

International Journal of Production Economics 228 (2020) 107852
13
DM, MID, QM, DEA, and HM are considered to be 1, 1, 2, 2, and 2, respectively (based on their importance). The desirability can be calculated as:
D¼ffiffiffiffiffiffiffiffiffiffiffiffiffiffiffiffiffiffiffiffiffiffiffiffiffiffiffiffiffiffiffiffiffiffiffiffiffiffiffiffiffiffiffiffiffiffiffiffiffiffiffiffiffiffiffiffiffiffiffiffid1ðy1Þ � d2ðy2Þ �…� dmðymÞ
mp
(27)
where m is considered the number of performance metrics. The near- optimal value for each parameter, desirability (D) and R-Squared (R2), are estimated as demonstrated in Table 5. Due to the complexity and importance of the interaction among algorithms’ parameters by considering the five performance metrics as an objective function, the Partial r-square ðhighest Pr� sÞ was calculated as illustrated in Fig. 8.
6.3. Comparative evaluation
This section presents the effectiveness of the proposed MOHNP al-gorithm compared to the competing NSGAII and MOPSO algorithms. In
this regard, the efficiency of the algorithms for each random problem is calculated in terms of DM, MID, QM, DEA, and HM, as presented in Table 6.
As shown in Table 6, the Pareto solutions obtained by the MOHNP algorithm performed better than the Pareto solutions obtained by the NSGAII and MOPSO algorithms. The higher performance of the MOHNP algorithm is more noticeable in the medium and large-sized problems, and for QM, MID, DEA, and HM. There is no priority between the MOHNP and NSGAII from the decision-makers’ perspective.
Fig. 9 illustrates the Pareto solutions, which are obtained by the al-gorithms on three scales. According to this figure, the effectiveness of the MOHNP algorithm in comparison with NSGAII and MOPSO algo-rithms increases when the complexity of problems (or size of problems) is increased from small to large.
Furthermore, a statistical comparison is performed to compare the three algorithms. This comparison is conducted for all problems and
Fig. 10. The proposed algorithms versus problem size in terms of five metrics.
A. Jafarian et al.
International Journal of Production Economics 228 (2020) 107852
14
each performance measure. The results are converted to a relative de-viation index (RDI) to remove the variation between performance met-rics. The RDI is the variability of a data set expressed as a value between zero and one, and is calculated based on the following formulation:
RDIþ ¼jALgsol � Minsolj
Maxsol � Minsol; RDI� ¼
jMaxsol � ALgsolj
Maxsol � Minsol(28)
RDIþ is used when a higher value of the metrics is desirable and RDI� is used when a lower value of the metrics is desirable. In this formula, ALgsol is the value of an objective function provided by an algorithm for a specific problem. Therefore, this value is calculated for each algorithm on each objective function and each problem separately. In addition, Minsol and Maxsol are the minimum and maximum values of all non- dominated solutions for all algorithms and a particular objective func-tion, respectively. For example, if our problem has three objective functions, then for each problem, we must calculate Minsol and Maxsol three times (i.e., for each objective separately). In all cases, the higher value of RDI is desirable.
“One-way ANOVA on ranks” or the Kruskal-Wallis test is known as a non-parametric test, which can be used if the normality assumption of residuals is violated. The test answers the question if there are any sta-tistically significant differences in a response (dependent) variable with two or more independent variables. The results of this test on all the performance metrics confirm that there are at least two algorithms without any statistically significant difference for each specific metric (DM, H ¼ 11.32, P ¼ 0.011; MID, H ¼ 13.45, P ¼ 0.006; QM, H ¼ 23.22, P ¼ 0.000, DEA, H ¼ 22.12, P ¼ 0.000 and HM, H ¼ 24.08, P ¼ 0.000). As shown by the p-value, we reject the null hypothesis of equality for each metric for all the algorithms. Although the Kruskal-Wallis test re-jects this hypothesis for all the metrics, the difference level for DM and MID is lower than QM, DEA, and HM. In addition, Fig. 10 indicates that for all the metrics, i.e., DM, MID, QM, DEA, and HM, the MOHNP al-gorithm is significantly better than the NSGAII and MOPSO algorithms. Moreover, DM, MID, QM, DEA, and HM plots show that the effectiveness of the proposed MOHNP algorithm outperforms the NSGAII and MOPSO algorithms with increasing the dimension of the problems.
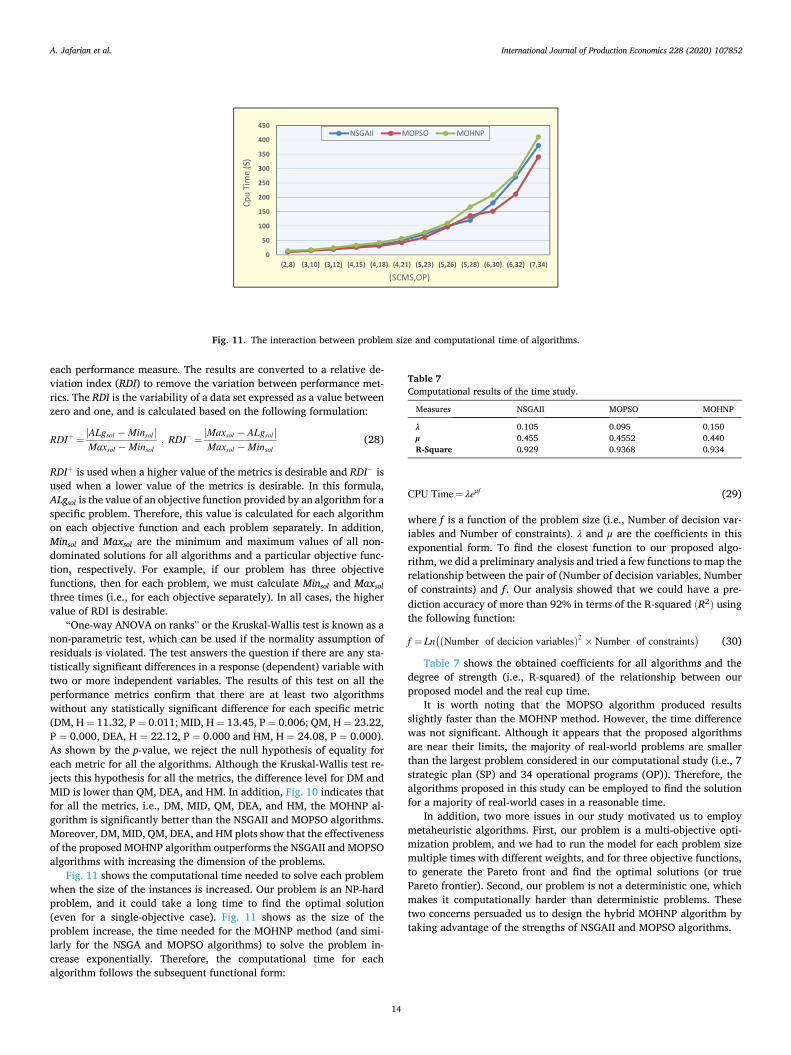
Fig. 11 shows the computational time needed to solve each problem when the size of the instances is increased. Our problem is an NP-hard problem, and it could take a long time to find the optimal solution (even for a single-objective case). Fig. 11 shows as the size of the problem increase, the time needed for the MOHNP method (and simi-larly for the NSGA and MOPSO algorithms) to solve the problem in-crease exponentially. Therefore, the computational time for each algorithm follows the subsequent functional form:
CPU Time¼ λeμf (29)
where f is a function of the problem size (i.e., Number of decision var-iables and Number of constraints). λ and μ are the coefficients in this exponential form. To find the closest function to our proposed algo-rithm, we did a preliminary analysis and tried a few functions to map the relationship between the pair of (Number of decision variables, Number of constraints) and f . Our analysis showed that we could have a pre-diction accuracy of more than 92% in terms of the R-squared ðR2Þ using the following function:
f ¼ Ln�ðNumber of decicion variablesÞ2 � Number of constraints
�(30)
Table 7 shows the obtained coefficients for all algorithms and the degree of strength (i.e., R-squared) of the relationship between our proposed model and the real cup time.
It is worth noting that the MOPSO algorithm produced results slightly faster than the MOHNP method. However, the time difference was not significant. Although it appears that the proposed algorithms are near their limits, the majority of real-world problems are smaller than the largest problem considered in our computational study (i.e., 7 strategic plan (SP) and 34 operational programs (OP)). Therefore, the algorithms proposed in this study can be employed to find the solution for a majority of real-world cases in a reasonable time.
In addition, two more issues in our study motivated us to employ metaheuristic algorithms. First, our problem is a multi-objective opti-mization problem, and we had to run the model for each problem size multiple times with different weights, and for three objective functions, to generate the Pareto front and find the optimal solutions (or true Pareto frontier). Second, our problem is not a deterministic one, which makes it computationally harder than deterministic problems. These two concerns persuaded us to design the hybrid MOHNP algorithm by taking advantage of the strengths of NSGAII and MOPSO algorithms.
Fig. 11. The interaction between problem size and computational time of algorithms.
Table 7 Computational results of the time study.
Measures NSGAII MOPSO MOHNP
λ 0.105 0.095 0.150 μ 0.455 0.4552 0.440 R-Square 0.929 0.9368 0.934
A. Jafarian et al.

International Journal of Production Economics 228 (2020) 107852
15
7. Case study
In this section, we present a case study at Intervan1 to demonstrate the applicability and exhibit the efficacy of the proposed integrated framework. Intervan is an automotive technology company, building electric sport utility vehicles and pickup trucks, in Detroit, Michigan. The company is currently working on electric vehicles and related products. Intervan has a large order for electric vehicles from a major e- commerce company. Intervan management needs to choose the best combination of operational programs to deliver this large order of electric vehicles that meet customer’s specifications in a short window of time and at a reasonable cost. The company used the proposed MOHNP algorithm for supply chain gap analysis.
Initially, the management team with eight seasoned managers and experts (subject-matter experts) conducted several meetings to study the gap in their supply chain. The team started by shortlisting ten strategic programs after reviewing all possible programs. They then prioritized these ten strategic programs and selected the five most important pro-grams contributing to the quality development of the purchased prod-ucts (SP1), developing the B2C marketing channel (SP2), manufacturing strategies (SP3), reducing the logistics costs in the shipping process (SP4), and developing knowledge management in the supply chain (SP5). Next, the management team formed several focus groups (one group for each strategic program) to examine the most effective pro-grams. Table 8 summarizes the selected operational programs for each strategic program. For example, as shown in Table 8, the team assigned three operational programs to address S1. After selecting the most suit-able operational programs, the management team defined the current strategic state of Intervan and formulated the ideal/desired state. Consequently, they were able to determine the strategic gap in achieving the desired/ideal state.
The team, with the assistance of two facilitators, then used the pro-posed MOHNP algorithm to find the best combination of operational programs needed to eliminate the strategic gap. They identified the management strategies (SPi) presented in Table 8. In addition, they formulated 24 operational programs to achieve the ideal SCMS
envisioned by the top management. The eight members of the man-agement team met is a series of group decision-making meetings to consider the importance of the operational and strategic programs through a series of pairwise comparisons. Table 8 presents the final weights of the operational and strategic programs for Intervan.
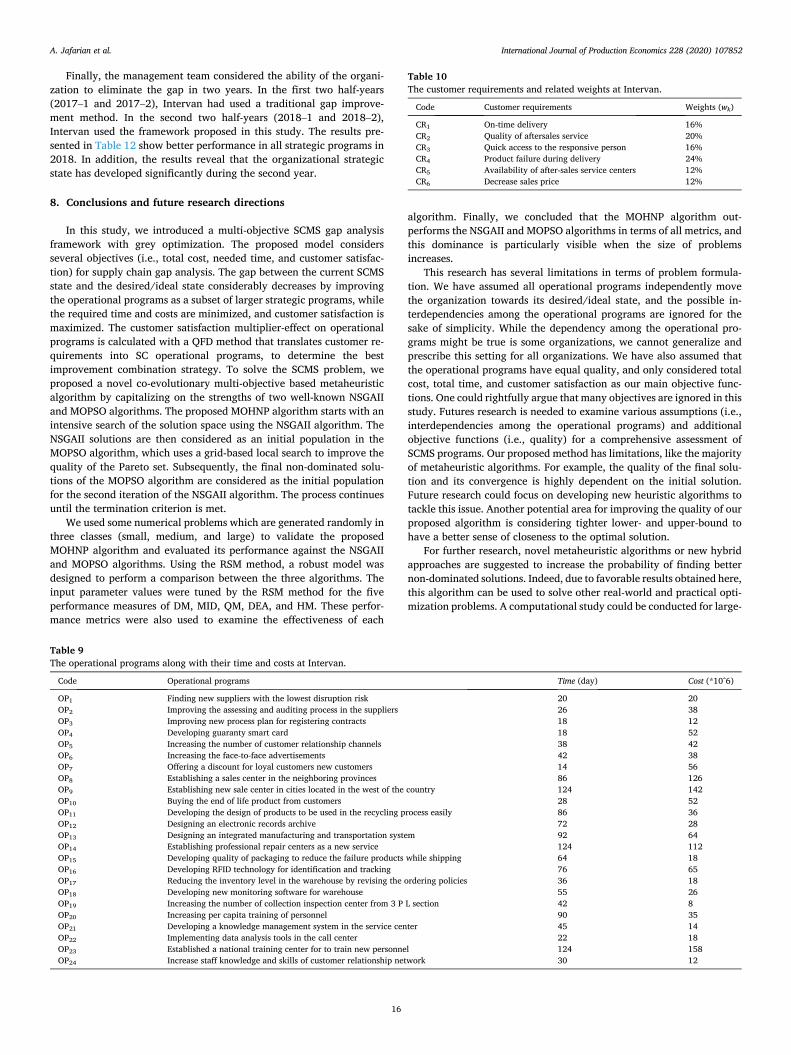
The team then collected the time and cost estimates for the opera-tional strategies. The information about the expected time and costs for the 24 operational strategies are presented in Table 9. The team also analyzed and synthesized historical information about customer re-quirements. With the help of the two facilitators, the team determined the customer requirements and their importance weights presented in Table 10.
The HOQ for Intervan is presented in Fig. 12. The HOQ matrix has two different parts: the main part that presents the relationship matrix and the top portion, the “roof” of the house, which presents the corre-lation matrix. In this case study, the relationship matrix indicates the relative importance of the operational programs according to customer requirements. To calculate the relative importance of the operational programs, the relationship level of the operational programs and customer requirements are analyzed by the management team, and the result is converted into grey numbers based on a proposed three-point linguistic scale. Furthermore, on the HOQ’s roof, the correlations for the operational programs are determined according to a five-point lin-guistic scale and then converted into their corresponding grey numbers. At last, the final score of the operational programs is calculated based on the relationship matrix and the correlation matrix.
As mentioned in Section 5, a Pareto-based multi-objective optimi-zation approach is used to tackle this problem. The Pareto front for Intervan is demonstrated from two different perspectives in Fig. 13. Fig. 13(a) shows the time-oriented and customer-oriented Pareto solu-tions, representing the optimal solutions if Intervan only cares about minimizing time or maximizing customer satisfaction, respectively. On the other hand, Fig. 13(b) shows the cost-oriented solutions, repre-senting the optimal solutions if Interval only cares about minimizing the totals costs.
Next, the approach proposed in this study is used to select one of the Pareto solutions as the optimal solution by considering 50%, 20%, and 30% weights for the OBJ1 (total cost), OBJ2 (total time), and OBJ3 (customer satisfaction), respectively. These objective functions weights are used to find the best solution presented in Table 11.
Table 8 The operational and strategic programs and weights at Intervan.
Code SCM Strategic programs ωsi Code Operational programs ωoj ωij
SP1 Developing the quality of purchased products 15% OP1 Finding new suppliers with the lowest disruption risk 35% 5.3% OP2 Improving the assessing and auditing process in the suppliers 45% 6.8% OP3 Improving new process plan for registering contracts 20% 3.0%
SP2 Developing B2C marketing channel 30% OP4 Developing guaranty smart card 5% 1.5% OP5 Increasing number of customer relationship channels 15% 4.5% OP6 Increasing face 2 face advertisements 10% 3.0% OP7 Offering a discount for loyal customers and new customers 30% 9.0% OP8 Establishing a sales center in the neighboring provinces 5% 1.5% OP9 Establishing new sale center in cities located in the west of the country 18% 5.4% OP10 Buying the end of life product from customers 17% 5.1%
SP3 Manufacturing strategies 20% OP11 Developing the design of products to be used in the recycling process easily 32% 6.4% OP12 Designing an electronic records archive 10% 2.0% OP13 Designing an integrated manufacturing and transportation system 20% 4.0% OP14 Establishing professional repair centers as a new service 38% 7.6%
SP4 Reduce logistic costs during the shipping process
25% OP15 Developing quality of packaging to reduce the failure products while shipping 20% 5.0% OP16 Developing RFID technology for identification and tracking 12% 3.0% OP17 Reducing the inventory level in the warehouse by revising the ordering policies 28% 7.0% OP18 Developing new monitoring software for warehouse 10% 2.5% OP19 Increasing the number of collection inspection center from Third-party logistics (3 P L)
section 30% 7.5%
SP5 Development of knowledge management in the SC
10% OP20 Increasing per capita training of personnel 18% 1.8% OP21 Developing a knowledge management system in the service center 12% 1.2% OP22 Implementing data analysis tools in the call center 38% 3.8% OP23 Established a national training center for to train new personnel 20% 2.0% OP24 Increase staff knowledge and skills of customer relationship network 12% 1.2%
1 The name of the company has been changed to protect the anonymity of this company.
A. Jafarian et al.
International Journal of Production Economics 228 (2020) 107852
16
Finally, the management team considered the ability of the organi-zation to eliminate the gap in two years. In the first two half-years (2017–1 and 2017–2), Intervan had used a traditional gap improve-ment method. In the second two half-years (2018–1 and 2018–2), Intervan used the framework proposed in this study. The results pre-sented in Table 12 show better performance in all strategic programs in 2018. In addition, the results reveal that the organizational strategic state has developed significantly during the second year.
8. Conclusions and future research directions
In this study, we introduced a multi-objective SCMS gap analysis framework with grey optimization. The proposed model considers several objectives (i.e., total cost, needed time, and customer satisfac-tion) for supply chain gap analysis. The gap between the current SCMS state and the desired/ideal state considerably decreases by improving the operational programs as a subset of larger strategic programs, while the required time and costs are minimized, and customer satisfaction is maximized. The customer satisfaction multiplier-effect on operational programs is calculated with a QFD method that translates customer re-quirements into SC operational programs, to determine the best improvement combination strategy. To solve the SCMS problem, we proposed a novel co-evolutionary multi-objective based metaheuristic algorithm by capitalizing on the strengths of two well-known NSGAII and MOPSO algorithms. The proposed MOHNP algorithm starts with an intensive search of the solution space using the NSGAII algorithm. The NSGAII solutions are then considered as an initial population in the MOPSO algorithm, which uses a grid-based local search to improve the quality of the Pareto set. Subsequently, the final non-dominated solu-tions of the MOPSO algorithm are considered as the initial population for the second iteration of the NSGAII algorithm. The process continues until the termination criterion is met.
We used some numerical problems which are generated randomly in three classes (small, medium, and large) to validate the proposed MOHNP algorithm and evaluated its performance against the NSGAII and MOPSO algorithms. Using the RSM method, a robust model was designed to perform a comparison between the three algorithms. The input parameter values were tuned by the RSM method for the five performance measures of DM, MID, QM, DEA, and HM. These perfor-mance metrics were also used to examine the effectiveness of each
algorithm. Finally, we concluded that the MOHNP algorithm out-performs the NSGAII and MOPSO algorithms in terms of all metrics, and this dominance is particularly visible when the size of problems increases.
This research has several limitations in terms of problem formula-tion. We have assumed all operational programs independently move the organization towards its desired/ideal state, and the possible in-terdependencies among the operational programs are ignored for the sake of simplicity. While the dependency among the operational pro-grams might be true is some organizations, we cannot generalize and prescribe this setting for all organizations. We have also assumed that the operational programs have equal quality, and only considered total cost, total time, and customer satisfaction as our main objective func-tions. One could rightfully argue that many objectives are ignored in this study. Futures research is needed to examine various assumptions (i.e., interdependencies among the operational programs) and additional objective functions (i.e., quality) for a comprehensive assessment of SCMS programs. Our proposed method has limitations, like the majority of metaheuristic algorithms. For example, the quality of the final solu-tion and its convergence is highly dependent on the initial solution. Future research could focus on developing new heuristic algorithms to tackle this issue. Another potential area for improving the quality of our proposed algorithm is considering tighter lower- and upper-bound to have a better sense of closeness to the optimal solution.
For further research, novel metaheuristic algorithms or new hybrid approaches are suggested to increase the probability of finding better non-dominated solutions. Indeed, due to favorable results obtained here, this algorithm can be used to solve other real-world and practical opti-mization problems. A computational study could be conducted for large-
Table 9 The operational programs along with their time and costs at Intervan.
Code Operational programs Time (day) Cost (*10^6)
OP1 Finding new suppliers with the lowest disruption risk 20 20 OP2 Improving the assessing and auditing process in the suppliers 26 38 OP3 Improving new process plan for registering contracts 18 12 OP4 Developing guaranty smart card 18 52 OP5 Increasing the number of customer relationship channels 38 42 OP6 Increasing the face-to-face advertisements 42 38 OP7 Offering a discount for loyal customers new customers 14 56 OP8 Establishing a sales center in the neighboring provinces 86 126 OP9 Establishing new sale center in cities located in the west of the country 124 142 OP10 Buying the end of life product from customers 28 52 OP11 Developing the design of products to be used in the recycling process easily 86 36 OP12 Designing an electronic records archive 72 28 OP13 Designing an integrated manufacturing and transportation system 92 64 OP14 Establishing professional repair centers as a new service 124 112 OP15 Developing quality of packaging to reduce the failure products while shipping 64 18 OP16 Developing RFID technology for identification and tracking 76 65 OP17 Reducing the inventory level in the warehouse by revising the ordering policies 36 18 OP18 Developing new monitoring software for warehouse 55 26 OP19 Increasing the number of collection inspection center from 3 P L section 42 8 OP20 Increasing per capita training of personnel 90 35 OP21 Developing a knowledge management system in the service center 45 14 OP22 Implementing data analysis tools in the call center 22 18 OP23 Established a national training center for to train new personnel 124 158 OP24 Increase staff knowledge and skills of customer relationship network 30 12
Table 10 The customer requirements and related weights at Intervan.
Code Customer requirements Weights (wk)
CR1 On-time delivery 16% CR2 Quality of aftersales service 20% CR3 Quick access to the responsive person 16% CR4 Product failure during delivery 24% CR5 Availability of after-sales service centers 12% CR6 Decrease sales price 12%
A. Jafarian et al.
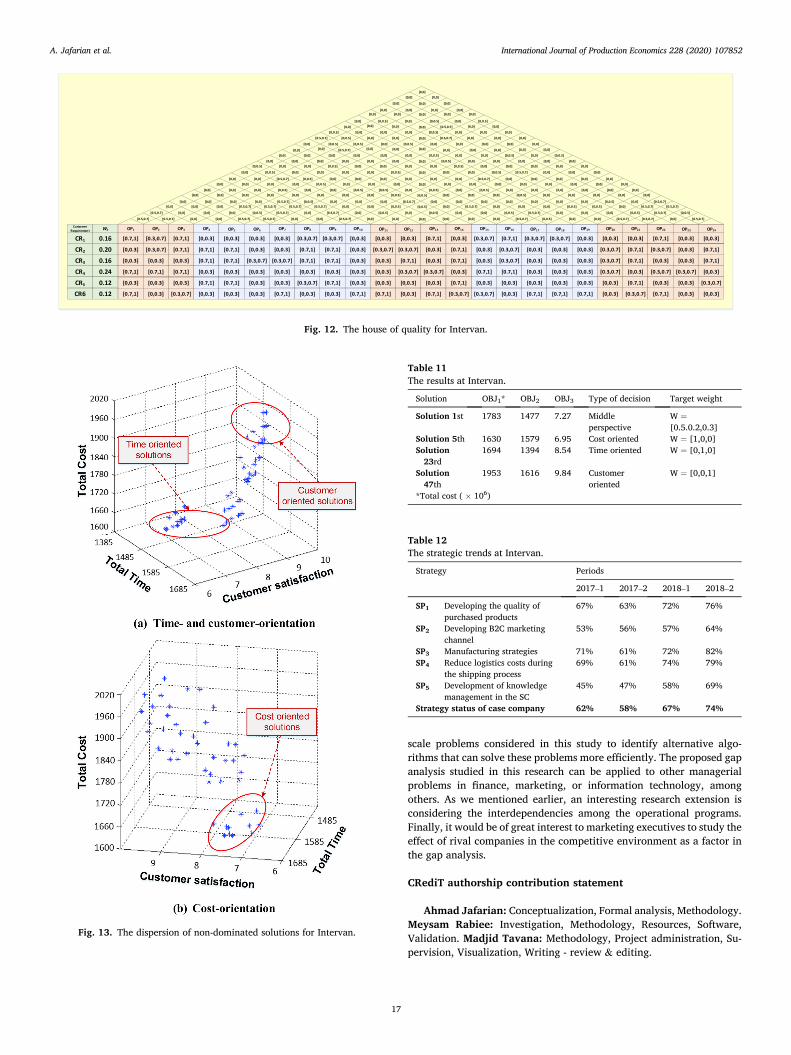
International Journal of Production Economics 228 (2020) 107852
17
scale problems considered in this study to identify alternative algo-rithms that can solve these problems more efficiently. The proposed gap analysis studied in this research can be applied to other managerial problems in finance, marketing, or information technology, among others. As we mentioned earlier, an interesting research extension is considering the interdependencies among the operational programs. Finally, it would be of great interest to marketing executives to study the effect of rival companies in the competitive environment as a factor in the gap analysis.
CRediT authorship contribution statement
Ahmad Jafarian: Conceptualization, Formal analysis, Methodology. Meysam Rabiee: Investigation, Methodology, Resources, Software, Validation. Madjid Tavana: Methodology, Project administration, Su-pervision, Visualization, Writing - review & editing.
Fig. 12. The house of quality for Intervan.
Fig. 13. The dispersion of non-dominated solutions for Intervan.
Table 11 The results at Intervan.
Solution OBJ1* OBJ2 OBJ3 Type of decision Target weight
Solution 1st 1783 1477 7.27 Middle perspective
W ¼[0.5.0.2,0.3]
Solution 5th 1630 1579 6.95 Cost oriented W ¼ [1,0,0] Solution
23rd 1694 1394 8.54 Time oriented W ¼ [0,1,0]
Solution 47th
1953 1616 9.84 Customer oriented
W ¼ [0,0,1]
*Total cost ( � 106)
Table 12 The strategic trends at Intervan.
Strategy Periods
2017–1 2017–2 2018–1 2018–2
SP1 Developing the quality of purchased products
67% 63% 72% 76%
SP2 Developing B2C marketing channel
53% 56% 57% 64%
SP3 Manufacturing strategies 71% 61% 72% 82% SP4 Reduce logistics costs during
the shipping process 69% 61% 74% 79%
SP5 Development of knowledge management in the SC
45% 47% 58% 69%
Strategy status of case company 62% 58% 67% 74%
A. Jafarian et al.

International Journal of Production Economics 228 (2020) 107852
18
Acknowledgments
The authors would like to thank the anonymous reviewers and the
editor for their insightful comments and suggestions. Dr. Madjid Tavana is grateful for the partial support he received from the Czech Science Foundation (GA�CR 19-13946S) for this research.
Appendix A
Mathematical Notations and Parameters. The following notations are used in our model:
Sets: i Strategic plan index. i ¼ 1; :::; I j Operational programs index. j ¼ 1; :::;J k Customer’s needs index. k ¼ 1; :::;K Decision Variables: Xij The improvement rate of the jth operational program of the ith strategic plan. Parameters: SPi The ith strategic plan. OPj The jth operational program needed for n specific strategic plan. � ωsi the relative importance ith strategic plan in the final goal. � ωoj the relative importance of jth operational program in the related strategic plan. � ωij The relative weight of the jth operational program needed for the ith strategic plan. ðωij ¼ ωsi � ωojÞ
� ωk The importance of kth customer’s needs. � Rkj The relative importance of the jth operational program for the kth customer’s requirement (� Rkj’ is the same). � ξij The current state of OPj needed for the ith strategic plan. � φ The current state of the SCM strategy. ðφ ¼
PJj¼1PI
i¼1ωij � ξijÞ
� η The pre-determined goal. � G The gap (G) between the current state of the SCM strategy ðφÞ and The pre-determined goal. ðηÞCij The cost of the jth operational program of the ith strategic plan. MaxImpij The upper-bound of the improvement for the jth operational program and ith strategic program. tij The time requirement of the jth operational program of the ith strategic plan. τ Warning time for a predefined goal. � Tjj’ Correlations between operational programs jth and j0th, ðj; j0 ¼ 1;…;J ; j 6¼ j0 Þ
Appendix B
B.1. NSGA-II algorithm NSGAII Procedure ðÞSet the inputparameters Maxit; nPop; Pc; PmGenerate random initial population P0 of size nPopWhile stopping criteria is not met doGenerate population Rt ¼ Pt [ QtCreate the diffrent fronts Fi of Rt by the non � dominated sorting procedure ðrankingÞPut Ptþ1 ¼ ϕ and i ¼ 0While jPtþ1 j þ jFij < nPop do
Ptþ1 ¼ P [ Fii ¼ iþ 1
End WhileInclude in Ptþ1 the ðnPop � jPtþ1 jÞ of Fi according to crowding distance procedureCreate Qtþ1 from Ptþ1 by selection; crossover and mutation ==with pc and pm rateEnd While B.2. Crowding distance procedure Step1Þ L ¼ jSj ==number of solution in SStep2Þ For each i; S½i�distance ¼ 0 ==initialize distanceStep3ÞFor each objective mS ¼ sort ðS;mÞ ==sort using each objective functionS½1�distance ¼ S½L�distance ¼ ∞ ==boundary solutions are always selectedStep4Þ For i ¼ 2 to ðL � 1Þ ==for all other pointsS½i�distance ¼ S½i�distance þ ðS½iþ 1�:m � S½i � 1�:mÞWhere S½i�:m is mth objective function value of the ith solution in population S B.3. MOPSO algorithm
(continued on next page)
A. Jafarian et al.

International Journal of Production Economics 228 (2020) 107852
19
(continued )
Local search ðMOPSOÞ procedure ðÞInitialization
Recieve P as ð x!Þ and form ~A == P ¼ f1; 2; ::; nPopg; ~A ¼ fnon � dominated solutions of PgSet the parameters MaxItp and nGrid;
Iniliazie velocity ð v!Þ for each particle; randomly;
Calculate the Grids according to nGrid;
Assuem individual best ði:e: pibÞ equal to recieve P ;
Select leader ði:e: pgbÞ as the best particle;
For iter ¼ 1 : MaxItUpdate pib ;
Select leader ði:e: pgbÞ based on Grids;vmþ1��!
¼ ω� vm�!þ ϕ1 � r1 � ðpib � xm
�!Þ þ ϕ2 � r2 � ðpgb � xm
�!Þvmþ1��!
xmþ1��!
¼ xm�!þ vmþ1��!
If xmin��!
> xmþ1��! or xmþ1
��!> xmax��!
xmþ1��!
¼ xm�!þ vmþ1��!
� ðxmin��!� ð xm�!þ vmþ1��!ÞÞ or
xmþ1��!
¼ xm�!þ vmþ1��!
� ðð xm�!þ vmþ1��!Þ � xmax
��!Þ ; respectively;
endifEvaluate the particles and calculate the Grids according to nGrid ;
Update the Archive ð~AÞ~A ¼ f~A [ ðNon � Dominated ParticlesiterÞg
if the number of ~A > nRepeliminate the surpluses members by considering Gridsendifendfor and report ~A B.4. DEA linear programming minMs:t:M � dj � 0 j ¼ 1;…; nXm
i¼1xijwi � 1 j ¼ 1;…; n
Xs
r¼1yrjur �
Xm
i¼1xijwi þ dj � βj ¼ 0 j ¼ 1;…; n
Xn
j¼1dj ¼ n � 1
0 � βj � 1; dj 2 f0;1g j ¼ 1;…; nwi � ε* i ¼ 1;…;mur � ε* r ¼ 1;…; s (a) First Linear Programming Model minMs:t:M � dj � 0 j ¼ 1;…; nXm
i¼1xijwi � 1 j ¼ 1;…; n
Xs
r¼1yrjur �
Xm
i¼1xijwi þ dj � βj ¼ 0 j ¼ 1;…; n
Xn
j¼1θj ¼ n � 1
θj � djβj ¼ 0j ¼ 1;…; ndj � 0; βj � 1; θj 2 f0; 1g j ¼ 1;…; nwi � ε* i ¼ 1;…;mur � ε*r ¼ 1;…; s (b) Second Linear Programming Model
References
Amin, G.R., 2009. Comments on finding the most efficient DMUs in DEA: an improved integrated model. Comput. Ind. Eng. 56 (4), 1701–1702.
Augusto, O., Rabeau, S., D�epinc�e, P., Bennis, F., 2006. Multi-objective genetic algorithms: a way to improve the convergence rate. Eng. Appl. Artif. Intell. 19 (5), 501–510.
Aya�g, Z., Samanlioglu, F., Büyük€ozkan, G., 2013. A fuzzy QFD approach to determine supply chain management strategies in the dairy industry. J. Intell. Manuf. 24 (6), 1111–1122.
Barak, S., Javanmard, S., 2019. Outsourcing modelling using a novel interval-valued fuzzy quantitative strategic planning matrix (QSPM) and multiple criteria decision- making (MCDMs). Int. J. Prod. Econ. Available online 12 October 2019, Article 107494.
Behnamian, J., Fatemi Ghomi, S., Zandieh, M., 2009. A multi-phase covering Pareto- optimal front method to multi-objective scheduling in a realistic hybrid flowshop using a hybrid metaheuristic. Expert Syst. Appl. 36 (8), 11057–11069.
Bottani, E., 2009. A fuzzy QFD approach to achieve agility. Int. J. Prod. Econ. 119 (2), 380–391.
Bottani, E., Rizzi, A., 2006. Strategic management of logistics service: a fuzzy QFD approach. Int. J. Prod. Econ. 103 (2), 585–599.
Bouchereau, V., Rowlands, H., 2000. Quality function deployment: the unused tool. Eng. Manag. J. 10 (1), 45–52.
Box, G.E.P., Wilson, K.B., 1951. On the experimental attainment of optimum conditions (with discussion). J. Roy. Stat. Soc. B13 (1), 1–45.
Brasileiro, R.C., Souza, V.L., Oliveira, A.L., 2017. Automatic trading method based on piecewise aggregate approximation and multi-swarm of improved self-adaptive particle swarm optimization with validation. Decis. Support Syst. 104, 79–91.
Brockhoff, D., Zitzler, E., 2007. Improving hypervolume-based multiobjective evolutionary algorithms by using objective reduction methods. In: Evolutionary Computation, 2007. CEC 2007. IEEE Congress on. IEEE, pp. 2086–2093.
Brun, A., Castelli, C., 2008. Supply chain strategy in the fashion industry: developing a portfolio model depending on product, retail channel and brand. Int. J. Prod. Econ. 116 (2), 169–181.
Brun, A., Caridi, M., Fahmy Salama, K., Ravelli, I., 2006. Value and risk assessment of supply chain management improvement projects. Int. J. Prod. Econ. 99 (1-2), 186–201.
Büyük€ozkan, G., Uztürk, D., 2019. Smart fridge design with interval-valued intuitionistic fuzzy QFD. In: International Conference on Intelligent and Fuzzy Systems. Springer, Cham, pp. 1170–1179.
Chen, I.J., Paulraj, A., 2004. Towards a theory of supply chain management: the constructs and measurements. J. Oper. Manag. 22 (2), 119–150.
Chen, L.H., Ko, W.C., 2009. Fuzzy approaches to quality function deployment for new product design. Fuzzy sets and systems 160 (18), 2620–2639.
Childerhouse, P., Aitken, J., Towill, D.R., 2002. Analysis and design of focused demand chains. J. Oper. Manag. 20 (6), 675–689.
A. Jafarian et al.
International Journal of Production Economics 228 (2020) 107852
20
Chin, K.S., Yang, Q., Chan, C.Y., Tsui, K.L., Li, Y.L., 2019. Identifying passengers’ needs in cabin interiors of high-speed rails in China using quality function deployment for improving passenger satisfaction. Transport. Res. Pol. Pract. 119, 326–342.
Chopra, S., Meindl, P., 2007. Supply Chain Management. Strategy, Planning & Operation. Das Summa Summarum des Management, pp. 265–275.
Coello Coello, C.A., Lechuga, M.S., 2002. MOPSO: A Proposal for Multiple Objective Particle Swarm Optimization. in, vol. 2. IEEE, pp. 1051–1056.
Cooper, M.C., Ellram, L.M., Gradner, J., 1997. Hanks: meshing multiple alliances. J. Bus. Logist. 18 (1), 67–89. https://doi.org/10.1016/j.ijpe.2019.09.015.
Crowe, T.J., Cheng, C.C., 1996. Using quality function deployment in manufacturing strategic planning. Int. J. Oper. Prod. Manag. 16 (4), 35–48.
Deb, K., 2001. Multi-objective Optimization Using Evolutionary Algorithms, vol. 16. Wiley.
Deb, K., Agrawal, S., Pratap, A., Meyarivan, T., 2000. A Fast Elitist Non-dominated Sorting Genetic Algorithm for Multi-Objective Optimization: NSGA-II. in. Springer, pp. 849–858.
Deb, K., Pratap, A., Agarwal, S., Meyarivan, T., 2002. A fast and elitist multiobjective genetic algorithm: NSGA-II. IEEE Trans. Evol. Comput. 6 (2), 182–197.
Defryn, C., S€orensen, K., 2018. Multi-objective optimisation models for the traveling salesman problem with horizontal cooperation. Eur. J. Oper. Res. 267 (3), 891–903.
Dehning, B., Richardson, V.J., Zmud, R.W., 2007. The financial performance effects of IT- based supply chain management systems in manufacturing firms. J. Oper. Manag. 25 (4), 806–824.
Deng, J.L., 1989. Introduction to grey system theory. J. Grey Syst. 1 (1), 1–24. Dennis, Z.Y., Cheong, T., Sun, D., 2017. Impact of supply chain power and drop-shipping
on a manufacturer’s optimal distribution channel strategy. Eur. J. Oper. Res. 259 (2), 554–563.
Derringer, G., Suich, R., 1980. Simultaneous optimization of several response variables. J. Qual. Technol. 12 (4), 214–219.
Dincer, H., Yüksel, S., Martinez, L., 2019. Balanced scorecard-based analysis about European energy investment policies: a hybrid hesitant fuzzy decision-making approach with quality function deployment. Expert Syst. Appl. 115, 152–171.
Ding, S., Xia, C., Wang, C., Wu, D., Zhang, Y., 2017. Multi-objective optimization based ranking prediction for cloud service recommendation. Decis. Support Syst. 101, 106–114.
Dreyer, B., Gronhaug, K., 2004. Uncertainty, flexibility, and sustained competitive advantage. J. Bus. Res. 57 (5), 484–494.
Dyer, J.H., 1996. How Chrysler created an American keiretsu. Harv. Bus. Rev. 74, 42–60. Eberhart, R., Kennedy, J., 1995. A New Optimizer Using Particle Swarm Theory. in. IEEE,
pp. 39–43. Elgazzar, S.H., Tipi, N.S., Hubbard, N.J., Leach, D.Z., 2012. Linking supply chain
processes’ performance to a company’s financial strategic objectives. Eur. J. Oper. Res. 223 (1), 276–289.
Engelbrecht, A.P., 2005. Fundamentals of Computational Swarm Intelligence, vol. 1. Wiley. Chichester, UK.
Eshlaghy, A.T., Radfar, R., Kivi, M.B., 2008. A model for evaluating the performance of the strategic plan using an analytic approach. In. IEEE, pp. 455–459.
Ghazinoory, S., Aliahmadi, A., Namdarzangeneh, S., Ghodsypour, S., 2007. Using AHP and LP for choosing the best alternatives based the gap analysis. Appl. Math. Comput. 184 (2), 316–321.
Goodstein, L.D., Nolan, T.M., Pfeiffer, J.W., 1993. Applied Strategic Planning: A Comprehensive Guide. McGraw-Hill Professional.
Govindan, K., Jepsen, M.B., 2016. ELECTRE: a comprehensive literature review on methodologies and applications. Eur. J. Oper. Res. 250 (1), 1–29.
Govindan, K., Jafarian, A., Nourbakhsh, V., 2015. Bi-objective integrating sustainable order allocation and sustainable supply chain network strategic design with stochastic demand using a novel robust hybrid multi-objective metaheuristic. Comput. Oper. Res. 62, 112–130.
Govindan, K., Shankar, K.M., Devika, K., 2019. Achieving sustainable development goals through identifying and analyzing barriers to industrial sharing economy: a framework development. Int. J. Prod. Econ. 107575.
Güler, M., Büyük€ozkan, G., 2019. Analysis of digital transformation strategies with an integrated fuzzy AHP-axiomatic design methodology. IFAC-PapersOnLine 52 (13), 1186–1191.
Hallgren, M., Olhager, J., 2006. Quantification in manufacturing strategy: a methodology and illustration. Int. J. Prod. Econ. 104 (1), 113–124.
Hara, T., 2018. Integrating usage information into quality function deployment for further PSS development. Procedia CIRP 73 (1), 21–25.
Harland, C., 1996. Supply network strategies the case of health supplies. Eur. J. Purch. Supply Manag. 2 (4), 183–192.
Harrison, A., New, C., 2002. The role of coherent supply chain strategy and performance management in achieving competitive advantage: an international survey. J. Oper. Res. Soc. 53 (3), 263–271.
Hayes, R.H., Wheelwright, S.C., 1984. Restoring Our Competitive Edge: Competing through Manufacturing. Wiley, New York.
Herron, C., Braiden, P.M., 2006. A methodology for developing sustainable quantifiable productivity improvement in manufacturing companies. Int. J. Prod. Econ. 104 (1), 143–153.
Hingoft, E., 2000. New organization performance test uncover some surprising relation behavior. Credit Union Times 11 (3).
Horn, J., Nafpliotis, N., Goldberg, D.E., 1994. A Niched Pareto Genetic Algorithm for Multiobjective Optimization. in, vol. 81. Ieee, pp. 82–87.
Hyun, C.J., Kim, Y., Kim, Y.K., 1998. A genetic algorithm for multiple objective sequencing problems in mixed model assembly lines. Comput. Oper. Res. 25 (7-8), 675–690.
Jabbarzadeh, A., Haughton, M., Pourmehdi, F., 2019. A robust optimization model for efficient and green supply chain planning with postponement strategy. Int. J. Prod. Econ. 214, 266–283.
Jalham, I.S., Abdelkader, W.T., 2006. Improvement of organizational efficiency and effectiveness by developing a manufacturing strategy decision support system. Bus. Process Manag. J. 12 (5), 588–607.
Johnston, D.A., McCutcheon, D.M., Stuart, F.I., Kerwood, H., 2004. Effects of supplier trust on performance of cooperative supplier relationships. J. Oper. Manag. 22 (1), 23–38.
Kahraman, C., Ertay, T., Büyük€ozkan, G., 2006. A fuzzy optimization model for QFD planning process using analytic network approach. Eur. J. Oper. Res. 171 (2), 390–411.
Kannan, D., Jafarian, A., Khamene, H.A., Olfat, L., 2013. Competitive performance improvement by operational budget allocation using ANFIS and fuzzy quality function deployment: a case study. Int. J. Adv. Manuf. Technol. 68 (1-4), 849–862.
Kumar, M., Basu, P., Avittathur, B., 2018. Pricing and sourcing strategies for competing retailers in supply chains under disruption risk. Eur. J. Oper. Res. 265 (2), 533–543.
Kuo, R.J., Lin, L.M., 2010. Application of a hybrid of genetic algorithm and particle swarm optimization algorithm for order clustering. Decis. Support Syst. 49 (4), 451–462.
Lee, A.H., Lin, C.Y., 2011. An integrated fuzzy QFD framework for new product development. Flex. Serv. Manuf. J. 23 (1), 26–47.
Lee, H.L., 2004. The triple-A supply chain. Harv. Bus. Rev. 82 (10), 102–113. Li, D., O’Brien, C., 2001. A quantitative analysis of relationships between product types
and supply chain strategies. Int. J. Prod. Econ. 73 (1), 29–39. Li, G.D., Yamaguchi, D., Nagai, M., 2007. A grey-based decision-making approach to the
supplier selection problem. Math. Comput. Model. 46 (3-4), 573–581. Li, S., Ragu-Nathan, B., Ragu-Nathan, T., Subba Rao, S., 2006. The impact of supply
chain management practices on competitive advantage and organizational performance. Omega 34 (2), 107–124.
Li, X., 2003. A non-dominated sorting particle swarm optimizer for multiobjective optimization. In: Genetic and Evolutionary Computation—GECCO 2003. Springer, pp. 37–48.
Li, Z., Liao, H., Coit, D.W., 2009. A two-stage approach for multi-objective decision making with applications to system reliability optimization. Reliab. Eng. Syst. Saf. 94 (10), 1585–1592.
Lian, Z., 2010. A united search particle swarm optimization algorithm for multiobjective scheduling problem. Appl. Math. Model. 34 (11), 3518–3526.
Lin, Y.H., Lee, P.C., Ting, H.I., 2008. Dynamic multi-attribute decision making model with grey number evaluations. Expert Syst. Appl. 35 (4), 1638–1644.
Liu, S., Lin, Y., 2011. A brief introduction to grey systems theory. In: Proceedings of 2011 IEEE International Conference on Grey Systems and Intelligent Services, pp. 1–18.
Luthra, S., Kumar Mangla, S., Xu, L., Diabat, A., A, 2016. Using AHP to evaluate barriers in adopting sustainable consumption and production initiatives in a supply chain. Int. J. Prod. Econ. 181, 342–349. Part B.
Mendoza, L.E., Marius, A., P�erez, M., Grim�an, A.C., 2007. Critical success factors for a customer relationship management strategy. Inf. Software Technol. 49 (8), 913–945.
Mohammed, A., Harris, I., Govindan, K., 2019. A hybrid MCDM-FMOO approach for sustainable supplier selection and order allocation. Int. J. Prod. Econ. 217, 171–184.
Moraga, J.A., Quezada, L.E., Palominos, P.I., Oddershede, A.M., Silva, H.A., 2020. A quantitative methodology to enhance a strategy map. Int. J. Prod. Econ. 219, 43–53.
Morita, M., Machuca, J.A., Flynn, E.J., de los Ríos, J.L.P., 2015. Aligning product characteristics and the supply chain process–a normative perspective. Int. J. Prod. Econ. 161, 228–241.
Moslemi, H., Zandieh, M., 2011. Comparisons of some improving strategies on MOPSO for multi-objective (r, Q) inventory system. Expert Syst. Appl. 38 (10), 12051–12057.
Mousavi, S.M., Sadeghi, J., Niaki, S.T.A., Tavana, M., 2016. A bi-objective inventory optimization model under inflation and discount using tuned Pareto-based algorithms: NSGA-II, NRGA, and MOPSO. Appl. Soft Comput. 43, 57–72.
Myers, R.H., Montgomery, D.C., Anderson-Cook, C.M., 1971. Response Surface Methodology. Allyn and Bacon, Boston.
Myers, R.H., Montgomery, D.C., Anderson-Cook, C.M., 2009. Response Surface Methodology: Process and Product Optimization Using Designed Experiments, vol. 705. John Wiley & Sons Inc.
Neter, J., Wasserman, W., Kutner, M.H., 1996. Applied Linear Regression Models, vol. 3. Irwin Homewood.
Nie, L., Xu, X., Zhan, D., 2008. Collaborative Planning in Supply Chains by Lagrangian Relaxation and Genetic Algorithms. in, vol. 2. IEEE, pp. 7258–7262.
Ojha, D., Patel, P.C., Sridharan, S.V., 2019. Dynamic strategic planning and firm competitive performance: a conceptualization and an empirical test. Int. J. Prod. Econ. 107509.
€Ozcan, E.C., Ünlüsoy, S., Eren, T., 2017. A combined goal programming–AHP approach supported with TOPSIS for maintenance strategy selection in hydroelectric power plants. Renew. Sustain. Energy Rev. 78, 1410–1423.
Pandey, M.M., 2020. Evaluating the strategic design parameters of airports in Thailand to meet service expectations of Low-Cost Airlines using the Fuzzy-based QFD method. J. Air Transport. Manag. 82, 101738.
Patel, P.C., Azadegan, A., Ellram, L.M., 2013. The effects of strategic and structural supply chain orientation on operational and customer-focused performance. Decis. Sci. J. 44 (4), 713–753.
Qi, Y., Huo, B., Wang, Z., Yeung, H.Y.J., 2017. The impact of operations and supply chain strategies on integration and performance. Int. J. Prod. Econ. 185, 162–174.
A. Jafarian et al.
International Journal of Production Economics 228 (2020) 107852
21
Rabiee, M., Zandieh, M., Jafarian, A., 2012. Scheduling of a no-wait two-machine flow shop with sequence-dependent setup times and probable rework using robust meta- heuristics. Int. J. Prod. Res. https://doi.org/10.1080/00207543.2011.652747.
Rajala, M., Savolainen, T., Jagdev, H., 1997. Exploration methods in business process re- engineering. Comput. Ind. 33 (2-3), 367–385.
Rho, B.-H., Park, K., Yu, Y.-M., 2001. An international comparison of the effect of manufacturing strategy-implementation gap on business performance. Int. J. Prod. Econ. 70 (1), 89–97.
Robinson Jr., E.P., Sahin, F., Gao, L.L., 2005. The impact of e-replenishment strategy on make-to-order supply chain performance. Decis. Sci. J. 36 (1), 33–64.
Ruiz, M., Moreno, J., Dorronsoro, B., Rodriguez, D., 2018. Using simulation-based optimization in the context of IT service management change process. Decis. Support Syst. 112, 35–47.
Sahoo, S., Dhar, A., Kar, A., 2016. Environmental vulnerability assessment using Grey Analytic Hierarchy Process based model. Environ. Impact Assess. Rev. 56, 145–154.
Schnetzler, M.J., Sennheiser, A., Schonsleben, P., 2007. A decomposition-based approach for the development of a supply chain strategy. Int. J. Prod. Econ. 105 (1), 21–42.
Schoenwitz, M., Potter, A., Gosling, J., Naim, M., 2017. Product, process and customer preference alignment in prefabricated house building. Int. J. Prod. Econ. 183 (Part A), 79–90.
Seo, Y., 2006. Controlling general multi-echelon distribution supply chains with improved reorder decision policy utilizing real-time shared stock information. Comput. Ind. Eng. 51 (2), 229–246.
Skinner, W., 1969. Manufacturing–missing link in corporate strategy. Harv. Bus. Rev. 47 (3), 136–145.
Sousa, R., 2003. Linking quality management to manufacturing strategy: an empirical investigation of customer focus practices. J. Oper. Manag. 21 (1), 1–18.
Srinivas, N., Deb, K., 1994. Muiltiobjective optimization using nondominated sorting in genetic algorithms. Evol. Comput. 2 (3), 221–248.
Srivastav, A., Agrawal, S., 2016. Multi-objective optimization of hybrid backorder inventory model. Expert Syst. Appl. 51, 76–84.
Subramanian, N., Ramanathan, R., 2012. A review of applications of Analytic Hierarchy Process in operations management. Int. J. Prod. Econ. 138 (2), 215–241.
Sun, J., Gong, D., Zeng, X., Geng, N., 2018. An ensemble framework for assessing solutions of interval programming problems. Inf. Sci. 436, 146–161.
Taboada, H.A., Espiritu, J.F., Coit, D.W., 2008. MOMS-GA: a multi-objective multi-state genetic algorithm for system reliability optimization design problems. IEEE Trans. Reliab. 57 (1), 182–191.
Tan, K.C., Xie, M., Xiao-Xiang, S., 1999. Development of innovative products using Kano’s model and quality function deployment. Int. J. Innovat. Manag. 3, 271–286, 03.
Tang, J., Yk, F., 2002. A new approach to quality function deployment planning with financial consideration. Comput. Oper. Res. 29 (11), 1447–1463.
Tavana, M., Li, Z., Mobin, M., Komaki, M., Teymourian, E., 2016. Multi-objective control chart design optimization using NSGA-III and MOPSO enhanced with DEA and TOPSIS. Expert Syst. Appl. 50, 17–39.
Thun, J.H., 2008. Empirical analysis of manufacturing strategy implementation. Int. J. Prod. Econ. 113 (1), 370–382.
Tsai, C.Y., Chang, A., 2003. Using fuzzy QFD to enhance manufacturing strategic planning. J. Chin. Inst. Ind. Eng. 20 (1), 33–41.
Tseng, M.L., Chiang, J.H., Lan, L.W., 2009. Selection of optimal supplier in supply chain management strategy with analytic network process and choquet integral. Comput. Ind. Eng. 57 (1), 330–340.
Wang, Z.J., 2018. A goal programming approach to deriving interval weights in analytic form from interval fuzzy preference relations based on multiplicative consistency. Inf. Sci. 462, 160–181.
Wei, G.W., 2010. Grey Relational Analysis Method for Two-Tuple Linguistic Multiple Attribute Group Decision Making with Incomplete Weight Information. Expert Systems with Applications.
Zhang, Y., Bhattacharyya, S., Li, X., 2010. From choice of procurement strategy to supply network configuration: an evolutionary approach. Int. J. Inf. Technol. Decis. Making 9, 145–173, 01.
Zheng, P., Xu, X., Xie, S.Q., 2019. A weighted interval rough number based method to determine relative importance ratings of customer requirements in QFD product planning. J. Intell. Manuf. 30 (1), 3–16.
Zhu, Q., Shah, P., Sarkis, J., 2018. Addition by subtraction: integrating product deletion with lean and sustainable supply chain management. Int. J. Prod. Econ. 205, 201–214.
Zitzler, E., Thiele, L., 1998. An Evolutionary Algorithm for Multiobjective Optimization: the Strength Pareto Approach. Swiss Federal Institute of Technology, TIK-Report, p. 43.
Zitzler, E., Giannakoglou, K., Tsahalis, D., Periaux, J., Papailiou, K., Fogarty, T., 2002. SPEA2: improving the strength pareto evolutionary algorithm for multiobjective optimization. In: Proceedings of the EUROGEN’2001. Athens. Greece, pp. 19–21.
A. Jafarian et al.