Embed Size (px)
Citation preview
A Novel Model Predictive Control Scheme for Sustainability: Application to
Biomass/Coal Co-gasification SystemShuyun Li1, Gerardo J. Ruiz-Mercado2 and Fernando V. Lima1
1 Department of Chemical and Biomedical Engineering, West Virginia University, Morgantown, WV 2 U.S. Environmental Protection Agency, Cincinnati, OH
2018 AIChE Annual MeetingNovember 2 2018, Pittsburgh, PA

Background Motivation Challenges and Objectives
Process Systems Approach Proposed Framework Software Communication
Case Study Biomass/coal co-gasification Process Modeling Multi-objective Optimization (MOO) Dynamic Sustainability Performance Analysis MPC Formulation and Implementation Results
Conclusions
TitleOutline
BackgroundFrameworkCase Study Conclusions
1
Presentation Outline
TitleOutline
BackgroundFrameworkCase StudyConclusions
2
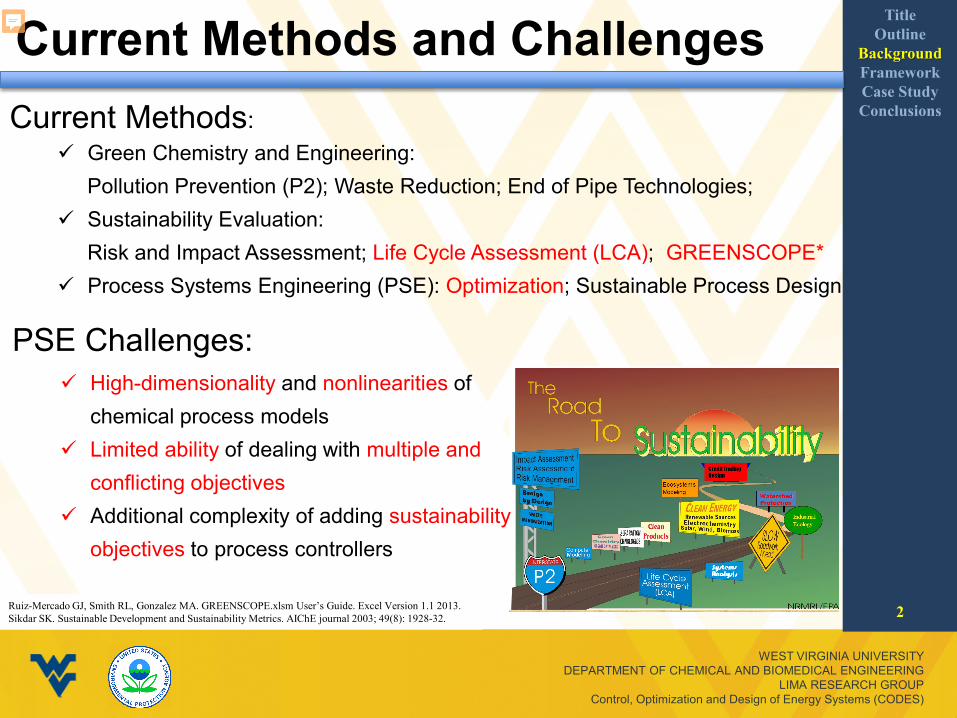
Current Methods and ChallengesCurrent Methods:
Green Chemistry and Engineering:Pollution Prevention (P2); Waste Reduction; End of Pipe Technologies;
Sustainability Evaluation:Risk and Impact Assessment; Life Cycle Assessment (LCA); GREENSCOPE*
Process Systems Engineering (PSE): Optimization; Sustainable Process Design
PSE Challenges: High-dimensionality and nonlinearities of
chemical process models Limited ability of dealing with multiple and
conflicting objectives Additional complexity of adding sustainability
objectives to process controllers
Ruiz-Mercado GJ, Smith RL, Gonzalez MA. GREENSCOPE.xlsm User’s Guide. Excel Version 1.1 2013.Sikdar SK. Sustainable Development and Sustainability Metrics. AIChE journal 2003; 49(8): 1928-32.

Motivation and Objectives Motivation:
Limited process systems studies on sustainability performance of biomass/coal conversion process (No control and Dynamic performance were done)
Co-gasification technology has some advantages to address
-- Low energy density and low quality of biomass
-- Biomass limited and intermittent supply
TitleOutline
BackgroundFrameworkCase StudyConclusions
3
Objectives: Evaluate the performance of biomass/coal co-gasification system in
terms of economic and environmental aspects
Develop a systematic framework to control co-gasification process systems at the most sustainable operating region

Proposed Framework Title
OutlineBackgroundFrameworkCase Study Conclusions
5

Software CommunicationTitle
OutlineBackgroundFrameworkCase StudyConclusions
6
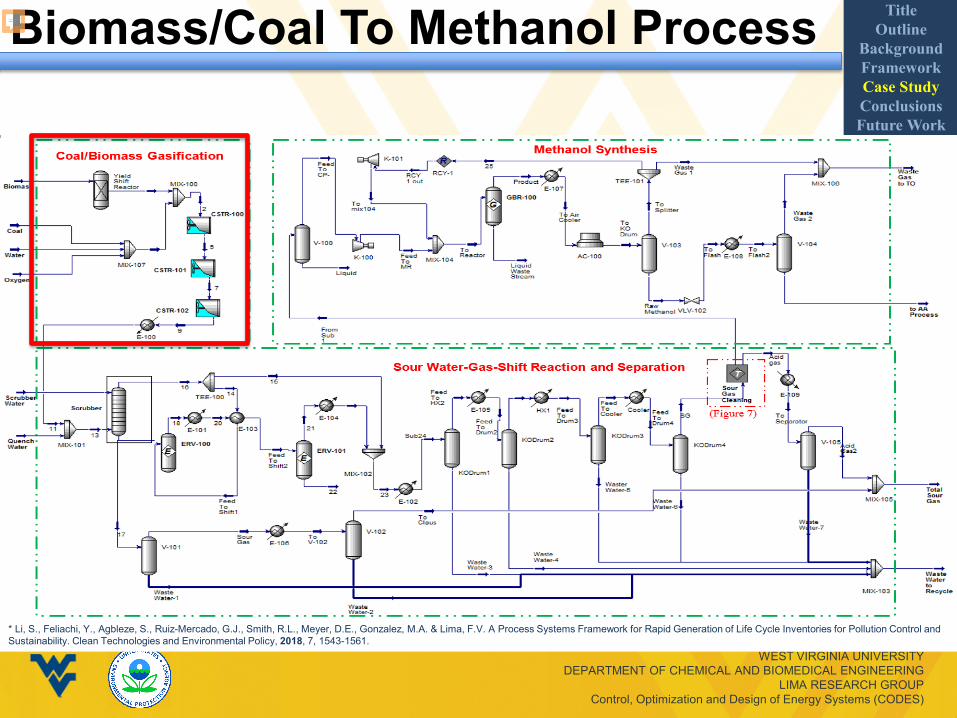
Biomass/Coal To Methanol Process TitleOutline
BackgroundFrameworkCase Study ConclusionsFuture Work
7* Li, S., Feliachi, Y., Agbleze, S., Ruiz-Mercado, G.J., Smith, R.L., Meyer, D.E., Gonzalez, M.A. & Lima, F.V. A Process Systems Framework for Rapid Generation of Life Cycle Inventories for Pollution Control and Sustainability. Clean Technologies and Environmental Policy, 2018, 7, 1543-1561.

Sustainability Indicators (SI) Model* TitleOutline
BackgroundFrameworkCase Study ConclusionsFuture Work
7
* Ruiz-Mercado GJ, Smith RL, Gonzalez MA. GREENSCOPE.xlsm User’s Guide. Excel Version 1.1 2013.
Category Indicator DefinitionReference Value
Best case Worst case
Efficiency Reaction yield (RY) 1.0 0
Economic Economic potential(EP) 0.5 0
Envi
ronm
enta
l
Global warming potential (GWP) 0 2.5
Specific solid waste mass (𝑚𝑚𝑠𝑠,𝑠𝑠𝑠𝑠𝑠𝑠𝑠𝑠) 0 50
Specific liquid waste volume (𝑉𝑉𝐿𝐿,𝑠𝑠𝑠𝑠𝑠𝑠𝑠𝑠) 0 100
Energy Specific energyintensity (RSEI)
0 100
𝑆𝑆𝑆𝑆 𝑉𝑉𝑉𝑉𝑉𝑉𝑉𝑉𝑉𝑉 =𝐴𝐴𝐴𝐴𝐴𝐴𝑉𝑉𝑉𝑉𝑉𝑉 𝑉𝑉𝑉𝑉𝑉𝑉𝑉𝑉𝑉𝑉 −𝑊𝑊𝑊𝑊𝑊𝑊𝑊𝑊𝐴𝐴 𝑉𝑉𝑉𝑉𝑉𝑉𝑉𝑉𝑉𝑉𝐵𝐵𝑉𝑉𝑊𝑊𝐴𝐴 𝑉𝑉𝑉𝑉𝑉𝑉𝑉𝑉𝑉𝑉 −𝑊𝑊𝑊𝑊𝑊𝑊𝑊𝑊𝐴𝐴 𝑉𝑉𝑉𝑉𝑉𝑉𝑉𝑉𝑉𝑉 × 100%
( )cf , RM, UT, L,
, product 1
PWF C C FCIEP m m m m m
m I
m ii
S
m•
=
− − −=
∑
outCO2,
1
product
PFI
i ii
mGWP
m
•
=•
×
=∑
'out
solid, 1
s, spec.product
•
=•
=∑
I
ii
mm
m
( )' out1
liquid, 1
l, spec.product
ρ•−
=•
=∑
I
ii
mV
m
( ) ( ) ( ) ( )factor factor factor factornatural gas fuel oil steam electricityEI
C C C ... C• • • •+ + + +=
m
E E E ER
S

Optimization Problem Formulation Title
OutlineBackgroundFrameworkCase Studies Conclusions
10
Minimize Environmental Waste Index (𝑓𝑓1) Global warming potential (GWP) Specific solid waste mass (𝑚𝑚𝑠𝑠,𝑠𝑠𝑠𝑠𝑠𝑠𝑠𝑠) Specific liquid waste volume (𝑉𝑉𝐿𝐿,𝑠𝑠𝑠𝑠𝑠𝑠𝑠𝑠)
𝑓𝑓1 = (𝑤𝑤1 � 𝑆𝑆𝑆𝑆𝐺𝐺𝐺𝐺𝐺𝐺 + 𝑤𝑤2 � 𝑆𝑆𝑆𝑆𝑚𝑚𝑠𝑠,𝑠𝑠𝑠𝑠𝑠𝑠𝑠𝑠 + 𝑤𝑤3 � 𝑆𝑆𝑆𝑆𝑉𝑉𝐿𝐿,𝑠𝑠𝑠𝑠𝑠𝑠𝑠𝑠)/3
Minimize Economic Index (𝑓𝑓1) :𝑓𝑓1 = 𝑆𝑆𝑆𝑆𝐸𝐸𝐺𝐺
𝑊𝑊. 𝐴𝐴. 𝑝𝑝𝑊𝑊𝑊𝑊𝐴𝐴𝑉𝑉𝑊𝑊𝑊𝑊 𝑚𝑚𝑊𝑊𝑚𝑚𝑉𝑉𝑉𝑉
constraints: RSE > 0.7; RY > 0.95;1800 <𝐹𝐹𝑜𝑜𝑜𝑜𝑜𝑜𝑜𝑜𝑠𝑠𝑜𝑜< 4000 kmol/h;1800 < 𝐹𝐹𝑠𝑠𝑠𝑠𝑠𝑠𝑠𝑠𝑚𝑚 < 5400 kmol/h;1000 <𝑇𝑇𝑜𝑜𝑠𝑠𝑠𝑠𝑔𝑔𝑔𝑔𝑔𝑔𝑠𝑠𝑔𝑔< 1500 ℃;𝐹𝐹𝑠𝑠𝑜𝑜𝑠𝑠𝑐𝑐 fixed at 923.5 lbmol/h

Optimization: Genetic Algorithm Title
OutlineBackgroundFrameworkCase Studies Conclusions
11
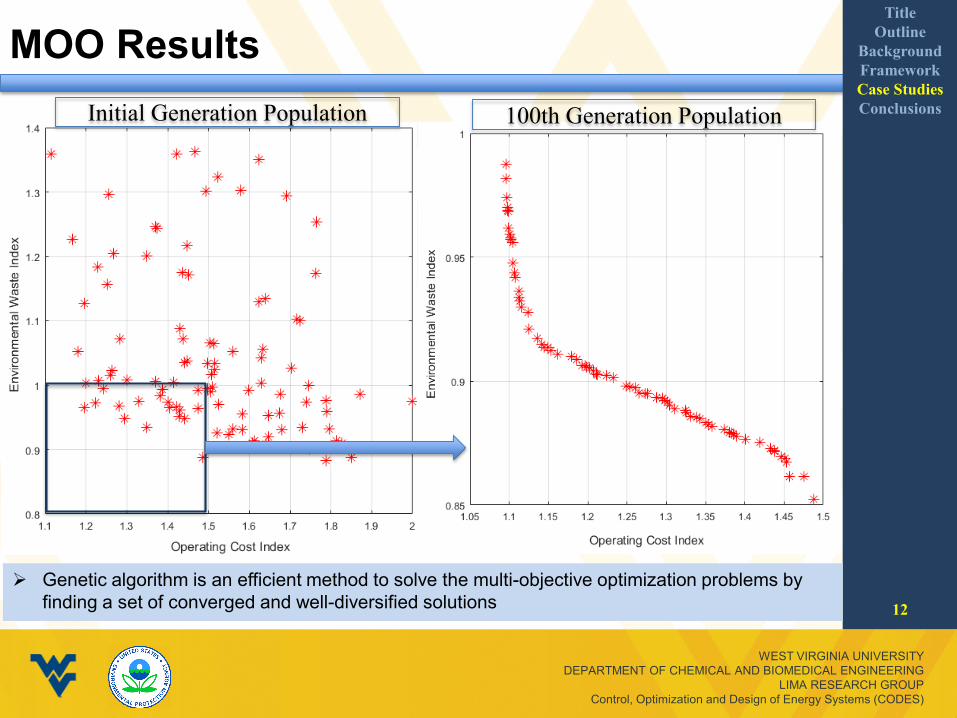
MOO ResultsTitle
OutlineBackgroundFrameworkCase Studies Conclusions
12
Genetic algorithm is an efficient method to solve the multi-objective optimization problems by finding a set of converged and well-diversified solutions
Initial Generation Population 100th Generation Population

MOO Results AnalysisTitle
OutlineBackgroundFrameworkCase Studies Conclusions
13
Genetic algorithm is capable of finding trade-offs between economic and environmental objectives
Pareto front shows the trends: better economic performance requires higher waste/emissions
Population size: 120Generation number: 150
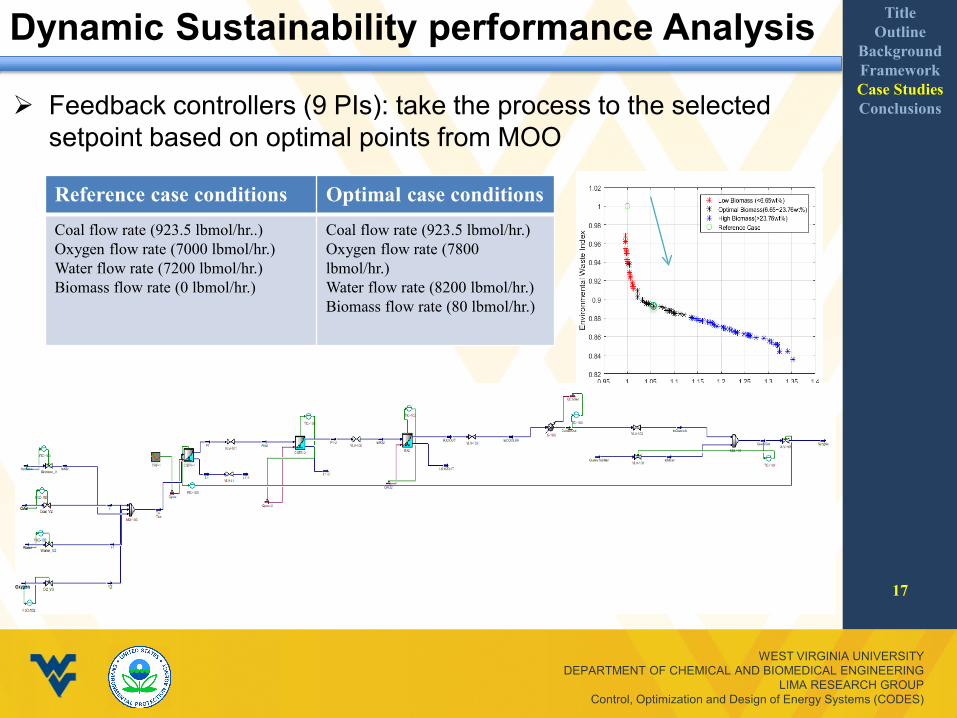
Dynamic Sustainability performance Analysis TitleOutline
BackgroundFrameworkCase Studies Conclusions
17
Feedback controllers (9 PIs): take the process to the selected setpoint based on optimal points from MOO
Reference case conditions Optimal case conditions Coal flow rate (923.5 lbmol/hr..)Oxygen flow rate (7000 lbmol/hr.)Water flow rate (7200 lbmol/hr.)Biomass flow rate (0 lbmol/hr.)
Coal flow rate (923.5 lbmol/hr.)Oxygen flow rate (7800 lbmol/hr.)Water flow rate (8200 lbmol/hr.)Biomass flow rate (80 lbmol/hr.)

TitleOutline
BackgroundFrameworkCase Studies Conclusions
14
Sustainability Performance during the transient part
Dynamic Sustainability performance Analysis
Linear MPC Implementation TitleOutline
BackgroundFrameworkCase Studies Conclusions
15
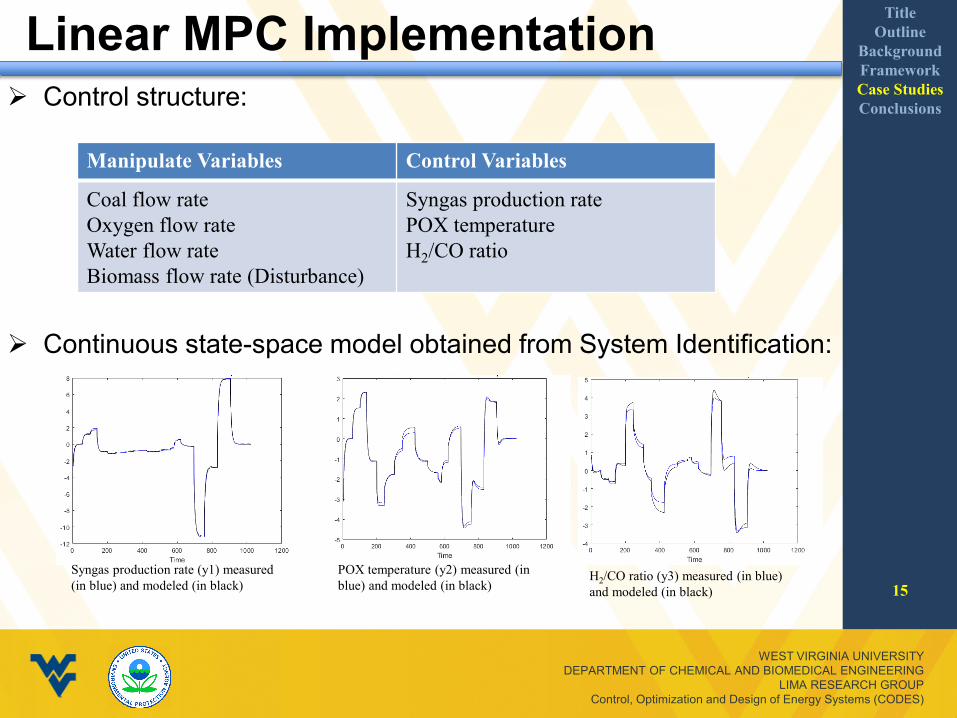
Control structure:
Continuous state-space model obtained from System Identification:
Manipulate Variables Control Variables
Coal flow rateOxygen flow rateWater flow rateBiomass flow rate (Disturbance)
Syngas production rate POX temperature H2/CO ratio
Syngas production rate (y1) measured (in blue) and modeled (in black)
POX temperature (y2) measured (in blue) and modeled (in black)
H2/CO ratio (y3) measured (in blue) and modeled (in black)

MPC Results: Setpoint tracking TitleOutline
BackgroundFrameworkCase Studies Conclusions
16
Setpoints tracking scenarios [-10; 0; 5]:

Conclusions TitleOutline
BackgroundFrameworkCase Studies Conclusions
17
The effectiveness of proposed framework was illustrated through evaluation of MOO considering conflicting objectives in terms of environmental and economic aspects
The proposed control structure can keep the system sustainability performance in a certain predefined range in the transient scenarios
Proposed framework can bridge existing gaps between sustainability/LCI and process systems (simulation, optimization, control)
Still working on the results of time-explicit SI value
AcknowledgmentsWest Virginia University and U.S. Environmental Protection Agency for the
financial support through contract Ref. EP-16-C-000049.
DisclaimerThe views expressed in this presentation are those of the authors and do not
represent the views or policies of the U.S. Environmental Protection Agency.
Thank you!