Embed Size (px)
Citation preview
van der Horst et al. BMC Bioinformatics 2010, 11:316http://www.biomedcentral.com/1471-2105/11/316
Open AccessR E S E A R C H A R T I C L E
Research articleA novel chemogenomics analysis of G protein-coupled receptors (GPCRs) and their ligands: a potential strategy for receptor de-orphanizationEelke van der Horst†1, Julio E Peironcely†1, Adriaan P IJzerman1, Margot W Beukers1, Jonathan R Lane1, Herman WT van Vlijmen1, Michael TM Emmerich2, Yasushi Okuno3 and Andreas Bender*1,4
AbstractBackground: G protein-coupled receptors (GPCRs) represent a family of well-characterized drug targets with significant therapeutic value. Phylogenetic classifications may help to understand the characteristics of individual GPCRs and their subtypes. Previous phylogenetic classifications were all based on the sequences of receptors, adding only minor information about the ligand binding properties of the receptors. In this work, we compare a sequence-based classification of receptors to a ligand-based classification of the same group of receptors, and evaluate the potential to use sequence relatedness as a predictor for ligand interactions thus aiding the quest for ligands of orphan receptors.
Results: We present a classification of GPCRs that is purely based on their ligands, complementing sequence-based phylogenetic classifications of these receptors. Targets were hierarchically classified into phylogenetic trees, for both sequence space and ligand (substructure) space. The overall organization of the sequence-based tree and substructure-based tree was similar; in particular, the adenosine receptors cluster together as well as most peptide receptor subtypes (e.g. opioid, somatostatin) and adrenoceptor subtypes. In ligand space, the prostanoid and cannabinoid receptors are more distant from the other targets, whereas the tachykinin receptors, the oxytocin receptor, and serotonin receptors are closer to the other targets, which is indicative for ligand promiscuity. In 93% of the receptors studied, de-orphanization of a simulated orphan receptor using the ligands of related receptors performed better than random (AUC > 0.5) and for 35% of receptors de-orphanization performance was good (AUC > 0.7).
Conclusions: We constructed a phylogenetic classification of GPCRs that is solely based on the ligands of these receptors. The similarities and differences with traditional sequence-based classifications were investigated: our ligand-based classification uncovers relationships among GPCRs that are not apparent from the sequence-based classification. This will shed light on potential cross-reactivity of GPCR ligands and will aid the design of new ligands with the desired activity profiles. In addition, we linked the ligand-based classification with a ligand-focused sequence-based classification described in literature and proved the potential of this method for de-orphanization of GPCRs.
BackgroundG protein-coupled receptors (GPCRs) comprise a largefamily, more than 800 in human [1], of cell surface recep-
tors that consist of seven transmembrane (TM) helices.These receptors are activated by a variety of externalstimuli, including light, ions, small molecules, lipids, andproteins; moreover, the majority of therapeutic drugs acton GPCRs [2]. Because of the limited number of targetcrystal structures [3-6], GPCR drug design relies largelyon ligand-based approaches [7] such as property-based
* Correspondence: [email protected] Division of Medicinal Chemistry, Leiden/Amsterdam Center for Drug Research, Leiden University, Einsteinweg 55, 2333CC, The Netherlands† Contributed equallyFull list of author information is available at the end of the article
© 2010 van der Horst et al; licensee BioMed Central Ltd. This is an Open Access article distributed under the terms of the Creative Com-mons Attribution License (http://creativecommons.org/licenses/by/2.0), which permits unrestricted use, distribution, and reproduc-tion in any medium, provided the original work is properly cited.
van der Horst et al. BMC Bioinformatics 2010, 11:316http://www.biomedcentral.com/1471-2105/11/316
Page 2 of 12
methods [8], pharmacophore models [9], and substruc-ture methods [10]. These methods do not require anyknowledge about the target protein; however, combiningthem with target information often increases their poten-tial. The resulting so-called 'chemogenomics' approachesthus involve both ligand-based and target-based aspects[11]. They do not focus on a single group of ligands andone individual target, but rather on groups of ligandsagainst groups of targets. The central idea is that similartargets have similar ligands [12,13]. Therefore, relation-ships between targets from the sequence side can beexploited to search for novel receptor ligands on thechemical structure side.
Traditionally, the GPCR superfamily has been classifiedbased on sequence homology of the receptors. Kola-kowski grouped all seven transmembrane (7-TM) pro-teins into classes A to F for receptors proven to bind G-proteins and class O for the other 7-TM proteins [14].Class A receptors resemble rhodopsin and form the larg-est cluster. Later, Fredriksson et al. proposed a more elab-orate classification for known and predicted humanGPCRs [1]. Surgand et al. presented a sequence-basedphylogenetic classification of GPCRs viewed from aligand perspective [15]. By selecting residues pointinginwards into the generic binding pocket of GPCRs, theauthors assembled a set of 30 residues most likely to beaccessible for ligand binding. Based on these residues,phylogenetic clustering was performed. Although only asubset of residues was used, the classification was similarto classifications based on the full sequence. Applicationsof a grouping such as proposed by Surgand et al. consti-tute ligand design for related receptors, as well as de-orphanization of GPCRs [15]. However, the study by Sur-gant et al. is somewhat limited by the scarcity of struc-tural protein data where the identification of binding siteresidues was solely based on the structure of bovine rho-dopsin. It could not yet take into account recent advancesthat yielded three pharmacologically relevant X-ray crys-tal structures, namely those of the human β2 and turkeyβ1 adrenoceptors, as well as of the human adenosine A2Areceptor [3,5,6,16]. Building further on Surgand's work,Gloriam et al. proposed an extended set of ligand-acces-sible residues, derived from visual inspection of the newlyavailable X-ray GPCR crystal structures, from supportingmutagenesis data and from the evaluation of previouslyestablished residue sets [17]. The resulting set of 44 resi-dues was then applied to cluster class A GPCRs into aphylogenetic tree, which reflected similarities in bindingsite of the receptors.
Complementary to these sequence-based classifica-tions are the ligand-based classifications of GPCRs.Approaches that use ligand similarity measures for targetclassification have been previously described [18,19].Keiser et al. related targets by pair-wise comparison of
their ligands [20]. From a set of 65 k ligands, a networkwas constructed connecting almost all 246 targetsthrough sequential linkage. From this, previouslyunknown antagonism of methadone on the muscarinicM3 receptor and of emetine on the α2-adrenoceptor wasidentified.
While sequence-based similarity relies on comparisonof the residues at certain positions in the sequence, thereis no unambiguously defined method to measure ligand-based similarity. One way of defining ligand similarity isto consider the overlap of substructures in the molecules.Frequent substructure mining is a method for finding themost common substructures in a set of molecules [21-23]. It evaluates all possible substructures, not only dis-crete fragments that are present in the molecules; it istherefore an exhaustive approach, resulting in a morecomplete view on the structural features in the set.
In this study, we employ frequent substructure miningto determine the similarity between groups of ligands in athorough and unbiased manner. This substructural simi-larity is then used for classification of GPCRs accordingto relatedness of substructure profiles of their ligands.The substructure-based classification of GPCRs visual-izes relatedness of receptors in the form of a phylogenetictree, which is then compared to the sequence-based phy-logenetic classifications of GPCRs. The differences in treeorganization are examined with methods that visualizechanges in target position. Taken together, we present a(GPCR) classification from the small molecule (ligand)perspective, which facilitates analysis of target similaritiesand differences in ligand-binding behavior. In addition,we explore the potential of our ligand-based classificationin receptor de-orphanization, i.e. the prediction of newligands for orphan receptors.
Results and DiscussionSequence-based classificationThree types of sequence-based phylogenetic trees werebuilt, namely: one tree that was based on the full 7-TMsequence, one tree employing 30 residues described bySurgand et al. [15], and one tree which was based on theset of 44 residues described by Gloriam et al. [17]. Notethat the three sequence-based trees presented here aredifferent from those published in the referenced originalwork [1,15,17], since in the current study orphan recep-tors, receptors with a low number of ligands, and single-ton receptors were left out. Singleton receptors arereceptors that are the only (available) member in theirrespective subfamily. Due to the chemogenomic nature ofthis study, we focus on the phylogenetic tree based on theset of Gloriam et al. since it represents the ligand per-spective best; this set is referenced as the GSK set [17].The two other trees are provided for reference purposesin Additional file 1 - Phylogenetic trees based on 7TM
van der Horst et al. BMC Bioinformatics 2010, 11:316http://www.biomedcentral.com/1471-2105/11/316
Page 3 of 12
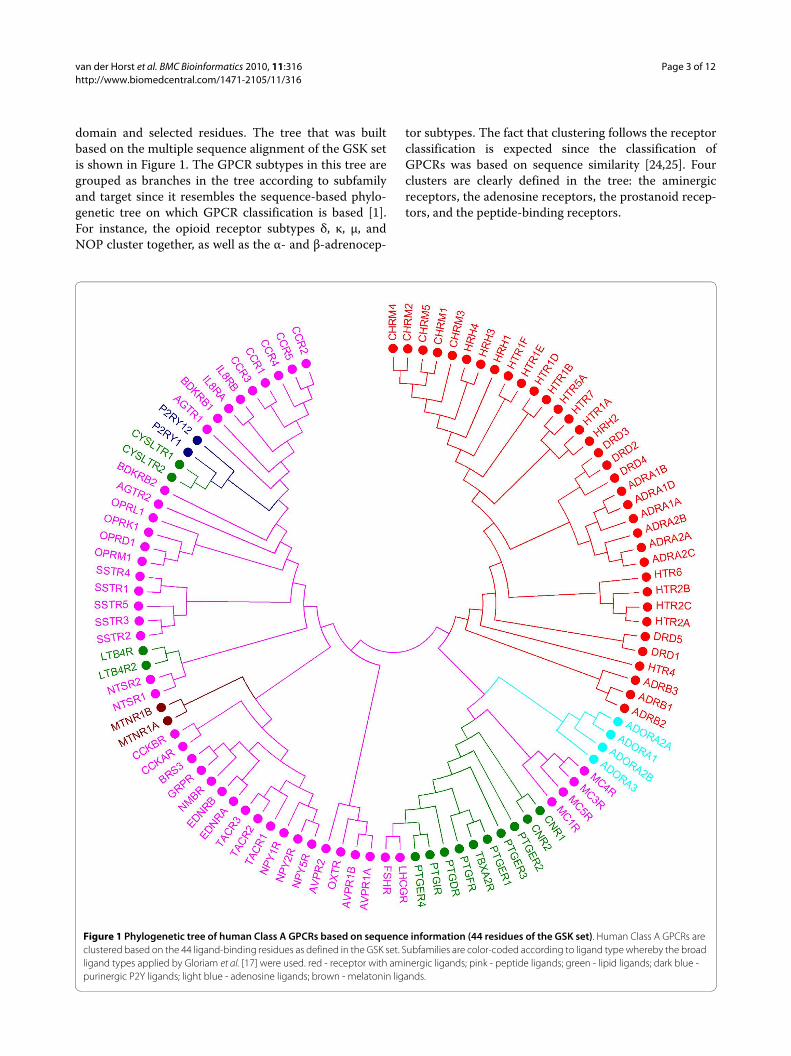
domain and selected residues. The tree that was builtbased on the multiple sequence alignment of the GSK setis shown in Figure 1. The GPCR subtypes in this tree aregrouped as branches in the tree according to subfamilyand target since it resembles the sequence-based phylo-genetic tree on which GPCR classification is based [1].For instance, the opioid receptor subtypes δ, κ, μ, andNOP cluster together, as well as the α- and β-adrenocep-
tor subtypes. The fact that clustering follows the receptorclassification is expected since the classification ofGPCRs was based on sequence similarity [24,25]. Fourclusters are clearly defined in the tree: the aminergicreceptors, the adenosine receptors, the prostanoid recep-tors, and the peptide-binding receptors.
Figure 1 Phylogenetic tree of human Class A GPCRs based on sequence information (44 residues of the GSK set). Human Class A GPCRs are clustered based on the 44 ligand-binding residues as defined in the GSK set. Subfamilies are color-coded according to ligand type whereby the broad ligand types applied by Gloriam et al. [17] were used. red - receptor with aminergic ligands; pink - peptide ligands; green - lipid ligands; dark blue - purinergic P2Y ligands; light blue - adenosine ligands; brown - melatonin ligands.
van der Horst et al. BMC Bioinformatics 2010, 11:316http://www.biomedcentral.com/1471-2105/11/316
Page 4 of 12
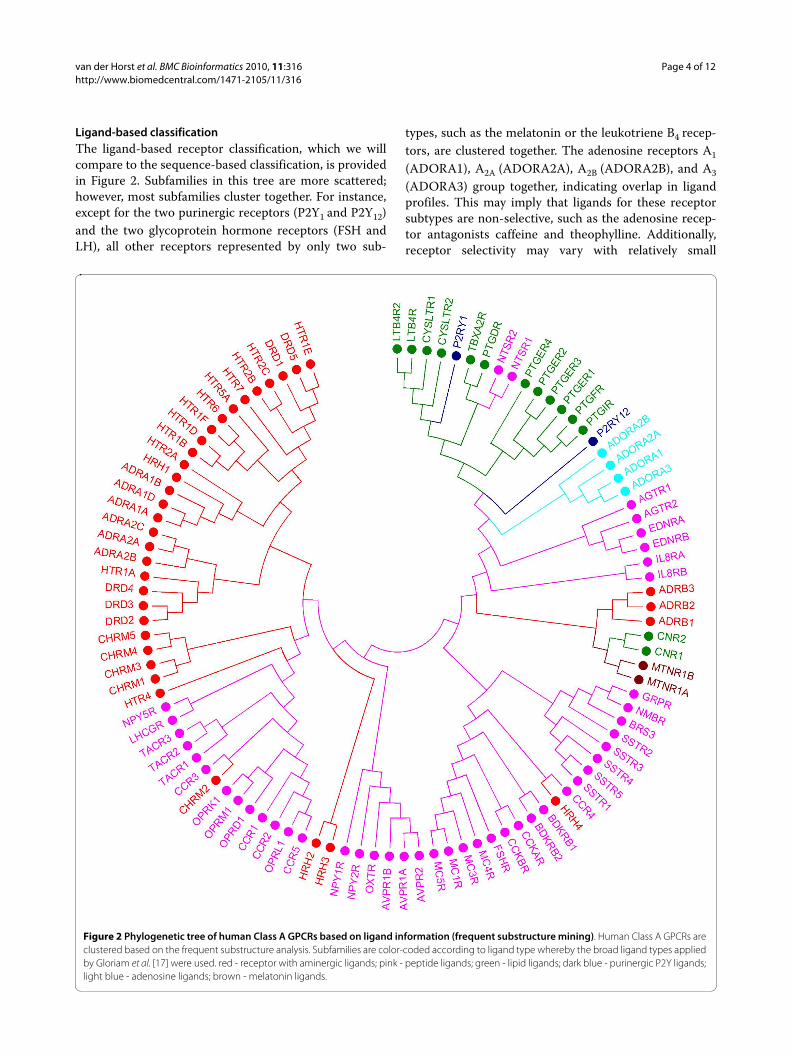
Ligand-based classificationThe ligand-based receptor classification, which we willcompare to the sequence-based classification, is providedin Figure 2. Subfamilies in this tree are more scattered;however, most subfamilies cluster together. For instance,except for the two purinergic receptors (P2Y1 and P2Y12)and the two glycoprotein hormone receptors (FSH andLH), all other receptors represented by only two sub-
types, such as the melatonin or the leukotriene B4 recep-tors, are clustered together. The adenosine receptors A1(ADORA1), A2A (ADORA2A), A2B (ADORA2B), and A3(ADORA3) group together, indicating overlap in ligandprofiles. This may imply that ligands for these receptorsubtypes are non-selective, such as the adenosine recep-tor antagonists caffeine and theophylline. Additionally,receptor selectivity may vary with relatively small
Figure 2 Phylogenetic tree of human Class A GPCRs based on ligand information (frequent substructure mining). Human Class A GPCRs are clustered based on the frequent substructure analysis. Subfamilies are color-coded according to ligand type whereby the broad ligand types applied by Gloriam et al. [17] were used. red - receptor with aminergic ligands; pink - peptide ligands; green - lipid ligands; dark blue - purinergic P2Y ligands; light blue - adenosine ligands; brown - melatonin ligands.
van der Horst et al. BMC Bioinformatics 2010, 11:316http://www.biomedcentral.com/1471-2105/11/316
Page 5 of 12
changes in ligand structure: an 8-cycloalkyl substituenton theophylline confers A1 receptor selectivity, whereas aphenylstyryl substituent on the same position in caffeinerenders these compounds selective for the A2A receptor.The purinergic receptor P2Y12 is found near the adenos-ine receptors owing to the purine core typical for ligandsof both these subfamilies. In agreement with the ligandselectivity reported for the α1-, α2-, and β-adrenoceptorsubfamilies, these receptors form three distinct clusters[26]; furthermore, the α1B and α1D receptors are the clos-est in the distance matrix. The muscarinic acetylcholinereceptors M1, M3, M4, and M5 (CHRM1/3/4/5, in Figure2) cluster together as one group, supporting the low sub-type selectivity of muscarinic antagonists [27]. However,the acetylcholine receptor M2 is found more distant fromthis cluster. This indicates the presence of distinct chemi-cal classes in the ligand set of the M2 receptor, which maybe the result of inclusion of allosteric ligands. Forinstance, gallamine is an allosteric modulator of the mus-carinic M2 receptor [28] that is also present in the GLIDAdatabase [29], classified as an M2 antagonist. In general,the remaining aminergic receptors (serotonergic, dop-aminergic, histaminergic and cholinergic) are more scat-tered throughout the substructure tree. This means thattargets share ligands or ligand substructures among sub-families/subtypes, which is in line with the high level ofpolypharmacology observed for these aminergic GPCRs[30]. For instance, the serotonin receptor 5-HT1A clusterstogether with the D2 dopamine receptor, which fits withreports on antipsychotic compounds combining dop-amine D2 receptor antagonism and serotonin 5-HT1Areceptor agonism [31,32]. Structurally similar ligandsmay act on diverse targets, for instance, when ligandshave a GPCR-privileged structure at their core [33,34].The grouping of the eight prostanoid receptors (Figure 2)indicates similarity in substructure profiles of the ligands.This is based on the fact that most prostanoid receptorligands are direct derivatives of the endogenous ligands[35,36], the so-called eicosanoids. These ligands arehighly similar, all consisting of large aliphatic, lipophilicalkyl chains. The presence of the leukotriene and cannab-inoid receptors in this lipid cluster may seem strange atfirst. Leukotrienes are however also eicosanoids, whichclarifies the position of the leukotriene B4 and cysteinyl-leukotriene receptors in this cluster [37,38]. In addition,arachidonic acid is the common precursor for eico-sanoids and two derivatives of arachidonic acid, anand-amide and 2-arachidonylglycerol, both of which areendogenous ligands ('endocannabinoids') of the cannabi-noid receptors.
The relationship between target clustering in the sub-structure tree (Figure 2) and ligand promiscuity suggests
that the substructure tree may be used to identify possi-ble side effects on receptors that are close neighbors inthis tree. For instance, off-target activity of ligands can beidentified. If inspection reveals a ligand to bind to recep-tor(s) that are phylogenetically related to the target ofinterest, a more detailed experimental follow-up withrespect to receptor selectivity would be worthwhile.
Tree comparisonVisual comparison of the sequence tree (Figure 1) withthe substructure tree (Figure 2) reveals that the overallphylogenetic organization is similar. For instance, withthe exclusion of the glycoprotein, P2Y, angiotensin, andbradykinin receptors, all other receptors represented bytwo subtypes occur in pairs in both the ligand tree andthe sequence tree. This is also true for receptors withthree subtypes present in the dataset, e.g. the three mem-bers of the α1, the α2, and the β1 adrenoceptors, as well asthe bombesin receptors. Exceptions to this rule are theneuropeptide Y and vasopressin receptors. In addition,the prostanoid receptors largely group together in bothtrees, as do most of the aminergic receptors.
The clear distinction between the two dopamine recep-tor types, i.e. D1 and D5 (D1-like) versus D2, D3, and D4(D2-like), exists both in the sequence-based classificationand ligand-based classification. This is in agreement witha previous study [39] and also known from drugs on themarket such as the benzazepines that favor D1-like overD2-like dopamine receptors. Similarly, antipsychoticssuch as chlorpromazine have a higher affinity for the D2-like subtypes than D1-like receptors [40].
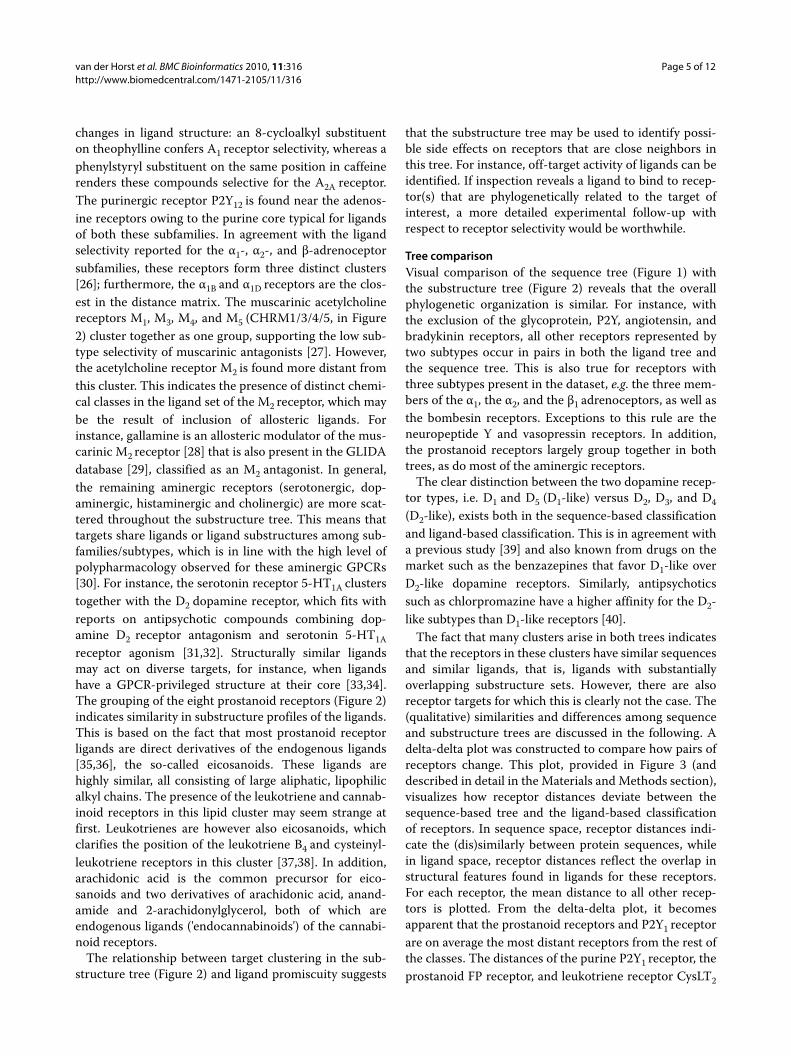
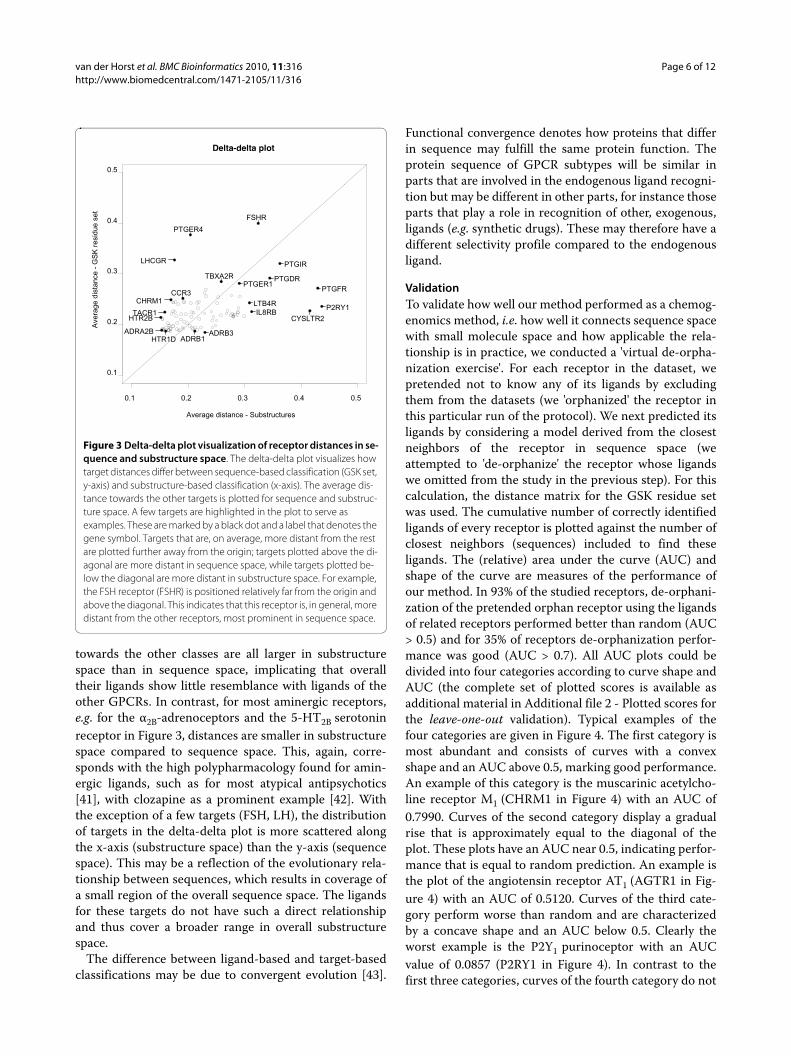
The fact that many clusters arise in both trees indicatesthat the receptors in these clusters have similar sequencesand similar ligands, that is, ligands with substantiallyoverlapping substructure sets. However, there are alsoreceptor targets for which this is clearly not the case. The(qualitative) similarities and differences among sequenceand substructure trees are discussed in the following. Adelta-delta plot was constructed to compare how pairs ofreceptors change. This plot, provided in Figure 3 (anddescribed in detail in the Materials and Methods section),visualizes how receptor distances deviate between thesequence-based tree and the ligand-based classificationof receptors. In sequence space, receptor distances indi-cate the (dis)similarly between protein sequences, whilein ligand space, receptor distances reflect the overlap instructural features found in ligands for these receptors.For each receptor, the mean distance to all other recep-tors is plotted. From the delta-delta plot, it becomesapparent that the prostanoid receptors and P2Y1 receptorare on average the most distant receptors from the rest ofthe classes. The distances of the purine P2Y1 receptor, theprostanoid FP receptor, and leukotriene receptor CysLT2
van der Horst et al. BMC Bioinformatics 2010, 11:316http://www.biomedcentral.com/1471-2105/11/316
Page 6 of 12
towards the other classes are all larger in substructurespace than in sequence space, implicating that overalltheir ligands show little resemblance with ligands of theother GPCRs. In contrast, for most aminergic receptors,e.g. for the α2B-adrenoceptors and the 5-HT2B serotoninreceptor in Figure 3, distances are smaller in substructurespace compared to sequence space. This, again, corre-sponds with the high polypharmacology found for amin-ergic ligands, such as for most atypical antipsychotics[41], with clozapine as a prominent example [42]. Withthe exception of a few targets (FSH, LH), the distributionof targets in the delta-delta plot is more scattered alongthe x-axis (substructure space) than the y-axis (sequencespace). This may be a reflection of the evolutionary rela-tionship between sequences, which results in coverage ofa small region of the overall sequence space. The ligandsfor these targets do not have such a direct relationshipand thus cover a broader range in overall substructurespace.
The difference between ligand-based and target-basedclassifications may be due to convergent evolution [43].
Functional convergence denotes how proteins that differin sequence may fulfill the same protein function. Theprotein sequence of GPCR subtypes will be similar inparts that are involved in the endogenous ligand recogni-tion but may be different in other parts, for instance thoseparts that play a role in recognition of other, exogenous,ligands (e.g. synthetic drugs). These may therefore have adifferent selectivity profile compared to the endogenousligand.
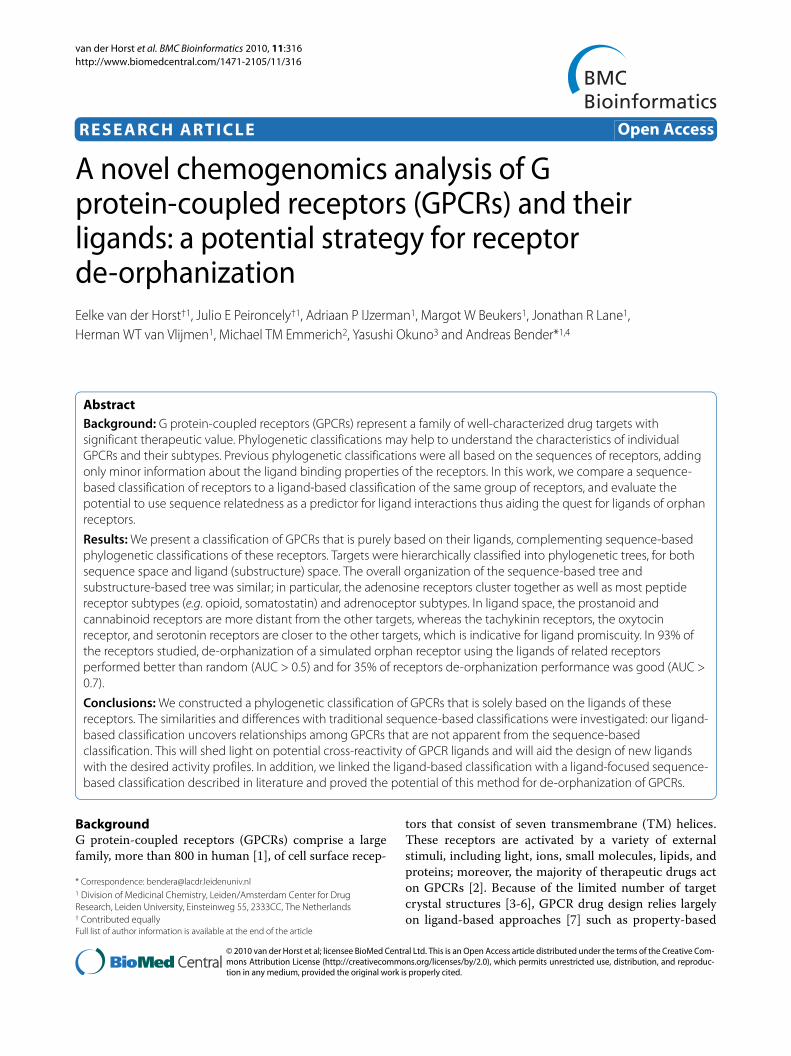
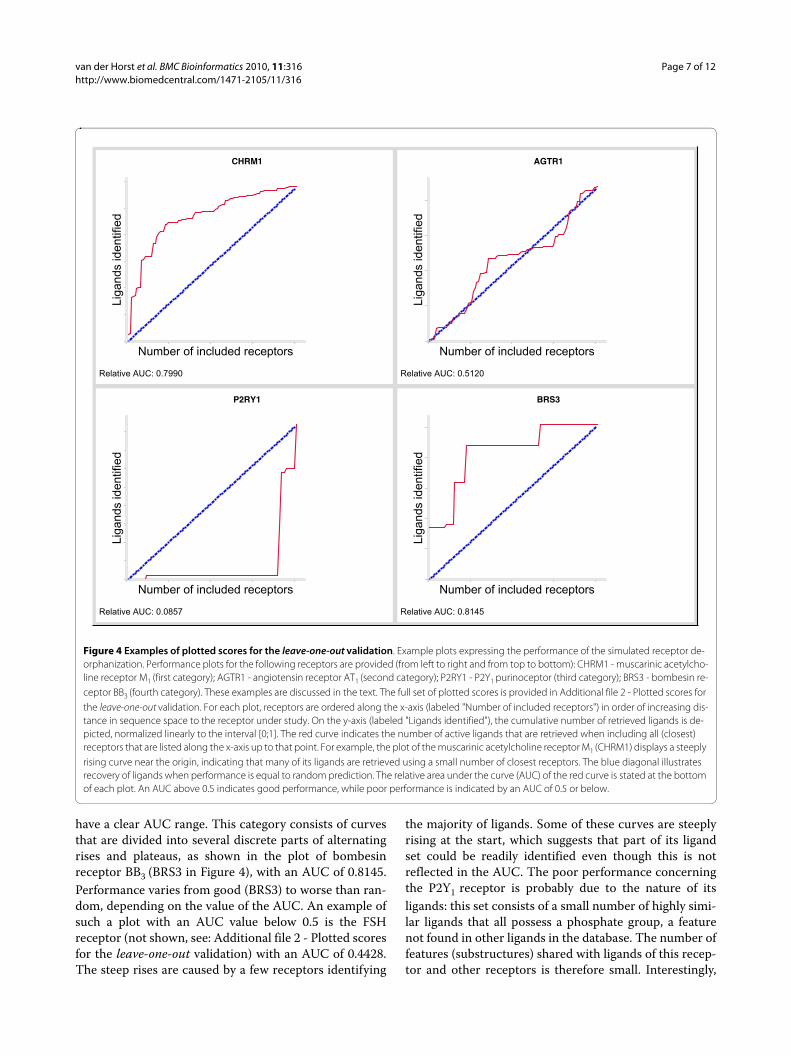
ValidationTo validate how well our method performed as a chemog-enomics method, i.e. how well it connects sequence spacewith small molecule space and how applicable the rela-tionship is in practice, we conducted a 'virtual de-orpha-nization exercise'. For each receptor in the dataset, wepretended not to know any of its ligands by excludingthem from the datasets (we 'orphanized' the receptor inthis particular run of the protocol). We next predicted itsligands by considering a model derived from the closestneighbors of the receptor in sequence space (weattempted to 'de-orphanize' the receptor whose ligandswe omitted from the study in the previous step). For thiscalculation, the distance matrix for the GSK residue setwas used. The cumulative number of correctly identifiedligands of every receptor is plotted against the number ofclosest neighbors (sequences) included to find theseligands. The (relative) area under the curve (AUC) andshape of the curve are measures of the performance ofour method. In 93% of the studied receptors, de-orphani-zation of the pretended orphan receptor using the ligandsof related receptors performed better than random (AUC> 0.5) and for 35% of receptors de-orphanization perfor-mance was good (AUC > 0.7). All AUC plots could bedivided into four categories according to curve shape andAUC (the complete set of plotted scores is available asadditional material in Additional file 2 - Plotted scores forthe leave-one-out validation). Typical examples of thefour categories are given in Figure 4. The first category ismost abundant and consists of curves with a convexshape and an AUC above 0.5, marking good performance.An example of this category is the muscarinic acetylcho-line receptor M1 (CHRM1 in Figure 4) with an AUC of0.7990. Curves of the second category display a gradualrise that is approximately equal to the diagonal of theplot. These plots have an AUC near 0.5, indicating perfor-mance that is equal to random prediction. An example isthe plot of the angiotensin receptor AT1 (AGTR1 in Fig-ure 4) with an AUC of 0.5120. Curves of the third cate-gory perform worse than random and are characterizedby a concave shape and an AUC below 0.5. Clearly theworst example is the P2Y1 purinoceptor with an AUCvalue of 0.0857 (P2RY1 in Figure 4). In contrast to thefirst three categories, curves of the fourth category do not
Figure 3 Delta-delta plot visualization of receptor distances in se-quence and substructure space. The delta-delta plot visualizes how target distances differ between sequence-based classification (GSK set, y-axis) and substructure-based classification (x-axis). The average dis-tance towards the other targets is plotted for sequence and substruc-ture space. A few targets are highlighted in the plot to serve as examples. These are marked by a black dot and a label that denotes the gene symbol. Targets that are, on average, more distant from the rest are plotted further away from the origin; targets plotted above the di-agonal are more distant in sequence space, while targets plotted be-low the diagonal are more distant in substructure space. For example, the FSH receptor (FSHR) is positioned relatively far from the origin and above the diagonal. This indicates that this receptor is, in general, more distant from the other receptors, most prominent in sequence space.
0.1 0.2 0.3 0.4 0.5
0.1
0.2
0.3
0.4
0.5
Delta-delta plot
Average distance - Substructures
Ave
rage
dis
tan
ce -
GS
K r
esi
due
se
t
ADRA2BADRB1
ADRB3
CCR3CHRM1
CYSLTR2
FSHR
HTR1D
HTR2BIL8RB
LHCGR
LTB4RP2RY1
PTGDRPTGER1
PTGER4
PTGFR
PTGIR
TACR1
TBXA2R
van der Horst et al. BMC Bioinformatics 2010, 11:316http://www.biomedcentral.com/1471-2105/11/316
Page 7 of 12
have a clear AUC range. This category consists of curvesthat are divided into several discrete parts of alternatingrises and plateaus, as shown in the plot of bombesinreceptor BB3 (BRS3 in Figure 4), with an AUC of 0.8145.Performance varies from good (BRS3) to worse than ran-dom, depending on the value of the AUC. An example ofsuch a plot with an AUC value below 0.5 is the FSHreceptor (not shown, see: Additional file 2 - Plotted scoresfor the leave-one-out validation) with an AUC of 0.4428.The steep rises are caused by a few receptors identifying
the majority of ligands. Some of these curves are steeplyrising at the start, which suggests that part of its ligandset could be readily identified even though this is notreflected in the AUC. The poor performance concerningthe P2Y1 receptor is probably due to the nature of itsligands: this set consists of a small number of highly simi-lar ligands that all possess a phosphate group, a featurenot found in other ligands in the database. The number offeatures (substructures) shared with ligands of this recep-tor and other receptors is therefore small. Interestingly,
Figure 4 Examples of plotted scores for the leave-one-out validation. Example plots expressing the performance of the simulated receptor de-orphanization. Performance plots for the following receptors are provided (from left to right and from top to bottom): CHRM1 - muscarinic acetylcho-line receptor M1 (first category); AGTR1 - angiotensin receptor AT1 (second category); P2RY1 - P2Y1 purinoceptor (third category); BRS3 - bombesin re-ceptor BB3 (fourth category). These examples are discussed in the text. The full set of plotted scores is provided in Additional file 2 - Plotted scores for the leave-one-out validation. For each plot, receptors are ordered along the x-axis (labeled "Number of included receptors") in order of increasing dis-tance in sequence space to the receptor under study. On the y-axis (labeled "Ligands identified"), the cumulative number of retrieved ligands is de-picted, normalized linearly to the interval [0;1]. The red curve indicates the number of active ligands that are retrieved when including all (closest) receptors that are listed along the x-axis up to that point. For example, the plot of the muscarinic acetylcholine receptor M1 (CHRM1) displays a steeply rising curve near the origin, indicating that many of its ligands are retrieved using a small number of closest receptors. The blue diagonal illustrates recovery of ligands when performance is equal to random prediction. The relative area under the curve (AUC) of the red curve is stated at the bottom of each plot. An AUC above 0.5 indicates good performance, while poor performance is indicated by an AUC of 0.5 or below.
Number of included receptors
Lig
an
ds
ide
ntif
ied
Number of included receptors
Lig
an
ds
ide
ntif
ied
Number of included receptors
Lig
an
ds
ide
ntif
ied
Number of included receptors
Lig
an
ds
ide
ntif
ied
CHRM1
Relative AUC: 0.7990
AGTR1
Relative AUC: 0.5120
P2RY1
Relative AUC: 0.0857
BRS3
Relative AUC: 0.8145

van der Horst et al. BMC Bioinformatics 2010, 11:316http://www.biomedcentral.com/1471-2105/11/316
Page 8 of 12
the adenosine A1 and A3 receptors, which are also puri-nergic, identify most (28 out of 42) of the P2Y1 ligands.However, in sequence space these receptors are at greatdistance (at positions 91 and 92, respectively).
Overall, our method proves useful for receptor de-orphanization, since for 93% of receptors studied de-oph-anization performed better than random selection (AUC> 0.5) and for 35% of receptors de-orphanization per-formed well (AUC > 0.7).
Limitations of the workIn the present study, some targets were excluded due toinsufficient availability of ligand data in the source data-bases. The absence of a receptor may influence the orderof other receptors in the trees. Scarcity of ligand data isreflected in the substructure profiles, thereby influencingthe correlations among receptors. The issue of data (in)completeness and its effect on interaction networks wasrecently discussed by Mestres et al. [44]. Using threedatasets of increasing complexity (more connections)that linked ligands to targets based on full chemical iden-tity, the authors showed that an increase in the number ofconnections rapidly leads to shifts in connection patterns.However, our study linked targets based on overlap insubstructures; as a consequence sharing of substructuresrather than of ligands is sufficient for targets to be identi-fied as related. Bender et al. and Keiser et al. alreadyshowed that overlapping ligands are not necessary to pre-dict whether targets are close in ligand space [19,20]. Inaddition, our method employs an exhaustive approach toanalyze the structural features of ligands. Frequent sub-structure mining considers all possible substructures thatoccur in the ligands and is therefore unbiased, i.e. all pos-sible substructures were evaluated, not only those intui-tive to chemists, such as functional groups, ring systems(e.g. a phenyl ring), and linkers [45]. However, in the pres-ent study less 'obvious' substructures such as ethyl orisobutyl are also considered [21]. For a complete discus-sion on substructure generation and evaluation, see ref.[46]. Our method is not limited to GPCRs alone; it is eas-ily extended to other protein families for analysis of thedifferences between subfamily phylogenies, given thatsufficient ligand information is available. For instance, itcan be applied to the realm of enzymes to complementother chemogenomics analyses [47].
ConclusionsIn this work, we presented a ligand-based phylogeneticclassification that complements the well-establishedsequence-based classification of proteins, and applied ourmethod to classification of GPCRs. This alternate viewmay contribute to our understanding of GPCR classifica-tion since it reveals relationships that are unnoticed withconventional phylogeny. Targets were analyzed based on
the substructure profiles of their ligands using an unbi-ased approach. The overall organization of the sequencetree and the substructure tree was similar; however, sub-stantial differences were also discovered. In the substruc-ture tree, several clusters of subtypes were identified. Forinstance, it was found that the adenosine receptors grouptogether, and that certain GPCR subfamilies that do notshare sequence homology cluster because of ligand simi-larity. Thus, receptor similarities that signal for potentialoff-target effects, such as for the serotonergic receptors,are readily identified. In addition, combined withsequence-based classification, the ligand-based classifica-tion presented has proven potential (93% of receptorswith AUC > 0.5 and 35% with AUC > 0.7) for de-orphani-zation of receptors.
MethodsDatasetsLigandsLigands for human GPCRs were collected from threepublicly available data sources: the StARLITe database, asmade available by ChEBI (EMBL-EBI) as part of theChEMBL database [48], GLIDA [29], and KiDB [49].ChEMBL consists of a collection of more than 500,000small molecules annotated with activity. Here, only activ-ity values measured directly from binding studies wereincluded. Compounds with Ki, IC50, or EC values below10 μM were considered active. GLIDA provides biologi-cal information on GPCRs (sequences) and chemicalinformation about ligand structures. It has links to sev-eral external databases, GPCRDB [25], UniProt [50], Pub-Chem [51], and DrugBank [52]. A reported affinity in oneof these source databases classifies a compound as active,independent of the reported binding affinity. Ligands areannotated with an activity type, namely: full agonist, par-tial agonist, agonist, antagonist or inverse agonist. In thepresent study, we focused only on binding affinity and noton the activity type. This allowed us to merge the set withthe rest of the data. KiDB provides information on drugsand molecular compounds that interact with GPCRs, ionchannels, transporters, and enzymes. The entries in KiDBare annotated with ligand, Ki value, radiolabeled ligand,receptor name, source & tissue, species, and PubMed linkto the publication(s). Our dataset consisted of ligandsfrom all three sources, by selecting human GPCR ligandswith a molecular weight between 50 and 700 Da. Onlytargets that had 20 or more ligands listed were used. Inthis study, we focused on class A (rhodopsin-like) GPCRssince the majority of targets are from class A and only aminor part from class C; combining both classes wouldhave negatively affected homogeneity of the phylogenetictrees, thereby hampering comparison. For the same rea-son, we removed two singleton targets (targets that arethe only member in a subfamily), the gonadotrophin-
van der Horst et al. BMC Bioinformatics 2010, 11:316http://www.biomedcentral.com/1471-2105/11/316
Page 9 of 12
releasing hormone receptor and the ghrelin receptor. Thefinal set consisted of 102 targets (provided in Table 1 ofAdditional file 3 - List of GPCRs used in this study) with37350 unique ligands in total.SequencesThe multiple sequence alignment of (specific residues of )the 7-TM domain was obtained from GPCRDB [25,53].Only human receptors that were non-olfactory and notorphan were used.
Tree generationFrequent Substructure MiningFor the ligands of each receptor, the most frequentlyoccurring substructures were determined. This wasaccomplished by using the frequent subgraph-miningalgorithm [54], which finds all frequent substructures in aset of molecular graphs [23]. For a description and aquantitative comparison of recent substructure miningalgorithms, see [55]. Briefly, starting from the smallestsubstructure, namely the single atoms, the algorithmfinds the number of molecules in which the substructureoccurs. If this occurrence is above a user-defined mini-mum, the minimum support value, the substructure isstored. Stored substructures are stepwise extended, andtested in a systematic manner, with the aim of testing allpossible substructures that have at least one of the storedsubstructures as their basis. The algorithm seeks ways totest only those substructures that actually occur in theset, and that have a frequency above the set minimum.An important concept of frequent substructure mining isthe a priori principle, originating from frequent item setmining [56]. Algorithms based on the a priori principleexploit that the frequency of a substructure will be equalor lower than the frequency of the substructures it con-tains. Therefore, whenever the occurrence of a substruc-ture is below the minimum support, all extensions of thatsubstructure are discarded.
Structures were represented as labeled graphs with aspecial type for aromatic bonds. In this study, the mini-mum support value was set to 30% of the number ofligands in each activity set. At this value, the algorithmprovided a large group of substructures while still beingcomputationally feasible to work with. In addition,molecular structures were sorted in ascending orderaccording to the number of bonds. This allowed the algo-rithm to prune scarce, complicated substructures thatconsisted of a large number of bonds, thereby reducingmemory requirements. If the set of generated substruc-tures is disproportionately large (more than 1000 timeslarger) compared to the majority of the other classes, thegenerated substructures are discarded except for thosethat also occur in other classes. This step was performedin order to prevent single targets from dominating theanalysis. Since in practice most classes generated sets of
less than 1000 substructures, a cut-off of 1 M substruc-tures was used. Substructures with molecular weightbelow 50 Dalton were discarded. The frequent substruc-tures of all classes were merged into one set, removingany duplicates. For all substructures in this set, the fre-quency in each subfamily was determined. To calculatethe correlation between two targets, we used the sub-structure frequencies as features for that target. A corre-lation matrix was constructed by calculating the Pearsoncorrelation coefficient for each pair of targets. Finally, adistance matrix was constructed by subtracting the val-ues of the correlation matrix from unity and normalizingthe results linearly to the interval [0;1].Phylogenetic TreesTo study receptor organization, receptors were clusteredinto a phylogenetic tree using the Neighbor-Joining (NJ)method (Neighbor from the PHYLIP package [57]). Thismethod infers phylogenies from the pair-wise distancesbetween receptors. Phylogenetic trees built from distancematrices facilitate tree comparison across domains. Inaddition, NJ clusters each domain equally well since itdoes not involve an 'evolutionary clock', a concept rootedin evolutionary biology. Two distance matrices repre-sented the similarities of the receptors: according to thefrequent substructures of their ligands and the 7-TMdomain sequence alignment, both were visualized as aphylogenetic tree, with receptors as leaves of the tree.The number of branches between two leaves in the treegrows with dissimilarity of these two leaves.
The protein distances between the aligned sequenceswere calculated with Protdist from the PHYLIP packageversion 3.6. using the Jones-Taylor-Thornton matrix(default) [57]. Both the sequence-based and ligand-basedphylogenetic trees were constructed using the neigh-bor.exe program from the PHYLIP package. Tree con-struction might be influenced by the order in whichtargets are provided to the tree constructor. To minimizethe influence on the resulting phylogenetic tree, targetinput order was randomized 10 times and 10 new treeswere generated. From these, a consensus tree was built.MEGA4 [58] was used for editing the layout of the treesand for visualization. Trees were rooted on the mid-points, that is, a root is placed at the mid-point of the lon-gest distance between two taxa of the unrooted tree. Taxawere arranged for balanced shape and trees were visual-ized as circular trees showing only topology, i.e. branchlengths do not reflect evolutionary distance in a quantita-tive manner.
Tree comparisonFor the comparison of trees, several methods and visual-izations are available; however, there is not a single defin-itive measure for tree difference. To visualize how the
van der Horst et al. BMC Bioinformatics 2010, 11:316http://www.biomedcentral.com/1471-2105/11/316
Page 10 of 12
receptor positions change between two trees weemployed a delta-delta plot.Delta-Delta plotsThe delta-delta plot reveals how receptor locationsbehave globally with respect to the median of all recep-tors. It was used to visualize the differences in location ofeach receptor in sequence space and in substructurespace. This plot is an adaptation from the delta-delta plotin Garr et al. [59]. It is a new way of tree comparison,which visualizes the differences among trees graphically,as opposed to the sole calculation of a numerical distancebetween two trees which is not trivial to interpret. Foreach receptor, the mean distance of that receptor to allother receptors was calculated. This value was plotted ina scatter plot, with each axis representing the mean dis-tance of the respective node in one of the trees. The inter-pretation of this plot is as follows. Along both axes,receptors plotted far from the origin are, on average,more distant from the rest of the group, while receptorsplotted close to the origin were closer to the rest of recep-tors. Receptors plotted near the diagonal do not changemuch in their mean distance to other receptors whengoing from one tree to the other (since they are close tothe X = Y diagonal). Receptors plotted above or below thediagonal have different average distance to the otherreceptors between trees. For instance, consider a delta-delta plot that plots a substructure tree along the x-axisand a sequence tree along the y-axis. If a receptor is plot-ted above the diagonal, the mean distance of that receptorto the other receptors is larger in the sequence tree thanthe substructure tree; for receptors plotted below thediagonal, the opposite is true.
ValidationLeave-one-out validationThis experiment is repeated for every receptor (the'orphan receptor') by temporarily removing ligands of thisreceptor from the dataset and predicting the position ofmolecules of this class in the substructure tree. A mole-cule from the left-out class is a hit when it is predicted tobelong to one of the closest classes in sequence space.The closest classes in sequence space are found using thedistance matrix from the multiple sequence alignment.Prediction of the class of a molecule is based on theEuclidean distance in substructure space. This distance iscalculated as follows: for each substructure, the square ofthe difference between the relative frequency in a classand the molecule is calculated. The relative frequency ofa substructure in a molecule is either 0 for absence, or 1for presence of the substructure. The square root of thesum of all squared differences is the Euclidean distancebetween a molecule and a class. The area under the curve(AUC) of the receiver operating characteristic (ROC) plotserved as a quality measure of the predictions for a class.
Instead of repeating the substructure mining for everyleft-out class, a lookup table of substructure occurrencewas used. This table related all generated substructureswith all molecules in which they occurred. Substructuresthat had a frequency just above the support threshold inthe left-out class were not considered when analysis wasperformed for molecules of this class.
Additional material
Authors' contributionsEH carried out the sequence alignments, frequent substructure mining, analy-sis and validation, and drafted the manuscript. JEP participated in design of thestudy and visualization methods, and implementation of analyses. MWB, JRL,and HWTV assisted in study design, interpretation of results, and drafting themanuscript. MTME was involved in algorithm design and data analysis. YO wasinvolved in acquisition of data in GLIDA. APIJ and AB participated in studydesign and coordination and helped to draft the manuscript. All authors readand approved the final manuscript.
AcknowledgementsThe authors thank all members of the Division of Medicinal Chemistry of the Leiden/Amsterdam Center for Drug Research at Leiden University for helpful discussions. In addition, the authors thank Bas Vroling from the CMBI, Radboud University, for his help with the sequence alignments.Funding: This work was supported by the Dutch Top Institute Pharma, project number: D1-105.
Additional file 1 Phylogenetic trees based on 7TM domain and selected residues. Phylogenetic trees based on 7TM domain and selected residues. Two sequence-based phylogenetic trees for the set of Class A GPCRs used in this study: the phylogenetic tree based on the multiple sequence alignment of the 7TM domain and the phylogenetic tree based on 30 selected residues described in Surgand et al. [15]. Subfamilies are color-coded according to ligand type whereby the broad ligand types applied by in Gloriam et al. [17] were used. Legend: red - receptor with aminergic ligands; pink - peptide ligands; green - lipid ligands; dark blue - purinergic P2Y ligands; light blue - adenosine ligands; brown - melatonin ligands.Additional file 2 Plotted scores for the leave-one-out validation. Plot-ted scores for the leave-one-out validation. The complete set of plotted scores of identified ligands per number of closest neighbors (sequences). For each plot, receptors are ordered along the x-axis (labeled "Number of included receptors") in order of increasing distance in sequence space to the receptor under study. The y-axis (labeled "Ligands identified") indicates the cumulative number of retrieved ligands, normalized linearly to the interval [0;1]. The red curve indicates the number of active ligands that are retrieved when including all (closest) receptors that are listed along the x-axis up to that point. More specifically, the number of correctly predicted ligands is plotted against the number of closely related receptors on which the prediction was based. For example, the plot of the muscarinic acetyl-choline receptor M1 (CHRM1, third row, third plot from the left) displays a steeply rising curve near the origin, indicating that many of its ligands are retrieved using a small number of closest receptors. The blue diagonal illus-trates recovery of ligands when performance is equal to random prediction. The relative area under the curve (AUC) of the red curve is stated at the bot-tom of each plot. An AUC above 0.5 indicates good performance, while poor performance is indicated by an AUC of 0.5 or below. The plots are sorted according to decreasing (relative) AUC.Additional file 3 List of GPCRs used in this study. List of GPCRs used in this study. The list of GPCRs used in this study (Class A, excluding single-tons). Only receptors that are human, non-olfactory, and not orphan, were used. For each receptor, the respective (sub) family, gene symbol, official IUPHAR name, and number of ligands are provided.
van der Horst et al. BMC Bioinformatics 2010, 11:316http://www.biomedcentral.com/1471-2105/11/316
Page 11 of 12
Author Details1Division of Medicinal Chemistry, Leiden/Amsterdam Center for Drug Research, Leiden University, Einsteinweg 55, 2333CC, The Netherlands, 2Leiden Institute for Advanced Computer Science, University of Leiden, The Netherlands, 3Department of PharmacoInformatics, Center for Integrative Education of Pharmacy Frontier, Graduate School of Pharmaceutical Sciences, Kyoto University, Kyoto, Japan and 4Unilever Centre for Molecular Science Informatics, Department of Chemistry, University of Cambridge, Cambridge, UK
References1. Fredriksson R, Lagerstrom MC, Lundin L-G, Schioth HB: The G-Protein-
Coupled Receptors in the Human Genome Form Five Main Families. Phylogenetic Analysis, Paralogon Groups, and Fingerprints. Molecular Pharmacology 2003, 63(6):1256-1272.
2. Jacoby E, Bouhelal R, Gerspacher M, Seuwen K: The 7 TM G-Protein-Coupled Receptor Target Family. Chem Med Chem 2006, 1(8):760-782.
3. Jaakola V-P, Griffith MT, Hanson MA, Cherezov V, Chien EYT, Lane JR, IJzerman AP, Stevens RC: The 2.6 Angstrom Crystal Structure of a Human A2A Adenosine Receptor Bound to an Antagonist. Science 2008:1164772.
4. Ballesteros J, Palczewski K: G protein-coupled receptor drug discovery: Implications from the crystal structure of rhodopsin. Curr Opin Drug Discovery Dev 2001, 4(5):561-574.
5. Cherezov V, Rosenbaum DM, Hanson MA, Rasmussen SGF, Thian FS, Kobilka TS, Choi H-J, Kuhn P, Weis WI, Kobilka BK, et al.: High-Resolution Crystal Structure of an Engineered Human β2-Adrenergic G Protein Coupled Receptor. Science 2007, 318(5854):1258-1265.
6. Warne T, Serrano-Vega MJ, Baker JG, Moukhametzianov R, Edwards PC, Henderson R, Leslie AGW, Tate CG, Schertler GFX: Structure of a β1-adrenergic G-protein-coupled receptor. Nature 2008, 454(7203):486-491.
7. Klabunde T, Hessler G: Drug Design Strategies for Targeting G-Protein-Coupled Receptors. Chem Bio Chem 2002, 3(10):928-944.
8. Balakin KV, Tkachenko SE, Lang SA, Okun I, Ivashchenko AA, Savchuk NP: Property-Based Design of GPCR-Targeted Library. J Chem Inf Comput Sci 2002, 42(6):1332-1342.
9. Chang LCW, Spanjersberg RF, von Frijtag Drabbe-Künzel JK, Mulder-Krieger T, van den Hout G, Beukers MW, Brussee J, IJzerman AP: 2,4,6-Trisubstituted Pyrimidines as a New Class of Selective Adenosine A1
Receptor Antagonists. J Med Chem 2004, 47(26):6529-6540.10. Bywater R: Privileged Structures in GPCRs. In GPCRs: From
Deorphanization to Lead Structure Identification Edited by: Bourne H, Horuk R, Kuhnke J, Michel H. Springer-Verlag; 2007:75-92.
11. Doddareddy MR, Westen GJPv, Horst Evd, Peironcely JE, Corthals F, IJzerman AP, Emmerich M, Jenkins JL, Bender A: Chemogenomics: Looking at biology through the lens of chemistry. Statistical Analysis and Data Mining 2009, 2(3):149-160.
12. Bender A, Young DW, Jenkins JL, Serrano M, Mikhailov D, Clemons PA, Davies JW: Chemogenomic data analysis: Prediction of small-molecule targets and the advent of biological fingerprints. Comb Chem High Throughput Screening 2007, 10(8):719-731.
13. Klabunde T: Chemogenomic approaches to drug discovery: similar receptors bind similar ligands. Br J Pharmacol 2007, 152(1):5-7.
14. Kolakowski LFJ: GCRDb: a G-protein-coupled receptor database. Recept Channels 1994, 2:1-7.
15. Surgand J-S, Rodrigo J, Kellenberger E, Rognan D: A chemogenomic analysis of the transmembrane binding cavity of human G-protein-coupled receptors. Proteins: Struct, Funct, Bioinf 2006, 62(2):509-538.
16. Rasmussen SGF, Choi H-J, Rosenbaum DM, Kobilka TS, Thian FS, Edwards PC, Burghammer M, Ratnala VRP, Sanishvili R, Fischetti RF, et al.: Crystal structure of the human β2 adrenergic G-protein-coupled receptor. Nature 2007, 450(7168):383-387.
17. Gloriam DE, Foord SM, Blaney FE, Garland SL: Definition of the G Protein-Coupled Receptor Transmembrane Bundle Binding Pocket and Calculation of Receptor Similarities for Drug Design. J Med Chem 2009, 52(14):4429-4442.
18. Bender A, Jenkins JL, Glick M, Deng Z, Nettles JH, Davies JW: "Bayes Affinity Fingerprints" Improve Retrieval Rates in Virtual Screening and Define Orthogonal Bioactivity Space: When Are Multitarget Drugs a Feasible Concept? J Chem Inf Model 2006, 46(6):2445-2456.
19. Bender A, Scheiber J, Glick M, Davies JW, Azzaoui K, Hamon J, Urban L, Whitebread S, Jenkins JL: Analysis of Pharmacology Data and the Prediction of Adverse Drug Reactions and Off-Target Effects from Chemical Structure. ChemMedChem 2007, 2(6):861-873.
20. Keiser MJ, Roth BL, Armbruster BN, Ernsberger P, Irwin JJ, Shoichet BK: Relating protein pharmacology by ligand chemistry. Nat Biotech 2007, 25(2):197-206.
21. van der Horst E, Okuno Y, Bender A, IJzerman AP: Substructure Mining of GPCR Ligands Reveals Activity-Class Specific Functional Groups in an Unbiased Manner. J Chem Inf Model 2009, 49(2):348-360.
22. Borgelt C, Berthold MR: Mining Molecular Fragments: Finding Relevant Substructures of Molecules. In Proceedings of the 2002 IEEE International Conference on Data Mining: 2002 IEEE Computer Society; 2002:51-58.
23. Nijssen S, Kok JN: A quickstart in frequent structure mining can make a difference. In Proceedings of the tenth ACM SIGKDD international conference on Knowledge discovery and data mining: 2004 ACM Press, New York, USA; 2004:647-652.
24. Foord SM, Bonner TI, Neubig RR, Rosser EM, Pin J-P, Davenport AP, Spedding M, Harmar AJ: International Union of Pharmacology. XLVI. G Protein-Coupled Receptor List. Pharmacol Rev 2005, 57(2):279-288.
25. Horn F, Bettler E, Oliveira L, Campagne F, Cohen FE, Vriend G: GPCRDB information system for G protein-coupled receptors. Nucl Acids Res 2003, 31(1):294-297.
26. Baker JG: The selectivity of β-adrenoceptor antagonists at the human β1, β2 and β3 adrenoceptors. Br J Pharmacol 2005, 144(3):317-322.
27. Van Zwieten PA, Doods HN: Muscarinic receptors and drugs in cardiovascular medicine. Cardiovascular Drugs and Therapy 1995, 9(1):159-167.
28. Voigtländer U, Jöhren K, Mohr M, Raasch A, Tränkle C, Buller S, Ellis J, Höltje H-D, Mohr K: Allosteric site on muscarinic acetylcholine receptors: identification of two amino acids in the muscarinic M2 receptor that account entirely for the M2/M5 subtype selectivities of some structurally diverse allosteric ligands in N-methylscopolamine-occupied receptors. Molecular Pharmacology 2003, 64(1):21-31.
29. Okuno Y, Tamon A, Yabuuchi H, Niijima S, Minowa Y, Tonomura K, Kunimoto R, Feng C: GLIDA: GPCR ligand database for chemical genomics drug discovery database and tools update. Nucl Acids Res 2008, 36(suppl_1):D907-912.
30. Paolini GV, Shapland RHB, van Hoorn WP, Mason JS, Hopkins AL: Global mapping of pharmacological space. Nat Biotech 2006, 24(7):805-815.
31. Cuisiat S, Bourdiol N, Lacharme V, Newman-Tancredi A, Colpaert F, Vacher B: Towards a New Generation of Potential Antipsychotic Agents Combining D2 and 5-HT1A Receptor Activities. J Med Chem 2007, 50(4):865-876.
32. Lawrence AJ: Optimisation of anti-psychotic therapeutics: a balancing act? Br J Pharmacol 2007, 151(2):161-162.
33. Bondensgaard K, Ankersen M, Thogersen H, Hansen BS, Wulff BS, Bywater RP: Recognition of Privileged Structures by G-Protein Coupled Receptors. J Med Chem 2004, 47(4):888-899.
34. Schnur DM, Hermsmeier MA, Tebben AJ: Are Target-Family-Privileged Substructures Truly Privileged? J Med Chem 2006, 49(6):2000-2009.
35. Abramovitz M, Adam M, Boie Y, Carrière M-C, Denis D, Godbout C, Lamontagne S, Rochette C, Sawyer N, Tremblay NM, et al.: The utilization of recombinant prostanoid receptors to determine the affinities and selectivities of prostaglandins and related analogs. Biochim Biophys Acta, Mol Cell Biol Lipids 2000, 1483(2):285-293.
36. Pettipher R, Hansel TT, Armer R: Antagonism of the prostaglandin D2 receptors DP1 and CRTH2 as an approach to treat allergic diseases. Nat Rev Drug Discov 2007, 6(4):313-325.
37. Wang S, Gustafson E, Pang L, Qiao X, Behan J, Maguire M, Bayne M, Laz T: A Novel Hepatointestinal Leukotriene B4 Receptor. Cloning and Functional Characterization. J Biol Chem 2000, 275(52):40686-40694.
38. Yokomizo T, Izumi T, Chang K, Takuwa Y, Shimizu T: A G-protein-coupled receptor for leukotriene B4 that mediates chemotaxis. Nature 1997, 387(6633):620-624.
39. Le Crom S, Kapsimali M, Barôme P-O, Vernier P: Dopamine receptors for every species: Gene duplications and functional diversification in
Received: 4 March 2010 Accepted: 10 June 2010 Published: 10 June 2010This article is available from: http://www.biomedcentral.com/1471-2105/11/316© 2010 van der Horst et al; licensee BioMed Central Ltd. This is an Open Access article distributed under the terms of the Creative Commons Attribution License (http://creativecommons.org/licenses/by/2.0), which permits unrestricted use, distribution, and reproduction in any medium, provided the original work is properly cited.BMC Bioinformatics 2010, 11:316
van der Horst et al. BMC Bioinformatics 2010, 11:316http://www.biomedcentral.com/1471-2105/11/316
Page 12 of 12
Craniates. Journal of Structural and Functional Genomics 2003, 3(1):161-176.
40. Zhang J, Xiong B, Zhen X, Zhang A: Dopamine D1 receptor ligands: where are we now and where are we going. Med Res Rev 2009, 29(2):272-294.
41. Roth BL, Sheffler D, Potkin SG: Atypical antipsychotic drug actions: unitary or multiple mechanisms for 'atypicality'? Clinical Neuroscience Research 2003, 3(1-2):108-117.
42. Coward DM: General pharmacology of clozapine. The British Journal of Psychiatry Supplement 1992:5-11.
43. Zakon HH: Convergent Evolution on the Molecular Level. Brain, Behavior and Evolution 2002, 59(5-6):250-261.
44. Mestres J, Gregori-Puigjane E, Valverde S, Sole RV: Data completeness--the Achilles heel of drug-target networks. Nat Biotech 2008, 26(9):983-984.
45. Bemis GW, Murcko MA: The Properties of Known Drugs. 1. Molecular Frameworks. J Med Chem 1996, 39(15):2887-2893.
46. van der Horst E, IJzerman AP: Computational Approaches to Fragment and Substructure Discovery and Evaluation. In Fragment-Based Drug Discovery: A Practical Approach Edited by: Zartler ER, Shapiro J, Chichester M. West Sussex, U.K.: John Wiley & Sons, Ltd; 2008.
47. Bernasconi P, Min C, Galasinski S, Popa-Burke I, Bobasheva A, Coudurier L, Birkos S, Hallam R, Janzen WP: A Chemogenomic Analysis of the Human Proteome: Application to Enzyme Families. J Biomol Screen 2007, 12(7):972-982.
48. ChEMBL [http://www.ebi.ac.uk/chembl/]49. Roth BL, Lopez E, Beischel S, Westkaemper RB, Evans JM: Screening the
receptorome to discover the molecular targets for plant-derived psychoactive compounds: a novel approach for CNS drug discovery. Pharmacol Ther 2004, 102(2):99-110.
50. The UniProt Consortium: The Universal Protein Resource (UniProt). Nucl Acids Res 2008, 36(suppl_1):D190-195.
51. Wheeler DL, Barrett T, Benson DA, Bryant SH, Canese K, Chetvernin V, Church DM, DiCuccio M, Edgar R, Federhen S, et al.: Database resources of the National Center for Biotechnology Information. Nucl Acids Res 2008:D13-D21.
52. Wishart DS, Knox C, Guo AC, Shrivastava S, Hassanali M, Stothard P, Chang Z, Woolsey J: DrugBank: a comprehensive resource for in silico drug discovery and exploration. Nucl Acids Res 2006, 34(suppl_1):D668-672.
53. GPCRDB [http://www.gpcr.org/7tm/]54. GASTON [http://www.liacs.nl/~snijssen/gaston/]55. Wörlein M, Meinl T, Fischer I, Philippsen M: A Quantitative Comparison of
the Subgraph Miners MoFa, gSpan, FFSM, and Gaston. Knowledge Discovery in Databases: PKDD 2005 2005:392-403.
56. Agrawal R, Srikant R: Fast Algorithms for Mining Association Rules in Large Databases. In Proceedings of the 20th International Conference on Very Large Data Bases: September 12 - 15 1994 Morgan Kaufmann Publishers, San Francisco, CA; 1994:487-499.
57. Felsenstein J: PHYLIP (Phylogeny Inference Package) version 3.6. Distributed by the author. Department of Genome Sciences, University of Washington, Seattle. 2005.
58. Tamura K, Dudley J, Nei M, Kumar S: MEGA4: Molecular Evolutionary Genetics Analysis (MEGA) Software Version 4.0. Mol Biol Evol 2007, 24(8):1596-1599.
59. Garr CD, Peterson JR, Schultz L, Oliver AR, Underiner TL, Cramer RD, Ferguson AM, Lawless MS, Patterson DE: Solution Phase Synthesis of Chemical Libraries for Lead Discovery. J Biomol Screen 1996, 1(4):179-186.
doi: 10.1186/1471-2105-11-316Cite this article as: van der Horst et al., A novel chemogenomics analysis of G protein-coupled receptors (GPCRs) and their ligands: a potential strategy for receptor de-orphanization BMC Bioinformatics 2010, 11:316