Embed Size (px)
Citation preview

Med J Malaysia Vol 61 Supplement B December 2006 41
Introduction
Reliable and accurate prediction of the normal handgrip strength value is important in determining theresults of treatment in patients with hand relatedproblems1. The Jamar® dynamometer has been citedin numerous journals at the standard instrument for themeasurement of grip strength2. It has also been provento be more accurate than previous dynamometers3.Following the manufacturer’s protocol of assessment,maximum grip strength measurement (commonlyknown also as maximal voluntary contraction or MVC),is the most common test administered when using this
device. A reference chart (Figure 3) supplied togetherwith the Jamar® dynamometer gives an estimationvalue of what is expected of grip strength in a normalindividual.
Despite its reputation of being reliable and accurate,we came to question this technique of collecting datato be suitable for our local population due to severalfactors. Firstly, the chart provided with the Jamar®only used age as a predictor to the amount of gripstrength generated whereas it is known that severalother factors play a role4. Secondly, the manufacturer
A Novel and Improved Method of Predicting HandGrip Strength in the Adult Malaysian Population
ORIGINAL ARTICLE
Corresponding Author: Tunku Kamarul Zaman, Department of Orthopaedic Surgery, Faculty of Medicine, Lembah Pantai, 50603Kuala Lumpur, Malaysia
T Kamarul, MS (Orth)*, T Sara Ahmad, FRCS*, MS (Orth)*, William Y C Loh, FRCS**
*Hand and Microsurgery Unit, Department of Orthopaedic Surgery, University Malaya, Kuala Lumpur, **Department of OrthopaedicSurgery, Southport District General Hospital, Town Lane, New, Southport, Merseyside PR8 6PN, United Kingdom
Summary
Hand grip strength measurement is a recognized part of hand function assessment. The standard measurementusing the Jamar® dynamometer and comparing these results to the recommended normal values suggested by themanufacturers of the Jamar® was questioned as these values were based on Western population. A studycomparing a novel method of predicting grip strength using our software was conducted on 25 normal subjectsusing the LIDO® kinetic workset (Group A and B ). These results were then compared against our predictivesoftware (Group A) and the expected values supplied together with the Jamar® Dynamometer (Group B). Inanother group, 22 normal subjects were tested using the Jamar® (Group C and D) and then matched against thepredicted values using their recommended chart (Group C). The last group (Group D) was tested using the Jamar®but the values attained were compared to the results from our software. In group A, the predictability of ourpredictive method was 100% (both R & L) as compared to (R=64%, L=68%) in group B, (R=27.3%, L=59.1%) in groupC and (R=81.8%, L=86.4%) in group D. The differences between the predictability of both methods were statisticallysignificant. The data collected using both the Jamar and the LIDO® kinetic workset correlated well to the data fromour software but not to the values suggested by the manufacturers of Jamar®. We conclude that our method ofpredicting hand grip values are superior to that suggested by the manufacturers of dynamometers. The standardreference for hand grip strength provided by the manufacturers is less accurate in predicting the grip strength ofour local population.
Key Words: Hand grip strength, Normative values

ORIGINAL ARTICLE
42 Med J Malaysia Vol 61 Supplement B December 2006
the LIDO® kinetic workset with their grip resultscompared to our predictive software while Group Cconsist of another 22 normal subjects tested using theJamar® dynamometer and compared with the tableprovided by Jamar®. Group B consist of subjects ingroup A who have had their grip strength measuredusing the LIDO® kinetic workset but were comparedagainst the suggested values provided by the Jamar®.In contrast, group D is made up of subjects from groupC that were tested using the Jamar® but the datacollected were compared to the values from ourpredictive software. A summary is seen in Table I.
All subjects consist of volunteers who were selectedrandomly by a dedicated technician who alsoadministers the tests and questionnaires. A strictexclusion criteria excluding subjects with hand relatedproblems, previous injuries, neurological disorders andany medical conditions was adhered to. Measurementsof the grip strength of all these subjects were done inthe manner recommended by the manufacturers of theJamar. Subjects were tested seating down, shouldersadducted and elbow flexed at 90o. Position 3 is usedon the Jamar. Subjects tested using the LIDO kineticworkset followed an almost similar protocol to theJamar. However, instead of one static value which isattained via a mechanical dial as in the Jamar, the LIDOkinetic workset uses a computer to collect continuousdynamic data with each grip. Subjects grasp the handleof the LIDO kinetic workset for five seconds durationfollowed by a five second break before the next grip.A complete one minute repetitive cycle of grip andrelax is observed. The maximal voluntary contraction(MVC) of the grip produced is then recorded from thedata generated. The grip handle on the LIDO ispositioned so as the metacarpophalangeal joint is inextension and the proximal and distal inter-phalangealjoints are in 90o flexion. MVC of both the Jamar and theLIDO were measured by looking at the peak of the dialin the Jamar (Figure 4) and the peak of the graph of thefirst three grips in the LIDO (Figure 2). The highestvalue is then taken as the value of MVC.
The software we developed was based on hand gripvalues attained from 412 normal individuals, 212 malesand 200 females2,5. This data were collected using theLIDO kinetic workset. The grip protocol used wassimilar to the original protocol. Unlike the Jamar, thegrip span for this machine is adjustable to any positionwith 0.5cm increments. To standardize the grip spanfor our subjects, the handle of the LIDO is adjusted sothat the all our subjects grip the handle with the PIPJ ofthe index finger flexed at 90° and the MCPJ of the index
based their recommended values collected fromWestern population which are generally bigger in sizethan the Asian population. This in turn would implythat within the same age group, the Western populationwould have higher grip strength. Thirdly, the grip spanused in the Jamar was not set at a fixed distancealthough certain researchers recommend the grip to beat position 3 (which is at 4.7cm). The values attained inthe reference chart (diagram) are the result of griptaken from subjects with the grip at the subject’scomfortable position. There is no mention of any othermethods of positioning the grip handle other than thefive positions available on the device. These gripvalues were not applicable to other grip spanstherefore in our sample population which has a smallgrip span; the values attained may no longer to beaccurate4.
We put our hypothesis to the test by conducting a studyusing our own predictive software to determine theexpected grip strength based on age, hand dominance,sex, weight and height using the LIDO® kineticworkset as a measuring tool 2,5. This software wascreated based on 412 normal subjects who were ofdifferent sex, age and sizes2,5. In comparison, we testedthe Jamar’s predictability of grip strength based on themanufacturer’s recommendations and instructions. Intesting the reliability of both devices, we cross examinethe values attained from each of these machines andcompared them using two references (our predictivesoftware versus the normal grip range provided by themanufacturer’s of Jamar). The first one compares thegrip strengths against the predicted values from oursoftware and the second is with the values suggestedby the manufacturers of the Jamar®. The objectives ofour study to prove that the grip strength of ourpopulation is lower than that described by Westernliterature and that our technique of predicting normalgrip strength is far superior than conventionallydescribed methods are discussed in the present paper.
Materials and Methods
Forty seven (n=47) normal subjects were recruited forthis study. There were two main groups tested: TheLIDO group consisted of subjects tested using the LIDOkinetic workset and the JAMAR group consisted ofsubjects tested using the Jamar dynamometer. Twofurther sub-groups were created for ease ofcomparison. The LIDO group consisted of Group Aand B, while the JAMAR group consisted of group Cand D. Group A had 25 normal subjects tested using

A Novel and Improved Method of Predicting Hand Grip Strength in the Adult Malaysian Population
Med J Malaysia Vol 61 Supplement B December 2006 43
finger extended at 0°. The shoulders in these subjectswere also adducted and elbows flexed at 900.Following our statistical analysis, we found that therewere statistical correlation between grip strength andage, hand dominance, sex, height and weight 2, 5. Thisprompted us to develop a series of hand grip patternbased on our finding. During an evaluation of subjectsgrip strength, this software will prompt a series ofinputs that best describes the individual we are testing(Figure 1). After keying in the necessary information,a grip pattern based on the average values of theindividuals that have similar descriptions from ourseries will emerge. The values attained from the testedindividuals are then compared to the values predictedby the software. A value which is within the limitspredicted by the software is interpreted as normal(Figure 2).
The normal reference values provided together withthe Jamar® were easier to use. Based on the subject’sage and sex, a chart incorporating a range of expectedMVC strengths are provided. Grip strength (MVC)within the suggested values is considered normal.Subjects are required to grasp the handle of the Jamar®three times with either the average or highest valuetaken as the MVC. It is worth noting that this chartdoes not take into consideration other factors such assize and hand dominance as a predictor (Figure 3).
Results
There were 25 subjects tested using the LIDO kineticworkset for group A and B and 22 subjects tested usingthe JAMAR in group C and D. There were 12 male and13 female subjects aged between 20 to 57 years (meanage=36.6) in group A and B. In groups C and D therewere 9 males and 13 females with the mean age of 33.9years. There were no significant differences (one-wayANOVA test and independent t-test) in age, height,weight, and the mean grip strength of both handsbetween the LIDO and Jamar group. All subjects testedin both groups were right handed.
Overall, our predictive software faired better inpredicting normal grip strength across the boardregardless of the device used to measure the gripstrength (Table II). By using our predictive softwarewith the LIDO kinetic workset, we were able to predictthe average grip strength accurately in all our subjects.In comparison, the predictive ability of using the Jamardynamometer with the Jamar chart provided only fairedbetween 32 to 64% sensitivity for determining normal
grip strength. In the cross over groups (Results attainedfrom the LIDO kinetic workset compared to Jamarchart and vice versa), The use of our predictivesoftware appeared to be superior with predictability ofnormal grip strength in 82-86% of subjects as comparedto using the Jamar chart which was only between 64-68%.
Using McNemar (non-parametric) test, there weresignificance difference noted between the predictabilityof using the Jamar chart and our predictive software (pvalue < 0.01) in both groups comparing the same hand.This however, was not seen by comparing the left handin the Jamar group (Table III). In this group, the abilityof grip strength prediction between using ourpredictive software and the Jamar chart was notsignificantly different (86% vs. 59%). Between theLIDO group and the Jamar group, using a non-parametric Kendall W test, there were significantdifferences noted in the ability to predict normality inthe grip strength of both hands using either the Jamarchart or our predictive software (p value < 0.001).Notably, in each of our Chi Square test (testing the gripstrength of each hand, and comparing results attainedfrom both instruments), there were significantdifferences between the results attained by using ourpredictive software (p value<0.001) but not by usingthe Jamar chart. It is noted that in the groups using theJamar chart, the percentage of predicting normalitywere also low. In reviewing the results of predictability(in Table II and III), we can deduce that by using ourpredictive software, the ability of predicting positivetests were high enough to differentiate normal fromabnormal grip strength. However, by using the Jamarchart, the positive results attained cannot bedifferentiated between the normal and abnormalresults, resulting in high number of false negativeresults being reported.
Discussion
The knowledge of normative values is of paramountimportance as they serve as the reference point todistinguish between normality and abnormality.Together with the proper, valid, accurate and reliableevaluation of hand grip strength measurement, theeffectiveness of any surgical and non-surgicalinterventions of hand problems can be monitored andcompared. In addition, normative data are needed tointerpret evaluation data; to set realistic treatment goals;and to assess a patient's ability to return toemployment.

ORIGINAL ARTICLE
44 Med J Malaysia Vol 61 Supplement B December 2006
Group Description No. of subjectsA Subjects were tested using the LIDO and the data attained was compared to the (n=25)
values suggested by our predictive software M ale=12Female 13
B Subjects were tested using the LIDO and the data attained was compared to the (n=25)values suggested by the values suggested by the manufacturers of the Jamar Male=12
Female 13C Subjects were tested using the Jamar and the data attained was compared to the (n=22)
values suggested by the values suggested by the manufacturers of the Jamar Male=9Female 13
D Subjects were tested using the Jamar and the data attained was compared to the (n=22)values suggested by our predictive software M ale=9
Female 13
Table I: Groups A and B were the same test subjects tested only once using the LIDO. Groups C and D were from thesame test subjects but were different from groups A and B. Because two different predictive methods are being
tested while the device remains the same, subjects needs to be derived from the same population sampling.
LIDO group Jamar group(n=25) (n=22)
A B C D(using predictive (Using the chart (Using the chart (using predictive
software) provided by Jamar) provided by Jamar) software)R hand 100* 64* 27.3* 81.8*L hand 100* 68* 59.1* 86.4*
* represent the values in percentage of the samples that were tested and found to be within the predictive values.
Table II: The results presented in this table cross-tabulate the results attained by examining normal subjects using theLIDO kinetic workset of the Jamar dynamometer. These results were then compared to determine normality using
using our predictive software or the Jamar chart as reference. The values within the boxes represent the percentageof cases noted to be predictive in respect to the Jamar reference charts/ predictive software used.
LIDO group JAMAR groupComparison between Jamar chart & our Left hand Right hand Left hand Right handpredictive software(McNemar test) P value 0.008 0.004 0.146 0.008
Table III: The table shows the results of McNemar (non-parametric) test to compare between the Jamar chart and ourpredictive software in each group and each hand.
A Novel and Improved Method of Predicting Hand Grip Strength in the Adult Malaysian Population
Med J Malaysia Vol 61 Supplement B December 2006 45
Fig. 1: The front page of the predictive software usedfor this study.
Fig. 2: The values (parameters) of the subjects areselected as seen in circle 1, following that theexpected results are then predicted as graphsand tables. Only the values of the first 3 and theaverage are taken (as in circle 2). This is tostandardize the method used to attain results assuggested by the chart provided by themanufacturers of the Jamar dynamometer.Note that although not used in this study, grippatterns can also be attained from thissoftware.
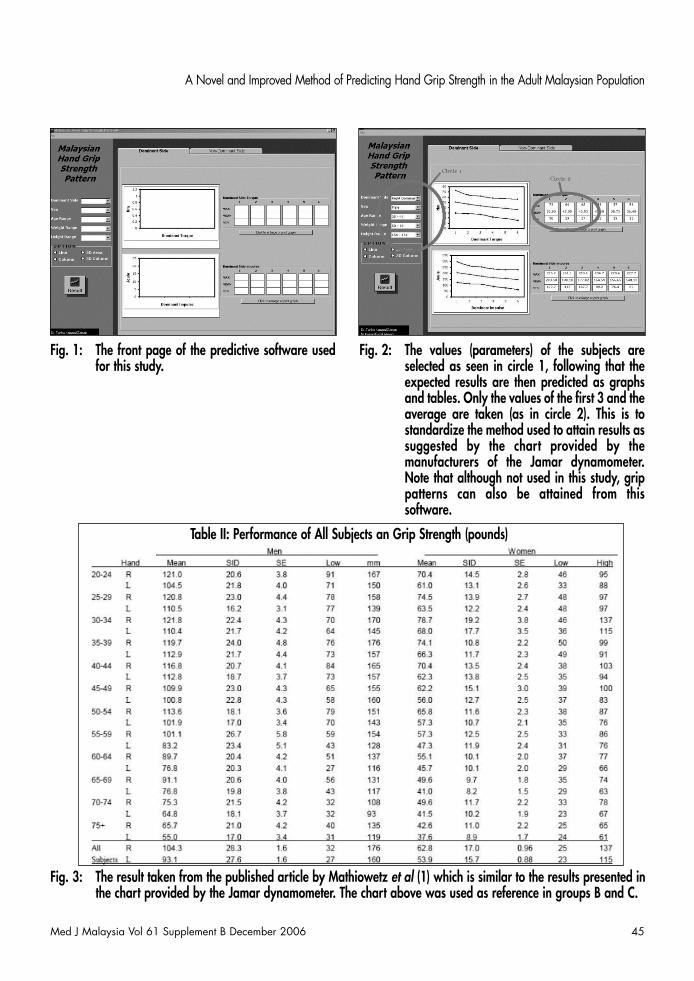
Fig. 3: The result taken from the published article by Mathiowetz et al (1) which is similar to the results presented inthe chart provided by the Jamar dynamometer. The chart above was used as reference in groups B and C.
Table II: Performance of All Subjects an Grip Strength (pounds)

ORIGINAL ARTICLE
46 Med J Malaysia Vol 61 Supplement B December 2006
Fig. 4: The picture above left is an example of the Jamar used in this study. The picture above right is the LIDO kineticworkset was used in creating our predictive values and subject testing.
The most common norms for grip and pinch strengthused in therapy clinics were compiled by Mathiowetz etal with the first published results seen in 19851. Theuse of the Jamar dynamometer was fully described andwas made as the reference chart of most hand clinics inMalaysia even today. Little did most physicians andtherapists realize that these data were created fromAmerican (western) population which may notrepresent the hand grip strength of our localpopulation. Furthermore these values did not take intoconsideration of the influence of hand dominance as apredictor1. In a similar study by Kamarul et al5 therehave been statistical significances noted in the gripstrength of different hand dominance and should beconsidered as a valid predictor. Our study usingrandomized control groups comparing the differentequipments and different predicting methods haveclearly demonstrated that the use of local data andbetter predicting charts were much superior toconventional means of predicting hand grip strength.This also proves that the use of sex and age aspredictors alone is not sufficient in determining thenormal grip strength. In a related research conductedby Kamarul et al, the determination of grip strength wasmore predictive if hand dominance, occupation, heightand weight were also considered (r square value of0.11-0.29 for height and weight as compared 0.2 forsex)2. The predictability of grip strength using sex,height, weight, and age and hand dominance was alsonoted by Hanten et al4.
Other results which are largely used are the likes ofKellor's group7 which sampled 250 individuals in three
large age groups. Regression analysis was performedto predict the amount of right hand (RH) or left hand(LH) strength an individual of a given sex and particularage would demonstrate. Since few left-handed subjectswere tested, their scores were combined with those ofright-handed subjects. No standardized positioning orinstructions were followed. Test-retest and inter-raterreliability data were not reported. The Osco meterused in their study is no longer commercially availableand them is some question whether data from use ofthe newer dynamometers can be validly compared totheir norms.
The Jamar was thought to be the best equipment forgathering hand grip strength data due to it robust andsimple design. More importantly it was claimed to bean accurate and reliable device for hand grip strengthmeasurements9,10. However, in this study, it is evidentthat data source and data interpretation plays as mucha crucial role in determining the accuracy of predictingnormal values as a valid and accurate measuringdevice. It is therefore important that local datarepresenting the normal value of a study population orpatients be made available to health workers. Thismove will greatly reduce the inaccuracies of datapresentation and misinterpretations.
Using data from a previous study, we examined handgrip strength data obtained from our local populationand compared them with values obtained from Westernpopulation 2,5. Our method of grip strength hadadvantages over the simple method of grip strengthprediction described by the manufacturers of the Jamar;

A Novel and Improved Method of Predicting Hand Grip Strength in the Adult Malaysian Population
Med J Malaysia Vol 61 Supplement B December 2006 47
which only employs sex, age and hand side aspredictive factors. In our predictive method, inaddition to these parameters, we also used handdominance, height and weight as confounding factors.As a result, the values obtained for hand grip predictionare more predictive and specific to the population thatis being tested.
Other authors have also described the use of thenormal side as a predictor of the expected grip strengthof the abnormal side. In general, the right hand isapproximately 10% stronger than the left. By using thisrule, one can predict the normal strength of a grip bycomparing to the other. However, this method ofprediction has its limitations. Firstly, in a studyconducted earlier we found that although the righthand is approximately 10% stronger than the left (12.1%in male and 11.0% in female) there is a variance ofbetween 9.1 to 9.6% in different individuals 6.Secondly, it is only predictable if the individual has anormal side to compare to and cannot be used inpatients with injuries involving both hands.Furthermore it has been reported that measured gripand pinch strengths in non-manual, light manual andheavy manual workers using a Jamar dynamometer anda pinch measuring device had significant and variableside to side difference. Heavy manual workers had thestrongest grips with the least difference between sides.Office workers had the weakest grips and the greatestdifference between sides. Light manual workers werebetween these two groups. Consequently, theoccupation of the patient must be taken into accountwhen using grip and pinch strength measurements toassess the need for rehabilitation and in medico-legalreports11. The issue of whether hand dominance is ofinfluence to grip strength remains a contentious one.While some authors do not feel that there aredifferences between left and right hand dominantgroup1,3,11 others have proved otherwise2,4,5,7,12. It hasbeen found that in left hand dominant individuals, thedominant hand (left hand) had the same grip strengthas compared to the right in 50% of this population.Other studies showed that the average grip strength ofthe dominant hand in left handed subjects were
higher2. Thus, this rule predicting one hand bycomparing to the other cannot be justified12. It isinteresting to note that in one paper, the authorsattempted to create an equation to predict hand gripstrength. However, even these authors found that thesimple and full model equations for handgrip strengthwere less predictive in adults13.
Some limitations have been noted in the studyconducted in the present report. Due to time andfinancial constraints, we were unable to recruit moresubjects for this study comprising of subjects withdifferent test parameters. This would allow us to studythe significant impact our prediction method has onsubjects of different occupations, race etc. To preventbiased sample in favor of higher hand strength scores,there was an attempt to avoid a competitiveatmosphere at the testing sites. However, we were notable to validate this is in our study. Furthermore, ourresearch method only assumed that the subjectsrecruited for our study were of normal population andwas not able to eliminate some errors that may result ifany abnormality occurred among our subjects that maynot have been detected during the screening process.This was of course, despite careful screening ofsubjects. It would also be important that future studiesshould include testing for negative controls as it wouldhelp to determine the number of false positive (falsenormal) results that may have generated from usingboth methods.
Conclusion
Normative data of hand grip strength is important todetermine abnormalities in hand grip function.Improper data will result in data misinterpretation thusresulting in high numbers of misreporting. Dataprovided by the manufacturers of the JAMAR, themethod of data collection and hand grip predictionmethod is less reliable when applied to our localpopulation. Having local data as a reference ratherthan western data, grip strength prediction would havebetter accuracy if other factors such are weight, height,and hand dominance were also considered.

ORIGINAL ARTICLE
48 Med J Malaysia Vol 61 Supplement B December 2006
References
1. Mathiowetz V, Kashman N, Volland G, Weber K, Dowe M,Rogers S. Grip and pinch strength: Normative data foradults. Arch Phys Med. Rehabil. 1985; 66: 69-72.
2. T Kamarul, T Sara Ahmad, Loh W Y C. Normal Hand gripstrength in the adult Malaysian population. J Orth Sur.2006; 14(2): 122-7.
3. Harkonen R, Harju R, Alaranta H. Accuracy of the Jamardynamometer. J Hand Ther. 1993; 6(4): 259-62.
4. Hanten WP, Chen WY, Austin AA, Brooks RE, Carter HC,Law CA, Morgan MK, Sanders DJ, Swan CA, VandersliceAL. Maximum grip strength in normal subjects from 20to 64 years of age. J Hand Ther. 1999; 12(3): 193-200.
5. T Kamarul, T Sara Ahmad, William Y C Loh. NormalMalaysian hand grip strength. The Journal of the AseanOrthopaedics Association. 2005: 17(1); 31-33.
6. T Kamarul. Hand grip strength pattern in the adultMalaysian population. Scientific report written for Mastersof Orthopaedic Surgery, Department of OrthopaedicSurgery University Malaya. 2003.
7. Kellor M. Frost J. Silberberg N. Iversen 1. Cummings R:Hand strength and dexterity. Am J Occup Ther 1971; 25:7743.
8. Fess EE. Moran C: Clinical Assessment Recommendations,in. dianapolis. American Society of Hand Therapists,1981.
9. Mathiowetz V. Weber K, Volland G. Kashman N:Reliability and validity of hand strength evaluation. JHand Surg 9A: 222-1994.
10. Kirkpatrick JE: Evaluation of grip loss. Calif Med 1956; 95:314-20.
11. Josty IC, Tyler MP, Shewell PC, Roberts AH. Grip andpinch strength variations in different types of workers. JHand Surg [Br]. 1997; 22(2): 266-9.
12. Crosby CA, Wehbe MA, Mawr B. Hand strength:normative values. J Hand Surg [Am]. 1995; 20(6): 1057-8.
13. Vaz M, Hunsberger S, Diffey B. Prediction equations forhandgrip strength in healthy Indian male and femalesubjects encompassing a wide age range. Ann Hum Biol.2002; 29 (2): 131-41.