Embed Size (px)
Citation preview

April 2012 SPE Economics & Management 69
A Note on Sources of CO2 Supply for Enhanced-Oil-Recovery Operations
P. DiPietro and P. Balash, National Energy Technology Laboratory, and M. Wallace, Advanced Resources International
Copyright © 2012 Society of Petroleum Engineers
Original manuscript received for review 10 May 2011. Revised manuscript received 10 November 2011. Paper (EM-1111-0002) peer approved 13 March 2012.
SummaryThis paper presents compiled information on sources of carbon dioxide (CO2) for enhanced-oil-recovery (EOR) operations in the United States. CO2 supply in 2010 was 58 Mt. Production from nat-ural sources accounted for 85% of the 2010 CO2 supply, and esti-mates of reserves are large enough to support the level of growing CO2-production rates for several decades. Natural-gas processing accounted for 13% of the 2010 supply and is dominated by Exxon- Mobil’s facility in LaBarge, Wyoming. A significant number of CO2-supply projects have become operational recently, are under construction, or are in the final stages of design and financing. The forecast rate of CO2 supply in 2015 is 93 Mt/a of CO2, a 60% increase over the 2010 level. Hydrocarbon-conversion facilities with CO2 capture account for 36% of the projected growth between 2010 and 2015.
BackgroundIn 2010, CO2 EOR provided 280,000 B/D of crude oil, or 5% of domestic supply (Moritis 2010, Energy Information Administra-tion 2011). Sources of CO2 are organized into three categories.
1. Natural sources—naturally occurring underground accumula-tions, where the produced gas is primarily CO2 (90% or higher).
2. Natural-gas processing—naturally occurring underground accumulations, where the produced gas contains significant amounts of methane.
3. Hydrocarbon conversion—industrial processes in which a hydrocarbon feedstock (coal or crude oil) is converted into a higher-value product or slate of products and exhaust CO2 is captured.
Fig. 1 shows the supply from the three source types in 2000 and 2010, and a projection for supply in 2015 based on known projects that are newly deployed, under construction, or in final design.
Natural SourcesTable 1 presents summary data on nine major CO2-bearing source fields in the United States. It is an update and expansion of an earlier, similar compilation of natural CO2 sources (Stevens et. al. 2001). Five of the reservoirs are established and are supplying CO2 to EOR floods, and four are in the initial, exploratory stages.
The production rates from Sheep Mountain and Bravo in 2010 are less than in 2000, but production from the other sources is steady or increasing. The rate of production from Jackson Dome increased 17-fold between 2000 and 2010 and is now approaching that of McElmo.
The future level of supply from natural sources of CO2 is dif-ficult to predict. The sum of the reserves estimates for the nine reservoirs is 2.2 billion t, equivalent to 45 years of supply at the current rate of production. However, one-quarter of the reserves estimates is from the four fields that are in the initial stages of development. All of the developmental fields (Kevin, St. John’s, Escalante, and Gordon Creek) will require pipeline infrastructure to access EOR targets. Two formations, Bravo and St. John’s, are shallow and will tend to have lower wellhead pressure and higher plant-gate-production cost than other natural sources. Counter-
balancing these factors is the possibility of new discoveries or of upwardly revised reserves estimates at known reservoirs.
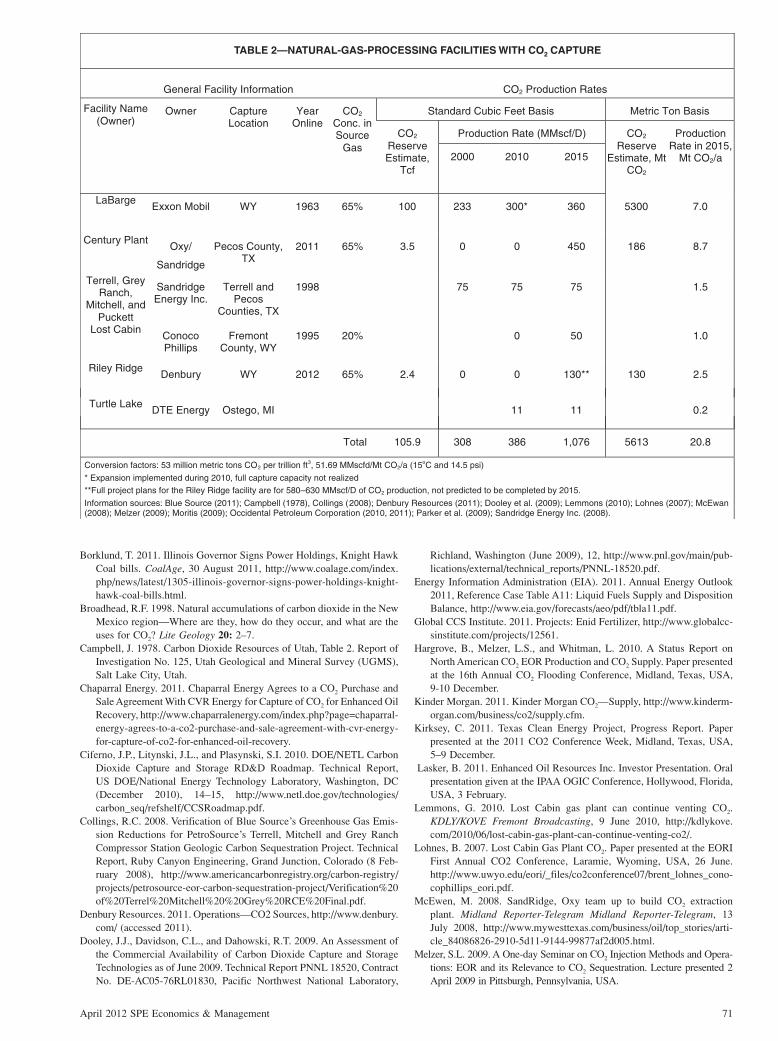
Natural-Gas ProcessingTable 2 shows sources of CO2 from natural-gas processing and sets forth a forecast for the CO2-production rate in 2015. Production from natural-gas processing in 2010 was 7.5 Mt of CO2, or 13% of total CO2 supply. The expanded capture facility at LaBarge supplied approximately 5.8 Mt of CO2 in 2010 and draws from an enormous reserve of 5.3 billion Mt of CO2. Sandridge Energy Incorporated and Occidental Petroleum Corporation recently deployed the Cen-tury Plant in Pecos County, Texas (Occidental Petroleum Corpora-tion 2011). When both trains at the Century Plant are operational, it will provide 8.7 Mt/a of captured CO2. Denbury Resources is building a natural-gas-processing plant at Riley Ridge, north of Labarge in Wyoming. The Riley Ridge facility will add 2.5 Mta of CO2 supply beginning in 2012 and may provide up to 12 Mt/a of CO2 when fully deployed. Three of the facilities, LaBarge, Century, and Riley Ridge, process a gas stream that contains approximately 65% CO2.
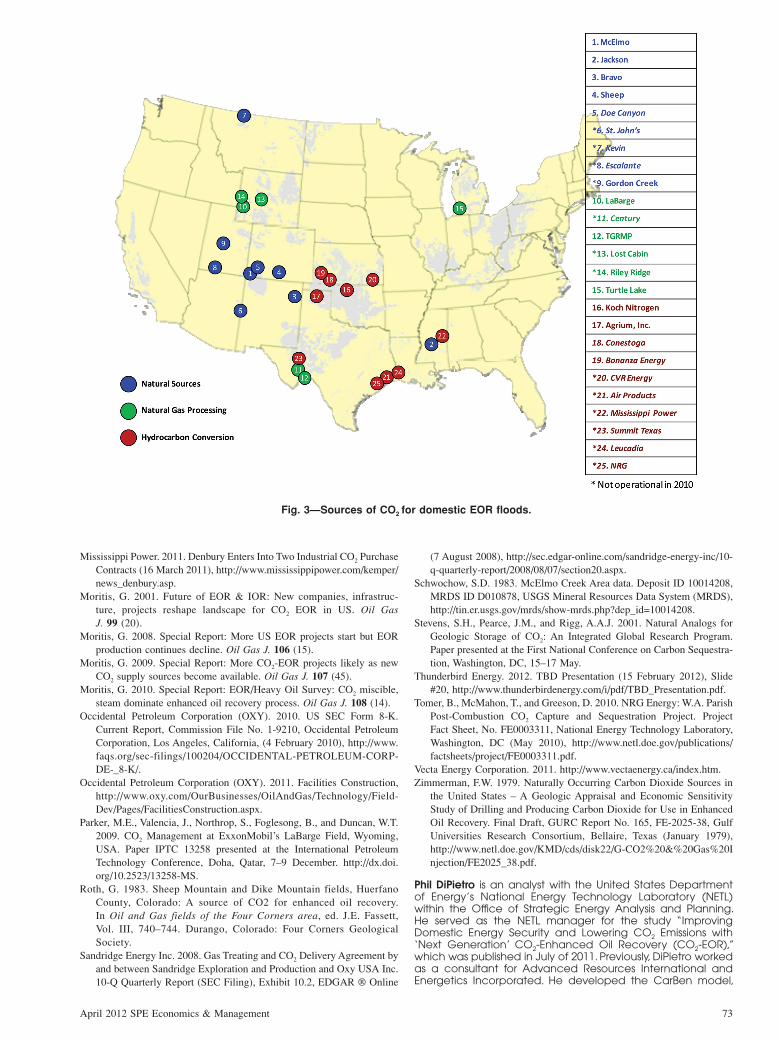
Fig. 2 is a map of the CO2 sources contained in Tables 1 and 2. Two sources of recent growth in CO2 supply, the Jackson Dome (No. 2) and the Century natural-gas-processing plant (No. 11), are in ideal locations relative to oil-bearing formations. Doe Canyon (No. 5), St John’s (No. 6), and Escalante (No. 8) are in the same general region as Sheep Mountain and Bravo and could plausibly make up for decline in production rates from those two fields. The LaBarge expansion, the Riley Ridge deployment, and the refurbishment project at Lost Cabin indicate growth in CO2 EOR production from the Rocky Mountain region.
Hydrocarbon ConversionThe third category of CO2 supply is hydrocarbon-conversion facili-ties with CO2 capture. Table 3 shows that after a 30-year hiatus with no new facilities, there are eight projects either recently deployed, under construction, or in design. The Dakota Gasification Facility is not included because it supplies a CO2 EOR operation in Canada. A number of other projects in early stages of planning and design are not included in Table 3 because they are expected to come on line after 2015. These include a coal-to-liquids facility in Wyo-ming, a synthetic natural gas plant in Illinois, and an ammonia/ urea facility in California (Bleizeffer 2012; Borklund 2011; Tomer et al. 2010).
Fig. 3 is the map shown in Fig. 2 with the hydrocarbon-conver-sion sources added. The hydrocarbon-conversion sources tend to be located near established underground sources, apparently taking advantage of existing pipeline infrastructure.
The data show significant growth in CO2 supply over the past 10 years and most likely in the near future. The 2015 forecast shows an increasing role for anthropogenic sources of CO2.
ReferencesAhmad, S. 2010. Ethanol plant to sequester CO2 emissions. The Garden
City Telegram, 13 March 2010, http://www.gctelegram.com/News/ ethanol-plant-carbon-sequestration-3-13-10.
Allis, R., Chidsey, T., Gwynn, W., et al. 2001. Natural CO2 Reservoirs on the Colorado Plateau and Southern Rocky Mountains: Candidates for CO2 Sequestration. Proc., First National Conference on Carbon Sequestration, Washington, DC, 14–17 May, Session 6A.

70 April 2012 SPE Economics & Management
Allison, M.L., Blackett, R.E., Chidsey, T.C. Jr., Tabet, D.E., Gloyn, R.W., and Bishop, C.E. 1997. A Preliminary Assessment of Energy and Mineral Resources within the Grand Staircase—Escalante National Monument. Technical Report, UGS Circular 93, Utah Geological Survey, (January 1997), http://geology.utah.gov/online/c/c-93/index.htm.
Bleizeffer, D. 2012. Safe Bet? Wyo officials weigh investment in DKRW’s coal-to-liquids proposal. WyoFile, 14 February 2012, http://wyofile.com/2012/02/safe-bet-wyo-officials-assess-coal-to-liquids-prospects/.
Blue Source. 2011. Val Verde CO2 Pipeline – Carbon Capture and Storage Eliminates 2 Million Tonnes of CO2 Emissions Each Year, http://www.ghgworks.com/4c-valverde.html.
Natural Sources Natural-Gas Processing Hydrocarbon Conversion
33
58
120
100
80
60
40
20
0
2000 2010 2015
Mt/
a o
f C
O2
93
Fig. 1—Sources of CO2 supply for EOR operations in the United States.
TABLE 1—NATURAL SOURCES OF CO2 IN THE UNITED STATES
Formation Name State
Discover Year
Depth of Producing
Zone,ft
CO2
Purity vol %
Other Species Operator
Original CO2 in Place,
Tcf
Cum. CO2
Prodn Thru 2010,
Tcf
Current CO2
Reserve,
Tcf
Production Rate, MMscf/D
Metric Ton Basis
Current CO2
Reserves
(Mt)
Production Rate,
Mt/a
in 2015 2000 2010 2015
In P
rodu
ctio
n
McElmo Dome CO 1944 8,000 98% N2 Kinder Morgan,
ExxonMobil
30 7.2 10 840 1,150 1,230 530 24
Jackson Dome MS ~1960 16,000 70-99%
H2S Denbury 1.8 11 55 930 1,300 594 25
Bravo Dome NM 1916 2,300 99% N2 KM, Occidental, Amerada H.
30 2.9 8 350 290 260 424 5.0
Sheep Mountain
CO 1971 3,500–6,000
97% N2, CH4 Occidental 15 1.3 Nearly depleted
70 50 30 0 0.6
Doe Canyon Deep
CO 9,000 Kinder Morgan
1.5 0.09 0.75 110 170 40 3.3
Und
er D
evel
opm
ent
St. John’s NM 1994 1,600 95% He 0.75%
Kinder Morgan
16 8.2 435
Kevin Dome MO ~1960 4,000 93% N2, CH4, He
Vecta Oil & Gas
6 0.7 37
Escalante Anticline
UT 1960 93– 99%
1.0 53
Gordon Creek UT 1947 11,000-13,000
99%+ N2, CH4 ThunderbirdEnergy
1.5 80 1.4
Totals 13 41 1,315 2,530 2,990 2192 58 Conversion factors: 53 million metric tons CO2 per trillion ft3, 51.69 MMscfd/Mt CO2/a (15oC and 14.5 psi)
Information sources: Allis et. al. (2001); Broadhead (1998); Denbury Resources (2011); Allison et al. (1997); Hargrove et al. (2010); Kinder Morgan (2011); Lasker (2011); Moritis (2001); Roth (1983); Schwochow (1983); Thunderbird Energy (2012), Vecta Energy Corporation (2011); and Zimmerman (1979).
April 2012 SPE Economics & Management 71
Borklund, T. 2011. Illinois Governor Signs Power Holdings, Knight Hawk Coal bills. CoalAge, 30 August 2011, http://www.coalage.com/index.php/news/latest/1305-illinois-governor-signs-power-holdings-knight-hawk-coal-bills.html.
Broadhead, R.F. 1998. Natural accumulations of carbon dioxide in the New Mexico region—Where are they, how do they occur, and what are the uses for CO2? Lite Geology 20: 2–7.
Campbell, J. 1978. Carbon Dioxide Resources of Utah, Table 2. Report of Investigation No. 125, Utah Geological and Mineral Survey (UGMS), Salt Lake City, Utah.
Chaparral Energy. 2011. Chaparral Energy Agrees to a CO2 Purchase and Sale Agreement With CVR Energy for Capture of CO2 for Enhanced Oil Recovery, http://www.chaparralenergy.com/index.php?page=chaparral-energy-agrees-to-a-co2-purchase-and-sale-agreement-with-cvr-energy-for-capture-of-co2-for-enhanced-oil-recovery.
Ciferno, J.P., Litynski, J.L., and Plasynski, S.I. 2010. DOE/NETL Carbon Dioxide Capture and Storage RD&D Roadmap. Technical Report, US DOE/National Energy Technology Laboratory, Washington, DC (December 2010), 14–15, http://www.netl.doe.gov/technologies/ carbon_seq/refshelf/CCSRoadmap.pdf.
Collings, R.C. 2008. Verification of Blue Source’s Greenhouse Gas Emis-sion Reductions for PetroSource’s Terrell, Mitchell and Grey Ranch Compressor Station Geologic Carbon Sequestration Project. Technical Report, Ruby Canyon Engineering, Grand Junction, Colorado (8 Feb-ruary 2008), http://www.americancarbonregistry.org/carbon-registry/projects/petrosource-eor-carbon-sequestration-project/Verification%20of%20Terrel%20Mitchell%20%20Grey%20RCE%20Final.pdf.
Denbury Resources. 2011. Operations—CO2 Sources, http://www.denbury.com/ (accessed 2011).
Dooley, J.J., Davidson, C.L., and Dahowski, R.T. 2009. An Assessment of the Commercial Availability of Carbon Dioxide Capture and Storage Technologies as of June 2009. Technical Report PNNL 18520, Contract No. DE-AC05-76RL01830, Pacific Northwest National Laboratory,
Richland, Washington (June 2009), 12, http://www.pnl.gov/main/pub-lications/external/technical_reports/PNNL-18520.pdf.
Energy Information Administration (EIA). 2011. Annual Energy Outlook 2011, Reference Case Table A11: Liquid Fuels Supply and Disposition Balance, http://www.eia.gov/forecasts/aeo/pdf/tbla11.pdf.
Global CCS Institute. 2011. Projects: Enid Fertilizer, http://www.globalcc-sinstitute.com/projects/12561.
Hargrove, B., Melzer, L.S., and Whitman, L. 2010. A Status Report on North American CO2 EOR Production and CO2 Supply. Paper presented at the 16th Annual CO2 Flooding Conference, Midland, Texas, USA, 9-10 December.
Kinder Morgan. 2011. Kinder Morgan CO2—Supply, http://www.kinderm-organ.com/business/co2/supply.cfm.
Kirksey, C. 2011. Texas Clean Energy Project, Progress Report. Paper presented at the 2011 CO2 Conference Week, Midland, Texas, USA, 5–9 December.
Lasker, B. 2011. Enhanced Oil Resources Inc. Investor Presentation. Oral presentation given at the IPAA OGIC Conference, Hollywood, Florida, USA, 3 February.
Lemmons, G. 2010. Lost Cabin gas plant can continue venting CO2. KDLY/KOVE Fremont Broadcasting, 9 June 2010, http://kdlykove.com/2010/06/lost-cabin-gas-plant-can-continue-venting-co2/.
Lohnes, B. 2007. Lost Cabin Gas Plant CO2. Paper presented at the EORI First Annual CO2 Conference, Laramie, Wyoming, USA, 26 June. http://www.uwyo.edu/eori/_files/co2conference07/brent_lohnes_cono-cophillips_eori.pdf.
McEwen, M. 2008. SandRidge, Oxy team up to build CO2 extraction plant. Midland Reporter-Telegram Midland Reporter-Telegram, 13 July 2008, http://www.mywesttexas.com/business/oil/top_stories/arti-cle_84086826-2910-5d11-9144-99877af2d005.html.
Melzer, S.L. 2009. A One-day Seminar on CO2 Injection Methods and Opera-tions: EOR and its Relevance to CO2 Sequestration. Lecture presented 2 April 2009 in Pittsburgh, Pennsylvania, USA.
OC noitamrofnI ytilicaF lareneG 2 Production Rates
Facility Name (Owner)
Owner Capture Location
Year Online
CO2 Conc. in Source
Gas
Standard Cubic Feet Basis Metric Ton Basis
CO2 Reserve Estimate,
Tcf
Production Rate (MMscf/D) CO2 Reserve
Estimate, Mt CO2
Production Rate in 2015,
Mt CO2/a 2000 2010 2015
LaBarge Exxon Mobil WY 1963 65% 100 233 300* 360 5300 7.0
Century Plant Oxy/
Sandridge
Pecos County, TX
2011 65% 3.5 0 0 450 186 8.7
Terrell, Grey Ranch,
Mitchell, and Puckett
Sandridge Energy Inc.
Terrell and Pecos
Counties, TX
1998 75 75 75 1.5
Lost Cabin Conoco Phillips
Fremont County, WY
1995 20% 0 50 1.0
Riley Ridge Denbury WY 2012 65% 2.4 0 0 130** 130 2.5
Turtle Lake DTE Energy Ostego, MI 11 11 0.2
Total 105.9 308 386 1,076 5613 20.8
Conversion factors: 53 million metric tons CO2 per trillion ft3, 51.69 MMscfd/Mt CO2/a (15oC and 14.5 psi)
* Expansion implemented during 2010, full capture capacity not realized **Full project plans for the Riley Ridge facility are for 580–630 MMscf/D of CO2 production, not predicted to be completed by 2015.
Information sources: Blue Source (2011); Campbell (1978), Collings (2008); Denbury Resources (2011); Dooley et al. (2009); Lemmons (2010); Lohnes (2007); McEwan (2008); Melzer (2009); Moritis (2009); Occidental Petroleum Corporation (2010, 2011); Parker et al. (2009); Sandridge Energy Inc. (2008).
TABLE 2—NATURAL-GAS-PROCESSING FACILITIES WITH CO2 CAPTURE

72 April 2012 SPE Economics & Management
TABLE 3—HYDROCARBON-CONVERSION FACILITIES WITH CO2 CAPTURE
OC scitsiretcarahC ytilicaF 2 Capture Rates
Primary Product Owner Capture Location Status
Year Online
Standard ft3 (MMscf/D) Metric Tons (Mt CO2/a)
2000 2010 2015 2015
Fertilizer Agrium, Inc. Borger, TX Operation 1980 26 26 26 0.5
Fertilizer Koch Nitrogen Enid, Oklahoma Operation 1982 35 35 35 0.68
Ethanol Conestoga Liberal KS Operation 2010 4
61 65 714 13.8
15 0.29
Ethanol Bonanza Energy Garden City, KS Operation 2011 8 0.15
Fertilizer CVR Energy Coffeyville, KS Construction 2013 40 0.8
Hydrogen Air Products* Port Arthur, TX Construction 2013 52 1.0
Power Mississippi Power*
Kemper County, MS Planning 2014 141 2.7
Power/Urea Summit Texas Clean Energy*
Ector County, TX Construction 2014 117 2.3*
Methanol Leucadia Energy* Lake Charles, LA Planning 2014 208 4.0
Power NRG* Thompson, TX Planning 2015 72 1.4
TotalConversion factor: 51.69 MMscfd/Mt CO2/a (15oC and 14.5 psi)
*Some portion of the captured CO2 is utilized to manufacture urea. Shown is the amount supplied to EOR. Information sources: Ahmad (2010); Bleizeffer (2012); Chaparral Energy (2011); Borklund (2011); Global CCS Institute (2011); Kirksey (2011); Mississippi Power (2011); Ciferno et al. (2010); Tomer et al. (2010); and Moritis (2008).
Natural Sources
Natural-GasProcessing
Oil and Gas Fields
2010Prodtn.,MMscf/D
ReservesTcf
Natural-Gas Processing
Doe Canyon
Fig. 2—CO2 from natural sources and natural-gas processing.
April 2012 SPE Economics & Management 73
Fig. 3—Sources of CO2 for domestic EOR floods.
Mississippi Power. 2011. Denbury Enters Into Two Industrial CO2 Purchase Contracts (16 March 2011), http://www.mississippipower.com/kemper/news_denbury.asp.
Moritis, G. 2001. Future of EOR & IOR: New companies, infrastruc-ture, projects reshape landscape for CO2 EOR in US. Oil Gas J. 99 (20).
Moritis, G. 2008. Special Report: More US EOR projects start but EOR production continues decline. Oil Gas J. 106 (15).
Moritis, G. 2009. Special Report: More CO2-EOR projects likely as new CO2 supply sources become available. Oil Gas J. 107 (45).
Moritis, G. 2010. Special Report: EOR/Heavy Oil Survey: CO2 miscible, steam dominate enhanced oil recovery process. Oil Gas J. 108 (14).
Occidental Petroleum Corporation (OXY). 2010. US SEC Form 8-K. Current Report, Commission File No. 1-9210, Occidental Petroleum Corporation, Los Angeles, California, (4 February 2010), http://www.faqs.org/sec-filings/100204/OCCIDENTAL-PETROLEUM-CORP-DE-_8-K/.
Occidental Petroleum Corporation (OXY). 2011. Facilities Construction, http://www.oxy.com/OurBusinesses/OilAndGas/Technology/Field-Dev/Pages/FacilitiesConstruction.aspx.
Parker, M.E., Valencia, J., Northrop, S., Foglesong, B., and Duncan, W.T. 2009. CO2 Management at ExxonMobil’s LaBarge Field, Wyoming, USA. Paper IPTC 13258 presented at the International Petroleum Technology Conference, Doha, Qatar, 7–9 December. http://dx.doi.org/10.2523/13258-MS.
Roth, G. 1983. Sheep Mountain and Dike Mountain fields, Huerfano County, Colorado: A source of CO2 for enhanced oil recovery. In Oil and Gas fields of the Four Corners area, ed. J.E. Fassett, Vol. III, 740–744. Durango, Colorado: Four Corners Geological Society.
Sandridge Energy Inc. 2008. Gas Treating and CO2 Delivery Agreement by and between Sandridge Exploration and Production and Oxy USA Inc. 10-Q Quarterly Report (SEC Filing), Exhibit 10.2, EDGAR ® Online
(7 August 2008), http://sec.edgar-online.com/sandridge-energy-inc/10-q-quarterly-report/2008/08/07/section20.aspx.
Schwochow, S.D. 1983. McElmo Creek Area data. Deposit ID 10014208, MRDS ID D010878, USGS Mineral Resources Data System (MRDS), http://tin.er.usgs.gov/mrds/show-mrds.php?dep_id=10014208.
Stevens, S.H., Pearce, J.M., and Rigg, A.A.J. 2001. Natural Analogs for Geologic Storage of CO2: An Integrated Global Research Program. Paper presented at the First National Conference on Carbon Sequestra-tion, Washington, DC, 15–17 May.
Thunderbird Energy. 2012. TBD Presentation (15 February 2012), Slide #20, http://www.thunderbirdenergy.com/i/pdf/TBD_Presentation.pdf.
Tomer, B., McMahon, T., and Greeson, D. 2010. NRG Energy: W.A. Parish Post-Combustion CO2 Capture and Sequestration Project. Project Fact Sheet, No. FE0003311, National Energy Technology Laboratory, Washington, DC (May 2010), http://www.netl.doe.gov/publications/factsheets/project/FE0003311.pdf.
Vecta Energy Corporation. 2011. http://www.vectaenergy.ca/index.htm.Zimmerman, F.W. 1979. Naturally Occurring Carbon Dioxide Sources in
the United States – A Geologic Appraisal and Economic Sensitivity Study of Drilling and Producing Carbon Dioxide for Use in Enhanced Oil Recovery. Final Draft, GURC Report No. 165, FE-2025-38, Gulf Universities Research Consortium, Bellaire, Texas (January 1979), http://www.netl.doe.gov/KMD/cds/disk22/G-CO2%20&%20Gas%20Injection/FE2025_38.pdf.
Phil DiPietro is an analyst with the United States Department of Energy’s National Energy Technology Laboratory (NETL) within the Office of Strategic Energy Analysis and Planning. He served as the NETL manager for the study “Improving Domestic Energy Security and Lowering CO2 Emissions with ‘Next Generation’ CO2-Enhanced Oil Recovery (CO2-EOR),” which was published in July of 2011. Previously, DiPietro worked as a consultant for Advanced Resources International and Energetics Incorporated. He developed the CarBen model,

74 April 2012 SPE Economics & Management
a wedge analysis tool for assessing greenhouse-gas-emissions scenarios. DiPietro holds a BS degree in chemical engineering from Drexel University and an MBA degree from the University of Rochester.
Peter C. Balash is Deputy Director, Office of Strategic Energy Analysis and Planning, at NETL. An economist, he has studied energy markets, energy security, and technology issues for NETL since 2002. Recent activities include studying the economic impacts of climate-change-mitigation policy and assessing energy security options in a carbon-constrained world. Balash has directed a series of scenario studies focusing on reducing petroleum consumption and carbon emissions. He has repre-sented the NETL at energy modeling forums. Previously, Balash worked for the Internal Revenue Service in Houston, Texas, engaged in audits of multinational corporations. He holds a
PhD degree in economics from The University of Texas at Austin and a Bachelor’s degree in economics from Xavier University in Cincinnati.
Matt Wallace has been an analyst with the Arlington, Virginia consulting firm Advanced Resources International since March of 2011. His work with the company primarily involves EOR-resource assessments and CO2-sequestration and -utilization studies. Wallace has contributed to several studies for the US Department of Energy, Energy Information Administration, and NETL, and to numerous private studies and resource assess-ments. He coauthored the report “Improving Domestic Energy Security and Lowering CO2 Emissions with ‘Next Generation’ CO2-Enhanced Oil Recovery (CO2-EOR),” which was published by NETL in July of 2011. Wallace holds a degree in environmen-tal studies from Washington and Lee University.