Embed Size (px)
Citation preview
Discussion Paper/Document d’analyse2007-7
A Note on Contestability in theCanadian Banking Industry
by Jason Allen and Ying Liu
www.bankofcanada.ca
Bank of Canada Discussion Paper 2007-7
August 2007
A Note on Contestability in theCanadian Banking Industry
by
Jason Allen 1 and Ying Liu 2
1 Monetary and Financial Analysis DepartmentBank of Canada
Ottawa, Ontario, Canada K1A [email protected]
2Department of EconomicsGREQAM, Université de la Méditerranée
Bank of Canada discussion papers are completed research studies on a wide variety of technical subjectsrelevant to central bank policy. The views expressed in this paper are those of the authors.
No responsibility for them should be attributed to the Bank of Canada.
ISSN 1914-0568 © 2007 Bank of Canada

ii
Acknowledgements
The authors benefited from discussions with Greg Caldwell, Walter Engert, Kim Huynh,
Césaire Meh, and suggestions pointed out by seminar participants at the Bank of Canada. Thanks
also go to Jiyoung Park and Jim Day for their research assistance. All errors are our own.
iii
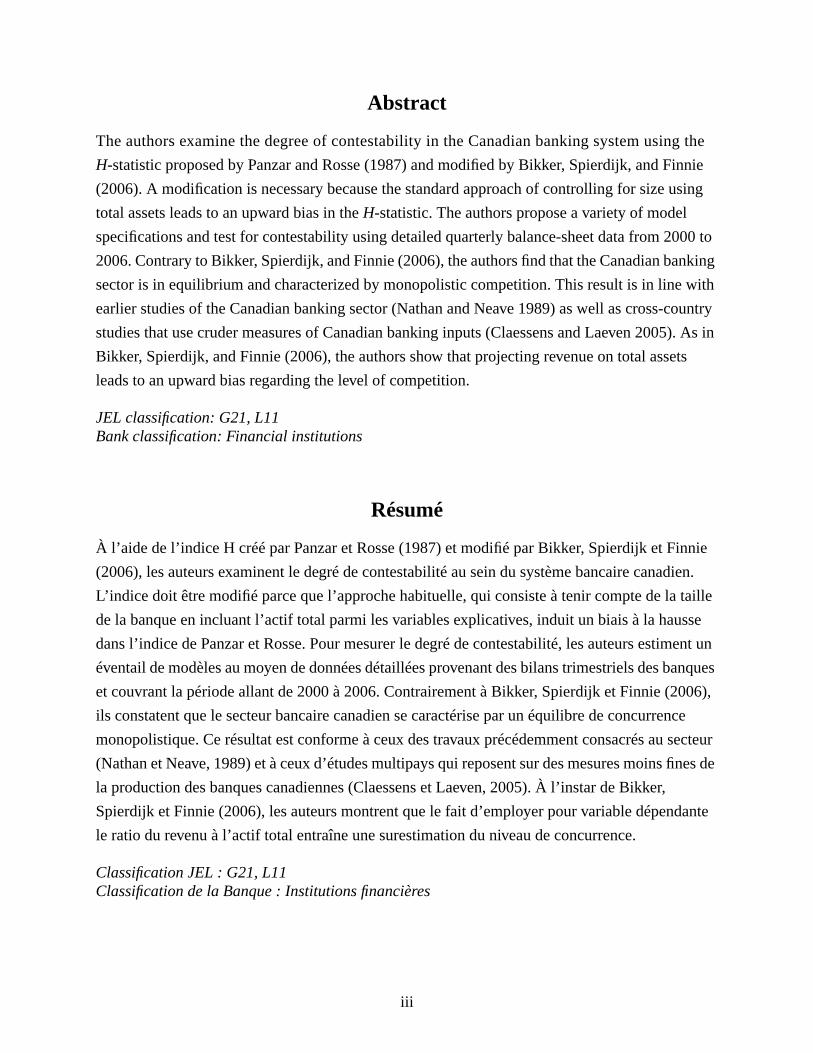
Abstract
The authors examine the degree of contestability in the Canadian banking system using the
H-statistic proposed by Panzar and Rosse (1987) and modified by Bikker, Spierdijk, and Finnie
(2006). A modification is necessary because the standard approach of controlling for size using
total assets leads to an upward bias in theH-statistic. The authors propose a variety of model
specifications and test for contestability using detailed quarterly balance-sheet data from 2000 to
2006. Contrary to Bikker, Spierdijk, and Finnie (2006), the authors find that the Canadian banking
sector is in equilibrium and characterized by monopolistic competition. This result is in line with
earlier studies of the Canadian banking sector (Nathan and Neave 1989) as well as cross-country
studies that use cruder measures of Canadian banking inputs (Claessens and Laeven 2005). As in
Bikker, Spierdijk, and Finnie (2006), the authors show that projecting revenue on total assets
leads to an upward bias regarding the level of competition.
JEL classification: G21, L11Bank classification: Financial institutions
Résumé
À l’aide de l’indice H créé par Panzar et Rosse (1987) et modifié par Bikker, Spierdijk et Finnie
(2006), les auteurs examinent le degré de contestabilité au sein du système bancaire canadien.
L’indice doit être modifié parce que l’approche habituelle, qui consiste à tenir compte de la taille
de la banque en incluant l’actif total parmi les variables explicatives, induit un biais à la hausse
dans l’indice de Panzar et Rosse. Pour mesurer le degré de contestabilité, les auteurs estiment un
éventail de modèles au moyen de données détaillées provenant des bilans trimestriels des banques
et couvrant la période allant de 2000 à 2006. Contrairement à Bikker, Spierdijk et Finnie (2006),
ils constatent que le secteur bancaire canadien se caractérise par un équilibre de concurrence
monopolistique. Ce résultat est conforme à ceux des travaux précédemment consacrés au secteur
(Nathan et Neave, 1989) et à ceux d’études multipays qui reposent sur des mesures moins fines de
la production des banques canadiennes (Claessens et Laeven, 2005). À l’instar de Bikker,
Spierdijk et Finnie (2006), les auteurs montrent que le fait d’employer pour variable dépendante
le ratio du revenu à l’actif total entraîne une surestimation du niveau de concurrence.
Classification JEL : G21, L11Classification de la Banque : Institutions financières
1 Introduction
Banks play an important role in the intermediation of savings into investment in the
economy. As a result, their behaviour has implications for capital allocation, firm growth,
industrial expansion, and economic development. In light of the global trend of
consolidation in the financial industry, the degree of competition in the banking system has
received heightened interest among researchers and policy-makers. Most of the debate has
focused on the implications of a competitive banking system for economic efficiency and
financial stability. Traditionally it is perceived that a more concentrated industry is less
competitive and thus may compromise economic efficiency. However, empirical research
yields mixed results on the relationship between concentration and competition. For
example, using a data set of almost 4,000 banks from 50 countries, Claessens and Laeven
(2005) find that their measure of competition is not negatively related to traditional
measures of concentration. In contrast, an earlier study by Bikker and Haaf (2002) on
banks in 23 European countries finds support for the conventional view that concentration
impairs competitiveness.
Another common perception is that some amount of market power is necessary for stability
in the banking system (see, for example, references cited in Carletti and Hartmann 2003).
Larger banks with market power have typically been viewed as having incentives to
minimize risk-taking behaviour and improve their screening behaviour. A review of the
literature by Northcott (2004), however, shows it is not clear that such a trade-off between
size and stability exists. Franklin and Gale (2004) have shown, for example, via the
manipulation of various models, that perfect competition and financial stability can coexist.
Based on a monetary general-equilibrium economy, Boyd, Nicolo, and Smith (2004) find
that the probability of a costly banking crisis is always higher under competition than
under monopoly. Based on a study of 38 countries during the period 1980–2003, on the
other hand, Schaeck, Cihak, and Wolfe (2006) find that more competitive banking systems
are less prone to banking crises.
This paper focuses on the first issue: whether market concentration compromises
competition in Canada. Canada has a highly concentrated banking market. The “Big Six”
banks account for more than 90 per cent of the assets in the banking system.1 Also,
Herfindahl-Hirschman measures are typically in the medium to high range, pointing to a
high degree of market concentration. It is of interest, therefore, to assess the impact of such
1. These banks are Royal Bank Financial Group, Bank of Montreal, Canadian Imperial Bank of Commerce,TD Bank Financial Group, National Bank, and Bank of Nova Scotia.
1
a concentrated industry structure on the competitive behaviour of the country’s banking
system. In addition to recent cross-country studies, two studies have paid particular
attention to the competitive behaviour in Canadian banks. In the first study, Nathan and
Neave (1989) estimate separate Panzar-Rosse statistics for the banking industry, trust
industry, and mortgage companies for 1982, 1983, and 1984. Their findings indicate that
none of the three industries exhibits monopolistic behaviour. In the second study, Shaffer
(1993) examines Canadian banks from 1965 to 1989 and rejects joint monopoly among
Canadian banks; he concludes that the industry is generally consistent with perfect
competition.
The goal of this paper is to measure the degree of contestability in the Canadian banking
industry based on the Panzar-Rosse H -statistic. A market is contestable if there are no
barriers to entry and exit is costless. Panzar and Rosse (1987) derive three testable
hypotheses using a reduced-form revenue equation: monopoly, monopolistic competition,
and perfect competition. The test involves measuring the effect on revenue of an increase in
factor costs. A monopolist will increase its price if marginal cost increases, and, given that
demand is elastic, revenue will fall. A perfectly competitive bank operates at the minimum
of the average cost curve; therefore, an increase in cost by, say, 1 per cent will lead the bank
to increase its price by 1 per cent and revenue will increase by the same amount. A
monopolistic competitor’s reaction is somewhere in between.
The two previous studies of Canadian banks (Nathan and Neave 1989; Shaffer 1993) also
estimate a contestability statistic (or its variation) for the banking industry using data up
to the late 1980s. They adopt either time-series regressions with annual observations of
industry (aggregate) banking data spanning two decades (Shaffer 1993), or cross-sectional
estimations for each year and for each of the banking industry, trust industry, and mortgage
companies (Nathan and Neave 1989). We use a novel database that consists of quarterly
bank-level balance-sheet and income-statement variables. The quarterly frequency and our
adoption of panel techniques allow us to focus on a relatively short and relevant time
period: 2000Q2 to 2006Q1. An important assumption of the Panzar-Rosse statistic is that
the market is in equilibrium, with no entry and exit. Given the rapid consolidation and the
amount of foreign bank entry that occurred in the 1980s and early 1990s, our sample period
reflects a period of relative equilibrium. Furthermore, by using only data booked in
Canada, ours is the first empirical study to focus on the domestic market. We therefore
remove potential complications due to different market and regulatory conditions faced by
financial institutions overseas. This is particularly important given that around a third of
2
the assets in the Canadian banking sector are booked overseas.
Based on H -statistic estimates, we mostly reject the assumptions of monopoly power and
perfect competition. This suggests that the Canadian banking market is best described as
monopolistic competition. It is interesting that our study – which focuses on the latest time
period using never-before-seen detailed data as well as model specifications – produces
H -statistics that are qualitatively similar to those using earlier sample periods and less
sophisticated data. In the past 20 years, the Canadian banking sector has experienced
important consolidation, which includes the acquisition by banks of mortgage and loans
companies, trust companies, and other financial service providers, as well as new entries by
foreign banks and their subsidiaries. This finding suggests that, regardless of the
substantial structural changes that took place in the past 20 years, Canadian banks have
behaved more or less in a monopolistically competitive fashion.
This paper is organized as follows. Section 2 provides an overview of the Canadian banking
industry, including a discussion of the evolution of the regulatory environment for banks,
and the resulting changes that have taken place in the industry. Section 3 describes the
model that we use to measure the contestability in the Canadian banking industry, and
discusses results. Section 4 offers some conclusions.
2 Canadian Banking Industry
Historically, the structure of the Canadian banking industry has been relatively stable. For
instance, from 1920 to 1980, Canada consistently had 11 banks (Bordo 1995). However,
after several regulatory changes removing the sharp limits on the entry of foreign banks, by
May 2006 there were over 60 banks operating in Canada: 19 domestic banks, 23 foreign
bank subsidiaries, and 21 foreign bank branches. Nevertheless, banking itself is relatively
concentrated: the six largest banks hold close to 90 per cent of total bank assets.
Prior to 1980, the financial services industry had been segmented (by legislation, regulation,
and practice) into distinct “pillars”: commercial banking, trust business and residential
lending, insurance underwriting and brokerage, and securities underwriting and dealing. As
well, there were sharp limits on the entry of foreign banks into the Canadian market.
However, in the past 25 years, with changes in both market practice and a series of
revisions in the governing financial legislation, there have been substantial changes in the
Canadian banking industry. Key characteristics have been the entry of foreign banks and
the expansion of banks into the range of financial services, including the trust business,
3
insurance underwriting and sales (although not through bank branches), and securities
underwriting and dealing. For discussions of these and related developments in Canada, see
Daniel, Freedman, and Goodlet (1993), Freedman (1998), and Engert et al. (1999).
Canadian banks are federally incorporated and regulated primarily under the federal Bank
Act, which defines their range of activities. Unlike their U.S. counterparts, Canadian banks
have never been prohibited from conducting nationwide branching and banking. As a
result, a few Canadian banks have grown to be large national banks. The Bank Act also
requires a periodic review of the legislation that governs Canadian financial services. This
formal review process led to important financial legislation amendments in 1980, 1987,
1992, 1997, and 2002, which have contributed to more diversified business lines and more
market-oriented activities in Canadian banks. In addition, important changes to the
legislation regarding the activities of foreign banks were made in 1981 and 1999, which have
resulted in more foreign entry and competitive forces in the domestic banking market.
The 1980 Bank Act revisions are important because they allowed banks to establish
subsidiaries in markets such as insurance, venture capital, and mortgage lending. This
allowed banks to compete more effectively in these markets by allowing them to do as trust
companies and raise deposits that were not subject to reserve requirements. As well, foreign
banks were allowed to establish subsidiaries in Canada. Prior to the 1980 revisions, foreign
bank entry had been curtailed by amendments to the 1967 Bank Act. Between 1967 and
1980, foreign banks operated in Canada through non-bank affiliates. Following the 1980
revisions these affiliates were incorporated as subsidiaries, subject to the provisions of the
Bank Act, and able to conduct the full range of banking activities. This legislative change
led to many foreign banks entering the Canadian market. Foreign bank subsidiaries, like
any regular domestic bank, are currently supervised by the Office of the Superintendent of
Financial Institutions (OSFI).
In 1987, Canadian banks (both domestic and foreign) were permitted to invest in corporate
securities dealers, as well as distribute government bonds. All major banks subsequently
made substantial investments in the securities business and purchased control of most of
the existing large investment dealers. The 1987 amendments also allowed financial
intermediaries to conduct brokerage activities.
In 1992, Canadian banks were given the right to enter the trust business through the
establishment, or acquisition, of trust companies. Most trust companies were subsequently
purchased by Canada’s largest banks. The financial difficulties that many trust companies
4
experienced following the collapse of the speculative real estate boom in the late 1980s
contributed to the ability of banks to acquire them.
In 1997, new legislation included various changes to update and revise the amendments
made in 1992. In 1999, foreign banks were allowed to set up foreign bank branches in
Canada, without having to establish a subsidiary. Given the difficulties related to deposit
insurance and supervision that would arise under a regime of unrestricted branch entry,
foreign bank branches were allowed to take only wholesale deposits of 150,000 dollars or
more. The 2002 legislative changes widened the scope within which Canadian banks
conduct business. For example, they were allowed to own finance companies.
While there has been consolidation among various financial services firms accompanying the
regulatory developments, there have been no mergers among major Canadian banks for
years. The latest major consolidation in the financial sector was the acquisition of Canada
Trust by TD Bank, which was completed in 2000Q1. As well, the entry of the foreign banks
has not resulted in a significant loss of market share of the major banks or domestic banks,
in general. Nevertheless, foreign banks have brought innovation and competitive pressure
that may have influenced the way Canadian banks conduct business.2
3 H -statistic
The method developed by Panzar and Rosse (1987) (hereafter denoted PR) allows us to
estimate the competitive behaviour of banks on the basis of the comparative static
properties of reduced-form revenue equations based on cross-section data. It also allows us
to investigate the extent to which a change in factor input prices is reflected in
(equilibrium) revenues earned by a specific bank. Specifically, the PR H -statistic is
calculated using reduced-form bank revenue equations; it measures the sum of the
elasticities of the total revenue of the bank with respect to the bank’s input prices.
PR show that, if their method is to yield plausible results, banks need to have operated in a
long-term equilibrium, while their performance needs to be influenced by the actions of
other market participants. Furthermore, the model assumes a price elasticity of demand,
ηD, greater than unity, and a homogeneous cost structure. To obtain the equilibrium output
2. In addition, credit unions have a long history in Canada of offering a banking option outside of the largebanks, and in some provinces are substantial market players. Credit unions are provincially regulated andwe do not have access to the same type of data that are available for banks that report to OSFI. Ignoringcredit unions can therefore underestimate the level of contestability.
5
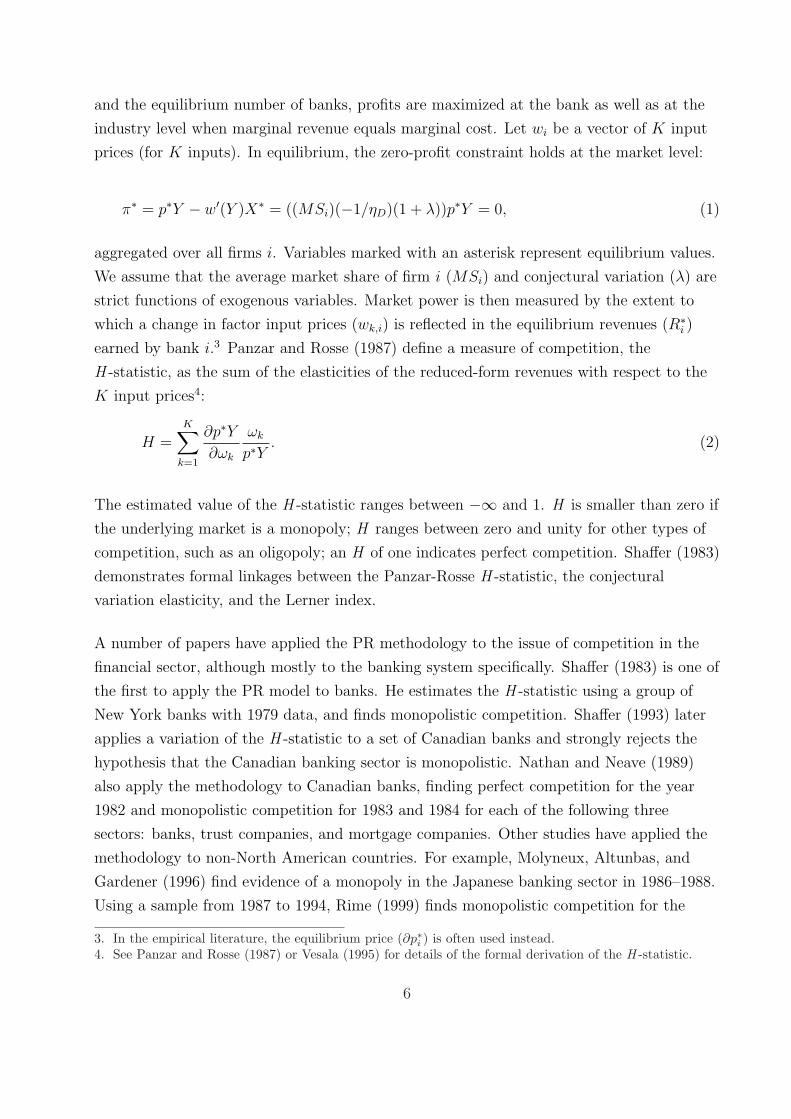
and the equilibrium number of banks, profits are maximized at the bank as well as at the
industry level when marginal revenue equals marginal cost. Let wi be a vector of K input
prices (for K inputs). In equilibrium, the zero-profit constraint holds at the market level:
π∗ = p∗Y − w′(Y )X∗ = ((MSi)(−1/ηD)(1 + λ))p∗Y = 0, (1)
aggregated over all firms i. Variables marked with an asterisk represent equilibrium values.
We assume that the average market share of firm i (MSi) and conjectural variation (λ) are
strict functions of exogenous variables. Market power is then measured by the extent to
which a change in factor input prices (wk,i) is reflected in the equilibrium revenues (R∗i )
earned by bank i.3 Panzar and Rosse (1987) define a measure of competition, the
H -statistic, as the sum of the elasticities of the reduced-form revenues with respect to the
K input prices4:
H =K∑
k=1
∂p∗Y∂ωk
ωk
p∗Y. (2)
The estimated value of the H -statistic ranges between −∞ and 1. H is smaller than zero if
the underlying market is a monopoly; H ranges between zero and unity for other types of
competition, such as an oligopoly; an H of one indicates perfect competition. Shaffer (1983)
demonstrates formal linkages between the Panzar-Rosse H -statistic, the conjectural
variation elasticity, and the Lerner index.
A number of papers have applied the PR methodology to the issue of competition in the
financial sector, although mostly to the banking system specifically. Shaffer (1983) is one of
the first to apply the PR model to banks. He estimates the H -statistic using a group of
New York banks with 1979 data, and finds monopolistic competition. Shaffer (1993) later
applies a variation of the H -statistic to a set of Canadian banks and strongly rejects the
hypothesis that the Canadian banking sector is monopolistic. Nathan and Neave (1989)
also apply the methodology to Canadian banks, finding perfect competition for the year
1982 and monopolistic competition for 1983 and 1984 for each of the following three
sectors: banks, trust companies, and mortgage companies. Other studies have applied the
methodology to non-North American countries. For example, Molyneux, Altunbas, and
Gardener (1996) find evidence of a monopoly in the Japanese banking sector in 1986–1988.
Using a sample from 1987 to 1994, Rime (1999) finds monopolistic competition for the
3. In the empirical literature, the equilibrium price (∂p∗i ) is often used instead.4. See Panzar and Rosse (1987) or Vesala (1995) for details of the formal derivation of the H -statistic.
6
Swiss banking system. Examples of cross-country studies include Bikker and Groeneveld
(2000) and Claessens and Laeven (2005). Empirical studies generally reject both perfect
monopoly and perfect competition, finding mostly evidence of monopolistic competition.
Bikker, Spierdijk, and Finnie (2006), however, have recently raised questions regarding
previous estimates of contestability. They suggest that most empirical studies that use the
H -statistic to measure the degree of contestability in the banking industry severely
overestimate the level of banking competition. This is because the PR equation is naturally
a revenue equation, whereas most empirical research uses a price equation. That is, when
income as a fraction of assets is used as the dependent variable, rather than just income,
the estimated price elasticities naturally sum to one (for details, see Bikker, Spierdijk, and
Finnie 2006). This implies a bias in the H -statistic towards one; i.e., towards perfect
competition and away from the null hypothesis of monopoly or monopolistic competition.
Bikker, Spierdijk, and Finnie (2006) also point out that the standard practice of controlling
for bank size by including total assets as an explanatory variable will lead to a similar bias.
Given that the results in Bikker, Spierdijk, and Finnie (2006) are for a specific set of
models and not general, we compare estimates for both formulations. As in Bikker,
Spierdijk, and Finnie (2006), we find a larger H -statistic when income scaled by assets is
the dependent variable than when income is the dependent variable.
Some cross-country studies also use the H -statistic as a (linear) measure of competition in
banking, and then investigate the factors that contribute to the degree of competition in
those countries. For example, using a sample of 23 countries, Bikker and Haaf (2002) study
the relationship between the H -statistic and bank-specific and country-specific factors,
including measures of market concentration. The authors find that a more concentrated
market leads to a lower H -statistic and thus less competition. On the other hand, using a
similar framework, Claessens and Laeven (2004) find from their sample of 50 countries that
a higher degree of contestability is related to greater foreign bank entry and fewer entry and
activity restrictions, but not banking system concentration. Two other studies have linked
competition, again measured by the H -statistic, with economic growth and financial
stability, respectively. Claessens and Laeven (2005) estimate the H -statistic for 16 countries
and then relate it to measures of industry growth. The authors find that greater
competition in a country’s banking system allows financially dependent industries to grow
faster. Schaeck, Cihak, and Wolfe (2006) adopt the H -statistic used in Claessens and
Laeven (2004) to study its relationship with measures such as the likelihood of a financial
crisis, whose identification is taken from Demirguc-Kunt and Detragiache (2005). They find
7
that banking systems with a higher H -statistic (more competition) are less likely to have a
financial crisis and that the time to crisis is longer in a competitive environment.
While these cross-country studies yield interesting results, they should be interpreted with
caution. First, the H -statistic relies on the assumption that markets are in equilibrium. By
comparing the H -statistic across countries, the studies implicitly assume that the banking
systems in these countries are consistently in equilibrium during the sample period. Second,
the literature has not agreed on a robust mapping of the H -statistic into the
Bresnahan-Lau conduct parameter. For example, Shaffer (1983) has shown that, for a fixed
number of firms in short-run equilibrium, H is an increasing function of the Bresnahan-Lau
conduct parameter, and, consequently, a decreasing function of competitive conduct. As a
result, linear interpretations of the H -statistic may be problematic. For robustness, Shaffer
(2004) suggests a dichotomous dependent variable that indexes whether each observation
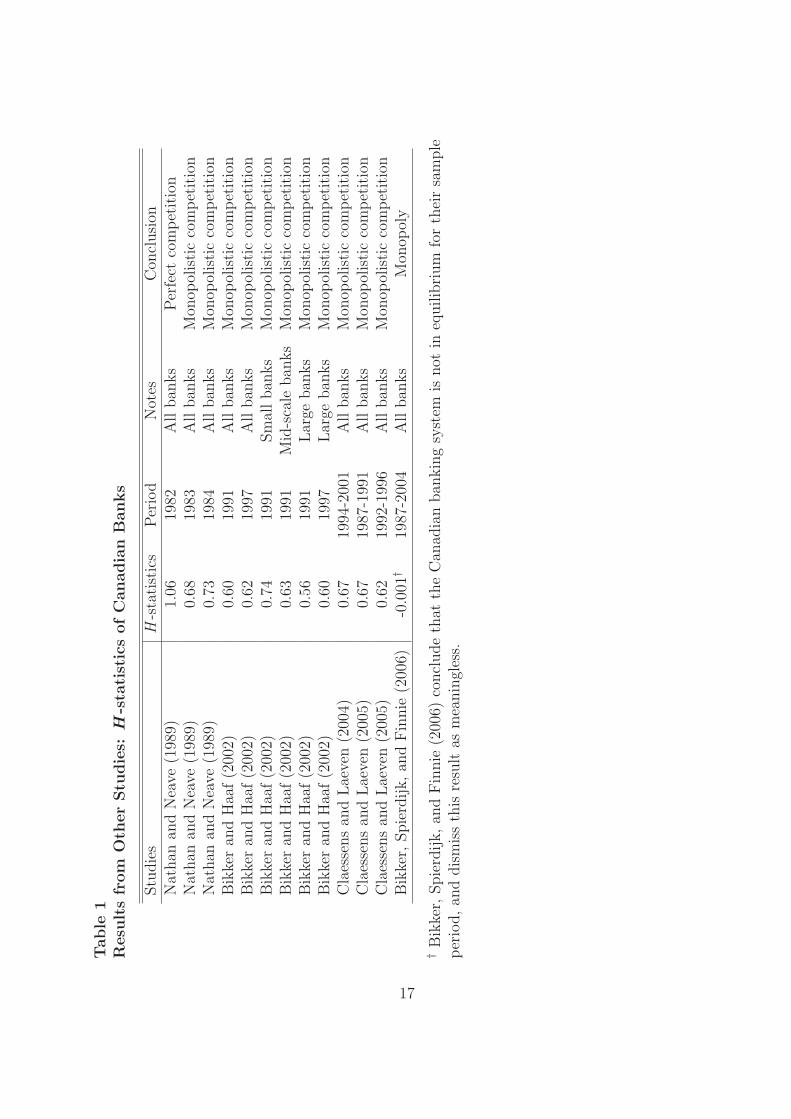
has a point estimate of H that is positive or negative. Interestingly, Canada belongs to the
set of countries in all four studies. Table 1 reports the H -statistics for Canadian banks from
other studies. With the exception of Bikker, Spierdijk, and Finnie (2006), these studies
tend to suggest that the Canadian banking system ranks among the most contestable.5
3.1 Specification and estimation
To calculate the H -statistic and test its range for Canadian banks, we apply the following
regression to a panel data set of Canadian banks described in section 3.2:
R = α + β lcost + γ kcost + δ dcost +J∑
i=1
fi + ε. (3)
Banks are assumed to produce one composite output, which consists of different types of
loans, security investments, and any interest-bearing assets. This is the definition of
“banking output” most commonly used in this literature, and it is consistent with the
underlying notion inherent in the PR model, that financial intermediation is the core
business of most banks. The dependent variable, R, is revenue from the core business,
although it has taken on a number of definitions in empirical research. Total interest
income (int) and total interest income relative to all interest-bearing assets (int ta) are
typically used to proxy revenue. However, as noted by Allen and Liu (2007), in the past
5. Bikker, Spierdijk, and Finnie (2006) find that the Canadian system can be characterized as a monopoly,but they dismiss this result, because the industry is estimated to be out of equilibrium, which makes theirstatistical test meaningless in this case.
8
decade Canadian banks (primarily the Big Six) have been generating a larger share of their
income from non-interest-bearing activities.6 In the past five years, the income generated
from non-interest-bearing activities has surpassed that generated from traditional banking
activities. To take account of the importance of such activities, we allow R to be defined as
either total revenue (rev) or total revenue as a ratio of total assets (rev ta). The former is
used as the dependent variable in Nathan and Neave (1989). According to Bikker,
Spierdijk, and Finnie (2006), normalizing the dependent variable by assets produces an
artificially high estimate of contestability – a consideration we investigate.
Equation (3) also includes the total expense on salaries, pensions, and employee benefits as
a ratio of total assets, which is a proxy for the unit price of labour (lcost). Ideally, we
would have liked to obtain the total labour expense per employee, but the number of
employees is not available for all of the banks considered in this study. We follow the
common practice in the literature of dividing employee expenses by total assets. kcost is a
measure of capital cost; it is defined as the expense on premises, computers, and equipment
divided by the total stock of premises and fixed assets on the bank’s balance sheet. dcost is
the price of deposits, measured by the interest expense on deposits divided by deposits. f is
a vector of bank-specific factors, which can be categorized as follows: general, risk, business
diversification, and operational efficiency.
In addition to cost factors, a number of risk factors are included in equation (3). The
riskiness of banks is an important consideration that may affect the pricing of its output.
One such measure is the equity-to-asset ratio (equi ta) (a bank is more risky if it has a low
equity-to-asset ratio). A second measure of riskiness is interbank exposure, measured as
deposits from other banks as a percentage of total deposits (inter1), and deposits at other
banks as a percentage of total assets (inter2). The third measure of riskiness is holding of
corporate shares as a percentage of a bank’s balance sheet (corp ta) (the more corporate
shares a bank holds, the more risky is the bank). The fourth measure is a bank’s issuance
of subordinated debt as a percentage of a bank’s total liabilities (subdebt lia). Also
included is the ratio of total loans to total assets (loans) and the percentage of securities
investment as a percentage of total assets (secu ta).
As noted earlier, Canadian banks (especially the large ones) derive a large part of their
revenue from non-traditional activities. The degree to which banks diversify their business
should have important implications on the way they price their products. For example, a
6. Non-traditional banking activities include depositor services, underwriting, foreign exchange trading, andwealth management.
9
bank may be willing to pay a higher interest rate on deposit accounts, in order to attract
customers to their other products, such as wealth management and insurance. We consider
the following variables to proxy bank business diversification: non-interest income relative
to total revenue (nonin rev), deposit services fees as a percentage of total deposits (dep d),
credit and debit card fees as a percentage of total interest income (card int), and
insurance-related net income as a percentage of net operating revenue (ins ta).
Since banks are profit-maximizing firms, a more operationally efficient bank can lower the
price of its products and maintain a reasonable profit margin. We proxy operational
efficiency using several measures. We first use an expense ratio – the ratio of non-interest
expense to net operating revenue (expense). Investment expenses on employee training,
and on computers and related equipment, may also have a long-term effect on the bank’s
cost efficiency. Allen, Engert, and Liu (2006) find that both variables are significant in
explaining the cost efficiency of the six largest Canadian banks. Expenses on employee
training as a ratio of total assets are denoted train ta, and the ratio of expenses on
computers and equipment as a percentage of a bank’s total stock of physical assets is
denoted it z2.
Prior to estimating (3) and calculating H -statistics, we test for industry equilibrium. This
is done by using as a dependent variable in (3) either return on equity (ROE) or return on
assets (ROA), estimating the price elasticities, and testing the hypothesis that they sum to
zero against the alternative that they are less than zero. We conduct this test because, in
the long run, rates of return on assets (or equity) are equalized across banks and must be
uncorrelated with input prices.
3.2 Data
The data are quarterly observations of 10 domestic and 15 foreign banks operating in
Canada from 2000Q2 to 2006Q1. The number of banks is limited by data availability. The
10 domestic banks are: Royal Bank Financial Group, Bank of Montreal, Canadian Imperial
Bank of Commerce, TD Bank Financial Group, Bank of Nova Scotia, National Bank,
Canadian Western Bank, Laurentian Bank, Citizens Bank of Canada, and ManuLife Bank.
The 15 foreign banks are: Bank of Tokyo-Mitsubishi, Mizuho Corporate Bank, Sumitomo
Mitsui Banking Corporation, HSBC Bank of Canada, JPMorgan Bank, ING Bank, Bank of
China, Bank of East Asia, BCP Bank Canada, BNP Paribas, CTC Bank of Canada,
International Communication Bank of Cathay, MBNA Canada, National Bank of Greece,
and ABN Amro Bank. Our sample starts at 2000Q2, so that the acquisition of Canada
10
Trust by TD Bank is fully reflected in the TD Bank data. The assets of the banks in our
sample account for 97.8 per cent of the total Canadian dollar assets of the banking sector.
The data set is taken from the chartered banks’ consolidated monthly balance sheet and
quarterly consolidated statement of income, collected by OSFI. The consolidated monthly
balance-sheet data at the aggregate level are published in Tables C1 and C2 in the Bank of
Canada Banking and Financial Statistics. Large categories of the consolidated statement of
income at the aggregate level are available in Table K2 in the same publication at an
annual frequency. Disaggregated data are confidential. All balance-sheet data are monthly
average values and are converted to quarterly series by taking the quarterly average of the
monthly observations. We focus on the domestic market by limiting our choice of variables
to those booked in Canada. All data are deflated by the GDP deflator (1997 = 100).
Detailed definitions of all variables used in this study are presented in Table 2.
3.3 Results
We estimate equation (3) on the sample of 25 banks over the period 2000Q2 to 2006Q1. We
first note that the null hypothesis that the banking industry is in equilibrium is not rejected.
We can therefore interpret our estimates of H as estimates of market contestability.
The H -statistics for the different specifications as well as p-values for different null
hypotheses are presented in Table 3. We consider four dependent variables and four sets of
explanatory variables, providing us with 16 estimates of contestability. The first model
(M1) consists of the three prices and a regulatory dummy variable which captures changes
to the Bank Act in 2002. Model M2 includes the risk factors, M3 adds the business
diversification variables, and M4 adds the operational efficiency indicators. In each model,
we control for size using the categorical variable, category. At each point in time, we sort
banks into four categories based on total assets. We do not control for size using total
assets as the explanatory variable, because that would lead to an upward bias in H (Bikker,
Spierdijk, and Finnie 2006).
The first observation is that the H -statistics for the dependent variables normalized by
total assets (price equations) are larger than for those that are not normalized (revenue
equations), as discussed in Bikker, Spierdijk, and Finnie (2006). We therefore focus on the
revenue equations. For the two simplest models, we cannot reject the null hypothesis of
monopoly power in the Canadian banking sector in three out of four cases. This result is
similar to what Bikker, Spierdijk, and Finnie (2006) find for Canada over the period 1987
11
to 2004.7 For the more complete models (i.e., those with more control variables and greater
explanatory power), the H -statistic estimates suggest monopolistic competition. The range
is 0.18 to 0.35. The model fit is also good; M4, for example, has a within R2 of
approximately 0.6.
Although our estimates of contestability are quantitatively smaller than what is found in
previous studies (due to methodological differences), the conclusions are similar to those in
Claessens and Laeven (2004) for the years 1994–2001, Claessens and Laeven (2005) for
1987–1996, and Nathan and Neave (1989) for 1983 and 1984; each of those studies
concludes that Canada’s banking system is characterized by monopolistic competition.
However, our results differ substantially from Nathan and Neave (1989) for 1982. The latter
result indicates that the Canadian banking industry was perfectly competitive in 1982.
Several caveats should be noted. First, the PR test assumes equilibrium conditions in the
market with zero entry and exit. While we focus on a period (2000–06) with relatively little
consolidation, there is still some entry and exit. In addition, equilibrium conditions may
differ between our sample period and those of the other studies we cite. As a result, direct
comparison of the H -statistics may not be reliable. Second, while we look at alternative
definitions of banking output and price with an aim to take into account the diversified
business mix of Canadian banks, the PR framework allows for only one single (composite)
output. It is quite likely that the cost structure and pricing strategy differ substantially
between traditional loan business and non-traditional activities, such as security
underwriting. A more reliable H -statistic should be obtained for each business line. This
would require detailed input data for each business line, which, unfortunately, do not exist.
4 Conclusion
This paper reports our analysis of competition in the Canadian banking sector from 2000 to
2006. We use the methodology developed in Panzar and Rosse (1987) to compute
H -statistics for a variety of model specifications. In almost every instance we strongly
reject both the null hypothesis of monopoly power and perfect competition, irrespective of
which variables we use to define output and prices. Given the superior measurement of our
data set relative to previous studies, it is interesting that our results are not much different
from those in the previous studies (Nathan and Neave 1989; Claessens and Laeven 2004).
Possible explanations are that the H -statistic tends to be robust to the measurement error
7. The authors point out, however, that they reject the hypothesis that the Canadian banking industry is inequilibrium, and therefore the H -statistic does not have a meaningful interpretation.
12
of marginal cost or demand (Genesove and Mullin 1998), and that, given the wide range of
estimates that imply monopolistic competition, rejecting this conclusion is difficult.
The question of market power in the Canadian banking industry cannot be completely
answered, therefore, by using comparative statics as we have done in this paper. If the
necessary bank-level data were available, we could in fact estimate market power based on
the conduct of the banks. Necessary information includes not only input prices and output
levels but also output prices and demand shifters. The behaviour of the banks could then
be estimated based on a theoretical model, and explicit hypotheses regarding market power
could be tested. Structural approaches of modelling bank behaviour are currently an active
field of research, which will in the next few years hopefully contribute to our measurement
of market power in the banking industry.
13
References
Allen, J., W. Engert, and Y. Liu. 2006. “Are Canadian Banks Efficient? A Canada–U.S.
Comparison.” Bank of Canada Working Paper No. 2006-33.
Allen, J. and Y. Liu. 2007. “Efficiency and Economies of Scale of Large Canadian Banks.”
Canadian Journal of Economics 40(1): 225–44.
Bikker, J. and J. Groeneveld. 2000. “Competition and Concentration in the EU Banking
Industry.” Kredit und Kapital 33(1): 62–98.
Bikker, J. and K. Haaf. 2002. “Competition, Concentration and their Relationship: An
Empirical Analysis of the Banking Industry.” Journal of Banking and Finance (26):
2191–2214.
Bikker, J., L. Spierdijk, and P. Finnie. 2006. “Misspecification of the Panzar-Rosse Model:
Assessing Competition in the Banking Industry.” De Nederlandsche Bank Working Paper
No. 114.
Bordo, M. 1995. “Regulation and Bank Stability.” World Bank Policy Research Working
Paper No. 1532.
Boyd, J., G.D. Nicolo, and B. Smith. 2004. “Crises in Competition Versus Monopolistic
Banking Systems.” Journal of Money, Credit and Banking 36(3): 487–506.
Carletti, E. and P. Hartmann. 2003. Competition and Financial Stability: What’s Special
About Banking? In Monetary History, Exchange Rates and Financial Markets: Essays in
Honour of Charles Goodhardt, edited by: P. Mizen. Cheltenham: Edward Elgar.
Claessens, S. and L. Laeven. 2004. “What Drives Bank Competition? Some International
Evidence.” Journal of Money, Credit and Banking 36(3): 563–83.
———. 2005. “Financial Dependence, Banking Sector Competition and Economic
Growth.” Journal of European Economic Association 3(1): 179–207.
Daniel, F., C. Freedman, and C. Goodlet. 1993. “Restructuring the Canadian Financial
Industry.” Bank of Canada Review (Winter): 21–45.
Demirguc-Kunt, A. and E. Detragiache. 2005. “Cross-Country Empirical Studies of
Systemic Bank Distress: A Survey.” IMF Working Paper No. 05–96.
14
Engert, W., B. Fung, L. Nott, and J. Selody. 1999. “Restructuring the Canadian Financial
System: Explanations and Implications.” In The Monetary and Regulatory Implications
of Changes in the Banking Industry. Bank for International Settlements.
Franklin, F. and D. Gale. 2004. “Competition and Financial Stability.” Journal of Money,
Credit and Banking 36(3): 453–80.
Freedman, C. 1998. The Canadian Banking System. Technical Report No. 81. Ottawa:
Bank of canada.
Genesove, D. and W. Mullin. 1998. “Testing Static Oligopoly Models: Conduct and Cost in
the Sugar Industry, 1890-1914.” RAND Journal of Economics 29(2): 355–77.
Molyneux, P., Y. Altunbas, and E. Gardener. 1996. Efficiency in European Banking.
London: John Wiley & Sons.
Nathan, A. and E. Neave. 1989. “Competition and Contestability in Canada’s Financial
System: Empirical Results.” Canadian Journal of Economics 22(3): 576–94.
Northcott, C.A. 2004. “Competition in Banking: A Review of the Literature.” Bank of
Canada Working Paper No. 2004-24.
Panzar, J. and J. Rosse. 1987. “Testing for ‘Monopoly’ Equilibrium.” Journal of Industrial
Economics 35(4): 443–56.
Rime, B. 1999. “Mesure de degre de concurrence dans le systeme bancaire Suisse l’aide du
modele de Panzar et Rosse.” Revue suisse d’economie politique et de statistique 135(1):
21–40.
Schaeck, K., M. Cihak, and S. Wolfe. 2006. “Are More Competitive Banking Systems More
Stable?” IMF Working Paper No. 2006–143.
Shaffer, S. 1983. “Non-Structural Measures of Competition: Toward a Synthesis of
Alternatives.” Economic Letters 12: 349–53.
———. 1993. “A Test of Competition in Canadian Banking.” Journal of Money, Credit
and Banking 25(1): 49–61.
———. 2004. “Comment on ‘What Drives Bank Competition? Some International
Evidence’ by Stijin Claessens and Luc Laeven.” Journal of Money, Credit and Banking
36(3): 585–92.
15
Vesala, J. 1995. “Testing for Competition in Banking: Behavioural Evidence from
Finland.” Bank of Finland Studies Working Paper No. E:1.
16
Table
1R
esu
lts
from
Oth
er
Stu
die
s:H
-sta
tist
ics
ofC
anadia
nB
anks
Stu
die
sH
-sta
tist
ics
Per
iod
Not
esC
oncl
usi
onN
athan
and
Nea
ve(1
989)
1.06
1982
All
ban
ks
Per
fect
com
pet
itio
nN
athan
and
Nea
ve(1
989)
0.68
1983
All
ban
ks
Mon
opol
isti
cco
mpet
itio
nN
athan
and
Nea
ve(1
989)
0.73
1984
All
ban
ks
Mon
opol
isti
cco
mpet
itio
nB
ikke
ran
dH
aaf(2
002)
0.60
1991
All
ban
ks
Mon
opol
isti
cco
mpet
itio
nB
ikke
ran
dH
aaf(2
002)
0.62
1997
All
ban
ks
Mon
opol
isti
cco
mpet
itio
nB
ikke
ran
dH
aaf(2
002)
0.74
1991
Sm
allban
ks
Mon
opol
isti
cco
mpet
itio
nB
ikke
ran
dH
aaf(2
002)
0.63
1991
Mid
-sca
leban
ks
Mon
opol
isti
cco
mpet
itio
nB
ikke
ran
dH
aaf(2
002)
0.56
1991
Lar
geban
ks
Mon
opol
isti
cco
mpet
itio
nB
ikke
ran
dH
aaf(2
002)
0.60
1997
Lar
geban
ks
Mon
opol
isti
cco
mpet
itio
nC
laes
sens
and
Lae
ven
(200
4)0.
6719
94-2
001
All
ban
ks
Mon
opol
isti
cco
mpet
itio
nC
laes
sens
and
Lae
ven
(200
5)0.
6719
87-1
991
All
ban
ks
Mon
opol
isti
cco
mpet
itio
nC
laes
sens
and
Lae
ven
(200
5)0.
6219
92-1
996
All
ban
ks
Mon
opol
isti
cco
mpet
itio
nB
ikke
r,Spie
rdijk,an
dFin
nie
(200
6)-0
.001†
1987
-200
4A
llban
ks
Mon
opol
y
†B
ikke
r,Spie
rdijk,an
dFin
nie
(200
6)co
ncl
ude
that
the
Can
adia
nban
kin
gsy
stem
isnot
ineq
uilib
rium
for
thei
rsa
mple
per
iod,an
ddis
mis
sth
isre
sult
asm
eanin
gles
s.
17
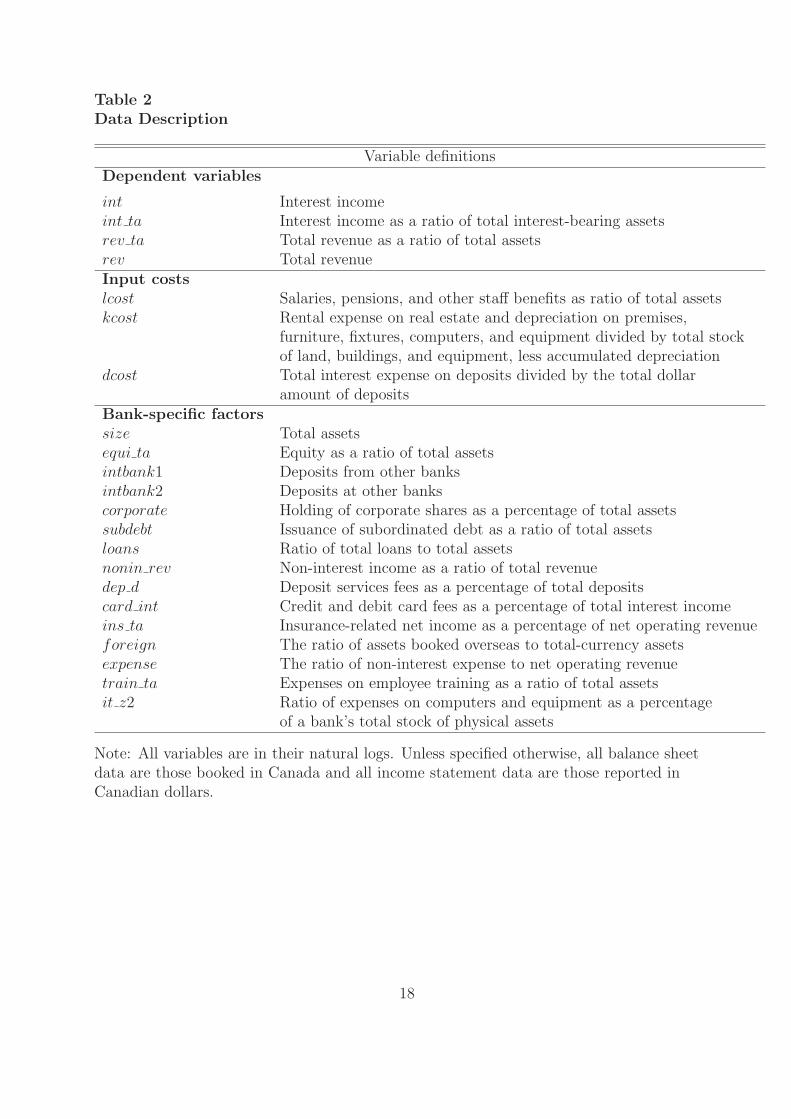
Table 2Data Description
Variable definitionsDependent variables
int Interest incomeint ta Interest income as a ratio of total interest-bearing assetsrev ta Total revenue as a ratio of total assetsrev Total revenueInput costslcost Salaries, pensions, and other staff benefits as ratio of total assetskcost Rental expense on real estate and depreciation on premises,
furniture, fixtures, computers, and equipment divided by total stockof land, buildings, and equipment, less accumulated depreciation
dcost Total interest expense on deposits divided by the total dollaramount of deposits
Bank-specific factorssize Total assetsequi ta Equity as a ratio of total assetsintbank1 Deposits from other banksintbank2 Deposits at other bankscorporate Holding of corporate shares as a percentage of total assetssubdebt Issuance of subordinated debt as a ratio of total assetsloans Ratio of total loans to total assetsnonin rev Non-interest income as a ratio of total revenuedep d Deposit services fees as a percentage of total depositscard int Credit and debit card fees as a percentage of total interest incomeins ta Insurance-related net income as a percentage of net operating revenueforeign The ratio of assets booked overseas to total-currency assetsexpense The ratio of non-interest expense to net operating revenuetrain ta Expenses on employee training as a ratio of total assetsit z2 Ratio of expenses on computers and equipment as a percentage
of a bank’s total stock of physical assets
Note: All variables are in their natural logs. Unless specified otherwise, all balance sheetdata are those booked in Canada and all income statement data are those reported inCanadian dollars.
18
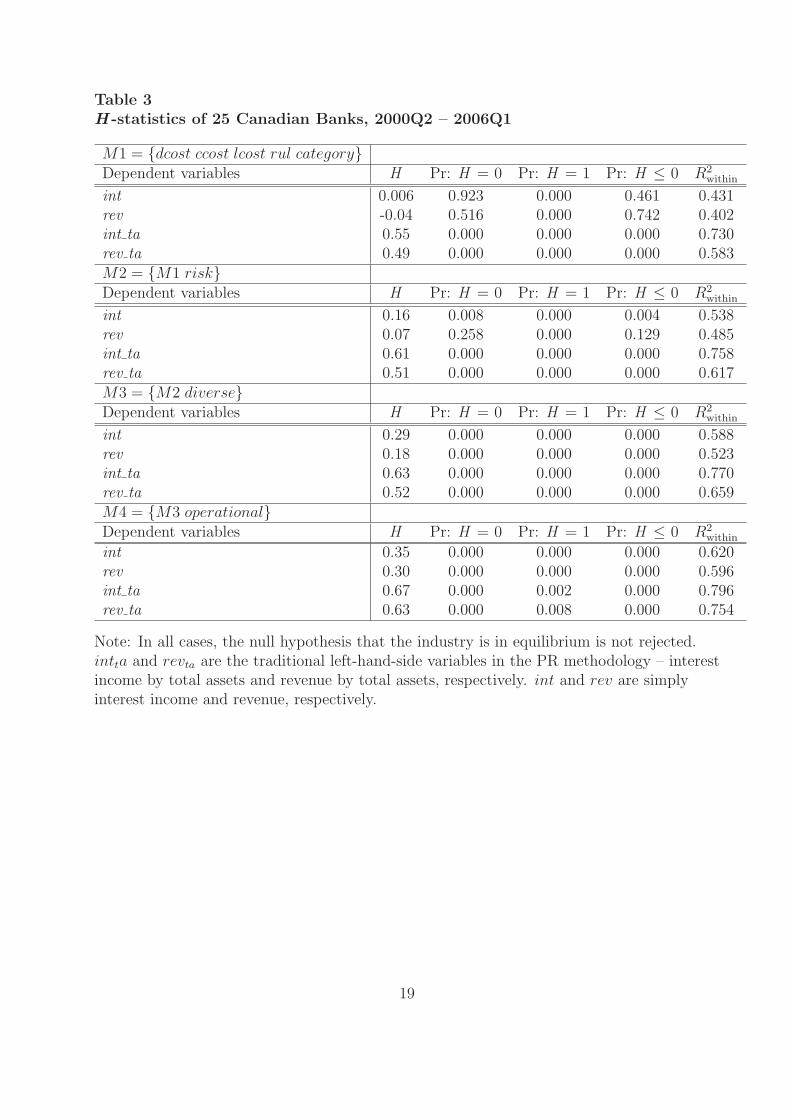
Table 3H -statistics of 25 Canadian Banks, 2000Q2 – 2006Q1
M1 = {dcost ccost lcost rul category}Dependent variables H Pr: H = 0 Pr: H = 1 Pr: H ≤ 0 R2
within
int 0.006 0.923 0.000 0.461 0.431rev -0.04 0.516 0.000 0.742 0.402int ta 0.55 0.000 0.000 0.000 0.730rev ta 0.49 0.000 0.000 0.000 0.583M2 = {M1 risk}Dependent variables H Pr: H = 0 Pr: H = 1 Pr: H ≤ 0 R2
within
int 0.16 0.008 0.000 0.004 0.538rev 0.07 0.258 0.000 0.129 0.485int ta 0.61 0.000 0.000 0.000 0.758rev ta 0.51 0.000 0.000 0.000 0.617M3 = {M2 diverse}Dependent variables H Pr: H = 0 Pr: H = 1 Pr: H ≤ 0 R2
within
int 0.29 0.000 0.000 0.000 0.588rev 0.18 0.000 0.000 0.000 0.523int ta 0.63 0.000 0.000 0.000 0.770rev ta 0.52 0.000 0.000 0.000 0.659M4 = {M3 operational}Dependent variables H Pr: H = 0 Pr: H = 1 Pr: H ≤ 0 R2
within
int 0.35 0.000 0.000 0.000 0.620rev 0.30 0.000 0.000 0.000 0.596int ta 0.67 0.000 0.002 0.000 0.796rev ta 0.63 0.000 0.008 0.000 0.754
Note: In all cases, the null hypothesis that the industry is in equilibrium is not rejected.intta and revta are the traditional left-hand-side variables in the PR methodology – interestincome by total assets and revenue by total assets, respectively. int and rev are simplyinterest income and revenue, respectively.
19