Embed Size (px)
Citation preview
A normative study of family media habits
Douglas A. Gentile*, David A. Walsh
National Institute on Media and the Family, 606 24th Avenue South,
Suite 606, Minneapolis, MN 55454, USA
Accepted 28 January 2002
Abstract
The present study documents family media habits in six areas: electronic and print Media Use,
parental Monitoring of children’s media, parental Consistency regarding rules for children’s media use,
parents’ reports of observable Media Effects on their children, parents’ Knowledge about media and
media effects, and how much children participate in Alternative Activities to electronic media. A
random national sample of 527 parents of 2- to 17-year-olds were surveyed. Normative descriptive
statistics in each of the six categories are provided. In general, families’ scores in five of the six
categories are positively correlated, indicating that families that practice positive media habits in one
area tend to practice positive habits in other areas. Many family media habits predict children’s school
performance. Furthermore, having TVs in children’s bedrooms is correlated with lower scores in all six
areas, as well as with lower school performance. This study provides a normative baseline for future
research. D 2002 Elsevier Science Inc. All rights reserved.
Keywords: Electronic media; Television; Children; Monitoring; Consistency; Parenting
1. Introduction
Research on the uses and effects of media has been a fertile area for study over the past five
decades. Yet, most of the research has focused on individuals rather than family systems.
Some researchers have begun to consider media within an ecological or systems framework.
For example, Goodman (1983) stated, ‘‘The family system can be seen to include the family
0193-3973/02/$ – see front matter D 2002 Elsevier Science Inc. All rights reserved.
PII: S0193 -3973 (02 )00102 -8
* Corresponding author. Tel.: +1-612-672-5437; fax: +1-612-672-4113.
E-mail address: [email protected] (D.A. Gentile).
Applied Developmental Psychology
23 (2002) 157–178
unit and the television. Family members interact with each other and with the television, both
individually and as a family unit’’ (p. 408).
Public debate over the role of media usage in shaping values and attitudes increases every
year. Numerous studies have demonstrated predictable correlations between school perform-
ance and children’s use of media (e.g., Dorr & Rabin, 1995; Huston et al., 1992; Lin & Atkin,
1989); for example, for children watching at least 10 h of television per week, children’s
school performance declines as their amount of television watching increases. It is not
sufficient to base these debates and studies on discrete statistics such as how individuals use
media or how often a television is on in a given household. Media is not a discrete variable
within the family environment; it is part of the rich interplay of variables that makes family
life complex and formative. One of the gaps in our knowledge of family media usage has
been the lack of a comprehensive picture of how average families relate to and interact with
media. In other words, what are the media habits (e.g., usage, rules, monitoring, etc.) of the
average family?
In documenting how families use media, both individual- and family-level variables are
important. For example, 58% of families with children have the television on during dinner
(Roberts, Foehr, Rideout, & Brodie, 1999). Presumably, this affects family interactions, in that
this would be a time when family members would usually talk to one another. Furthermore,
rules about media can be predicted by the number of parents in the household, the number of
siblings, parent education level, parent employment, child age, and the number of TVs in a
house (Dorr & Rabin, 1995; Lin & Atkin, 1989). In fact, it has been suggested that the
presence of rules about TV implies that TV is integrated into the family (Andreasen, 1990).
The effects are likely to be bidirectional. Television use may both affect and be affected by
family interactions. There is less verbal communication, less looking at each other, but more
physical touching among family members when the TV is on (National Institute of Mental
Health, 1982). Furthermore, effects on one member of the family can affect the whole family
system (Cantor & Mares, in press). Imagine the effect on the whole family of a child who
cannot sleep all night because she is scared by something she saw in a movie.
Because many researchers are moving to more of a systems approach when studying
media uses and effects, there appears to be a need for a normative study of family media
habits. Such a study could provide the foundation and context for studies as well as serving as
a valuable benchmark for communities, policymakers, and individual families. By comparing
family habits with the identified norms, we gain a clearer perspective on changes, if any, that
we need to make at the individual, family, or community level.
We created the MediaQuotient survey tool to measure family media habits and observed
media effects. Our first goal was to assess how many hours per week children and youth spend
withmedia and family rules regarding the use ofmedia. Our second goal was to gain insight into
how media messages, habits, and usage were supported, reinforced, or contradicted by other
family interactions. If there are rules, are they enforced consistently? If children are playing
video games, do they also have structured family alternatives? Our third goal was to examine
how all these factors— usage and family dynamics—might relate to school performance.
To construct the MediaQuotient tool, we identified the six critical domains of study that the
tool would have to measure. These six domains became the indices through which we
D.A. Gentile, D.A. Walsh / Applied Developmental Psychology 23 (2002) 157–178158
gathered and interpreted our data. They are Media Use, Monitoring, Consistency, Media
Effects, Media Knowledge, and Alternative Activities. Each of these six indices is described
below, along with theoretical reasons for its inclusion.
1.1. Media use
Children are growing up in a media-saturated environment. Current estimates suggest that
the ‘‘average’’ American child between 2 and 18 spends 5 h and 48 min/day with electronic
media and 44 min/day with print media (Roberts et al., 1999). Television still dominates
children’s media landscape, accounting for 3 h and 25 min of watching videotaped or live
programming. Music, computer use, movies, and video games account for the rest of the
electronic media diet.
Media consumption has been shown to be related to a number of family variables (Roberts
et al., 1999). Children in single parent homes watch more television, more movies, and listen
more to the radio each day than children in two-parent homes. Children in minority families
watch more television, watch more movies, and play more video games. Children in low-
income families watch more television, watch more movies, play more video games, listen to
the radio and CDs more, read less, and use the computer less than children in higher-income
families. Similar patterns are found for parental education level, such that lower education
levels are correlated with higher electronic media use.
Researchers have documented numerous effects related to both the amount of media
consumed and to the content of the media consumed. Many negative outcomes are correlated
with increased amount of viewing television. These include lowered school performance
(Huston et al., 1992; Roberts et al., 1999; Williams, Haertel, Haertel, & Walberg, 1982),
increased aggression (American Academy of Pediatrics, 1995; Strasburger & Donnerstein,
1999), increased obesity (Gable & Lutz, 2000; Robinson, 1999), and the prevalence of
symptoms of psychological trauma (Singer, Slovak, Frierson, & York, 1998, cited in Cantor
& Mares, in press).
Effects related to the amount of media are also present for media other than television.
High levels of Internet use have been associated with lowered time spent with other human
beings, lower communication, and increased depression and loneliness (Hughes, Ebata, &
Dollahite, 1999; Kraut et al., 1998; Stanford Institute for the Quantitative Study of Society,
2000), although not all studies have found these effects (Katz & Aspden, 1997; Parks &
Roberts, 1998).
Increased amount of video game play is correlated with poorer grades (Gentile, Lynch,
Linder, & Walsh, 2002). With regard to print media, the amount of reading (reading volume)
contributes significantly to vocabulary, general knowledge, spelling, and verbal fluency, even
controlling for differences in intelligence and reading ability (Cunningham & Stanovich,
1998). Despite the fact that reading to young children is the best predictor of later reading
ability, only one-half of infants and toddlers are read to routinely (Anderson, Hiebert, Scott, &
Wilkinson, 1985; Carnegie Task Force on Meeting the Needs of Young Children, 1994).
Media content also has effects independent of the amount of exposure. For example, media
diets high in violence have been shown to increase aggression, fear, desensitization, and
D.A. Gentile, D.A. Walsh / Applied Developmental Psychology 23 (2002) 157–178 159
appetites for more media violence (e.g., Donnerstein, Slaby, & Eron, 1994). Educational
television has been shown to teach prosocial attitudes (e.g., nonsexist and nonracist attitudes),
skills (e.g., reading, math, science, media literacy skills, etc.), emotion recognition, and
empathy (Calvert, 1999). In contrast to diets of educational television, diets of typical
television tend to teach more sexist and aggressive attitudes, fear, and consumer behavior
(Dorr & Rabin, 1995).
1.2. Monitoring
Media can be monitored in many ways. Parents can set limits on the amount of media
allowed, the types of content allowed, or the context within which media consumption may
take place (e.g., coviewing). A number of reviews have shown that parents typically do not
exert much control over the media that their children consume (e.g., Austin, 1993; Dorr &
Rabin, 1995; National Institute of Mental Health, 1982; Strasburger & Donnerstein, 1999). In
a survey of children between 8 and 18, only 38% said that their families had ‘‘any rules about
watching television’’ (Roberts et al., 1999). Having multiple television sets in households
may also make it more difficult to have rules or limits, since there is increased privatization of
viewing. One recent study showed that 85% of the time children watch television, parents are
not in the room (Roberts et al., 1999). Yet, limits have been shown to be effective in reducing
time with television (Truglio, Murphy, Oppenheimer, Huston, & Wright, 1996) and even to
have beneficial effects in some cases. In one experimental study, reducing the amount of
television children watched by half improved Performance IQ and increased reading time
(Gadberry, 1980).
Parents and policymakers have been interested in having media ratings in order to provide
information to caregivers. Movies have been rated since 1968, video games since 1994, and
television shows since 1997. Unfortunately, each rating system is different from the others,
and parents have voiced complaints about how difficult they are to understand and to use
(e.g., American Medical Association, 1994; Cantor, 1998a; Cantor, Stutman, & Duran, 1996;
Dart & Shepard, 1999; National Institute on Media and the Family, 1996; Walsh, 1998).
Regardless of the possible shortcomings of the various rating systems, they do provide some
information for parents. Yet, many parents do not use them consistently, perhaps because of
how confusing they seem. Only 32% of 10- to 17-year-olds say that their parents use the
television rating system (Kaiser Family Foundation, 1998), and 90% of teenagers say that
their parents never check the video game ratings before allowing them to rent or buy
computer or video games (Walsh, 2000).
Research on parental coviewing and mediation of media messages has shown that both
coviewing and talking about media messages have the potential to be beneficial. Some
researchers have suggested that coviewing may be an effective way to mitigate many of the
potentially harmful effects of television viewing (e.g., Huston et al., 1992; Strasburger &
Donnerstein, 1999). It is hypothesized that coviewing may provide an opportunity for parents
to filter the values shown by different media, reinforcing some and rejecting others, and by
teaching children to be educated media consumers. Furthermore, some researchers have
shown that coviewing can also facilitate children’s understanding and learning from
D.A. Gentile, D.A. Walsh / Applied Developmental Psychology 23 (2002) 157–178160
educational television (e.g., Huston et al., 1992; Lin & Atkin, 1989). Yet, Austin (1993) has
suggested that mere coviewing may not mediate children’s interpretations. Active parental
involvement and discussion may be necessary. Indeed, some researchers have noted that rules
limiting media use and active mediation (both positive encouragement to watch ‘‘positive’’
media and discouragement of ‘‘negative’’ messages) are theoretically independent of each
other (e.g., Dorr & Rabin, 1995; Lin & Atkin, 1989). Whereas rules and limits have been
shown to affect children’s viewing, active mediation while viewing has been shown to
influence children’s understanding, reactions to, and imitation of program content. Mediation
has been shown to increase learning, belief in social norms, skepticism, and to decrease fear.
Parental mediation has been shown to be related both to better academic performance and to
beliefs about the benefits of drinking alcohol (Austin, 1993; Austin, Pinkleton, & Fujioka,
2000; Dorr & Rabin, 1995; Lin & Atkin, 1989).
1.3. Consistency
Parental consistency can be defined as the similarity with which a child is treated by one or
both parents in various situations (Brand, Crous, & Hanekom, 1990). With respect to media
habits, parental inconsistency could be displayed in one of at least four manners: (1) Parents
could be inconsistent across time; for example, they could require children to ask permission
before going to see a movie some times but not others. (2) Parents could be inconsistent
between different children in the family; for example, they could put limits on the amount of
time one child may play video games but not limit another child. (3) Parents could be
inconsistent among themselves, for example, both parents may not agree on the rules for
children’s media use. (4) Parents might model behaviors that are not consistent with their
stated beliefs or that do not promote consistency; for example, they may have the TV on
regularly even if no one is watching it.
Although we do not know of any studies that document the effects of parental consistency
with regard to media, numerous studies have shown that parental disciplinary consistency
is strongly related to children’s developmental outcomes. In one recent study (Frick,
Christian, & Wooton, 1999), parental consistency accounted for the most variance in pre-
dicting adolescent conduct problems (38%) of any of the parenting constructs measured. In
another study (Brand et al., 1990), parental consistency accounted for over half of the
variance in adolescent emotional development. These studies suggest that parental consist-
ency of media rules may be important for children’s outcomes. Some research has suggested
that parents often are not as consistent with children’s media use as they could be. For
example, fewer than half of parents report ‘‘always’’ watching TV with their children
(Strasburger & Donnerstein, 1999).
1.4. Media effects
Besides measuring family media habits, we felt that it was important to measure parents’
reports of children’s behaviors that may be the effects of media. Given the prominence of
electronic media in children’s lives, it is reasonable to be concerned about the potential effects
D.A. Gentile, D.A. Walsh / Applied Developmental Psychology 23 (2002) 157–178 161
of media. Media effects can be positive or negative (Walsh, Goldman, & Brown, 1996).
Concern about effects reached a new high with Bandura’s classic studies showing that
children learn aggression when they are exposed to violent content, even if they do not copy it
immediately (e.g., Bandura, 1965). Children as young as 14 months of age have been shown
to copy behaviors shown on a TV screen (Barr & Hayne, 1999; Meltzoff, 1988). Media
content can increase physiological arousal, decrease physiological arousal (desensitization),
and can cause persistent fears (e.g., Cantor, 1998b; Cantor & Mares, in press; Huston et al.,
1992). Media habits have been shown to be related to youth drinking (e.g., Austin et al.,
2000), youth smoking (e.g., Strasburger & Donnerstein, 1999), childhood obesity (e.g.,
Robinson, 1999), and sleep disturbances (e.g., Owens et al., 1999). There is a positive
correlation between exposure to advertisements and consumption (Strasburger & Donner-
stein, 1999). Increased media usage (in terms of amount) is correlated with poorer social
relationships, fewer social interactions, lower reading scores, and poorer school achievement
(e.g., Dorr & Rabin, 1995; Stanford Institute for the Quantitative Study of Society, 2000).
However, increased usage of educational and prosocial media have been shown to have
beneficial effects (e.g., Linebarger, 2000). This is only a partial review of the effects media
may have on children and families.
The family setting is an excellent context in which to examine the effects of media on
children. Parents are in a privileged position to notice whether their children are copying be-
haviors that they have seen on TV, to know whether their children want to dress like media
stars, to know how much the children nag for products that they have seen advertised, or to
know whether their children have been scared about something that they have seen in a movie
or on TV.
1.5. Media knowledge
How much parents know about media, rating systems, and media effects may play an
important role in how families use media. Parents as a group tend to underreport the amount
of time children watch TV, how much violence they see, and how much it affects their
children (Cantor & Mares, in press; National Institute of Mental Health, 1982; Strasburger &
Donnerstein, 1999). This may be part of the reason why parents exert few controls over their
children’s media use.
While the vast majority of parents understand the movie rating system, far fewer
understand the TV rating system, the video game rating system, or the Internet rating system.
For example, only 14% of parents can define 9 out of the 11 TV rating symbols, and only
22% of parents with children under 10 can name one of the children’s show ratings (Kaiser
Family Foundation, 1998). The fact that the rating systems for movies, TV, video games,
arcade video games, Internet sites, and recorded music are different is likely to contribute to
parents’ lack of understanding and lack of use (Walsh & Gentile, 2001). This is unfortunate,
because almost two-thirds of parents who have used the TV rating system say that it has been
somewhat or very successful at keeping children from being exposed to inappropriate
material (Kaiser Family Foundation, 1998). Obviously, parents need to know about rating
systems before they can use them effectively.
D.A. Gentile, D.A. Walsh / Applied Developmental Psychology 23 (2002) 157–178162
Parents’ media knowledge may be important for multiple reasons. Providing informa-
tion about television shows and recommendations to parents increases parent–child
discussions about television programs (National Institute of Mental Health, 1982). As
was stated in Section 1.2, parental mediation has been shown to have a significant effect
on children’s understanding and media effects. It has been suggested that increasing
parents’ media literacy may be an effective way to influence children’s critical viewing
skills (Abelman, 1990, cited in Dorr & Rabin, 1995). Furthermore, there is some support
for the idea that parents can impart their values to children in a way that acts as
‘‘preventive socialization’’ (Dorr & Rabin, 1995). That is, by imparting knowledge, be-
liefs, attitudes, and patterns of behavior, parents can effectively influence children’s media
habits and the results of those habits even when the parents are not available to monitor
children’s media use.
Thus, parents’ media knowledge is likely to be important in mediating children’s media
habits and the effects that could result from those habits (e.g., American Academy of Pe-
diatrics, 1999). Because children’s television viewing patterns are highly stable beginning in
preschool (Huston, Wright, Rice, Kerkman, & St. Peters, 1990), addressing parental know-
ledge is very important since parents are in a position to help set early media habits.
1.6. Alternative activities
As has been shown above, there is a great deal of research suggesting that spending large
amounts of time with electronic media (especially TV) may have negative cognitive, emo-
tional, and physical outcomes for children. In many cases, these effects may be indirect,
through the reduction of other activities. Adult Internet users say that they attend fewer
events, spend less time with family and friends (both in person and on the phone), and spend
less time reading newspapers because of the Internet (Stanford Institute for the Quantitative
Study of Society, 2000). Children who are heavy TV viewers also have fewer hobbies and
engage in fewer extracurricular activities than light viewers (Huston et al., 1992). Watching
television is associated with lower family communication (National Institute of Mental
Health, 1982), yet the amount of mothers’ speech to infants has been shown to be a significant
predictor of children’s later vocabularies (Brownlee, 1998).
There is evidence that participation in a number of types of nonelectronic media activities
may have benefits for children. Children’s participation in arts programs is associated with
math, reading, writing, and language skills. There is also evidence that working with creative
drama and theatre may have benefits for language, reading, writing, and interpersonal skills
(Seidel, 1998). In a longitudinal study of 695 students tracked from middle childhood to age
24, it was found that participation in school extracurricular activities was related to reduced
rates of school dropout and criminal arrest, even among high-risk youth (Mahoney, 2000). If
the students’ friends also participated in extracurricular activities, there was an additional
decrease in antisocial outcomes. Gable and Lutz (2000) also found that the risk of childhood
obesity is negatively related to the amount of active play and participation in extracurricular
activities. However, they found a positive relationship between childhood obesity and the
amount of television watched.
D.A. Gentile, D.A. Walsh / Applied Developmental Psychology 23 (2002) 157–178 163
In a study of over 3000 8th and 11th grade students, Willits and Willits (1986, p. 189)
attempted to discover whether adolescent involvement in work, organizations, and social
groups tended to encourage or discourage other participation in extracurricular activities. This
study included broad categories of youth involvement in work, chores, family and peer
socialization, reading, participation in school and community organizations, and watching
television. In general, they found that participation in leisure activities and after-school jobs
tends to increase the odds that students ‘‘seek out and utilize additional opportunities for
leisure participation.’’ The only item that clearly contradicted this finding was the amount of
time spent watching TV. That is, the more time youth spent watching TV, the less time they
spent in other leisure activities.
Heavy electronic media use may thus pose double jeopardy for children, both because
heavy media use has been linked to numerous negative outcomes (often linked to the types of
content consumed, e.g., media violence) and because participation in alternatives to electronic
media has been linked to numerous positive outcomes. In a review of parenting and
television, Dorr and Rabin (1995) sum up the research by stating that parents emphasizing
alternatives to electronic media (TV in their specific review) may even be more effective in
promoting positive development than parental monitoring.
It was hypothesized that family scores on the six indices described above would be
positively correlated with each other. That is, we expected that family systems would show
fairly consistent patterns regarding media-related variables. Families that score well on Media
Use would also score well on Monitoring, Consistency, Media Effects, Media Knowledge,
and Alternative Activities (each index is scored such that a high score is ‘‘good’’). It was
further hypothesized that children’s amount of television viewing would also be negatively
correlated with each of the indices.
We were also interested in learning how family media habits would be related to chil-
dren’s school performance. We hypothesized (based on our understanding of other research)
that we would find positive correlations between the Media Use and Alternative Activities
indices and children’s school performance. We did not make any predictions about the rela-
tionship between the other indices and school performance and approached these as ex-
ploratory analyses.
2. Method
2.1. Participants
The sample was a random national sample of parents of children aged 2–17. In order to
ensure that the sample included at least 100 completed surveys from low-income families
(who are harder to survey), two national lists of parents were purchased from Metromail
(a national list vendor). One list was a general list of parents of 2- to 17-year-olds, in-
cluding addresses and telephone numbers. The second list targeted low-income parents of
2- to 17-year-olds, including addresses and telephone numbers where available. Potential
respondents were sampled randomly from both lists.
D.A. Gentile, D.A. Walsh / Applied Developmental Psychology 23 (2002) 157–178164
The independent research firm Anderson, Niebuhr, and Associates stratified the sample
such that at least 400 respondents were randomly selected from the general parent list, and at
least 100 respondents were from low-income households (defined as earning under
US$25,000 annually).
The final sample included 422 respondents from the general parent list and 105
respondents from the low-income parent list, for a total sample size of 527. The sample
size yields results accurate to ± 4% with a 95% confidence level when generalizing to
American parents as a whole. The response rate for the general parent group was 58%, and
the response rate for the low-income parents was 45%. The overall response rate was 55%.
The average family in the sample had 2.18 children living at home. The children of the
respondents in the sample were evenly divided by gender. Seventy-eight percent of the res-
pondents were married. Seventy-six percent of households surveyed had two adults, 13% had
one adult, and 11% had more than two adults (adult children could be counted as adults).
Seventy-six percent of respondents were from Caucasian households, 11% were from African
American households, 5% were from Hispanic/Latino households, 4% were from multiracial
households, 3% were from Native American households, and 1% were from Asian or Pacific
Islander households. Thirty-seven percent of respondents had no higher than a high school
education, 29% had attended some college or had a 2-year degree, and 34% had at least a
college degree. All income levels were represented in the sample, and the data were weighted
to reflect the appropriate national proportions. Overall, 79% of households in this sample
subscribed to cable or satellite TV services, and 41% had an Internet connection from home,
although these percentages vary by income level.1
2.2. Questionnaire design
The MediaQuotient questionnaire was developed through a rigorous process of expert
reviews and pretests. Panels of parents and media education experts met to discuss the issues
and topics to be addressed in the questionnaire. Using information from these meetings, as
well as information gleaned from a literature review, a draft was prepared. The questionnaire
was pretested and revised multiple times with convenience samples of parents as well as with
a national random sample of parents. The items were combined to create six indices.
The Media Use index comprises items relating to the family’s use of television, movies,
books and music. The index assesses the overall pattern of media use. It includes both
individual and family level variables. The index is designed to provide high scores for
families that use electronic and print media in healthy ways. For example, a family would
receive a high score for frequent watching of educational television, but would receive a low
score for frequent television watching while doing homework.
1 For both cable/satellite TV and Internet services, higher-income households were more likely to subscribe.
Among families earning under US$15,000 annually, 69% subscribe to cable/satellite TV and 16% have home
Internet access. For families earning between US$15,000 and US$24,999, these numbers rise to 76% and 22%,
respectively; US$25,000–35,999: 83% and 30%, respectively; US$36,000–54,999: 80% and 43%, respectively;
US$55,000–100,000: 85% and 60%, respectively; Over US$100,000: 86% and 71%, respectively.
D.A. Gentile, D.A. Walsh / Applied Developmental Psychology 23 (2002) 157–178 165
The Monitoring index is comprised of items relating to parental use of rating systems,
household rules for media use and purchases, family discussions about what children see and
hear, and parental monitoring of the content of television, movies, music, Internet sites, and
video and computer games.The index is designed to provide high scores for parentswhomonitor
what their children see and hear, set limits and talk to their children frequently about what they
see and hear. For example, a family would receive a high score for frequent use of ratings to
choose programs towatch or for frequently talking to children about themusic that they listen to.
The Consistency index is comprised of items relating to the family’s consistency of
applying rules for children’s media use, both within and between parents. The index is
designed to provide high scores for families who set limits on media use, and regularly apply
those limits. For example, a family would receive a high score for always requiring children
to ask permission before going to see a movie, but would receive a low score if the parents
did not agree on the rules for children’s media use.
The Media Effects index is comprised of items relating to children’s vulnerability to
various media effects. The index is designed to provide high scores for children who are not
influenced by media. For example, a family would receive a high score if their children never
copy characters seen on TV, but would receive a low score for frequently becoming scared
that something that they saw in movies or on TV would happen to them.
The Media Knowledge index is comprised of items relating to the family’s knowledge
about media and media effects. The index is designed to provide high scores for families that
know a lot about media, media rating systems, and media effects. For example, a family
would receive a high score for understanding all of the TV rating symbols, but would receive
a low score for not knowing that children who watch a lot of violent TV are more aggressive
than children who watch less violent TV.
The Alternative Activities index is comprised of items relating to the family’s use of
alternatives to electronic media. The index is designed to provide high scores for families that
frequently use print media, go on outings together, and do activities together. For example, a
family would receive a high score for frequently going to the library, but would receive a
lower score for rarely playing games together.
Each of the six MediaQuotient indices is designed to measure an underlying construct. The
reliability coefficient (Cronbach a) for the six indices is as follows: Media Use, a = .75;
Monitoring, a= .89; Consistency, a= .73; Media Effects, a = .63; Media Knowledge, a = .25;
and Alternative Activities, a= .66. The low alpha value for the Media Knowledge index was
expected because of the wide range of topics measured by this index (e.g., it is entirely
plausible that one could know that children can learn stereotypes from TV, but not know all of
the TV ratings symbols).2
2 The reliability coefficient can be interpreted as the lower bound of the amount of variance explained by
common factors measured by the items in the index (Crocker & Algina, 1986). When an index measures
theoretically homogenous constructs, one would expect a to be 0.70 or higher. We hypothesized that a would be
highest for the monitoring and consistency indices, somewhat lower but still around 0.70 for the media use and
alternative activity indices, and lower than 0.70 for the media effects and media knowledge scales because these
indices are heterogenous.
D.A. Gentile, D.A. Walsh / Applied Developmental Psychology 23 (2002) 157–178166
Because media habits (e.g., use, monitoring, etc.) are different for different ages children,
parents of multiple children were asked to report on both their oldest (under 18 years) and
youngest (at least 2 years old) children. These extremes were chosen to give the widest range
of responses. Responses were averaged across children to give a general picture of children’s
media habits.
A separate convenience sample of 35 parents of children aged 2–17 completed the
instrument twice in order to measure test–retest reliability. Thirty-three of the parents
completed both instruments, with an average of 12 days (SD= 6.4, range 6–31 days) between
the first and second administrations. Across all items, the mean test–retest correlation is
r= .75. The mean test–retest correlation for the six indices is r= .85. The individual test–retest
correlations for the six indices are as follows: Media Use, r = .96; Monitoring, r = .82;
Consistency, r = .89; Media Effects, r = .84; Media Knowledge, r = .81; and Alternative
Activities, r = .82.
2.3. Procedure
The study was conducted using survey methods developed by Anderson–Niebuhr,
involving mail with telephone follow-up. These procedures include the following series
of steps:
1. Initial Mailing. The initial questionnaire and cover letter is sent by first-class mail. A
preaddressed, postage-paid return envelope is also enclosed.
2. Mail Follow-up. Those who do not respond to the initial mailing are sent a reminder,
along with another copy of the questionnaire and postage-paid return envelope. Those
who still do not respond are sent an additional mail follow-up reminder, which includes
another copy of the questionnaire and postage-paid envelope.
3. Telephone Follow-up. This phase involves contacting any remaining nonrespondents by
telephone to encourage their participation. Finally, those who do not respond by mail,
even after being reminded by telephone, are invited to complete the survey by telephone
with a professional interviewer.
Data collection occurred between July 30 and November 4, 1998.
3. Results
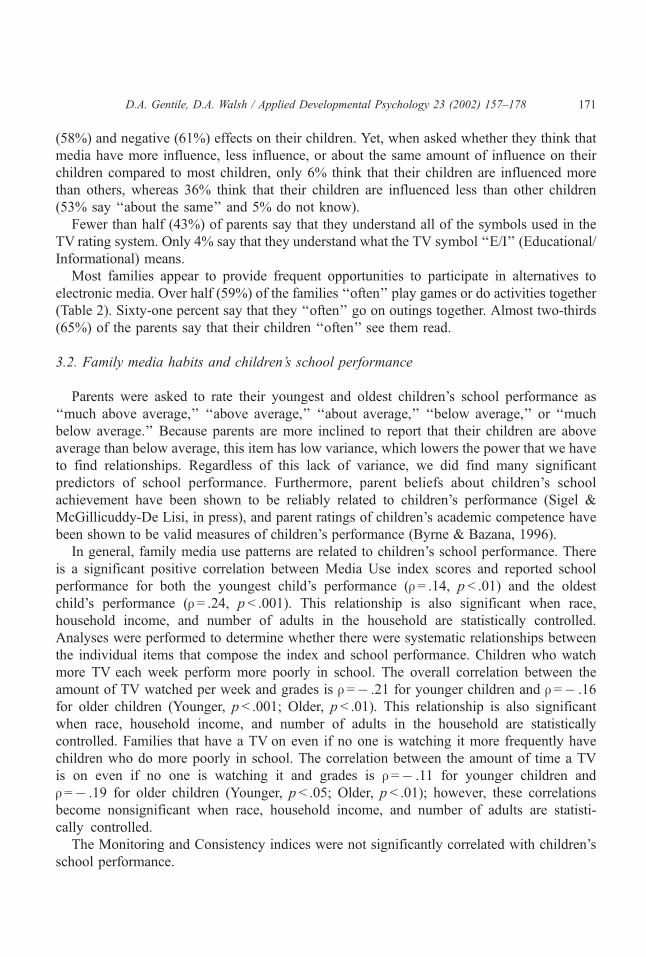
Table 1 displays the intercorrelations among the six index scores. It was hypothesized that
families who scored highly in one category would also score highly in the others. This
hypothesis was supported with the exception of correlations with the Media Effects index. All
correlations among the six indices are positive (and statistically significant) except for those
with the Media Effects index, which are negative (and statistically significant).
Table 1 also displays the correlations between the six family indices and children’s weekly
television watching. It was hypothesized that each of the index scores would be significantly
D.A. Gentile, D.A. Walsh / Applied Developmental Psychology 23 (2002) 157–178 167
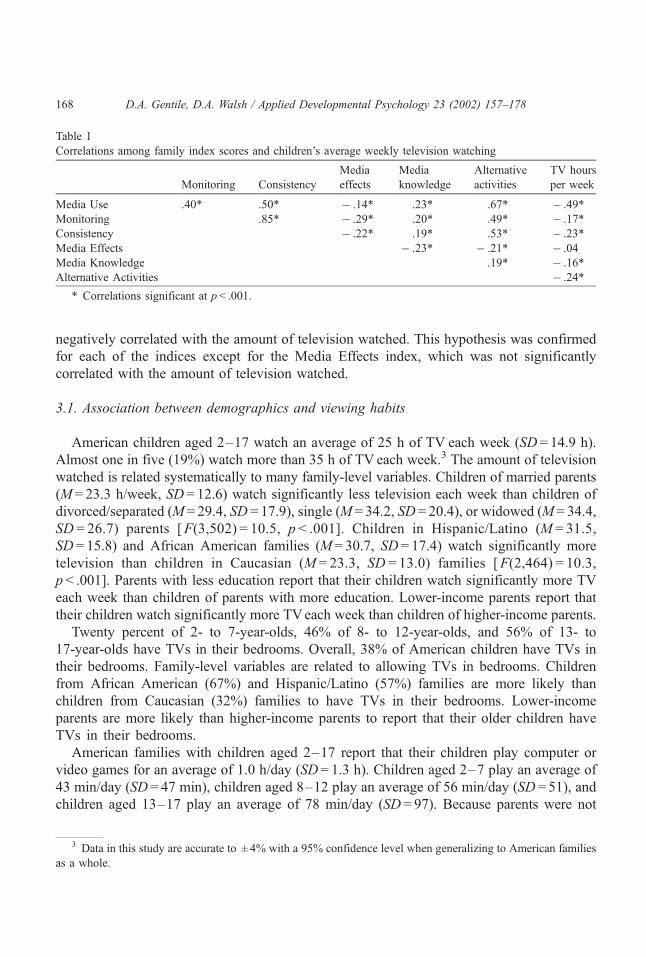
negatively correlated with the amount of television watched. This hypothesis was confirmed
for each of the indices except for the Media Effects index, which was not significantly
correlated with the amount of television watched.
3.1. Association between demographics and viewing habits
American children aged 2–17 watch an average of 25 h of TV each week (SD= 14.9 h).
Almost one in five (19%) watch more than 35 h of TV each week.3 The amount of television
watched is related systematically to many family-level variables. Children of married parents
(M = 23.3 h/week, SD= 12.6) watch significantly less television each week than children of
divorced/separated (M= 29.4, SD = 17.9), single (M = 34.2, SD= 20.4), or widowed (M= 34.4,
SD = 26.7) parents [F(3,502) = 10.5, p < .001]. Children in Hispanic/Latino (M = 31.5,
SD= 15.8) and African American families (M = 30.7, SD= 17.4) watch significantly more
television than children in Caucasian (M = 23.3, SD = 13.0) families [F(2,464) = 10.3,
p< .001]. Parents with less education report that their children watch significantly more TV
each week than children of parents with more education. Lower-income parents report that
their children watch significantly more TVeach week than children of higher-income parents.
Twenty percent of 2- to 7-year-olds, 46% of 8- to 12-year-olds, and 56% of 13- to
17-year-olds have TVs in their bedrooms. Overall, 38% of American children have TVs in
their bedrooms. Family-level variables are related to allowing TVs in bedrooms. Children
from African American (67%) and Hispanic/Latino (57%) families are more likely than
children from Caucasian (32%) families to have TVs in their bedrooms. Lower-income
parents are more likely than higher-income parents to report that their older children have
TVs in their bedrooms.
American families with children aged 2–17 report that their children play computer or
video games for an average of 1.0 h/day (SD= 1.3 h). Children aged 2–7 play an average of
43 min/day (SD= 47 min), children aged 8–12 play an average of 56 min/day (SD= 51), and
children aged 13–17 play an average of 78 min/day (SD = 97). Because parents were not
Table 1
Correlations among family index scores and children’s average weekly television watching
Monitoring Consistency
Media
effects
Media
knowledge
Alternative
activities
TV hours
per week
Media Use .40* .50* � .14* .23* .67* � .49*
Monitoring .85* � .29* .20* .49* � .17*
Consistency � .22* .19* .53* � .23*
Media Effects � .23* � .21* � .04
Media Knowledge .19* � .16*
Alternative Activities � .24*
* Correlations significant at p < .001.
3 Data in this study are accurate to ± 4% with a 95% confidence level when generalizing to American families
as a whole.
D.A. Gentile, D.A. Walsh / Applied Developmental Psychology 23 (2002) 157–178168
asked to report the amount of time that each of their children play computer or video games,
we cannot provide averages separately for boys and girls.
American families with Internet access report that their children access the Internet from
home for an average of 36 min/day (SD = 72 min).
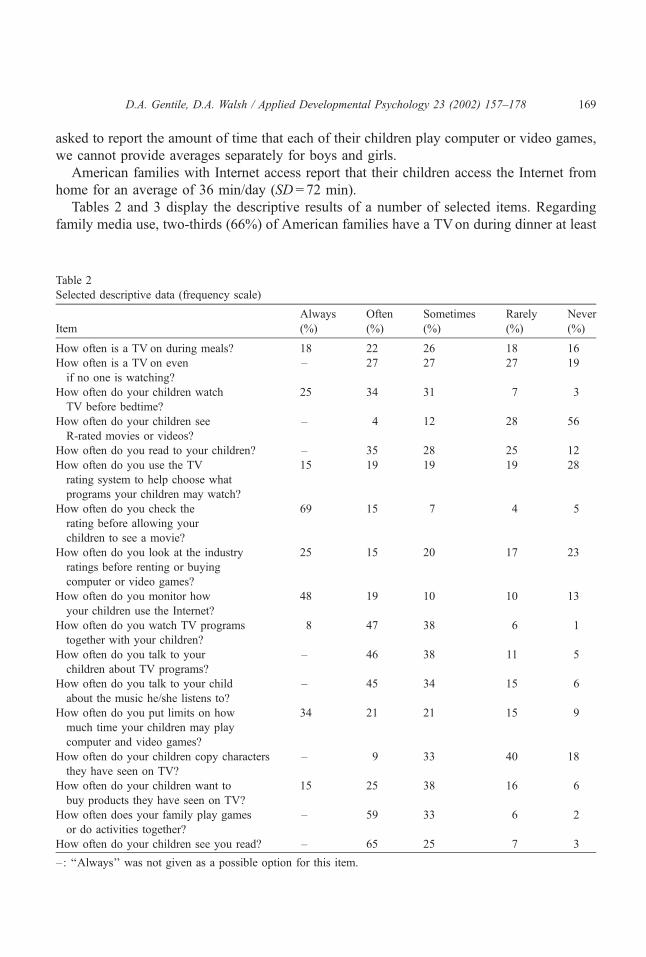
Tables 2 and 3 display the descriptive results of a number of selected items. Regarding
family media use, two-thirds (66%) of American families have a TVon during dinner at least
Table 2
Selected descriptive data (frequency scale)
Item
Always
(%)
Often
(%)
Sometimes
(%)
Rarely
(%)
Never
(%)
How often is a TV on during meals? 18 22 26 18 16
How often is a TV on even
if no one is watching?
– 27 27 27 19
How often do your children watch
TV before bedtime?
25 34 31 7 3
How often do your children see
R-rated movies or videos?
– 4 12 28 56
How often do you read to your children? – 35 28 25 12
How often do you use the TV
rating system to help choose what
programs your children may watch?
15 19 19 19 28
How often do you check the
rating before allowing your
children to see a movie?
69 15 7 4 5
How often do you look at the industry
ratings before renting or buying
computer or video games?
25 15 20 17 23
How often do you monitor how
your children use the Internet?
48 19 10 10 13
How often do you watch TV programs
together with your children?
8 47 38 6 1
How often do you talk to your
children about TV programs?
– 46 38 11 5
How often do you talk to your child
about the music he/she listens to?
– 45 34 15 6
How often do you put limits on how
much time your children may play
computer and video games?
34 21 21 15 9
How often do your children copy characters
they have seen on TV?
– 9 33 40 18
How often do your children want to
buy products they have seen on TV?
15 25 38 16 6
How often does your family play games
or do activities together?
– 59 33 6 2
How often do your children see you read? – 65 25 7 3
– : ‘‘Always’’ was not given as a possible option for this item.
D.A. Gentile, D.A. Walsh / Applied Developmental Psychology 23 (2002) 157–178 169
‘‘sometimes,’’ and only one in five (19%) answered ‘‘never’’ when asked how often the TV is
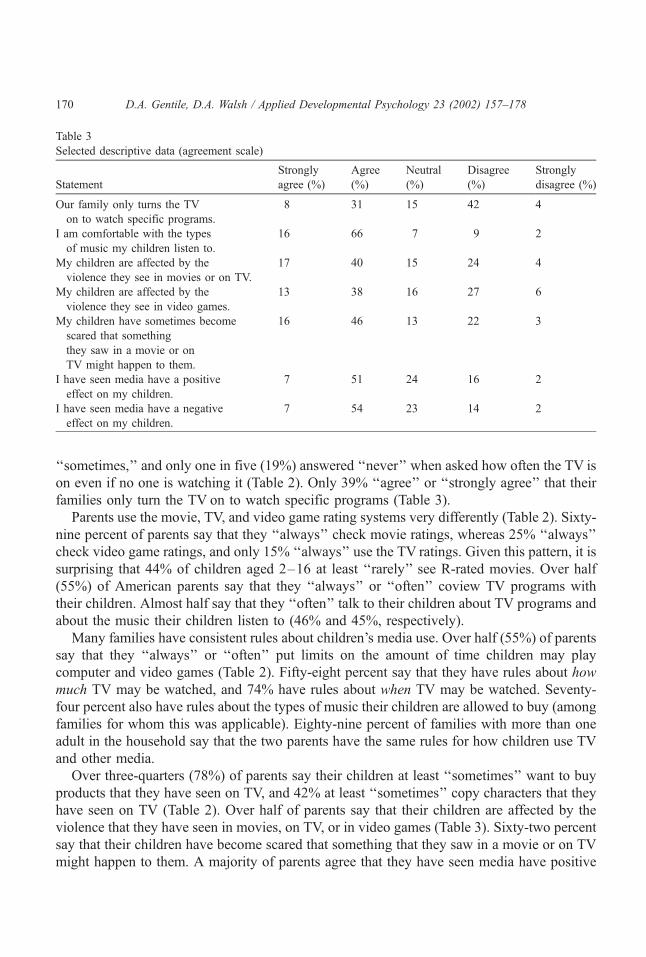
on even if no one is watching it (Table 2). Only 39% ‘‘agree’’ or ‘‘strongly agree’’ that their
families only turn the TV on to watch specific programs (Table 3).
Parents use the movie, TV, and video game rating systems very differently (Table 2). Sixty-
nine percent of parents say that they ‘‘always’’ check movie ratings, whereas 25% ‘‘always’’
check video game ratings, and only 15% ‘‘always’’ use the TV ratings. Given this pattern, it is
surprising that 44% of children aged 2–16 at least ‘‘rarely’’ see R-rated movies. Over half
(55%) of American parents say that they ‘‘always’’ or ‘‘often’’ coview TV programs with
their children. Almost half say that they ‘‘often’’ talk to their children about TV programs and
about the music their children listen to (46% and 45%, respectively).
Many families have consistent rules about children’s media use. Over half (55%) of parents
say that they ‘‘always’’ or ‘‘often’’ put limits on the amount of time children may play
computer and video games (Table 2). Fifty-eight percent say that they have rules about how
much TV may be watched, and 74% have rules about when TV may be watched. Seventy-
four percent also have rules about the types of music their children are allowed to buy (among
families for whom this was applicable). Eighty-nine percent of families with more than one
adult in the household say that the two parents have the same rules for how children use TV
and other media.
Over three-quarters (78%) of parents say their children at least ‘‘sometimes’’ want to buy
products that they have seen on TV, and 42% at least ‘‘sometimes’’ copy characters that they
have seen on TV (Table 2). Over half of parents say that their children are affected by the
violence that they have seen in movies, on TV, or in video games (Table 3). Sixty-two percent
say that their children have become scared that something that they saw in a movie or on TV
might happen to them. A majority of parents agree that they have seen media have positive
Table 3
Selected descriptive data (agreement scale)
Statement
Strongly
agree (%)
Agree
(%)
Neutral
(%)
Disagree
(%)
Strongly
disagree (%)
Our family only turns the TV
on to watch specific programs.
8 31 15 42 4
I am comfortable with the types
of music my children listen to.
16 66 7 9 2
My children are affected by the
violence they see in movies or on TV.
17 40 15 24 4
My children are affected by the
violence they see in video games.
13 38 16 27 6
My children have sometimes become
scared that something
they saw in a movie or on
TV might happen to them.
16 46 13 22 3
I have seen media have a positive
effect on my children.
7 51 24 16 2
I have seen media have a negative
effect on my children.
7 54 23 14 2
D.A. Gentile, D.A. Walsh / Applied Developmental Psychology 23 (2002) 157–178170
(58%) and negative (61%) effects on their children. Yet, when asked whether they think that
media have more influence, less influence, or about the same amount of influence on their
children compared to most children, only 6% think that their children are influenced more
than others, whereas 36% think that their children are influenced less than other children
(53% say ‘‘about the same’’ and 5% do not know).
Fewer than half (43%) of parents say that they understand all of the symbols used in the
TV rating system. Only 4% say that they understand what the TV symbol ‘‘E/I’’ (Educational/
Informational) means.
Most families appear to provide frequent opportunities to participate in alternatives to
electronic media. Over half (59%) of the families ‘‘often’’ play games or do activities together
(Table 2). Sixty-one percent say that they ‘‘often’’ go on outings together. Almost two-thirds
(65%) of the parents say that their children ‘‘often’’ see them read.
3.2. Family media habits and children’s school performance
Parents were asked to rate their youngest and oldest children’s school performance as
‘‘much above average,’’ ‘‘above average,’’ ‘‘about average,’’ ‘‘below average,’’ or ‘‘much
below average.’’ Because parents are more inclined to report that their children are above
average than below average, this item has low variance, which lowers the power that we have
to find relationships. Regardless of this lack of variance, we did find many significant
predictors of school performance. Furthermore, parent beliefs about children’s school
achievement have been shown to be reliably related to children’s performance (Sigel &
McGillicuddy-De Lisi, in press), and parent ratings of children’s academic competence have
been shown to be valid measures of children’s performance (Byrne & Bazana, 1996).
In general, family media use patterns are related to children’s school performance. There
is a significant positive correlation between Media Use index scores and reported school
performance for both the youngest child’s performance (r= .14, p< .01) and the oldest
child’s performance (r = .24, p< .001). This relationship is also significant when race,
household income, and number of adults in the household are statistically controlled.
Analyses were performed to determine whether there were systematic relationships between
the individual items that compose the index and school performance. Children who watch
more TV each week perform more poorly in school. The overall correlation between the
amount of TV watched per week and grades is r=� .21 for younger children and r=� .16
for older children (Younger, p < .001; Older, p < .01). This relationship is also significant
when race, household income, and number of adults in the household are statistically
controlled. Families that have a TV on even if no one is watching it more frequently have
children who do more poorly in school. The correlation between the amount of time a TV
is on even if no one is watching it and grades is r=� .11 for younger children and
r=� .19 for older children (Younger, p< .05; Older, p < .01); however, these correlations
become nonsignificant when race, household income, and number of adults are statisti-
cally controlled.
The Monitoring and Consistency indices were not significantly correlated with children’s
school performance.
D.A. Gentile, D.A. Walsh / Applied Developmental Psychology 23 (2002) 157–178 171
In general, children who are influenced more by the media tend to perform more poorly in
school. There is a significant positive correlation between Media Effects index scores and
reported school performance for the youngest child’s performance (r= .11, p< .05). Thecorrelation with oldest child’s performance was in the similar direction, but did not achieve
significance (r = .06, p = .29). This pattern is replicated when race, household income, and
number of adults in the household are statistically controlled.
Parents’ knowledge of media and media effects tends to be correlated with children’s
school performance. There is a significant positive correlation between Media Knowledge
index scores and reported school performance for the oldest child’s performance (r =.14,p< .05). The correlation with youngest child’s performance was in the similar direction, but
did not achieve significance (r= .09, p = .07). Both of these correlations become non-
significant when race, household income, and number of adults are statistically controlled.
In general, children who participate in more alternatives to electronic media with their
parents’ support perform better in school. There is a significant positive correlation between
Alternative Activity index scores and reported school performance for both the youngest
child’s performance (r= .13, p < .05) and the oldest child’s performance (r = .19, p < .01). Thisrelationship is also significant when race, household income, and number of adults in the
household are statistically controlled.
3.3. Effects of having TVs in children’s bedrooms
Because 20% of 2- to 7-year-olds, 46% of 8- to 12-year-olds, and 56% of teens have
televisions in their bedrooms, we conducted analyses to examine the possible effects of TVs
in bedrooms. On average, children who have TVs in their bedrooms watch 5.5 h more TV
each week (mean without TVs in bedrooms = 21.8 h/week; mean with TVs in bed-
rooms = 27.3 h/week).
Parents with multiple children were asked to report on both their oldest and youngest
children (2 or over). The TV in bedroom analyses were conducted separately for oldest and
youngest children. In general, the effects were the same for both reported children. When the
effects are both significant, only the less significant statistic is reported.
Having a TVin the bedroom is significantly related to each of the six indices. Families whose
children have TVs in their bedrooms have significantly poorer Media Use index scores
[t(333) = 13.9, p < .001], poorer Monitoring index scores [t(333) = 2.2, p< .01], poorer Consis-
tency index scores [t(333) = 3.2, p< .01], poorer Media Knowledge index scores [t(523) = 2.8,
p< .01 for youngest children; t(333) = 1.9, p= .065 for oldest children], and poorer Alterna-
tive Activity index scores [t(333) = 4.0, p< .001]. Families whose children have TVs in their
bedrooms have significantly better Media Effects index scores [t(333) =� 2.5, p< .01].
Children who have TVs in their bedrooms perform more poorly in school by parent
report [�2(4, N = 326) = 10.89, p< .05 for oldest children; the trend for youngest children
was in the same direction, but was not significant, �2(4, N = 412) = 4.82, p= .31].4 Because
4 Chi-squares were used rather than t tests for these analyses because of the ordinal nature of the school
performance data.
D.A. Gentile, D.A. Walsh / Applied Developmental Psychology 23 (2002) 157–178172
minority children are more likely to have television sets in their bedrooms, and because
minority families are more likely to earn under US$25,000 annually, it is possible that the
lower school performance is due to the effects of being poor rather than to having a
television in the bedroom. In order to provide a stricter test of whether having televisions in
bedrooms contributes independently to school performance, we conducted a regression in
which family race/ethnicity, household income, and number of adults in the household were
entered on step one. On Step 2, the presence of a television in the bedroom was entered.
Although the overall amount of variance accounted for is small (R2 = .04, p< .05), having a
television in the bedroom accounted for a significant amount of variance in the school
performance of older children even controlling for income, race, and number of adults in the
household. For younger children, the presence of a television in the bedroom did not add a
significant amount of predictive power over and above the demographic information (total
R2 = .06, p< .001).
4. Discussion
Our first hypothesis stated that family scores on each of the six indices would be positively
intercorrelated (recall that the indices are scored such that high scores are ‘‘good’’). This
hypothesis was confirmed for five of the six indices. In general, families that use electronic
and print media carefully also monitor their children’s media use carefully, are more
consistent in the application of rules, know more about media and media effects, and
participate in more alternatives to electronic media. Contrary to predictions, families that
scored highly on each of these indices tended to score lower on the Media Effects index
(Table 1). It is unclear how to interpret this result. It seems unlikely that children would be
more affected by media by having more positive media habits. It seems more likely that
parents who are more careful with their families’ media habits are probably more aware of the
potential for media to affect their children, and thus notice how their children are affected by
media more than families who do not practice as careful media habits. Because these data are
correlational, no causal interpretation is possible.
Although the Media Effects index has somewhat reasonable reliability (a= .63), it may
be that this index can be interpreted in two ways. On its face, it appears to measure how
much parents witness media affecting their children. However, it may also (or instead) be a
measure of how aware parents are about their children’s behaviors and the precursors to those
behaviors. Both possibilities should be considered when interpreting the results regarding
this index.
Our second hypothesis stated that children’s amount of television viewing would be
negatively correlated with each of the six indices. This hypothesis was confirmed for five of
the six indices. The correlation between the amount of TVand the Media Effects index was in
the expected direction but did not achieve significance. In general, children watch less
television in families that monitor more, are more consistent, have more knowledge of media
and media effects, use electronic and print media more carefully, and participate in more
alternative activities.
D.A. Gentile, D.A. Walsh / Applied Developmental Psychology 23 (2002) 157–178 173
The descriptive results from this study replicate the results from many other studies. For
example, the amount of time that children watch TV and play video games are consistent
with other recent studies (e.g., Roberts et al., 1999). The interactions of these amounts with
family demographic variables are also consistent with other studies, in that minority and
lower SES families tend to use electronic media more heavily. Parents’ lack of knowledge
and use of rating systems are consistent with other studies (e.g., Gentile et al., 2002; Kaiser
Family Foundation, 1999; Krcmar, Pulaski, & Curtis, 2001; Walsh, 2000), although we
found somewhat higher levels of parental rules regarding media use than many other re-
searchers (e.g., National Institute of Mental Health, 1982; Roberts et al., 1999; Woodward &
Gridina, 2000).
We hypothesized that the Media Use and Alternative Activities indices would be positively
correlated with children’s school performance. This hypothesis was confirmed. Families that
use electronic and print media more carefully tend to have children who perform better in
school. The amount of TV watched also predicted school performance, where increased
viewing predicts poorer performance. Children who participate in alternatives to electronic
media with parental support perform better in school. These results replicate prior studies
(e.g., Huston et al., 1992; Mahoney, 2000; Roberts et al., 1999).
We also found that families’ Media Effects and Media Knowledge scores predicted child-
ren’s school performance. In general, children who are affected less by the media perform
better in school, and parents who have greater knowledge about media and media effects have
children who tend to perform better in school. These results are encouraging in light of
current national efforts to create media education programs (e.g., Manzo, 2000). They suggest
that teaching both parents and children principles of media literacy may have beneficial
results for families and children.
One finding from this study may be of particular importance to parents: Children having
TVs in their bedrooms is associated with many potentially negative outcomes. Children who
have TVs in their bedrooms watch TV for an average of 5 1/2 h more each week than children
without TVs in their bedrooms. It has been hypothesized that having multiple televisions may
reduce the amount of coviewing (Comstock, 1990, cited in Cantor & Mares, in press). This
hypothesis is supported by these data. Parents monitor children’s media habits less when their
children have TVs in their bedrooms. Parents are also less consistent with rules for children’s
media use when their children have TVs in their bedrooms. Children with TVs in their bed-
rooms participate in fewer alternatives to electronic media. Most importantly, having TVs in
bedrooms may affect children’s school performance. These findings replicate other studies
(e.g., Lin & Atkin, 1989; World Summit, 1998), but extend them by examining the rela-
tionship between having TVs in bedrooms and a much greater range of family media habits.
This study is limited by its correlational nature, so no causal inferences can be made. How-
ever, given that the percentage of children with TVs in bedrooms is growing, longitudinal
research should be conducted to determine the causal directions.
The present study is limited by its methodology in at least three important ways. First, this
is a correlational study, and no causal interpretations can be made. Second, all of the data
collected are from parent reports. Parents may underreport their children’s media use some-
what. However, parent report is a standard methodology for measuring children’s media
D.A. Gentile, D.A. Walsh / Applied Developmental Psychology 23 (2002) 157–178174
habits (e.g., Roberts et al., 1999; Woodward & Gridina, 2000). Any underreporting would
only serve to limit the variability of the information, which would make it less likely to find
significant results. Third, because we intended to measure media habits at the family level,
our data are best suited to reporting at the level of families of 2- to 17-year-olds. This is a very
large age range, and it is clear that responses to many of the variables measured here would
change depending on the age of children one has at home. For example, how one monitors the
television shows a 3-year-old watches is likely to be very different from how one monitors the
shows a 16-year-old watches. Because families often have multiple children in multiple age
groups, we were interested in how the whole family uses media, including and averaging
across the differences between younger and older children. Thus, in order to get a broad
picture of the whole family system, we have sacrificed attention to some of the specific details
of individual children’s media habits.
The present study has replicated the findings of many studies of children’s and families’
media habits, as well as the possible effects of those habits. It is unique in at least two
respects. To our knowledge, it is the most comprehensive study of family media habits
conducted to date, in that it measures multiple aspects of family, parental, and child media
habits. It thus provides rich information within a family systems perspective. Furthermore,
it provides a national normative benchmark for future studies as well as for possible prac-
tical applications. By comparing individual families’ responses on the MediaQuotient
instrument to the national norms provided here, the MediaQuotient may be an effective
tool for media education.
Acknowledgments
This research was funded in part by Target. The opinions herein are those of the authors.
We wish to thank Jennifer Ruh Linder and Diane Bales for their helpful comments, Anderson,
Niebuhr, and Associates for their assistance in conducting the survey, and two anonymous
reviewers for their suggestions. Some of the findings were previously presented in a pro-
prietary report titled ‘‘MediaQuotient2: national survey of family media habits, knowledge,
and attitudes.’’
References
American Academy of Pediatrics, Committee on Communications (1995). Media violence. Pediatrics, 95,
949–951.
American Academy of Pediatrics, Committee on Public Education (1999). Media education. Pediatrics, 104,
341–343.
American Medical Association (1994). Mass media violence and film ratings: redressing shortcomings in the
current system. Proceedings of the house of delegates, 143rd annual meeting (pp. 78–89). Chicago, IL:
Author.
Anderson, R. C., Hiebert, E. H., Scott, J. A., & Wilkinson, I. A. G. (1985). Becoming a nation of readers: the
report of the commission on reading. Washington, DC: National Institute of Education (ERIC Document
Reproduction Service No. ED253865).
D.A. Gentile, D.A. Walsh / Applied Developmental Psychology 23 (2002) 157–178 175
Andreasen, M. S. (1990). Evolution in the family’s use of television: normative data from industry and academe.
In: J. Bryant (Ed.), Television and the American family (pp. 3–55). Mahwah, NJ: Erlbaum.
Austin, E. W. (1993). Exploring the effects of active parental mediation of television content. Journal of Broad-
casting and Electronic Media, 37, 147–158.
Austin, E. W., Pinkleton, B. E., & Fujioka, Y. (2000). The role of interpretation processes and parental discussion
in the media’s effects on adolescents’ use of alcohol. Pediatrics, 105, 343–349.
Bandura, A. (1965). Influence of models’ reinforcement contingencies on the acquisition of imitative responses.
Journal of Personality and Social Psychology, 1, 589–595.
Barr, R., & Hayne, H. (1999). Developmental changes in imitation from television during infancy. Child Develop-
ment, 70, 1067–1081.
Brand, H. J., Crous, B. H., & Hanekom, J. D. M. (1990). Perceived parental inconsistency as a factor in the
emotional development of behaviour-disordered children. Psychological Reports, 66, 620–622.
Brownlee, S. (1998, June 15). Baby talk. U.S. News & World Report, 48.
Byrne, B. M., & Bazana, P. G. (1996). Investigating the measurement of social and academic competencies for
early/late preadolescents and adolescents: a multitrait–multimethod analysis. Applied Measurement in Edu-
cation, 9, 113–132.
Calvert, S. (1999). Children’s journeys through the information age. New York: McGraw-Hill.
Cantor, J. (1998a). Ratings for program content: the role of research findings. Annals of the American Academy of
Political and Social Science, 557, 54–69.
Cantor, J. (1998b). ‘‘Mommy, I’m scared’’: how TV and movies frighten children and what we can do to protect
them. San Diego, CA: Harcourt Brace.
Cantor, J., & Mares, M. L. (in press). Effects of television on child and family emotional well-being. In J. Bryant
(Ed.), Television and the American family (2nd ed.). Mahwah, NJ: Erlbaum.
Cantor, J., Stutman, S., & Duran, V. (1996). What parents want in a television rating system: results of a national
survey. Available at: http://www.pta.org/programs/tvreport.htm. Accessed November 19, 2001.
Carnegie Task Force on Meeting the Needs of Young Children (1994). Starting points: meeting the needs of our
youngest children. New York: Carnegie Corp. of New York.
Crocker, L., & Algina, J. (1986). Introduction to classical and modern test theory. Forth Worth, TX: Harcourt
Brace Jovanovich College Publishers.
Cunningham, A. E., & Stanovich, K. E. (1998, Spring/Summer). What reading does for the mind. American
Educator, 8–15.
Dart, B., & Shepard, S. (1999, June 27). Parents pan film ratings system: standards for movies, other media have
grown lax, they complain. Des Moines Sunday Register, p. 8A.
Donnerstein, E., Slaby, R. G., & Eron, L. D. (1994). The mass media and youth aggression. In: L. D. Eron,
J. H. Gentry, & P. Schlegel (Eds.), Reason to hope: a psychosocial perspective on violence and youth
(pp. 219–250). Washington, DC: American Psychological Association.
Dorr, A., & Rabin, B. E. (1995). Parents, children, and television. In: M. Bornstein (Ed.), Handbook of
parenting, (vol. 4, pp. 323–351). Mahwah, NJ: Erlbaum.
Frick, P. J., Christian, R. E., & Wooton, J. M. (1999). Age trends in the association between parenting practices
and conduct problems. Behavior Modification, 23, 106–128.
Gable, S., & Lutz, S. (2000). Household, parent, and child contributions to childhood obesity. Family Relations,
49, 293–300.
Gadberry, S. (1980). Effects of restricting first graders’ TV-viewing on leisure time use, IQ change, and cognitive
style. Journal of Applied Developmental Psychology, 1, 45–57.
Gentile, D. A., Lynch, P. J., Linder, J. R., & Walsh, D. A. (2002). The effects of violent video game habits on
adolescent hostility, aggressive behaviors, and school performance. Manuscript submitted for publication.
Goodman, I. F. (1983). Television’s role in family interaction: a family system perspective. Journal of Family
Issues, 4, 405–424.
Hughes, R., Ebata, A. T., & Dollahite, D. C. (1999). Family life in the information age. Family Relations, 48, 5–6.
Huston, A. C., Donnerstein, E., Fairchild, H., Feshbach, N. D., Katz, P. A., Murray, J. P., Rubinstein, E. A.,
D.A. Gentile, D.A. Walsh / Applied Developmental Psychology 23 (2002) 157–178176
Wilcox, B. L., & Zuckerman, D. M. (1992). Big world, small screen: the role of television in American society.
Lincoln, NE: University of Nebraska Press.
Huston, A. C., Wright, J. C., Rice, M. L., Kerkman, D., & St. Peters, M. (1990). Development of television
viewing patterns in early childhood: a longitudinal investigation. Developmental Psychology, 26, 409–420.
Kaiser Family Foundation (1998, May). Parents, children and the television ratings system: two Kaiser Family
Foundation surveys. Available at: http://www.kff.org/content/archive/1398/kids_r.pdf. Accessed November 19,
2001.
Kaiser Family Foundation (1999, May). Parents and the V-chip: a Kaiser Family Foundation survey. Available at:
http://www.kff.org/content/archive/1477/vchip_s.pdf. Accessed November 19, 2001.
Katz, J. E., & Aspden, P. (1997). A nation of strangers? Communications of the ACM, 40 (12), 81–86.
Kraut, R., Patterson, M., Lundmark, V., Kiesler, S., Mukophadhyay, T., & Scherlis, W. (1998). Internet paradox: a
social technology that reduces social involvement and psychological well-being? American Psychologist, 53,
1017–1031.
Krcmar, M., Pulaski, M., & Curtis S. (2001). Tracking the television rating system: predicting parent use of
television ratings. Manuscript submitted for publication.
Lin, C. A., & Atkin, D. J. (1989). Parental mediation and rulemaking for adolescent use of television and VCRs.
Journal of Broadcasting and Electronic Media, 33, 53–67.
Linebarger, D. L. (2000, July). Summative evaluation of Between the Lions: a final report to WGBH Educational
Foundation. Kansas City, KS: University of Kansas, Juniper Gardens Children’s Project. Available at: http://
pbskids.org/lions/about/report/BTL_Report.pdf. Accessed November 19, 2001.
Mahoney, J. L. (2000). School extracurricular activity participation as a moderator in the development of anti-
social patterns. Child Development, 71, 502–516.
Manzo,K.K. (2000,December 6). Schools begin to infusemedia literacy into the threeR’s.EducationWeek,20, 6–7.
Meltzoff, A. N. (1988). Imitation of televised models by infants. Child Development, 56, 62–72.
National Institute of Mental Health (1982). Television and behavior: ten years of scientific progress and impli-
cations for the eighties, vol. 1. Washington, DC: Author.
National Institute on Media and the Family (1996). National survey of parent media attitudes, behaviors, and
opinions. Minneapolis, MN: Author.
Owens, J., Maxim, R., McGuinn, M., Nobile, C., Msall, M., & Alario, A. (1999). Television-viewing habits and
sleep disturbance in school children. Pediatrics, 104, 551–557. Available at: www.pediatrics.org/cgi/content/
full/104/3/e27.
Parks, M. R., & Roberts, L. D. (1998). ‘Making MOOsic’: the development of personal relationships on-line and a
comparison to their off-line counterparts. Journal of Social and Personal Relationships, 15, 517–537.
Roberts, D. F., Foehr, U. G., Rideout, V. J., & Brodie, M. (1999). Kids & media @ the new milennium. Menlo
Park, CA: Kaiser Family Foundation. Available at: http://www.kff.org/content/1999/1535. Accessed in No-
vember 19, 2001.
Robinson, T. N. (1999). Reducing children’s television viewing to prevent obesity. Journal of the American
Medical Association, 282, 1561–1567.
Seidel, K. (1998). How the arts contribute to education. Available at: www.aaae.org/artsbro/arts_bro.htm. Ac-
cessed November 19, 2001.
Sigel, I. E., & McGillicuddy-De Lisi, A. V. (in press). Parent beliefs are cognitions: the dynamic belief systems
model. In M. H. Bornstein (Ed.), Handbook of parenting (vol. 3, 2nd ed.). Mahwah, NJ: Erlbaum.
Stanford Institute for the Quantitative Study of Society. (2000). Study offers early look at how Internet is changing
daily life (Press Release). Available at: http://www.stanford.edu/group/siqss/Press_Release/press_release.html.
Accessed November 19, 2001.
Strasburger, V. C., & Donnerstein, E. (1999). Children, adolescents, and the media: issues and solutions. Pedia-
trics, 103, 129–139.
Truglio, R. T., Murphy, K. C., Oppenheimer, S., Huston, A. C., & Wright, J. C. (1996). Predictors of children’s
entertainment television viewing: why are they tuning in? Journal of Applied Developmental Psychology, 17,
475–493.
D.A. Gentile, D.A. Walsh / Applied Developmental Psychology 23 (2002) 157–178 177
Walsh, D. A. (1998). 1998 Video and computer game report card. Minneapolis, MN: National Institute on Media
and the Family. Available at: http://www.mediafamily.org/research/vgrc/1998-1.shtml. Accessed November 19,
2001.
Walsh, D. A. (2000, March 21). Interactive violence and children: testimony submitted to the Committee on Com-
merce, Science, and Technology, United States Senate. Minneapolis, MN: National Institute on Media and the
Family. Available at: http://www.mediafamily.org/press/senateviolence-full.shtml. Accessed in November 19,
2001.
Walsh, D. A., & Gentile, D. A. (2001). A validity test of movie, television, and video game ratings. Pediatrics,
107, 1302–1308.
Walsh, D. A., Goldman, L. S., & Brown, R. B. (1996). Physician guide to media violence. Chicago, IL: American
Medical Association.
Williams, P. A., Haertel, E. H., Haertel, G. D., & Walberg, H. J. (1982). The impact of leisure-time television on
school learning: a research synthesis. American Educational Research Journal, 19, 19–50.
Willits, W. L., & Willits, F. K. (1986). Adolescent participation in leisure activities: ‘‘the less, the more’’ or ‘‘the
more, the more’’? Leisure Sciences, 8, 189–206.
Woodward, E. H., & Gridina, N. (2000). Media in the home 2000: the fifth annual survey of parents and children
(Survey Series No. 7). Philadelphia, PA: Annenberg Public Policy Center. Available at: http://www.appcpen-
n.org/mediainhome/survey/survey7.pdf. Accessed November 19, 2001.
World Summit (1998). The second world summit on television for children: final report 1998. Philadelphia, PA:
Annenberg Public Policy Center.
D.A. Gentile, D.A. Walsh / Applied Developmental Psychology 23 (2002) 157–178178