Embed Size (px)
Citation preview

A Nonstationary Poisson View of Internet Traffic
T. Karagiannis, M. Molle, M. FaloutsosUniversity of California, Riverside
A. BroidoUniversity of California, San Diego
IEEE INFOCOM 2004 Presented by Ryan

Outline
• Introduction
• Background– Definitions– Previous Models
• Observed Behavior– A time-dependent Poisson characterization
• Conclusion
Introduction
• Nature of Internet Traffic– How does Internet traffic look like?
• Modeling of Internet Traffic– Provisioning– Resource Management– Traffic generation in simulation
Introduction
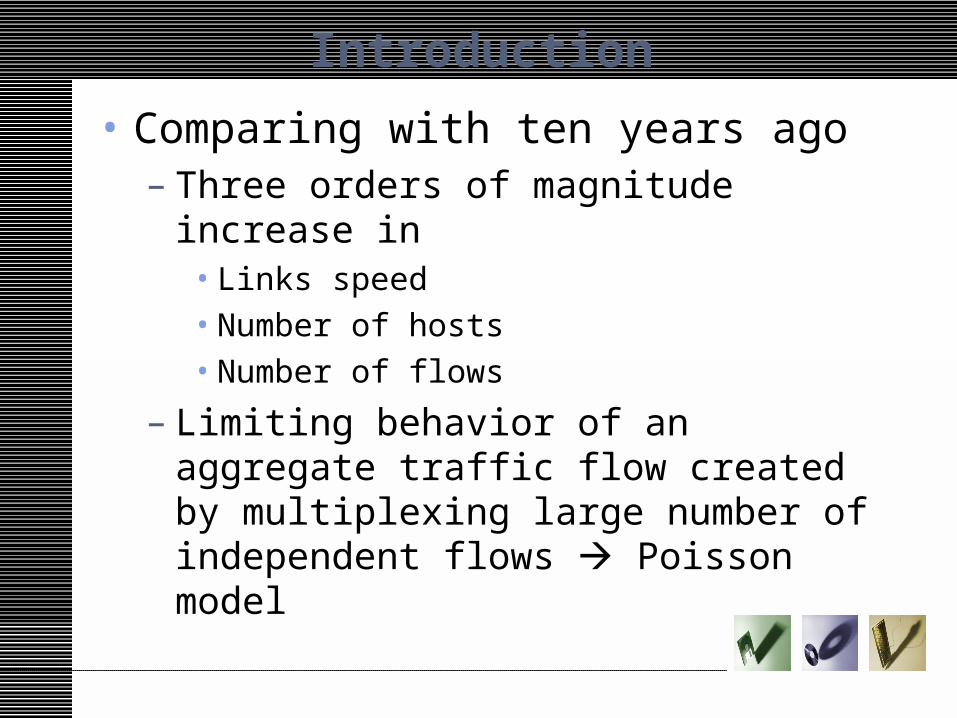
• Comparing with ten years ago– Three orders of magnitude increase in
• Links speed• Number of hosts• Number of flows
– Limiting behavior of an aggregate traffic flow created by multiplexing large number of independent flows Poisson model

Background – Definitions
• Complementary cumulative distribution function (CCDF)
• Autocorrelation Function (ACF)– Correlation between a time series {Xt} and
its k-shifted time series {Xt+k}
)(1)( tFtF C
0,)( tetF tC exponential distribution
2
][][)(
ktt XEXEk

Background – Definitions
• Long Range Dependence (LRD)– The sum of its autocorrelation does not
converge
• Memory is built-in to the process
1
)(k
k

Background – Definitions
• Self-similarity– Certain properties are preserved
irrespective of scaling in space or time
• H – Hurst exponent
)()( tXaatX H
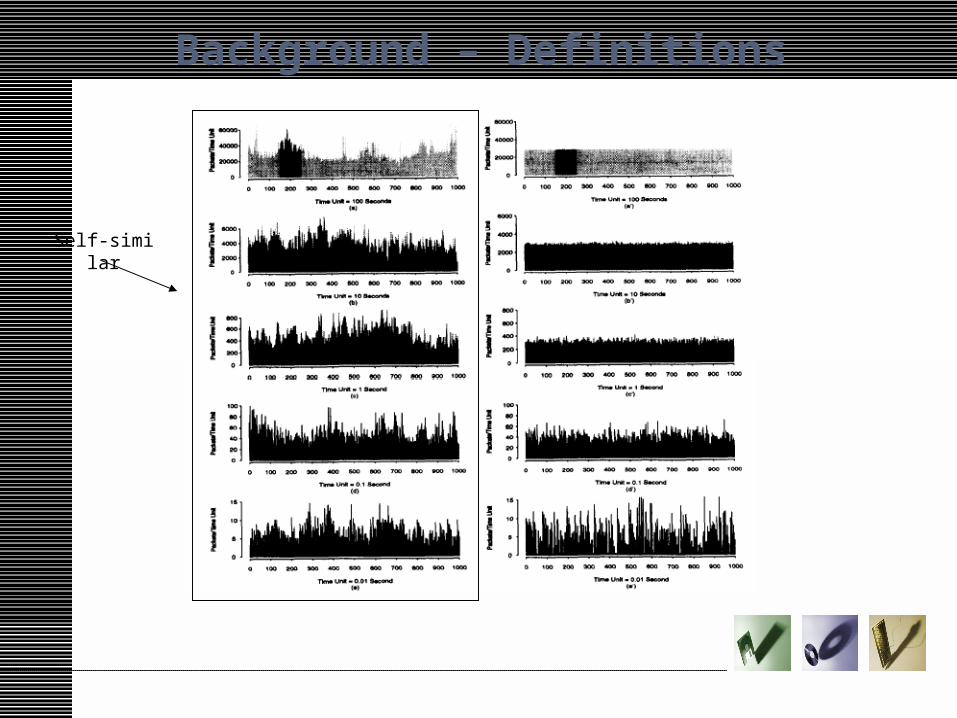
Background – Definitions
Self-similar

Background – Definitions
• Second-order self-similar– ACF is preserved irrespective of time
aggregation
• Model LRD process• H 1, the dependence is stronger
])1(2)1[(2
1)( 222lim HHH
k
kkkk
15.0 H
Background – Previous Model
• Telephone call arrival process (70’s – 80’s)– Poisson Model– Independent inter-arrival time
• Internet Traffic (90’s)– Self-similarity– Long-range dependence (LRD)– Heavy tailed distribution

Findings in the Paper
• At Sub-Second Scales– Poisson and independent packets arrival
• At Multi-Second Scales– Nonstationary
• At Larger Time Scales– Long Range Dependence

Traffic Traces
• Traces from CAIDA (primary focus)– Internet backbone, OC48 link (2.5Gbps)– August 2002, January and April 2003
• Traces from WIDE– Trans-Pacific link (100Mbps)– June 2003

Traffic Traces
• BC-pAug89 and LEL-PKT-4 traces– On the Self-Similar Nature of Ethernet Traff
ic. (1994)• W. E. Leland, M. S. Taqqu, W. Willinger, and D.
V. Wilson.
– Wide Area Traffic: The Failure of Poisson Modeling. (1995)
• V. Paxson and S. Floyd.

Traffic Traces
• Analysis of OC48 traces– The link is overprovisioned
• Below 24% link unilization
– ~90% bytes (TCP)– ~95% packets (TCP)

Poisson at Sub-Second Time Scales
• Distribution of Packet Inter-arrival Times– Red line – corresponding to exponential
distribution– Blue line – OC48 traces– Linear least squares fitting 99.99% confidence

Poisson at Sub-Second Time Scales
WIDE trace LBL-PKT-4 trace

Poisson at Sub-Second Time Scales
• Independence
95% confidence interval of zero
Inter-arrival Time ACF Packet Size ACF

Nonstationary at Multi-Second Time Scales
• Rate changes at second scales
• Changes detection– Canny Edge Detector algorithm
change point
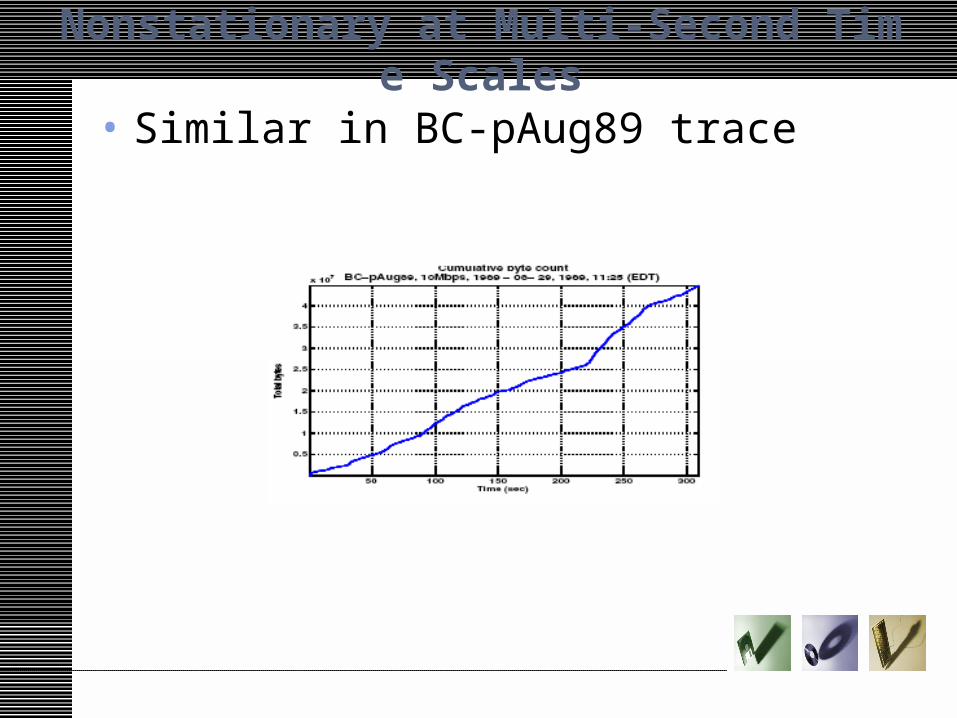
Nonstationary at Multi-Second Time Scales
• Similar in BC-pAug89 trace

Nonstationary at Multi-Second Time Scales
• Possible causes for nonstationarity– Variation of the number of active sources o
ver time– Self-similarity in the traffic generation proce
ss– Change of routing
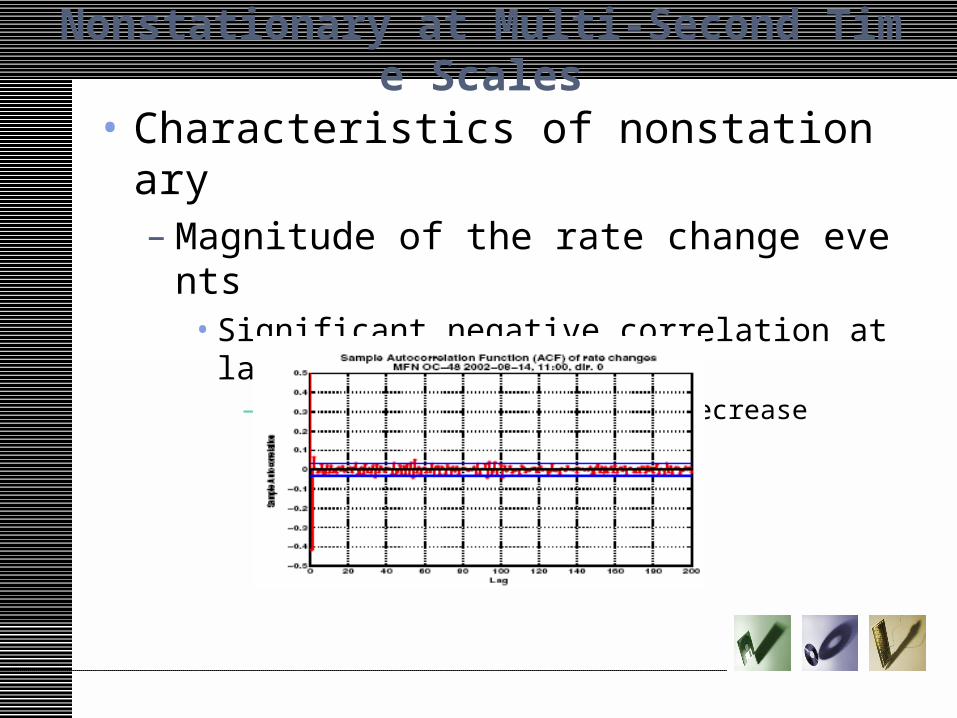
Nonstationary at Multi-Second Time Scales
• Characteristics of nonstationary– Magnitude of the rate change events
• Significant negative correlation at lag one– An increase followed by a decrease

Nonstationary at Multi-Second Time Scales
– Duration of change free intervals• Follow the exponential distribution

LRD at Large Time Scales
• Measure LRD by the Hurst exponent (H) estimators– LRD, H 1– Point of Change (Dichotomy in scaling)
• Below ~ 0.6, Above ~ 0.85 Point of Change
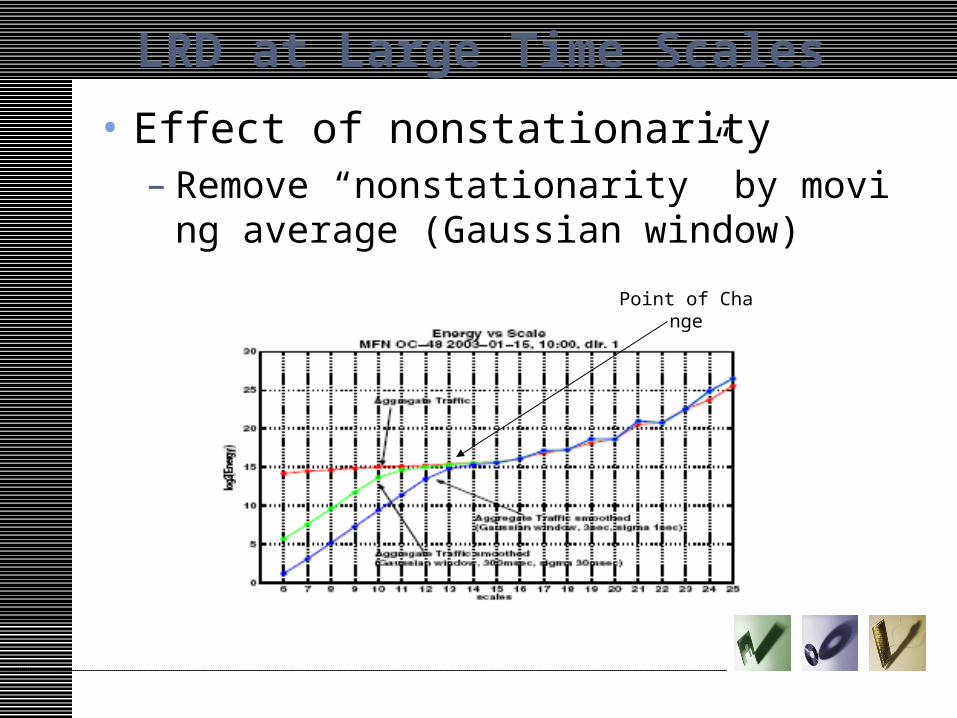
LRD at Large Time Scales
• Effect of nonstationarity– Remove “nonstationarity” by moving avera
ge (Gaussian window)
Point of Change

Conclusion
• Revisit Poisson assumption– Analyzing a combination of traces
• Different observations at different time scales
• Network Traffic– Time-dependent Poisson
• Backbone links only
• Massive scale and multiplexing– MAY lead to a simpler model

Background – Definitions
• Poisson Process– The number of arrivals occurring in two disjoint (non-overla
pping) subintervals are independent random variables. – The probability of the number of arrivals in some subinterval
[t,t + τ] is given by
– The inter-arrival time is exponentially distributed