Embed Size (px)
Citation preview
A Non-Parametric Index Number Approach to Investigate Linkagesbetween Manufacturing Sector Development and Public Infrastructure
Sunita Chitkara1, Central Statistics Office, New Delhi, IndiaCharvi Nagpal, University of Delhi, New Delhi, India
Abstract
In this paper a non-parametric index number approach has been adopted to investigatethe linkages between manufacturing sector development and public infrastructure, usingdata of some Indian states. The states are ranked on the basis of index computed separatelyfor manufacturing sector and infrastructure status which are then shown to be correlatedusing Spearman’s rank correlation indicating that manufacturing sector’s developmentof a state is correlated to its infrastructure status.
1. Introduction
1.1 Ever since the industrial revolution in the 18th century, the manufacturing activityhas been considered to be the main engine of economic growth. These industries are thechief wealth producing sectors of any economy. However, over the last few years, Indianmanufacturing has grown at a very slow pace. The share of manufacturing sector in India’sGDP has increased over the years, but has not matched the increase shown by the servicesector.
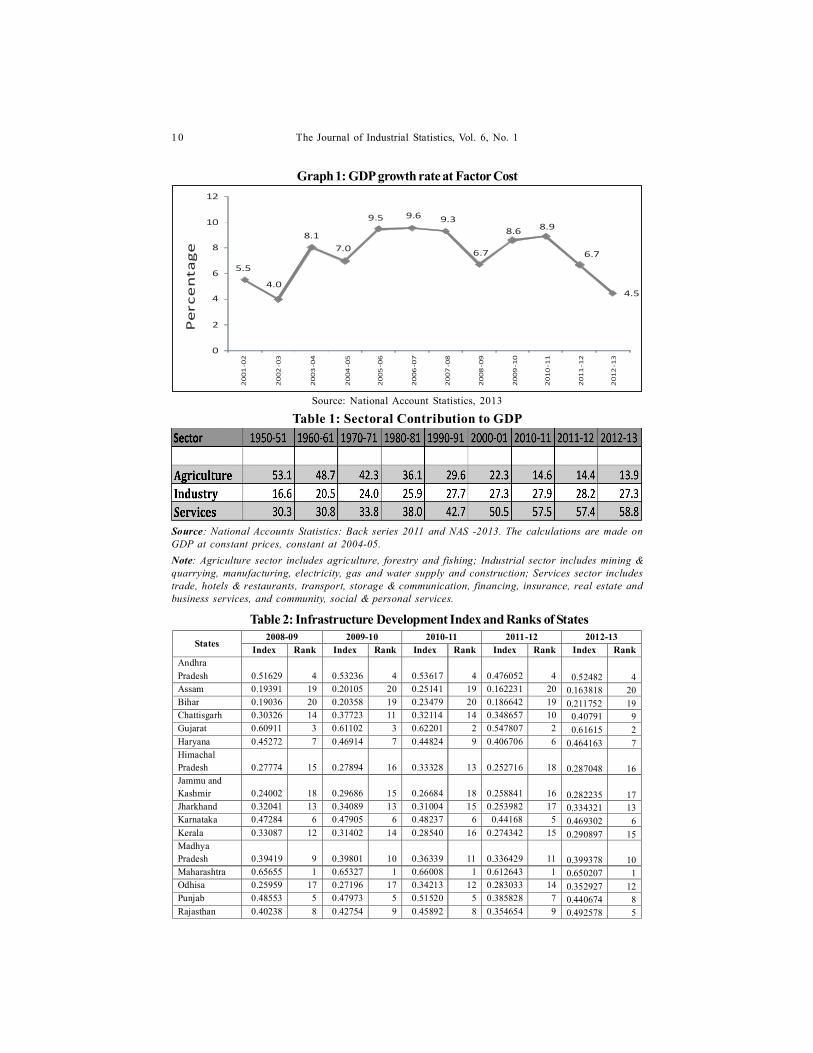
1.2 India has emerged as one of the steadily growing economies in the world. TheGDP Growth was remarkably above 9% during 2005-06 to 2007-08. It fell to 6.7% in 2008-09as a consequence to world economic recession. It recovered immediately to 8.6% in 2009-10 and remained at 8.9 % in 2010-11 also. However, it slowed down to 6.7% in 2011-12 andthen fell to 4.5% in 2012-13, the worst it has been in last nine years (Graph 1).
1.3 Of the three sectors of the economy, the industry sector accounted for 28percent of GDP in 1990-91 and remained same till date. When compared with service sectorcontribution to GDP, which increased from 43 percent in 1990-91 to almost 60 percent in2012-13, a large gap is seen between them (Table 1).
1.4 To improve the performance of manufacturing sector, a number of steps havebeen taken by the government. “Make in India” mission is one long term initiative with thegoal of transforming India into a “manufacturing hub”. It is designed to facilitate investment,foster innovation, enhance skill development, protect intellectual property and build best-in-class manufacturing infrastructure.
1.5 Manufacturing activities are infrastructure-demanding activities, which includebetter freight corridor supported by train and road network, modern port and airport,improvised communication system, source of energy and electricity availability, storage fa-cilities etc. India clearly lacks in providing major support for manufacturing sector in termsof infrastructure.
1.6 Infrastructure and manufacturing have a strong relationship. A number of studieshave been conducted to show this relationship. The pioneer in this field was the work of
1 e-mail: [email protected]
The Journal of Industrial Statistics (2017), 6 (1), 1 - 14 1
Aschauer. Aschauer’s (1989) paper on public capital and GDP growth in the United Statesessentially marks the genesis of the literature. He found significant and positive effectsfrom infrastructure for the G7 countries for the period 1966-1985. Extending his study,Aschauer (1995) estimated the productivity effects from infrastructure for 12 OECD countries.He found that the effects were significant with output elasticity between 0.33 and 0.55.
1.7 Following the work of Aschauer, many studies have been undertaken which eitherused the production function or the cost function specification to study this relationship.Some of the important and the recent studies are by Munnel (1992), Holtz-Eakin (1994),Holtz-Eakin and Schwartz (1995), Shah (1992), Canning (1993), Nadiri and Mamuneas (1994)etc.
1.8 A number of papers have studied the effect of infrastructure on individual sectorsof the economy. The studies on the impact of infrastructure on the manufacturing sectorinclude one by Rietveld, Kameo, Schipper and Vlaanderen (1994). They studied the impactof infrastructure (i.e. roads, telecommunication and electricity) in the development ofmanufacturing industries and found the positive and significant impact of infrastructure onmanufacturing sector. Researcher Seitz and Licht (1995) studied the impact of publicinfrastructure on regional manufacturing production cost in 11 west Germany states andfound that public infrastructure do improve competitiveness by reducing production andtransport cost.
1.9 Castañeda, Cotler and Gutiérrez (2000) conducted research on the impact ofinfrastructure on Mexican manufacturing growth. They used two measures of infrastructure-highway and electricity. Regardless of using estimation method, they found significantimpact of both variables on Mexican manufacturing growth. They found for themanufacturing sector, 10% growth in investment of assets of highways contributes to anincrease in manufacturing output that lies in the range between 0.62% and 0.96%. Anincrease of 10% in the stock of capital in electricity leads to an increase of manufacturingoutput in the range of 1.92% to 2.88% (Soneta,K., 2012).
1.10 Another paper that focused on both energy infrastructure and manufacturing isthat by Hulten, Bennathan and Srinivasan (2003). The authors analyze the Indianmanufacturing sector from 1972 to 1993 and try to isolate the role of spillovers, or networkexternalities on productivity. The authors surmise that the effect of infrastructure investmentand attendant externalities depends on the degree of development of the network, where agreater effect is expected in a relatively undeveloped network (Isaksson, 2009).
1.11 Using principal components analysis, Calderon and Serven (2004) constructed aninfrastructure composite consisting of information on telecommunications, electricitygenerating capacity and roads for 121 countries between 1960 and 2000. In addition, theyconstructed an indicator of infrastructure quality services based on waiting time for telephonemain lines, percentage of transmission and distribution losses in the production of electricityand share of paved roads in total roads. They, then, regressed growth of GDP per capita ona set of controls. They also considered each of the infrastructures individually. Theyconcluded that independent of estimator, the stock of infrastructure enters significantly,with a positively signed coefficient, while the quality composite is only significant in onecase but with a clearly smaller parameter. Electricity-generating capacity alone is alsostatistically significant, but its significance seems to be sensitive to the inclusion of roadsand railways. Power quality is statistically insignificant (Isaksson, 2009).
The Journal of Industrial Statistics, Vol. 6, No. 12
1.12 The role of infrastructure on competitiveness of Greek manufacturing sector wasexamined by Mamatzakis (2008). He conducted research by using 20 two-digit Greekindustries over the period 1959-1995 and examined by using dual cost function. He foundthat public infrastructure is cost saving input for manufacturing industries.
1.13 Many contrary results have also been obtained. Annala, Batina, Feehans (2008)studied the impact of public capital investment on individual sector of the Japanese economyby using time-series data for the period of 1970–1998 and found public capital investmentdoes not affect all sectors of the Japanese economy in the same manner.
1.14 Joshi(1990) provides a comprehensive account of the development of infrastructure in India. He shows that inter-state disparities in level of development did notdecline. He finds a clear and strong association between level of infrastructure and thelevel of development.
1.15 The econometric models used for developing these relationships face the issuesof autocorrelation, heteroscedasticity and cross-sectional correlation, and non stationarityof data. They further face the issue of causality i.e. whether infrastructure causes higheroutput or whether higher output leads to a higher demand for infrastructure.
1.16 In this paper we study the correlation between infrastructure and manufacturingdevelopment for registered manufacturing sector of India. To avoid the issues of econometricmodels as stated above, we adopt a non –parametric index-number approach to measureboth infrastructure and manufacturing development at state level and their associationusing Spearman’s rank correlation, regardless of whether infrastructure leads tomanufacturing development or vice-versa.
1.17 The index number is calculated by first normalizing each of the components ofinfrastructure as well as manufacturing sector using min-max method. In this method, theminimum value of the particular component is subtracted from its actual value and then divided byits range, which is the difference between the maximum and minimum value of the component. Thehandbook on constructing composite indicators: methodology and user guide published by OECDprovides guidance to the construction and use of composite indicators, mainly concerned withthose which compare and rank country performance in areas such as industrial competitiveness,sustainable development, globalization and innovation. The Africa Infrastructure Development Index(AIDI), launched by the African Development Bank Group in May 2013, provides consolidated andcomparative information on the status and progress of infrastructure development in African countries.To compute the AIDI, the observations are first “standardized” or “normalized” to permit averaging,with the average regarded as a composite index. The normalization procedure used is the min–maxformula applied to all observed values of each component during the period 2000–2010. This procedureadjusts the “normalized component” to take values between 0 and 100 over the indicated period. Thecomposite index is calculated as a weighted average of indicators for each component that comprisemore than one indicator. The weights are based on the inverse of the standard deviation of eachnormalized component: yt = (σtot/σx )*xt ; where σtot is given by σtot=1/Σx (1/σx ) and σx is thestandard deviation of the normalized component x. The rationale for this is to reduce the impact of themost volatile components on the composite index. The composite Index is computed using the sub-indexes of the four components and applying the same method as stated above. Indices by subregion are calculated as a weighted average of the normalized components of the countrieswithin the sub region.
A Non-Parametric Index Number Approach to Investigate Linkages between .... 3
1.18 In this paper, thirteen indicators representing three sub sectors of infrastructure –transport, communication and energy are considered to compute a composite indexrepresenting infrastructure status. For manufacturing development index, three indicatorsviz. gross value added, number of factories and number of employees are considered forcomputing the index. The states are then ranked on these indices separately. The two setsof ranks are very close indicating a monotonic relationship between them. The correlationbetween infrastructure status and manufacturing development was further tested usingSpearman’s rank correlation test. The results indicate that the states that are poor inmanufacturing development are lagging in infrastructure. Thus, one way of increasingmanufacturing output can be to improve infrastructure facilities in these states.
1.19 The paper is organized into two sections: section 1 describes the methodologyfollowed for computing various indices and data used. Section 2 describes the resultsobtained by various statistical analysis and conclusions thereupon.
2. Section 1: Methodology and Data Sources
2.1 A non-parametric index based methodology is adopted to investigate the linkagesbetween industrial development and infrastructure. The data has been compiled for 20major Indian states for five years viz. 2008-09, 2009-10, 2010-11, 2011-12 and 2012-13. Thestates are ranked separately on the basis of index obtained for manufacturing developmentand infrastructure. The two sets of ranks are then shown to be correlated using spearman’srank correlation.
2.2 The data for the manufacturing sector has been compiled from various publicationsof Annual Survey of Industries (www.mospi.nic.in).
2.3 The data for the infrastructure sector are taken from Infrastructure Statistics 2014(www.mospi.nic.in). The infrastructure sector comprises mainly of Transport,Communication and Electricity. The indicators considered to compute the index ofinfrastructure are listed below:
i. Transport Infrastructure Indicators
• Road density per thousand population
• Percentage share of surfaced road
• No. of accidents per thousand km road length
• Route km per 1000 population
• Average no. of flights handled per day by domestic airports
ii. Communication Infrastructure Indicators
• No. of fixed phones and wireless phones
• Tele density per 1000 population
• No of post offices (urban)
• No. of letter boxes
The Journal of Industrial Statistics, Vol. 6, No. 14
• Average no. of persons served by post offices
• Average area served by a post office
iii. Electricity Infrastructure Indicators
• Installed Generating Capacity (Mega Watt) Utilities
• Per Capita Consumption (Kilo Watt hour)
2.4 The manufacturing indicators to compute the index are as follows:
a. Gross Value Added (in Rs. lakh)
b. Number of factories
c. Number of Employees
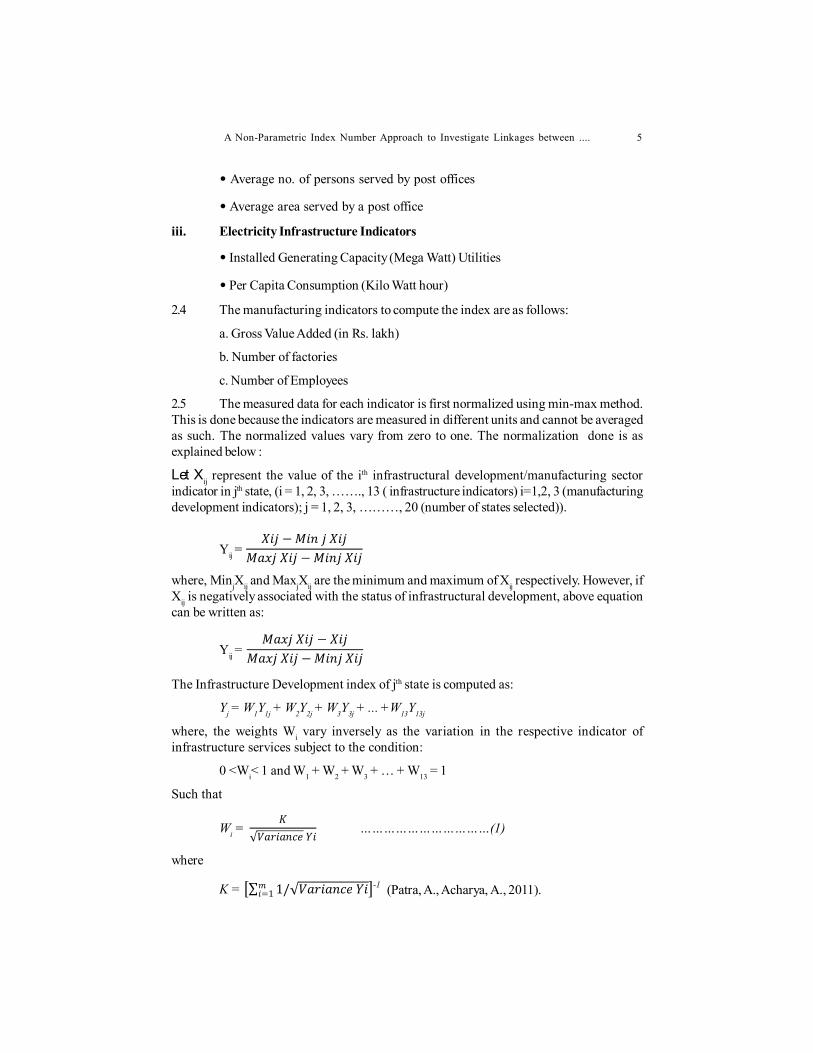
2.5 The measured data for each indicator is first normalized using min-max method.This is done because the indicators are measured in different units and cannot be averagedas such. The normalized values vary from zero to one. The normalization done is asexplained below :
Let Xij represent the value of the ith infrastructural development/manufacturing sectorindicator in jth state, (i = 1, 2, 3, ……., 13 ( infrastructure indicators) i=1,2, 3 (manufacturingdevelopment indicators); j = 1, 2, 3, ………, 20 (number of states selected)).
Yij = −
−
where, MinjXij and MaxjXij are the minimum and maximum of Xij respectively. However, ifXij is negatively associated with the status of infrastructural development, above equationcan be written as:
Yij = −
−
The Infrastructure Development index of jth state is computed as:
Yj = W1Y1j + W2Y2j + W3Y3j + ... +W13Y13j
where, the weights Wi vary inversely as the variation in the respective indicator ofinfrastructure services subject to the condition:
0 <Wi< 1 and W1 + W2 + W3 + … + W13 = 1
Such that
Wi = √
……………………………(1)
where
K = ∑ 1/√ =1-1 (Patra, A., Acharya, A., 2011).
A Non-Parametric Index Number Approach to Investigate Linkages between .... 5
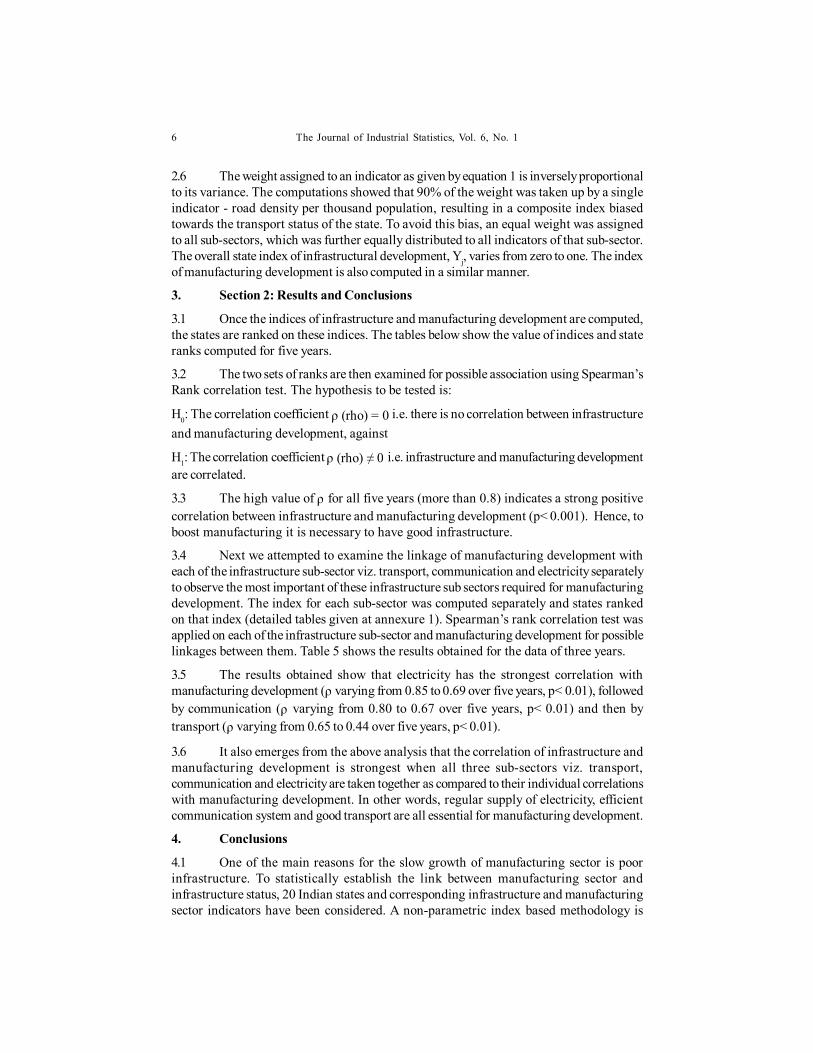
2.6 The weight assigned to an indicator as given by equation 1 is inversely proportionalto its variance. The computations showed that 90% of the weight was taken up by a singleindicator - road density per thousand population, resulting in a composite index biasedtowards the transport status of the state. To avoid this bias, an equal weight was assignedto all sub-sectors, which was further equally distributed to all indicators of that sub-sector.The overall state index of infrastructural development, Yj, varies from zero to one. The indexof manufacturing development is also computed in a similar manner.
3. Section 2: Results and Conclusions
3.1 Once the indices of infrastructure and manufacturing development are computed,the states are ranked on these indices. The tables below show the value of indices and stateranks computed for five years.
3.2 The two sets of ranks are then examined for possible association using Spearman’sRank correlation test. The hypothesis to be tested is:
H0: The correlation coefficient ρ (rho) = 0 i.e. there is no correlation between infrastructureand manufacturing development, against
H1: The correlation coefficient ρ (rho) ≠ 0 i.e. infrastructure and manufacturing developmentare correlated.
3.3 The high value of ρ for all five years (more than 0.8) indicates a strong positivecorrelation between infrastructure and manufacturing development (p< 0.001). Hence, toboost manufacturing it is necessary to have good infrastructure.
3.4 Next we attempted to examine the linkage of manufacturing development witheach of the infrastructure sub-sector viz. transport, communication and electricity separatelyto observe the most important of these infrastructure sub sectors required for manufacturingdevelopment. The index for each sub-sector was computed separately and states rankedon that index (detailed tables given at annexure 1). Spearman’s rank correlation test wasapplied on each of the infrastructure sub-sector and manufacturing development for possiblelinkages between them. Table 5 shows the results obtained for the data of three years.
3.5 The results obtained show that electricity has the strongest correlation withmanufacturing development (ρ varying from 0.85 to 0.69 over five years, p< 0.01), followedby communication (ρ varying from 0.80 to 0.67 over five years, p< 0.01) and then bytransport (ρ varying from 0.65 to 0.44 over five years, p< 0.01).
3.6 It also emerges from the above analysis that the correlation of infrastructure andmanufacturing development is strongest when all three sub-sectors viz. transport,communication and electricity are taken together as compared to their individual correlationswith manufacturing development. In other words, regular supply of electricity, efficientcommunication system and good transport are all essential for manufacturing development.
4. Conclusions
4.1 One of the main reasons for the slow growth of manufacturing sector is poorinfrastructure. To statistically establish the link between manufacturing sector andinfrastructure status, 20 Indian states and corresponding infrastructure and manufacturingsector indicators have been considered. A non-parametric index based methodology is
The Journal of Industrial Statistics, Vol. 6, No. 16
adopted to establish the link between infrastructure and manufacturing sector. As a firststep, state level indices for Infrastructure and Manufacturing Development were computedby normalizing the indicators and averaging them by assigning suitable weights. Thestates were then ranked on the basis of both these indices. To investigate the correlationbetween infrastructure and manufacturing development, Spearman’s Rank Correlation testwas employed. The hypothesis of no association was rejected at 1% level of significance,indicating a strong association between infrastructure and manufacturing development.The correlations were further explored to examine the most important of these threeinfrastructure sub-sectors for manufacturing development. The results indicated electricityto be the most significant, followed by communication and then transport. However, thecorrelation of all three sub-sectors combined was much more significant than their individualcorrelation with manufacturing development. Thus, uninterrupted power supply, efficientcommunication system and good transport facilities are all very important for manufacturingdevelopment.
4.2 Based on indices, the states which fall in top ten category of manufacturingdevelopment are also in top ten category of infrastructure. These states are Tamil Nadu,Maharashtra, Gujarat, Andhra Pradesh, Karnataka, Uttar Pradesh, Punjab, West Bengal,Haryana and Rajasthan. These ten states contribute the most in gross value added bymanufacturing and have better infrastructure in terms of transport, communication andenergy. The states that need attention are Jammu & Kashmir, Bihar, Assam, HimachalPradesh, Chattisgarh, Jharkhand, Odisha, Uttarakhand, Madhya Pradesh and Kerala. Thesestates are lagging in industrial output and also have poor infrastructure. To boost theeconomy and especially to achieve the ‘Make in India’ mission, the infrastructure status ofthese states needs to be improved.
References
Africa Development Bank (2013): The Africa Infrastructure Development Index. Retrievedfrom http://www.afdb.org/fileadmin/uploads/afdb/Documents/Publications/Economic_Brief_-_The_Africa_Infrastructure_Development_Index.pdf
Aschauer, David A. (1989), “Is Public Expenditure Productive?” Journal of MonetoryEconomics, Vol. 23, pp 177-200.
Aschauer, David A. (1995),” Fiscal Policy and Aggregate demand,” The American EconomicReview, Vol. 75, pp 117-127.
Bhat, T. P. (Dec 2014). Structural Changes in the Manufacturing Sector and Growth Prospect.Institute for Studies in Industrial Development, New Delhi.
http://www.isid.org.in/pdf/WP173.pdf
Bhattacharya, A., Bruce, A. & Mukherjee, A. (Nov 2014). Make in India: Turing Vision intoReality, Boston Consulting Group http://www.bcgindia.com/documents/file176705.pdf
Bhunia, A. (Feb 2014). The Diplomat, http://thediplomat.com/2014/02/why-india-must-revive-its-manufacturing-sector/
Bjorvatn, K. (Oct 1999). Urban Infrastructure and Industrialization, Journal of UrbanEconomics.
A Non-Parametric Index Number Approach to Investigate Linkages between .... 7
Castañeda, A., Cotler, P. & Gutiérrez, O. The Impact of Infrastructure on MexicanManufacturing Growth.
Infrastructure Statistics 2014, Third Issue, volume I, Central Statistics Office, Ministry ofStatistics and Programme Implementation.
http://mospi.nic.in/Mospi_New/upload/infra_stat_2014/main_infra_stat_2014.htm
Annual Survey of Industries, 2008-09 volume:1, 2009-10 volume:1, 2010-11 volume:1, CentralStatistics Office, Ministry of Statistics and Programme Implementation. http://mospi.nic.in/Mospi_New/upload/asi/ASI_main.htm?status=1&menu_id=88
Goel, D. (July 2002). Impact of Infrastructure on Productivity: Case of Indian RegisteredManufacturing, Centre for Development Economics.
Gupta, S. P. (Dec 2002). India Vision 2020, Planning Commission, Government of India.
Holtz-Eakin,D (1994). “Public sector capital and the productivity puzzle,” The Review ofEconomics and Statistics, Vol. 76, pp12-21.
Holtz-Eakin, D. and Schwatz, A. (1995), “Spatial productivity spillovers from publicinfrastructure: evidence from state highways,” Infrastructure Tax and Public Finance, Vol.2,No.3, pp 459-468.
Isaksson, A. (Dec 2009). Energy Infrastructure and Industrial Development, United NationsIndustrial Development Organization.
http://www.unido.org//fileadmin/user_media/Publications/Research_and_statistics/Branch_publ icat ions/Research_and_Pol icy/Fi les/Wor king_Paper s/2009/WP%2012%20Energy%20Infrastructure%20and%20Industrial%20Development.pdf
Kessides, C. (1995). The Contributions of Infrastructure to Economic Development, WorldBank Discussion Papers http://elibrary.worldbank.org/doi/pdf/10.1596/0-8213-2628-7.
Luger, M., Butler, J. & Winch, G., (Oct 2013). Infrastructure and manufacturing: their evolvingrelationship, Future of Manufacturing Project: Evidence Paper 20.
Mamatzakis, E. C. (1999). Public Infrastructure, Private Input demand and economicperformance of Greek Industry. www.econ.qmul.ac.uk/papers/doc/wp406.pdf
Mamatzakis, E. (June 2007). An Analysis of the Impact of Public Infrastructure onProductivity Performance of Mexican Industries, CESifo Conference Centre, Munich.
Manufacturing Industry (June 2010). Economy Watch http://www.economywatch.com/world-industries/manufacturing/?page=full.
Organization for Economic Cooperation and Development (2008): Handbook on ConstructingComposite Indicators: Methodology and User Guide. Retrieved from http://www.oecd.org/std/42495745.pdf
Patra, A. K., Acharya, A. (2011). Regional disparity, Infrastructure Development and EconomicGrowth: An Inter-State Analysis. Research and Practice in Social Services, Vol. 6, No. 2, 17-30. Retrieved from
The Journal of Industrial Statistics, Vol. 6, No. 18

h t t ps : / / www. r esea r chga t e . n et / p r ofi l e / Ar a bi n da _Ach a r ya / publ ica t i on /236149543_Regional_Disparity_Infrastructure_Development_and_Economic_Growth_An_Inter-State_Analysis/links/02e7e51668e78ecbed000000.pdf
Soneta, K., A. B. Niaz, Butt, F., Noorudin, M. & Sheikh, S. A. Impact of Infrastructure on theManufacturing Sector of Pakistan, http://umt.edu.pk/icobm2012/pdf/2C-89P.pdf
Stephan, A. (Dec 1997). The Impact of Road Infrastructure on Productivity and Growth:Some Preliminary Results for the German Manufacturing Sector.
Talwar, S. (2014-15). How can the new government make India a global manufacturing hub,Indian Institute of Management-Calcutta.
Understanding the Drivers of Productivity through Regression Analysis, https://www.gov.uk/government/uploads/system/uploads/attachment_data/file/83022/Drivers-of-Productivity1.pdf
A Non-Parametric Index Number Approach to Investigate Linkages between .... 9
Graph 1: GDP growth rate at Factor Cost
Source: National Account Statistics, 2013
Table 1: Sectoral Contribution to GDP
Source: National Accounts Statistics: Back series 2011 and NAS -2013. The calculations are made onGDP at constant prices, constant at 2004-05.Note: Agriculture sector includes agriculture, forestry and fishing; Industrial sector includes mining &quarrying, manufacturing, electricity, gas and water supply and construction; Services sector includestrade, hotels & restaurants, transport, storage & communication, financing, insurance, real estate andbusiness services, and community, social & personal services.
Table 2: Infrastructure Development Index and Ranks of States
States 2008-09 2009-10 2010-11 2011-12 2012-13
Index Rank Index Rank Index Rank Index Rank Index Rank Andhra Pradesh
0.51629
4
0.53236
4
0.53617
4
0.476052
4 0.52482 4
Assam 0.19391 19 0.20105 20 0.25141 19 0.162231 20 0.163818 20 Bihar 0.19036 20 0.20358 19 0.23479 20 0.186642 19 0.211752 19 Chattisgarh 0.30326 14 0.37723 11 0.32114 14 0.348657 10 0.40791 9 Gujarat 0.60911 3 0.61102 3 0.62201 2 0.547807 2 0.61615 2 Haryana 0.45272 7 0.46914 7 0.44824 9 0.406706 6 0.464163 7 Himachal Pradesh
0.27774
15
0.27894
16
0.33328
13
0.252716
18 0.287048 16
Jammu and Kashmir
0.24002
18
0.29686
15
0.26684
18
0.258841
16 0.282235 17
Jharkhand 0.32041 13 0.34089 13 0.31004 15 0.253982 17 0.334321 13 Karnataka 0.47284 6 0.47905 6 0.48237 6 0.44168 5 0.469302 6 Kerala 0.33087 12 0.31402 14 0.28540 16 0.274342 15 0.290897 15 Madhya Pradesh
0.39419
9
0.39801
10
0.36339
11
0.336429
11 0.399378 10
Maharashtra 0.65655 1 0.65327 1 0.66008 1 0.612643 1 0.650207 1 Odhisa 0.25959 17 0.27196 17 0.34213 12 0.283033 14 0.352927 12 Punjab 0.48553 5 0.47973 5 0.51520 5 0.385828 7 0.440674 8 Rajasthan 0.40238 8 0.42754 9 0.45892 8 0.354654 9 0.492578 5
The Journal of Industrial Statistics, Vol. 6, No. 11 0
5.5
4.0
8.17.0
9.5 9.6 9.3
6.7
8.6 8.9
6.7
4.5
0
2
4
6
8
10
12
20
01
-02
20
02
-03
20
03
-04
20
04
-05
20
05
-06
20
06
-07
20
07
-08
20
08
-09
20
09
-10
20
10
-11
20
11
-12
20
12
-13
Pe
rce
nta
ge
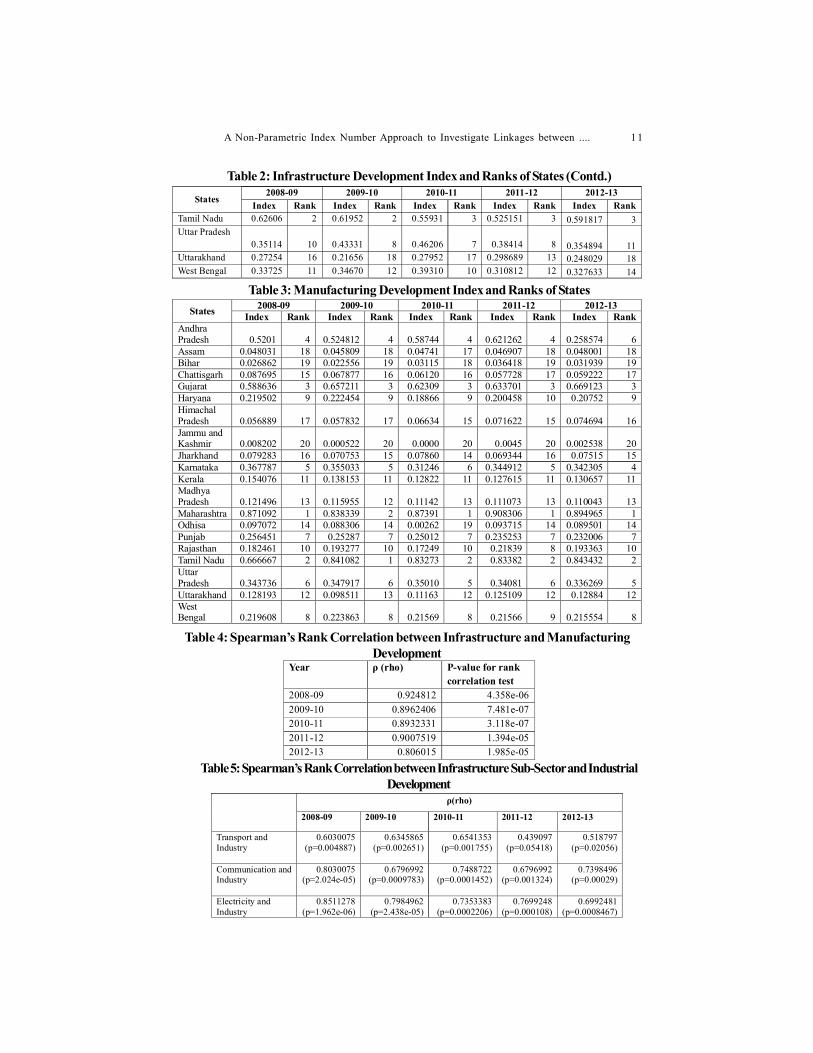
Table 2: Infrastructure Development Index and Ranks of States (Contd.)States
2008-09 2009-10 2010-11 2011-12 2012-13 Index Rank Index Rank Index Rank Index Rank Index Rank
Tamil Nadu 0.62606 2 0.61952 2 0.55931 3 0.525151 3 0.591817 3 Uttar Pradesh
0.35114
10
0.43331
8
0.46206
7
0.38414
8 0.354894 11 Uttarakhand 0.27254 16 0.21656 18 0.27952 17 0.298689 13 0.248029 18 West Bengal 0.33725 11 0.34670 12 0.39310 10 0.310812 12 0.327633 14
Table 3: Manufacturing Development Index and Ranks of StatesStates 2008-09 2009-10 2010-11 2011-12 2012-13
Index Rank Index Rank Index Rank Index Rank Index Rank Andhra Pradesh 0.5201 4 0.524812 4
0.58744
4 0.621262 4 0.258574 6
Assam 0.048031 18 0.045809 18 0.04741 17 0.046907 18 0.048001 18 Bihar 0.026862 19 0.022556 19 0.03115 18 0.036418 19 0.031939 19 Chattisgarh 0.087695 15 0.067877 16 0.06120 16 0.057728 17 0.059222 17 Gujarat 0.588636 3 0.657211 3 0.62309 3 0.633701 3 0.669123 3 Haryana 0.219502 9 0.222454 9 0.18866 9 0.200458 10 0.20752 9 Himachal Pradesh 0.056889 17 0.057832 17
0.06634
15 0.071622 15 0.074694 16
Jammu and Kashmir 0.008202 20 0.000522 20
0.0000
20 0.0045 20 0.002538 20
Jharkhand 0.079283 16 0.070753 15 0.07860 14 0.069344 16 0.07515 15 Karnataka 0.367787 5 0.355033 5 0.31246 6 0.344912 5 0.342305 4 Kerala 0.154076 11 0.138153 11 0.12822 11 0.127615 11 0.130657 11 Madhya Pradesh 0.121496 13 0.115955 12
0.11142
13 0.111073 13 0.110043 13
Maharashtra 0.871092 1 0.838339 2 0.87391 1 0.908306 1 0.894965 1 Odhisa 0.097072 14 0.088306 14 0.00262 19 0.093715 14 0.089501 14 Punjab 0.256451 7 0.25287 7 0.25012 7 0.235253 7 0.232006 7 Rajasthan 0.182461 10 0.193277 10 0.17249 10 0.21839 8 0.193363 10 Tamil Nadu 0.666667 2 0.841082 1 0.83273 2 0.83382 2 0.843432 2 Uttar Pradesh 0.343736 6 0.347917 6
0.35010
5 0.34081 6 0.336269 5
Uttarakhand 0.128193 12 0.098511 13 0.11163 12 0.125109 12 0.12884 12 West Bengal 0.219608 8 0.223863 8
0.21569
8 0.21566 9 0.215554 8
Table 4: Spearman’s Rank Correlation between Infrastructure and ManufacturingDevelopment
Year ρ (rho) P-value for rank correlation test
2008-09 0.924812 4.358e-06 2009-10 0.8962406 7.481e-07 2010-11 0.8932331 3.118e-07 2011-12 0.9007519 1.394e-05 2012-13 0.806015 1.985e-05
Table 5: Spearman’s Rank Correlation between Infrastructure Sub-Sector and IndustrialDevelopment
2008-09 2009-10 2010-11 2011-12 2012-13
Transport and Industry
0.6030075 (p=0.004887)
0.6345865 (p=0.002651)
0.6541353 (p=0.001755)
0.439097 (p=0.05418)
0.518797 (p=0.02056)
Communication and Industry
0.8030075 (p=2.024e-05)
0.6796992 (p=0.0009783)
0.7488722 (p=0.0001452)
0.6796992 (p=0.001324)
0.7398496 (p=0.00029)
Electricity and Industry
0.8511278 (p=1.962e-06)
0.7984962 (p=2.438e-05)
0.7353383 (p=0.0002206)
0.7699248 (p=0.000108)
0.6992481 (p=0.0008467)
A Non-Parametric Index Number Approach to Investigate Linkages between .... 1 1
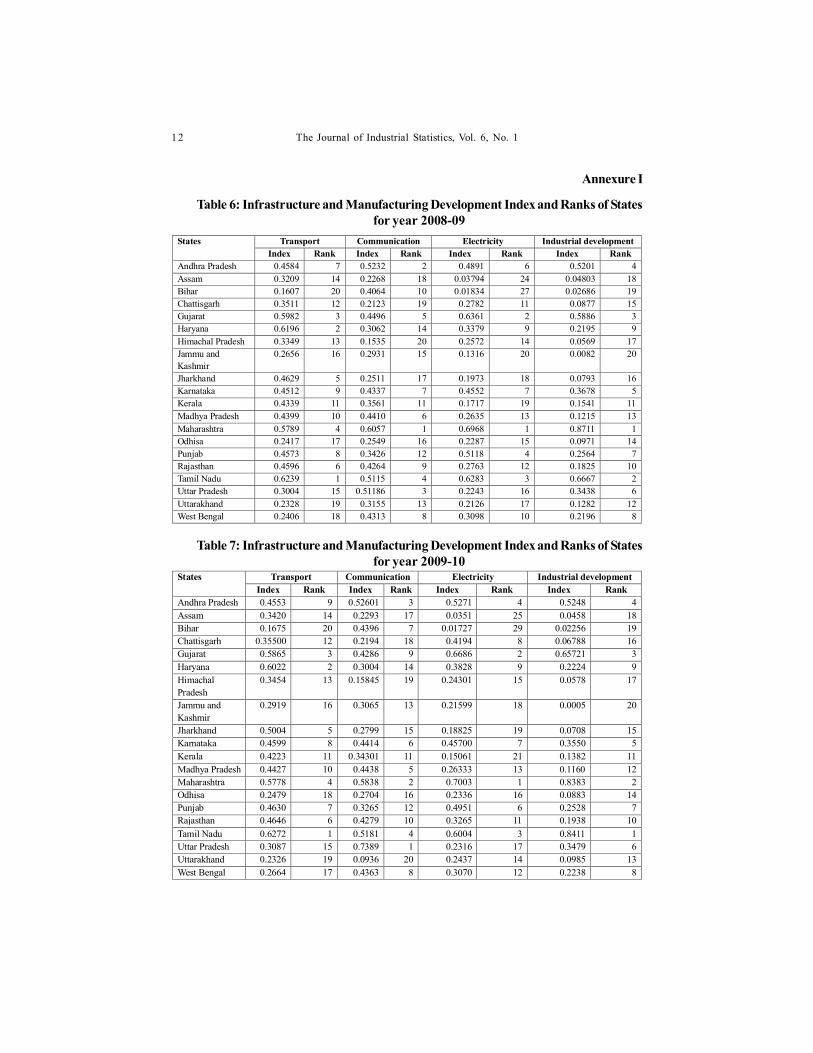
Annexure I
Table 6: Infrastructure and Manufacturing Development Index and Ranks of Statesfor year 2008-09
States Transport Communication Electricity Industrial development Index Rank Index Rank Index Rank Index Rank
Andhra Pradesh 0.4584 7 0.5232 2 0.4891 6 0.5201 4 Assam 0.3209 14 0.2268 18 0.03794 24 0.04803 18 Bihar 0.1607 20 0.4064 10 0.01834 27 0.02686 19 Chattisgarh 0.3511 12 0.2123 19 0.2782 11 0.0877 15 Gujarat 0.5982 3 0.4496 5 0.6361 2 0.5886 3 Haryana 0.6196 2 0.3062 14 0.3379 9 0.2195 9 Himachal Pradesh 0.3349 13 0.1535 20 0.2572 14 0.0569 17 Jammu and Kashmir
0.2656 16 0.2931 15 0.1316 20 0.0082 20
Jharkhand 0.4629 5 0.2511 17 0.1973 18 0.0793 16 Karnataka 0.4512 9 0.4337 7 0.4552 7 0.3678 5 Kerala 0.4339 11 0.3561 11 0.1717 19 0.1541 11 Madhya Pradesh 0.4399 10 0.4410 6 0.2635 13 0.1215 13 Maharashtra 0.5789 4 0.6057 1 0.6968 1 0.8711 1 Odhisa 0.2417 17 0.2549 16 0.2287 15 0.0971 14 Punjab 0.4573 8 0.3426 12 0.5118 4 0.2564 7 Rajasthan 0.4596 6 0.4264 9 0.2763 12 0.1825 10 Tamil Nadu 0.6239 1 0.5115 4 0.6283 3 0.6667 2 Uttar Pradesh 0.3004 15 0.51186 3 0.2243 16 0.3438 6 Uttarakhand 0.2328 19 0.3155 13 0.2126 17 0.1282 12 West Bengal 0.2406 18 0.4313 8 0.3098 10 0.2196 8
Table 7: Infrastructure and Manufacturing Development Index and Ranks of Statesfor year 2009-10
States Transport Communication Electricity Industrial development Index Rank Index Rank Index Rank Index Rank
Andhra Pradesh 0.4553 9 0.52601 3 0.5271 4 0.5248 4 Assam 0.3420 14 0.2293 17 0.0351 25 0.0458 18 Bihar 0.1675 20 0.4396 7 0.01727 29 0.02256 19 Chattisgarh 0.35500 12 0.2194 18 0.4194 8 0.06788 16 Gujarat 0.5865 3 0.4286 9 0.6686 2 0.65721 3 Haryana 0.6022 2 0.3004 14 0.3828 9 0.2224 9 Himachal Pradesh
0.3454 13 0.15845 19 0.24301 15 0.0578 17
Jammu and Kashmir
0.2919 16 0.3065 13 0.21599 18 0.0005 20
Jharkhand 0.5004 5 0.2799 15 0.18825 19 0.0708 15 Karnataka 0.4599 8 0.4414 6 0.45700 7 0.3550 5 Kerala 0.4223 11 0.34301 11 0.15061 21 0.1382 11 Madhya Pradesh 0.4427 10 0.4438 5 0.26333 13 0.1160 12 Maharashtra 0.5778 4 0.5838 2 0.7003 1 0.8383 2 Odhisa 0.2479 18 0.2704 16 0.2336 16 0.0883 14 Punjab 0.4630 7 0.3265 12 0.4951 6 0.2528 7 Rajasthan 0.4646 6 0.4279 10 0.3265 11 0.1938 10 Tamil Nadu 0.6272 1 0.5181 4 0.6004 3 0.8411 1 Uttar Pradesh 0.3087 15 0.7389 1 0.2316 17 0.3479 6 Uttarakhand 0.2326 19 0.0936 20 0.2437 14 0.0985 13 West Bengal 0.2664 17 0.4363 8 0.3070 12 0.2238 8
The Journal of Industrial Statistics, Vol. 6, No. 11 2
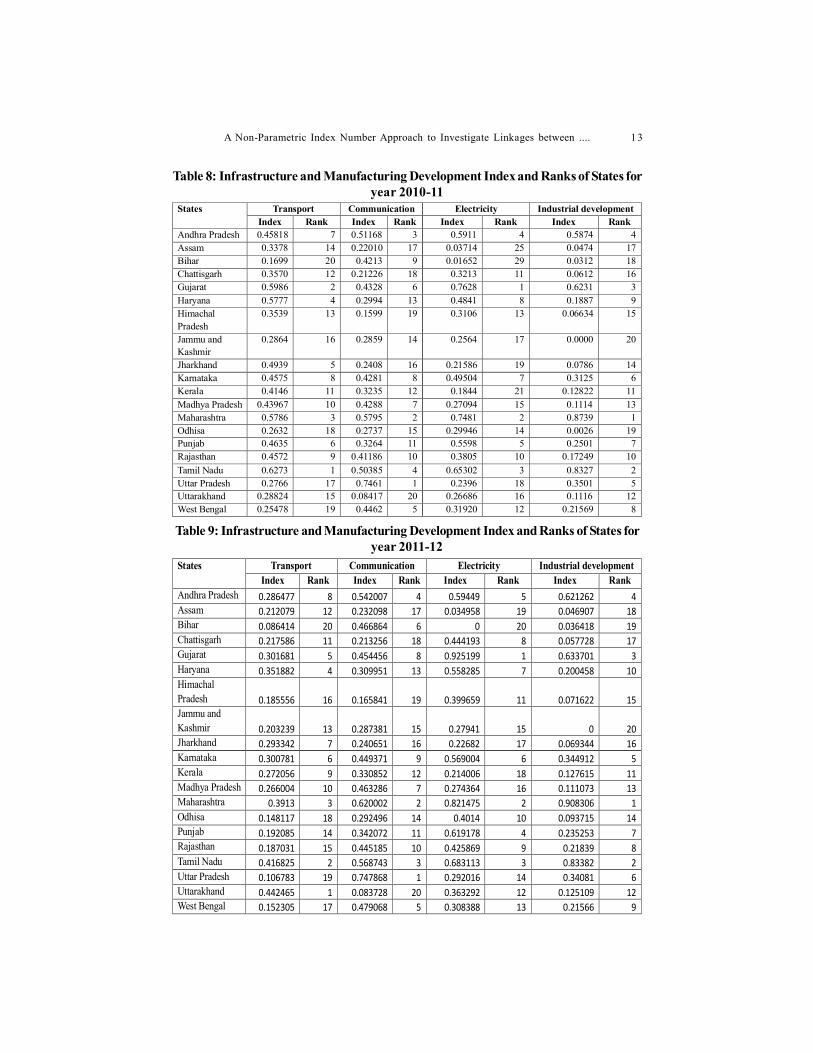
Table 8: Infrastructure and Manufacturing Development Index and Ranks of States foryear 2010-11
States Transport Communication Electricity Industrial development Index Rank Index Rank Index Rank Index Rank
Andhra Pradesh 0.45818 7 0.51168 3 0.5911 4 0.5874 4 Assam 0.3378 14 0.22010 17 0.03714 25 0.0474 17 Bihar 0.1699 20 0.4213 9 0.01652 29 0.0312 18 Chattisgarh 0.3570 12 0.21226 18 0.3213 11 0.0612 16 Gujarat 0.5986 2 0.4328 6 0.7628 1 0.6231 3 Haryana 0.5777 4 0.2994 13 0.4841 8 0.1887 9 Himachal Pradesh
0.3539 13 0.1599 19 0.3106 13 0.06634 15
Jammu and Kashmir
0.2864 16 0.2859 14 0.2564 17 0.0000 20
Jharkhand 0.4939 5 0.2408 16 0.21586 19 0.0786 14 Karnataka 0.4575 8 0.4281 8 0.49504 7 0.3125 6 Kerala 0.4146 11 0.3235 12 0.1844 21 0.12822 11 Madhya Pradesh 0.43967 10 0.4288 7 0.27094 15 0.1114 13 Maharashtra 0.5786 3 0.5795 2 0.7481 2 0.8739 1 Odhisa 0.2632 18 0.2737 15 0.29946 14 0.0026 19 Punjab 0.4635 6 0.3264 11 0.5598 5 0.2501 7 Rajasthan 0.4572 9 0.41186 10 0.3805 10 0.17249 10 Tamil Nadu 0.6273 1 0.50385 4 0.65302 3 0.8327 2 Uttar Pradesh 0.2766 17 0.7461 1 0.2396 18 0.3501 5 Uttarakhand 0.28824 15 0.08417 20 0.26686 16 0.1116 12 West Bengal 0.25478 19 0.4462 5 0.31920 12 0.21569 8
Table 9: Infrastructure and Manufacturing Development Index and Ranks of States foryear 2011-12
States Transport Communication Electricity Industrial development Index Rank Index Rank Index Rank Index Rank
Andhra Pradesh 0.286477 8 0.542007 4 0.59449 5 0.621262 4 Assam 0.212079 12 0.232098 17 0.034958 19 0.046907 18 Bihar 0.086414 20 0.466864 6 0 20 0.036418 19 Chattisgarh 0.217586 11 0.213256 18 0.444193 8 0.057728 17 Gujarat 0.301681 5 0.454456 8 0.925199 1 0.633701 3 Haryana 0.351882 4 0.309951 13 0.558285 7 0.200458 10 Himachal Pradesh 0.185556 16 0.165841 19 0.399659 11 0.071622 15 Jammu and Kashmir 0.203239 13 0.287381 15 0.27941 15 0 20 Jharkhand 0.293342 7 0.240651 16 0.22682 17 0.069344 16 Karnataka 0.300781 6 0.449371 9 0.569004 6 0.344912 5 Kerala 0.272056 9 0.330852 12 0.214006 18 0.127615 11 Madhya Pradesh 0.266004 10 0.463286 7 0.274364 16 0.111073 13 Maharashtra 0.3913 3 0.620002 2 0.821475 2 0.908306 1 Odhisa 0.148117 18 0.292496 14 0.4014 10 0.093715 14 Punjab 0.192085 14 0.342072 11 0.619178 4 0.235253 7 Rajasthan 0.187031 15 0.445185 10 0.425869 9 0.21839 8 Tamil Nadu 0.416825 2 0.568743 3 0.683113 3 0.83382 2 Uttar Pradesh 0.106783 19 0.747868 1 0.292016 14 0.34081 6 Uttarakhand 0.442465 1 0.083728 20 0.363292 12 0.125109 12 West Bengal 0.152305 17 0.479068 5 0.308388 13 0.21566 9
A Non-Parametric Index Number Approach to Investigate Linkages between .... 1 3
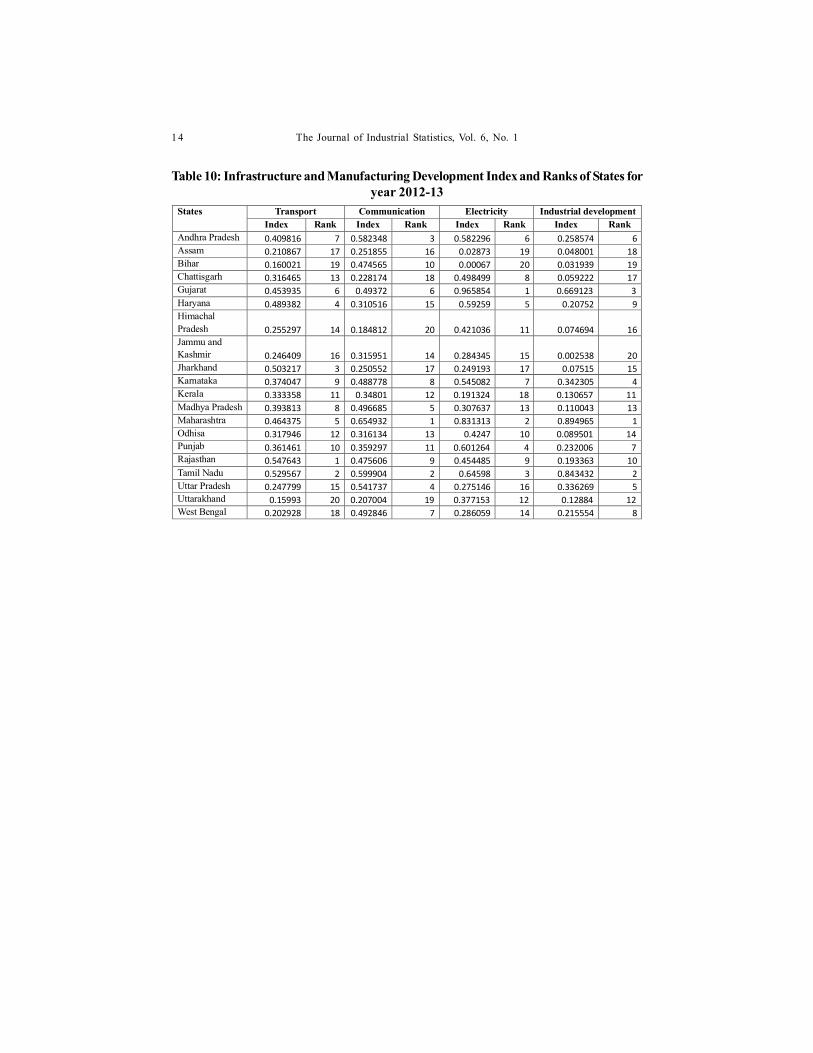
Table 10: Infrastructure and Manufacturing Development Index and Ranks of States foryear 2012-13
States Transport Communication Electricity Industrial development Index Rank Index Rank Index Rank Index Rank
Andhra Pradesh 0.409816 7 0.582348 3 0.582296 6 0.258574 6 Assam 0.210867 17 0.251855 16 0.02873 19 0.048001 18 Bihar 0.160021 19 0.474565 10 0.00067 20 0.031939 19 Chattisgarh 0.316465 13 0.228174 18 0.498499 8 0.059222 17 Gujarat 0.453935 6 0.49372 6 0.965854 1 0.669123 3 Haryana 0.489382 4 0.310516 15 0.59259 5 0.20752 9 Himachal Pradesh 0.255297 14 0.184812 20 0.421036 11 0.074694 16 Jammu and Kashmir 0.246409 16 0.315951 14 0.284345 15 0.002538 20 Jharkhand 0.503217 3 0.250552 17 0.249193 17 0.07515 15 Karnataka 0.374047 9 0.488778 8 0.545082 7 0.342305 4 Kerala 0.333358 11 0.34801 12 0.191324 18 0.130657 11 Madhya Pradesh 0.393813 8 0.496685 5 0.307637 13 0.110043 13 Maharashtra 0.464375 5 0.654932 1 0.831313 2 0.894965 1 Odhisa 0.317946 12 0.316134 13 0.4247 10 0.089501 14 Punjab 0.361461 10 0.359297 11 0.601264 4 0.232006 7 Rajasthan 0.547643 1 0.475606 9 0.454485 9 0.193363 10 Tamil Nadu 0.529567 2 0.599904 2 0.64598 3 0.843432 2 Uttar Pradesh 0.247799 15 0.541737 4 0.275146 16 0.336269 5 Uttarakhand 0.15993 20 0.207004 19 0.377153 12 0.12884 12 West Bengal 0.202928 18 0.492846 7 0.286059 14 0.215554 8
The Journal of Industrial Statistics, Vol. 6, No. 11 4