Embed Size (px)
Citation preview

© Mike Phillp 2015 1
A Newtonian Approach to Paddle Design
Mike Phillp December 2015
Overview
The method described here has grown out of the view that there are unlikely to be any improvements in paddle design left to exploit that can be reliably measured, simply by paddlers ‘time-trialing’ the new designs. Hence there needs to be complete confidence in the science behind any proposed ‘improvements’ that are made, and those areas that are not fully understood need to be left unchanged. A second ‘guiding principal’ of the approach taken here is that a paddler should not be required to change their paddling style (or cadence) to use any ‘new’ design of blade. The approach is based on using Newton’s laws of motion, kinetic energy, and change of momentum equations, to analysis the resultant forces acting directly on the paddle blade. The author believes this allows a more direct approach to calculating paddle blade performance, than one based on investigating the hydrodynamics, complex vortices and flow patterns generated during the paddle stroke. The effects of blade size, ‘crank’ angle, and the paddler’s ‘force curve’ on paddle performance are discussed, along with why no change to the generic ‘wing’ cross-section is proposed (or desirable). Having discussed these criteria a mathematical tool (Paddle Design Tool) is derived for calculating these combined effects on paddle performance. As discussed later, the model compares the performance of one paddle against another, rather than attempting to derive results form ‘first principles’. This allows some complex features of each blade which are not fully understood to ‘cancel each other out’ during calculations.
Effects of Blade Size on Performance Over the years many coaches have exhorted their paddlers to drive the boat forward by pulling themselves past a ‘planted’ paddle blade, rather than ‘throwing water backwards’. Examining the situation using classic Newtonian physics shows when any object is propelled forwards, an ‘equal and opposite reaction’ requires another mass is propelled ‘backwards’. In the case of paddling, the mass being propelled backwards is part of the water being paddled through. The multi-flash image on the next page demonstrates this action, showing the bottom part of the blade moving ‘backwards’ 25–30 cm during the paddle stroke, and by its action propelling water ‘backwards’. (Any canoeist who has ‘wash hung’ behind a motor boat will be aware the propeller is blasting a lot of water backwards, and not simply ‘screwing’ itself forward through stationary water). Interestingly the same multi-flash image has been used by some authors to demonstrate that the wing paddle moves forward in the water during the stroke. (While making no comment on the fact that lower part of the blade can clearly be seen to be moving ‘backwards’ during the power phase of the stroke). I would suggest this confusion is due to the top of the blade (as the stroke is finishing and the recovery beginning), moving forward as the blade is removed from the water.
© Mike Phillp 2015 2
(Image courtesy of Keith Robinson)
Accepting the boat is propelled forward by ‘throwing’ a mass of water backwards, allows aspects relating to acceleration, momentum, and kinetic energy associated with this mass of water to be examined. The propulsive force of the paddle stroke is derived by changing the momentum of some of the water being paddled through. Newton’s 2nd Law Force = Mass X Acceleration (Units - Newtons = kg X metres per second2)
Varying the mass and the acceleration need make no difference to the force derived, as long as the ‘product’ remains the same. Hence to generate a force of say 90 Newtons, one could - Accelerate 5kg at 18 m / s2
or 18kg at 5 m / s2 both results giving 90 Newtons (force) Looking at the kinetic energy (=½mv2) ‘gained’ by the mass (of water) being accelerated to generate this force for 1 second, (interestingly) things aren’t so equal. For the first scenario, the kinetic energy = (½ X 5) X 182 = 810 Joules For the second scenario, the kinetic energy = (½ X 18) X 52 = 225 Joules The science is clear (but not intuitive), it is more energy efficient to generate the force on the paddle by ‘throwing’ a larger mass of water backwards slowly, rather than a small mass quickly.
(See Appendix A).

© Mike Phillp 2015 3
Effects of Blade (Crank) Angle on Performance
The second aspect of the geometry of the paddle to be analysed is the variation in horizontal and vertical force generated throughout the stroke.
When viewed from the side, the paddle shaft moves through angles from anything up to 40 degrees before vertical, back to 70 degrees or more after vertical (very paddler dependant). Ideally the paddle blade (rather than shaft) angle is equal at the beginning and end of the stroke (either side of the vertical position) to maximise the horizontal force component, and minimise the vertical components. Typically currently this is not the case.
Cranking the blade in relation to the shaft can used be used to achieve the ideal, and this is done to a certain amount in current ‘wing’ paddle designs. But as shown later, typically current wing paddles aren’t cranked sufficiently when a full force / angle analysis is carried out.
© Mike Phillp 2015 4
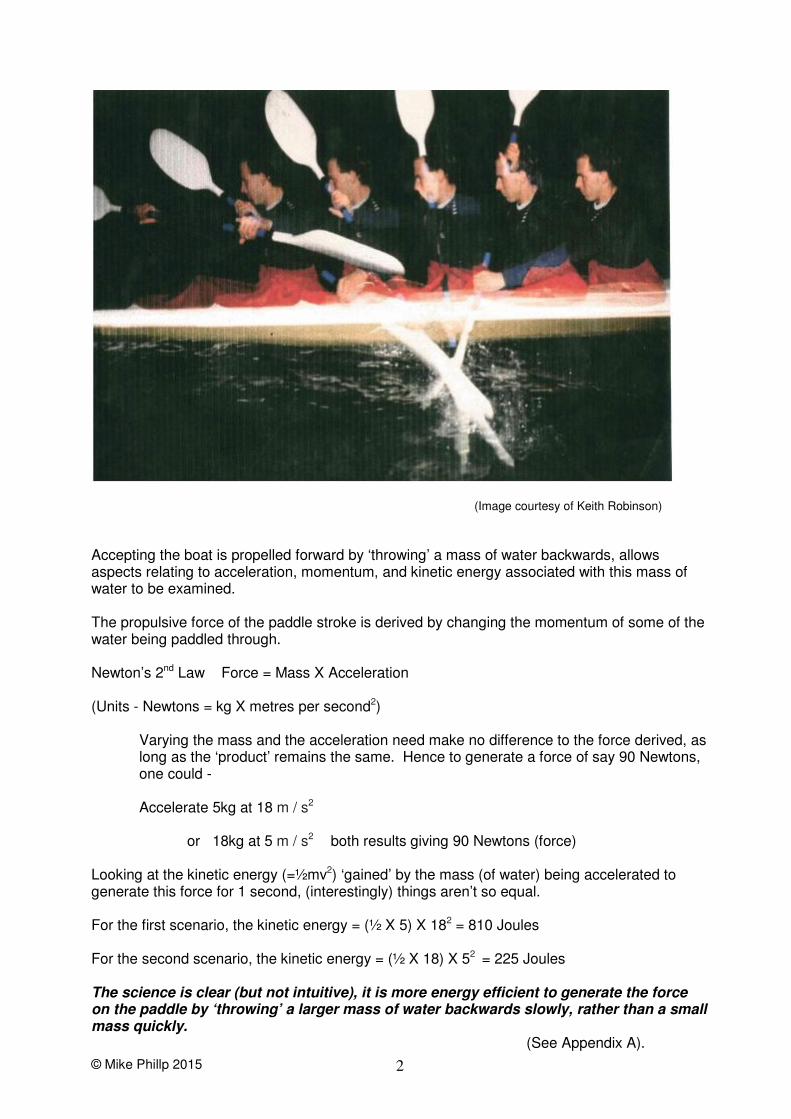
Although the ‘trajectory’ of the paddle shaft/blade is often illustrated as shown on the previous page, it should be borne in mind that because the paddler is moving past the blade, the actual trajectory is closer to that shown below. (The pivot point is typically close to or matches where the blade is considered stationary, when viewing the water surface).
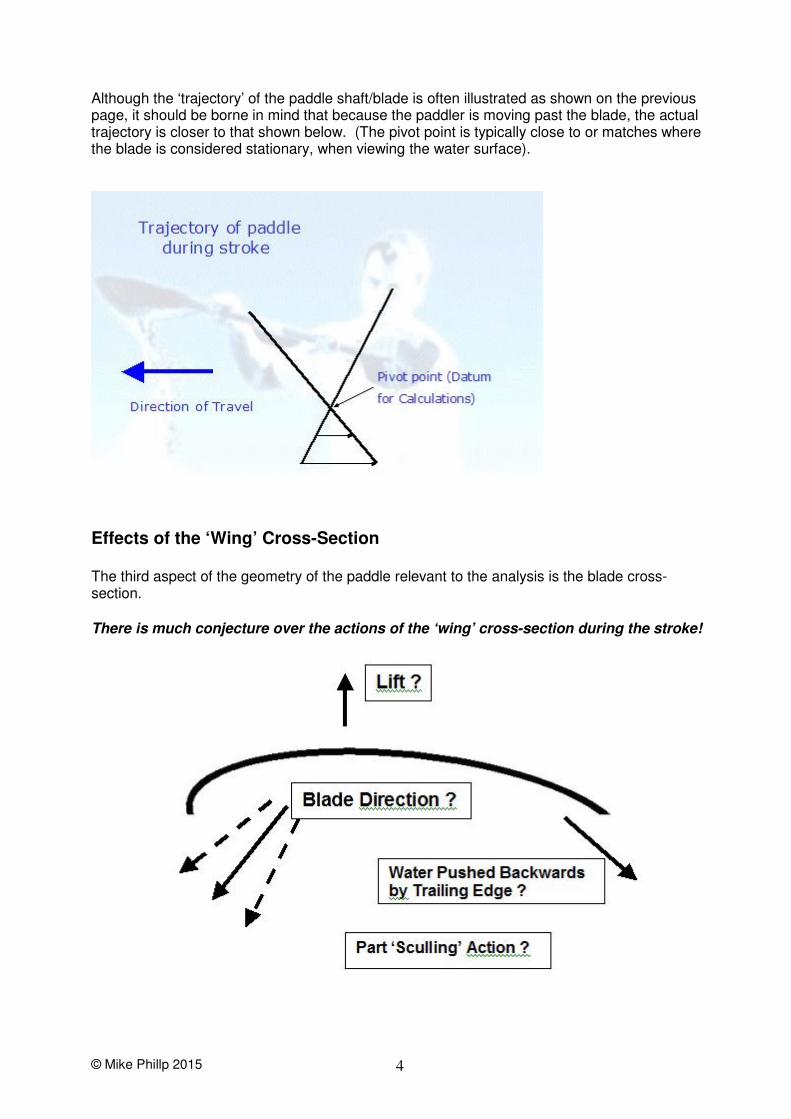
Effects of the ‘Wing’ Cross-Section The third aspect of the geometry of the paddle relevant to the analysis is the blade cross-section. There is much conjecture over the actions of the ‘wing’ cross-section during the stroke!

© Mike Phillp 2015 5
This lack of understanding (to the author and others) of the full effects of the ‘wing’ cross-section requires (in this method of analysis) that its shape is left unchanged, to avoid introducing performance changes that cannot be reliably measured. Although the cross-section cannot be changed without introducing unknown performance changes, the ‘planform’ of the paddle can be changed, and successfully ‘modelled’.
Maintaining the same typical ‘wing’ blade cross-section also gives confidence any newly derived paddle designs will require the minimum of familiarisation by the paddler. The relative ease of using a paddle with a different planform, when the typical ‘wing’ section has been maintained, has already been demonstrated in testing, using the ‘planform’ shown on the left of the picture (shaped to give 24% more surface area on the lower half of the blade).
Paddlers Force Curve
As well as the geometry of the paddle, the final aspect required for the calculations is the paddler’s ‘Force Curve’. This is the variation in force applied by the paddler during the stroke, plotted against the shaft angle (as viewed at right angles to the direction of travel). This information is required to complete the ‘crank’ angle performance aspect of the analysis. The example of a force curve shown below for an elite male paddler shows the force in Kgf, measured at the ‘bottom hand’ (typically the force on the blade would be approximately ‘half’ this value). The angle is relative to vertical, positive numbers being the start of the stroke, negative the finish.
10
20
30
40
50
60
Angle 34 25.5 15.5 3.5 -8 -19.3 -31 -41.5 -50 -58
Force 16 37 51.6 52 50 44 36 28 21 12
(See Appendix B - Force Curve measurement).

© Mike Phillp 2015 6
Calculation Principles and Assumptions
Blade Shape & Size The shape of the blade used in the calculations is that obtained by projecting the blade outline on to a flat surface. This ‘planform’ is then divided into fifty 1cm deep segments along its length for the purpose of the calculations.
It is assumed (for relatively small changes of area < 20%) the force exerted on a particular blade ‘segment’ (however the ‘wing’ cross-section is generating it) is proportional to the area of that segment (see Appendix C). In the calculations as the segment is always 1cm deep; the force exerted on it by the water (and visa versa) is considered proportional to the segment width. The segment width is measured at an angle of 20 degrees to the ‘normal’ width measurement, to allow for a typical blade angle at the beginning of the stroke. Left – Segment width measurement
Right – Blade Angle Profile
Blade Angle Profile The average angle (compared to the shaft) of each 1cm deep segment is also required for calculation purposes. Ideally the blade angle (profile) measurements are taken as an average of 5 equally spaced measurements across the blade segment (again at an angle of 20 degrees to ‘normal’).
© Mike Phillp 2015 7
Water Velocities & Accelerations The velocity and acceleration of water in contact with a particular blade segment, is proportional to the distance of that segment from the ‘pivot point’.
Pivot Point Video analysis indicates the paddle can be considered to ‘rotate’ around a static point (datum) typically around the blade/shaft join at the water surface. This can vary for different paddlers (and phases of the stroke), and the option to vary this value (for each phase) is built-in to the ‘paddle design tool’ Blade comparisons using datum points varying + and – 5cm from the blade/shaft join indicate this is not a critical value for accurate ‘blade’ comparisons (they just need to be the same for each of the paddles being compared).
Angle of Force Exerted by Water on Blade Surface
The analysis assumes the force on the blade exerted by the water (and visa versa) is at right angles to the blade surface. This approach is typically used in ‘hydrostatics’, but a paddle stroke is clearly not a ‘static’ situation. Analysis of the forces exerted on the water by the blade during the stroke, indicates a resulting ‘water flow’ down the length of the blade of < 0.5m/s. Calculating the force generated parallel to the blade surface due to the ‘surface drag’ of this flow, typical gives values of less than 1 Newton. This is a small value compared to the ‘hydrostatic forces’ (typically > 100 Newtons) being exerted at a genuine right angle to the blade during the stroke. Hence it is considered reasonable to assume for the purpose of calculations, that the forces are exerted at right to the blade surfaces.
Stroke ‘Phases The paddle stroke (for this analysis, being the time the blade is immersed) has been divided into 10 ‘phases’ of equal time duration. This allows appropriate parameters (when required) to be applied to each of these separate phases of the stroke. An example of this is the ‘blade entry’ at the beginning of the stroke. The current ‘default’ is for the first phase of the stroke to be calculated with one third of the blade ‘buried’, for the second phase two thirds of the blade ‘buried’, and for the rest of the phases with the blade fully ‘buried’. The parameters which can be varied (if necessary) for each stroke phase are:-
Force applied by the paddler. Amount of blade immersed. Pivot Point (Datum) Effective change of blade area due to ‘sideways’ movement of blade. The shaft angle (against vertical datum).
The ability to vary these parameters allows ‘test’ calculations to be made showing their impact on the overall blade performance. This allows a judgement to be made on the required accuracy required for specific input data. indicating its impact (and hence accuracy required) on the blade comparisons.

© Mike Phillp 2015 8
Basis of Blade Comparison Calculations (Paddle Design Tool) As the method compares two blades (for a particular force curve) rather than attempting to calculate performance from first principles, it is legitimate to use ‘proportional’ values, where the absolute values are not known. There is one line of calculation for each of the 50 ‘1cm blade segments’, repeated for each of the ten ‘phases’ of one complete stroke. Shown below as an example, are the last 5 entries from the first ‘phase’ of a particular analysis.
Paddle Shaft Angle - Angle of shaft as viewed from 90 degrees to direction of travel. Positive values are the ‘front’ of stroke. (Same value for all 50 segments of a single ‘Phase’). Paddle Shaft Force – (For the particular shaft angle) As measured using a ‘force meter’ fitted to the paddle shaft (see appendix B). In this case 12 Kgf. (Same for all 50 segments of a single ‘Phase’). Distance From Datum - The acceleration & velocity for any one segment will be proportional to its distance from the datum (measured in centimetres). Segment Width - Width of the individual (1cm deep) segment of blade which is that distance from the datum. (Top line shown above – the segment 46cm from the datum is 14.9cm wide). The ‘segment width’ is considered to be proportional to the mass of water accelerated by that particular blade segment (See Appendix C) Segment Width Contribution - Segment width multiplied by distance from datum. This is proportional to the force generated by the particular segment. A*D sq – Half the segment width multiplied by the distance from the datum ‘squared’ (equivalent to ½mv2). This is proportional to the ‘work done’ by that particular segment. Segment Value - Segment Width Contribution divided by the total area (sum of all 50 segments widths) of the blade. This gives the proportion each segment contributes to the stroke force. Adding up all the segment values should equal 1 (checksum in calculation is just to help identify ‘entry errors’). Segment Angle - Shaft Angle + the Blade Profile Angle The Segment Value is multiplied by the Cos and Sin of the Segment Angle and the Paddle Shaft Force, to give the Vertical and Horizontal Segment Contributions for that particular segment. The 500 vertical and horizontal segment contributions (10 phases X 50 Segments) are then summed to give the total vertical and horizontal forces for the stroke. These values are then modified to reflect any force changes resulting from changes in blade size and planform. (See following ‘Force & Work’ Ratios).
© Mike Phillp 2015 9
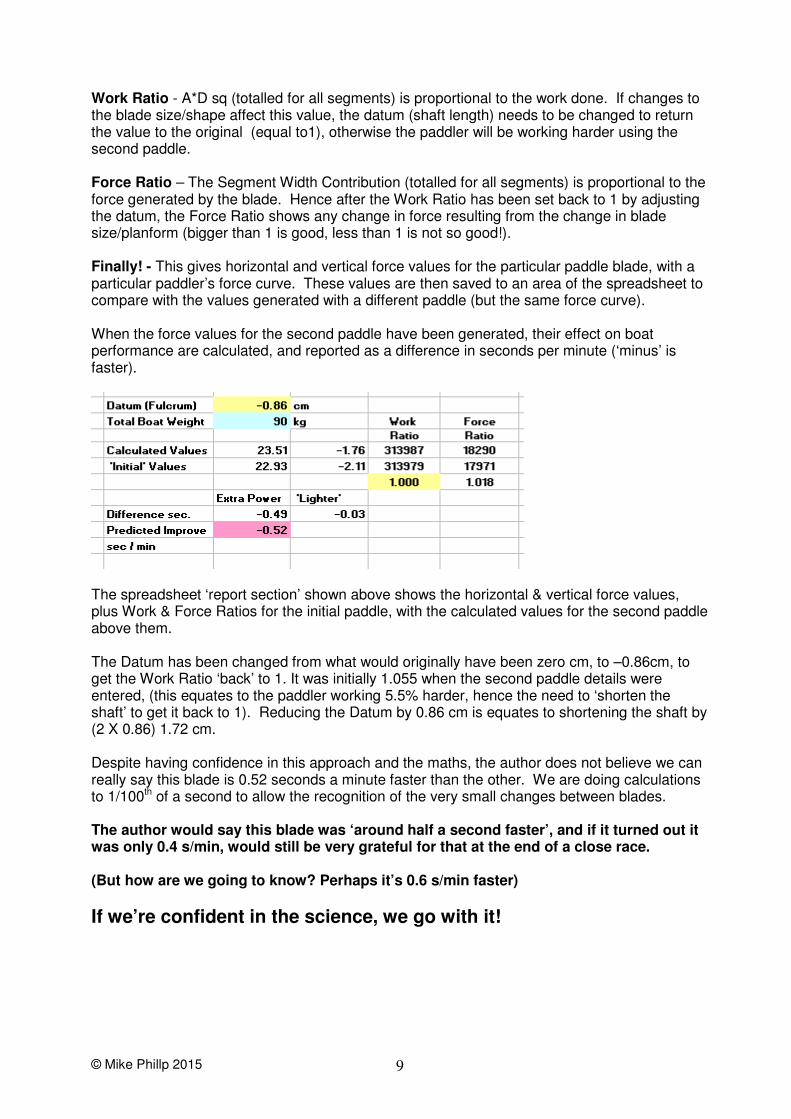
Work Ratio - A*D sq (totalled for all segments) is proportional to the work done. If changes to the blade size/shape affect this value, the datum (shaft length) needs to be changed to return the value to the original (equal to1), otherwise the paddler will be working harder using the second paddle. Force Ratio – The Segment Width Contribution (totalled for all segments) is proportional to the force generated by the blade. Hence after the Work Ratio has been set back to 1 by adjusting the datum, the Force Ratio shows any change in force resulting from the change in blade size/planform (bigger than 1 is good, less than 1 is not so good!). Finally! - This gives horizontal and vertical force values for the particular paddle blade, with a particular paddler’s force curve. These values are then saved to an area of the spreadsheet to compare with the values generated with a different paddle (but the same force curve). When the force values for the second paddle have been generated, their effect on boat performance are calculated, and reported as a difference in seconds per minute (‘minus’ is faster).
The spreadsheet ‘report section’ shown above shows the horizontal & vertical force values, plus Work & Force Ratios for the initial paddle, with the calculated values for the second paddle above them. The Datum has been changed from what would originally have been zero cm, to –0.86cm, to get the Work Ratio ‘back’ to 1. It was initially 1.055 when the second paddle details were entered, (this equates to the paddler working 5.5% harder, hence the need to ‘shorten the shaft’ to get it back to 1). Reducing the Datum by 0.86 cm is equates to shortening the shaft by (2 X 0.86) 1.72 cm. Despite having confidence in this approach and the maths, the author does not believe we can really say this blade is 0.52 seconds a minute faster than the other. We are doing calculations to 1/100th of a second to allow the recognition of the very small changes between blades. The author would say this blade was ‘around half a second faster’, and if it turned out it was only 0.4 s/min, would still be very grateful for that at the end of a close race. (But how are we going to know? Perhaps it’s 0.6 s/min faster)
If we’re confident in the science, we go with it!
© Mike Phillp 2015 10
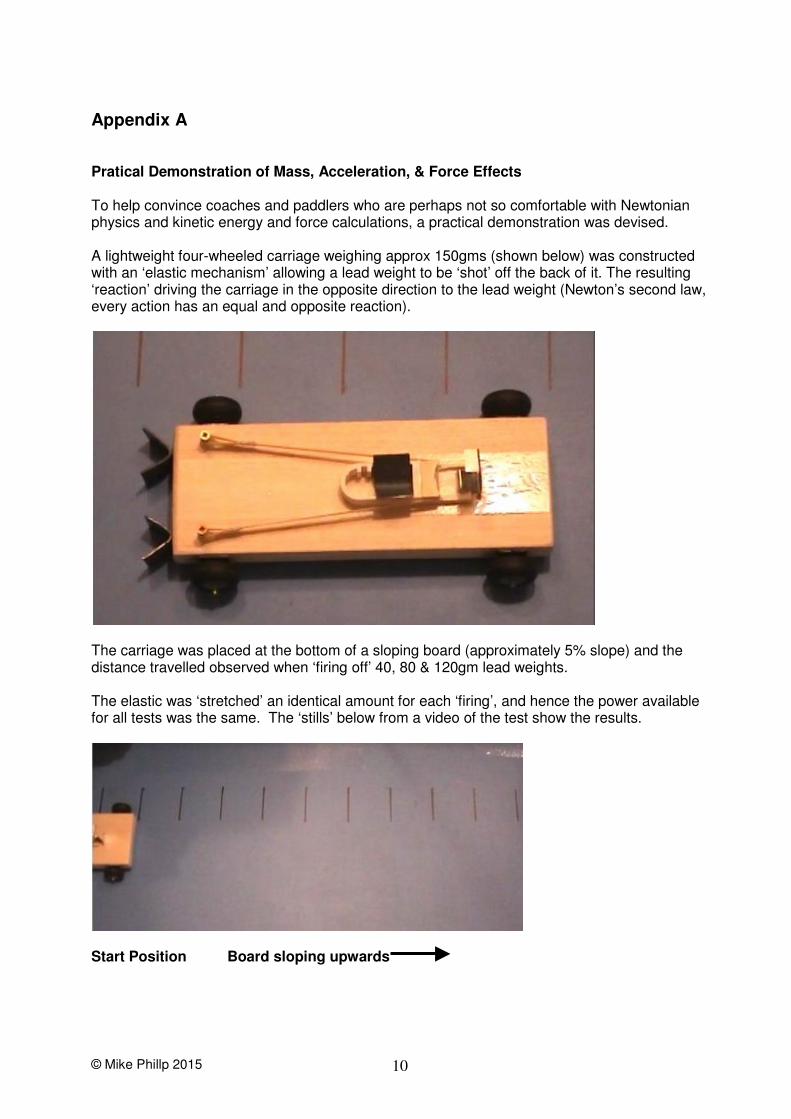
Appendix A Pratical Demonstration of Mass, Acceleration, & Force Effects To help convince coaches and paddlers who are perhaps not so comfortable with Newtonian physics and kinetic energy and force calculations, a practical demonstration was devised. A lightweight four-wheeled carriage weighing approx 150gms (shown below) was constructed with an ‘elastic mechanism’ allowing a lead weight to be ‘shot’ off the back of it. The resulting ‘reaction’ driving the carriage in the opposite direction to the lead weight (Newton’s second law, every action has an equal and opposite reaction).
The carriage was placed at the bottom of a sloping board (approximately 5% slope) and the distance travelled observed when ‘firing off’ 40, 80 & 120gm lead weights. The elastic was ‘stretched’ an identical amount for each ‘firing’, and hence the power available for all tests was the same. The ‘stills’ below from a video of the test show the results.
Start Position Board sloping upwards
© Mike Phillp 2015 11
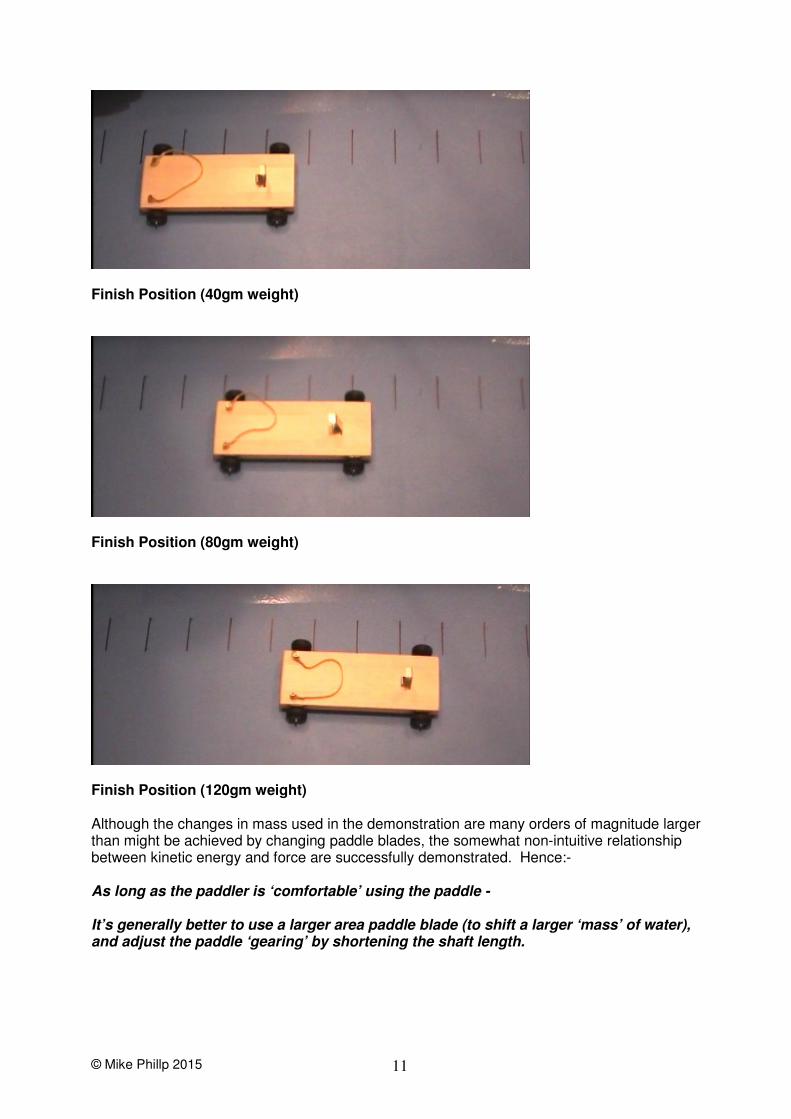
Finish Position (40gm weight)
Finish Position (80gm weight)
Finish Position (120gm weight) Although the changes in mass used in the demonstration are many orders of magnitude larger than might be achieved by changing paddle blades, the somewhat non-intuitive relationship between kinetic energy and force are successfully demonstrated. Hence:- As long as the paddler is ‘comfortable’ using the paddle - It’s generally better to use a larger area paddle blade (to shift a larger ‘mass’ of water), and adjust the paddle ‘gearing’ by shortening the shaft length.

© Mike Phillp 2015 12
Appendix B Paddler’s Force Curve Currently this information is obtained by videoing the paddler side-on, with a ‘laser beam’ force meter attached to the shaft. (It’s interesting to note all the kayak ‘force curves’ found when searching the internet are for force / time, hence missing an important aspect of the paddle stroke). ‘Force Meter’ - A stiff carbon rod is clamped just ‘inside’ of one of the paddler’s hand positions. The far end of the rod does not move with the paddle shaft as it bends under load. This difference in displacement is used to move a small mirror, reflecting a laser beam on to a ‘scale’ at the clamped end of the stiff tube.
After the paddling / video session, the paddle is incrementally loaded with weights at the ‘lower hand’ position while being supported at the upper hand position and an area close to the assumed blade centre of pressure. A ‘translation table’ can then be created to convert the ‘videoed’ scale readings to Kgf.
(A less labour intensive method is being searched for!)

© Mike Phillp 2015 13
Appendix C The drag force on an object moving through a fluid is represented by the equation:-
where
is the drag force, is the density of the fluid. is the speed of the object relative to the fluid,
is the cross-sectional area, and
is the drag coefficient (a dimensionless number) When examining the the force on a blade ‘segment’ exerted by the water:-
, v, and are constant,
making the drag force proportional to the crosssectional area.
As the segment ‘height’ is fixed (at 1cm), the force exerted on a blade segment is proportional to the width of the segment.