Embed Size (px)
Citation preview
Brazil
A new window of opportunity
José FirmoPresident of Brazilian Petroleum,
Gas and Biofuels Institute
The content of this presentation is merelyinformative and uses data from third parties. IBPdisclaims any responsibility for the completeness,accuracy and timeliness of the presentedinformation, as well as for any effects arising fromits use and interpretation. All intellectual propertyrights in any way related to the presentedinformation, as well as any responsibility for itscontent, lies with its respective authors and/orproprietors.
Disclaimer
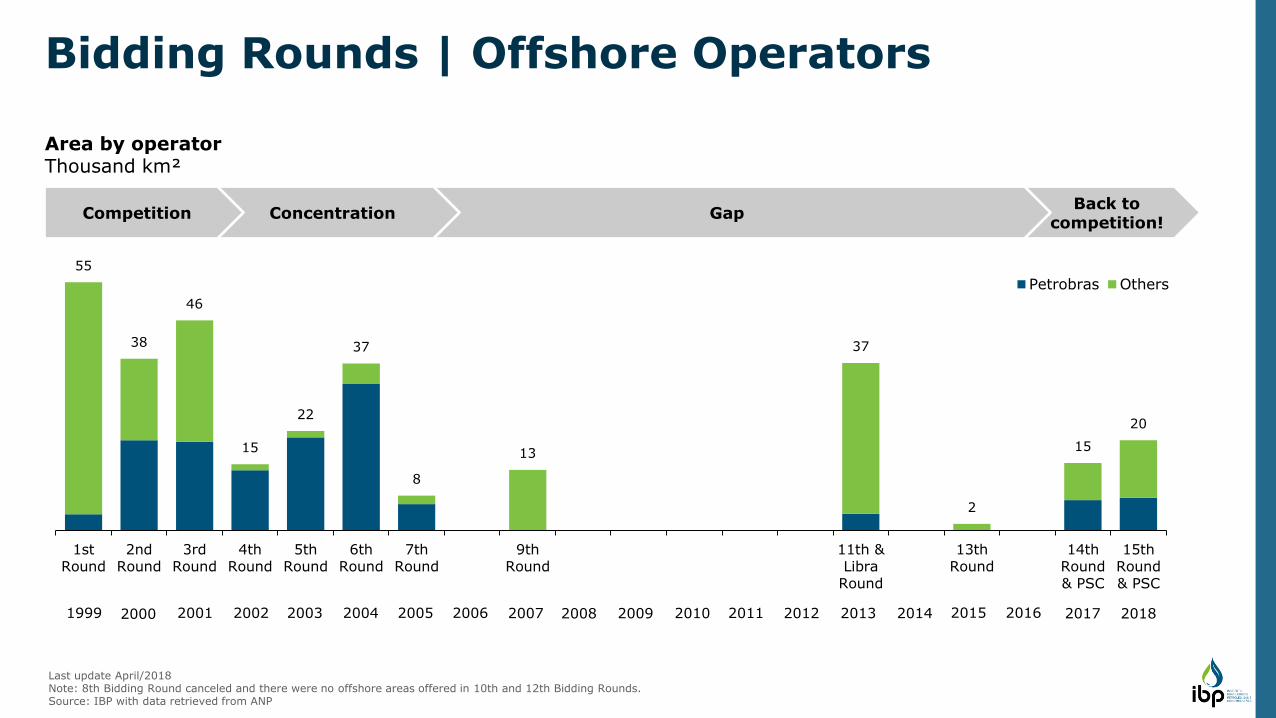
55
38
46
15
22
37
8
13
37
2
15
20
1stRound
2ndRound
3rdRound
4thRound
5thRound
6thRound
7thRound
9thRound
11th &Libra
Round
13thRound
14thRound& PSC
15thRound& PSC
Petrobras Others
1999 2000 2001 2002 2003 2004 2005 2006 2007 2008 2009 2010 2011 2012 2013 2014 2015 2016 2017 2018
Bidding Rounds | Offshore Operators
Last update April/2018Note: 8th Bidding Round canceled and there were no offshore areas offered in 10th and 12th Bidding Rounds. Source: IBP with data retrieved from ANP
Area by operatorThousand km²
Back to competition!
GapConcentrationCompetition
Note: TBN means To Be NamedSource: IBP with data retrieved from E&P Brasil and ANP
Installed Bidding in progress
Pending final investment decisions
Final investment decisions
Under construction
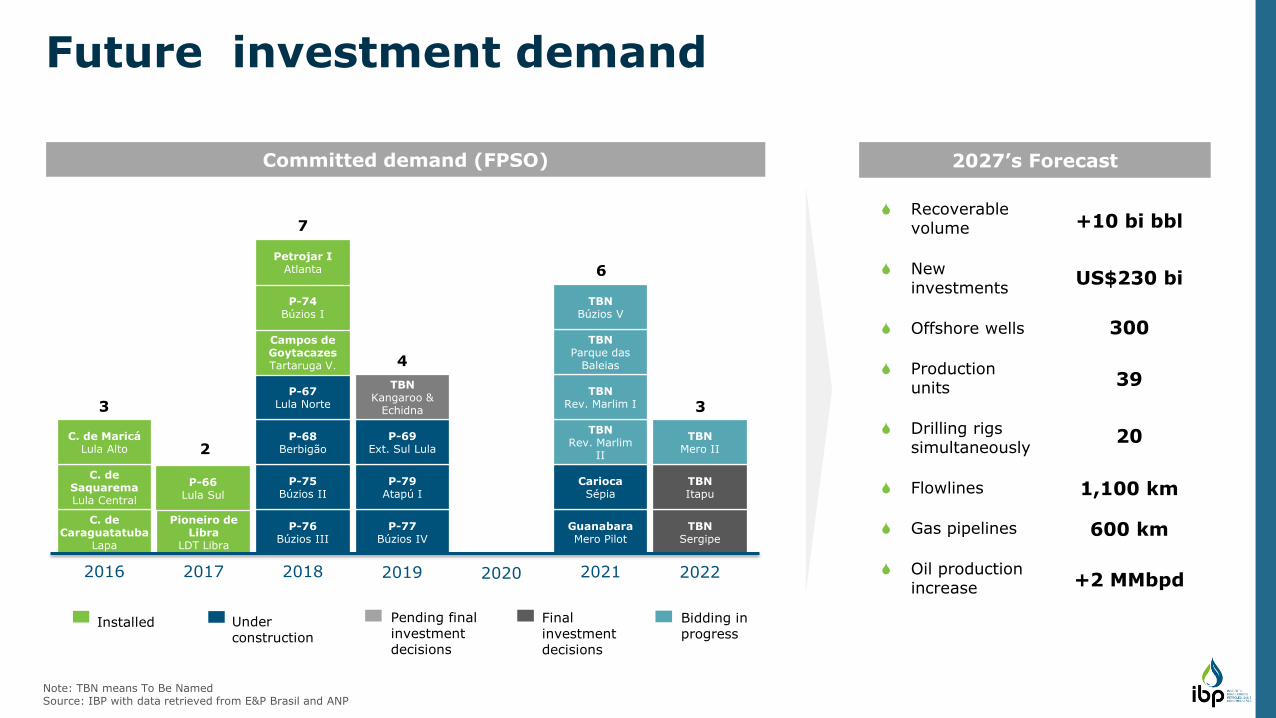
2027’s Forecast
2016 2019 2020 2021 2022
Committed demand (FPSO)
Future investment demand
C. de Caraguatatuba
Lapa
C. de SaquaremaLula Central
C. de MaricáLula Alto
2017 2018
Pioneiro de Libra
LDT Libra
P-76Búzios III
P-75Búzios II
P-68Berbigão
P-67Lula Norte
Campos de GoytacazesTartaruga V.
P-74Búzios I
Petrojar IAtlanta
P-77Búzios IV
P-79Atapú I
P-69Ext. Sul Lula
TBNKangaroo &
Echidna
GuanabaraMero Pilot
CariocaSépia
TBNRev. Marlim
II
TBNRev. Marlim I
TBNParque das
Baleias
TBNBúzios V
TBNSergipe
TBNItapu
TBNMero II
7
4
6
33
Recoverable volume
New investments
Offshore wells
Production units
Drilling rigs simultaneously
Flowlines
Gas pipelines
Oil production increase
+10 bi bbl
US$230 bi
300
39
20
1,100 km
600 km
+2 MMbpd
P-66Lula Sul
2
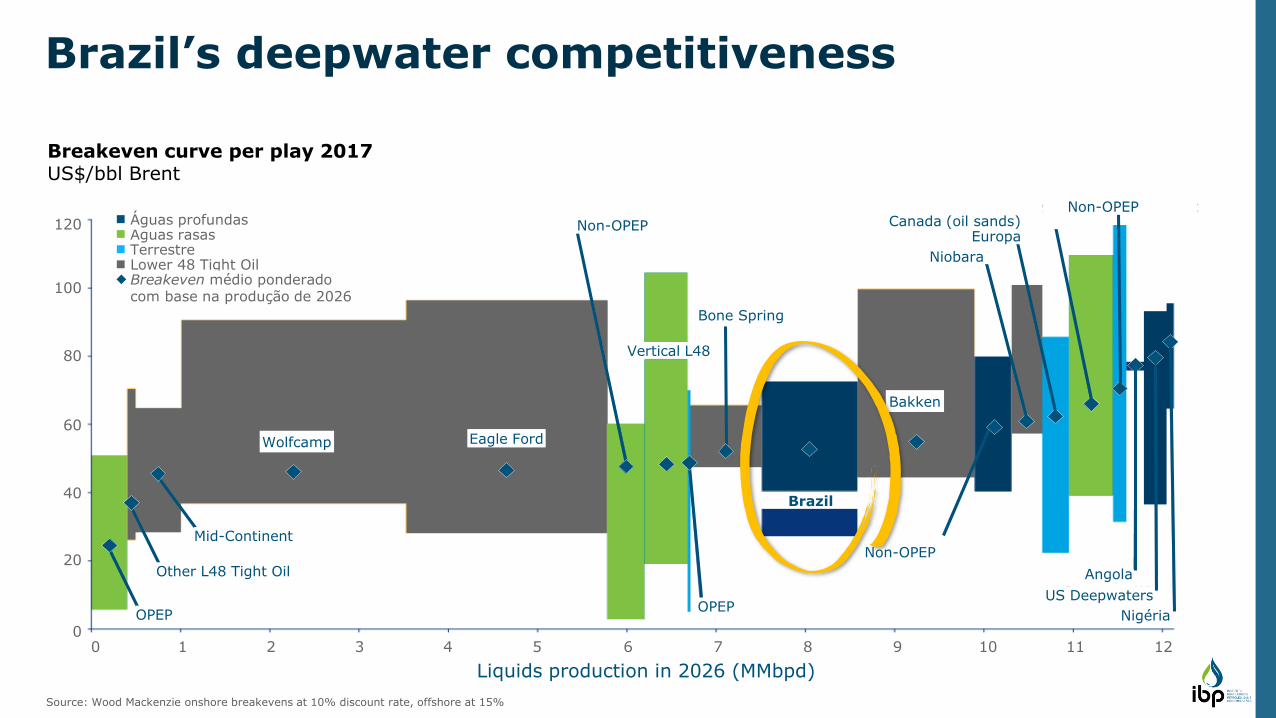
120
100
80
60
40
20
00 1 2 3 4 5 6 7 8 9 10 11 12
TerrestreLower 48 Tight OilBreakeven médio ponderado com base na produção de 2026
OPEP
Other L48 Tight Oil
Mid-Continent
Wolfcamp Eagle Ford
OPEP
Non-OPEP
Angola
US Deepwaters
Vertical L48
Bakken
Bone Spring
Non-OPEP
Niobara
EuropaCanada (oil sands)
Nigéria
Brazil
Águas rasasÁguas profundas
Non-OPEP
Liquids production in 2026 (MMbpd)
Source: Wood Mackenzie onshore breakevens at 10% discount rate, offshore at 15%
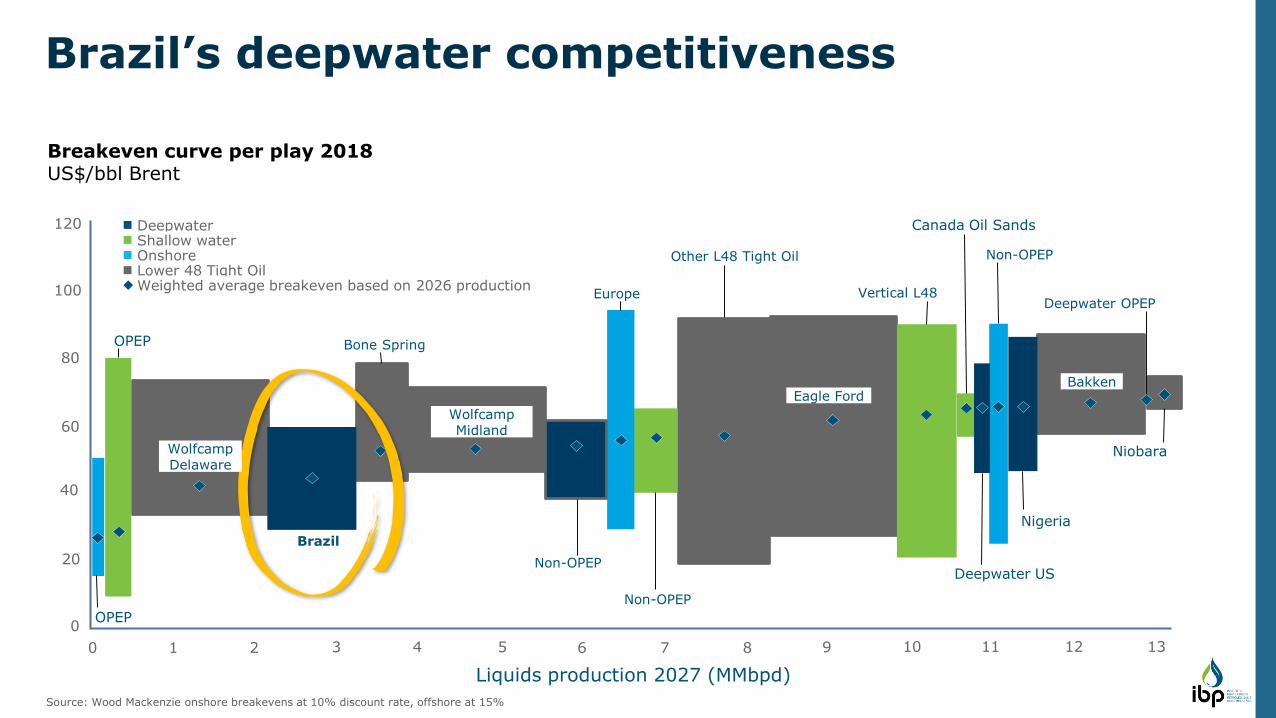
Brazil’s deepwater competitiveness
Breakeven curve per play 2017US$/bbl Brent
Deepwater OPEP
Brazil
120
100
80
60
40
20
0
0 1 2 3 4 5 6 7 8 9 10 11 12 13
Niobara
OPEP
OPEP
WolfcampDelaware
Bone Spring
WolfcampMidland
Non-OPEP
Europe
Other L48 Tight Oil
Eagle Ford
Vertical L48
Non-OPEP
Nigeria
Breakeven curve per play 2018US$/bbl Brent
Liquids production 2027 (MMbpd)
Canada Oil Sands
Non-OPEP
Deepwater US
Bakken
DeepwaterShallow waterOnshoreLower 48 Tight OilWeighted average breakeven based on 2026 production
Source: Wood Mackenzie onshore breakevens at 10% discount rate, offshore at 15%
Brazil’s deepwater competitiveness
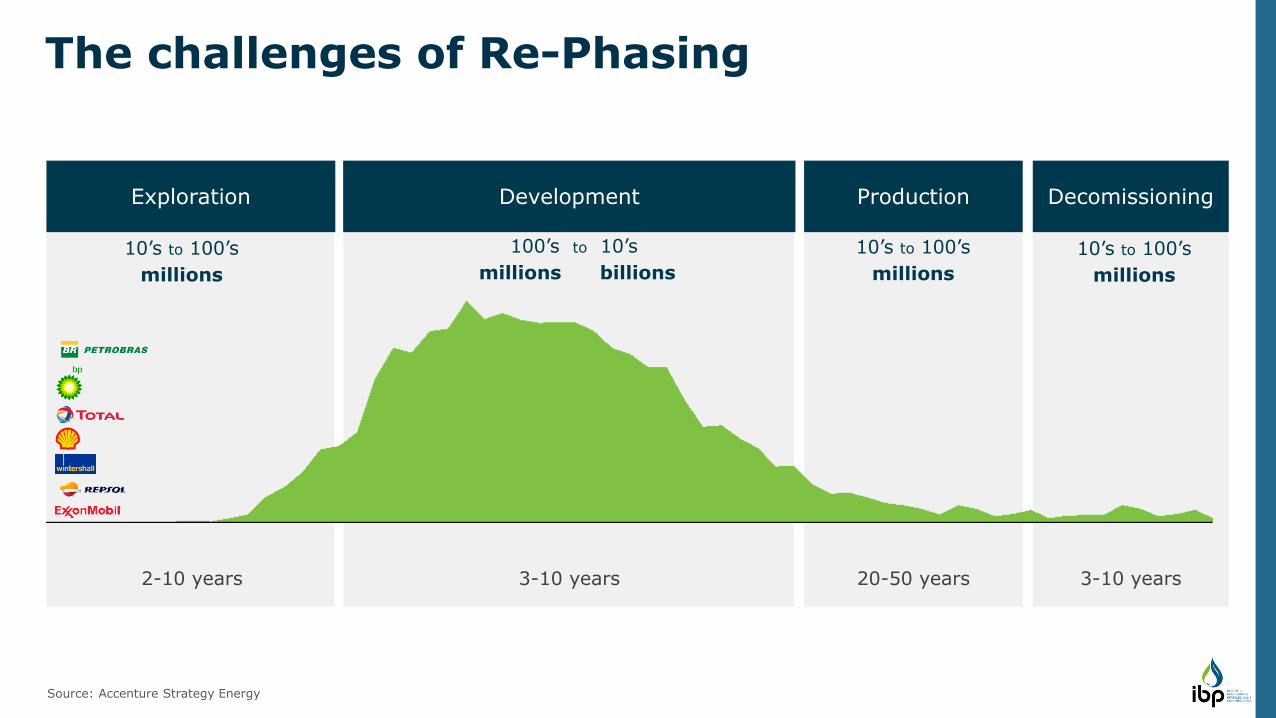
Source: Accenture Strategy Energy
Exploration Development Production Decomissioning
2-10 years 3-10 years 20-50 years 3-10 years
10’s to 100’s
millions
The challenges of Re-Phasing
100’s to 10’s
millions billions
10’s to 100’s
millions
10’s to 100’s
millions
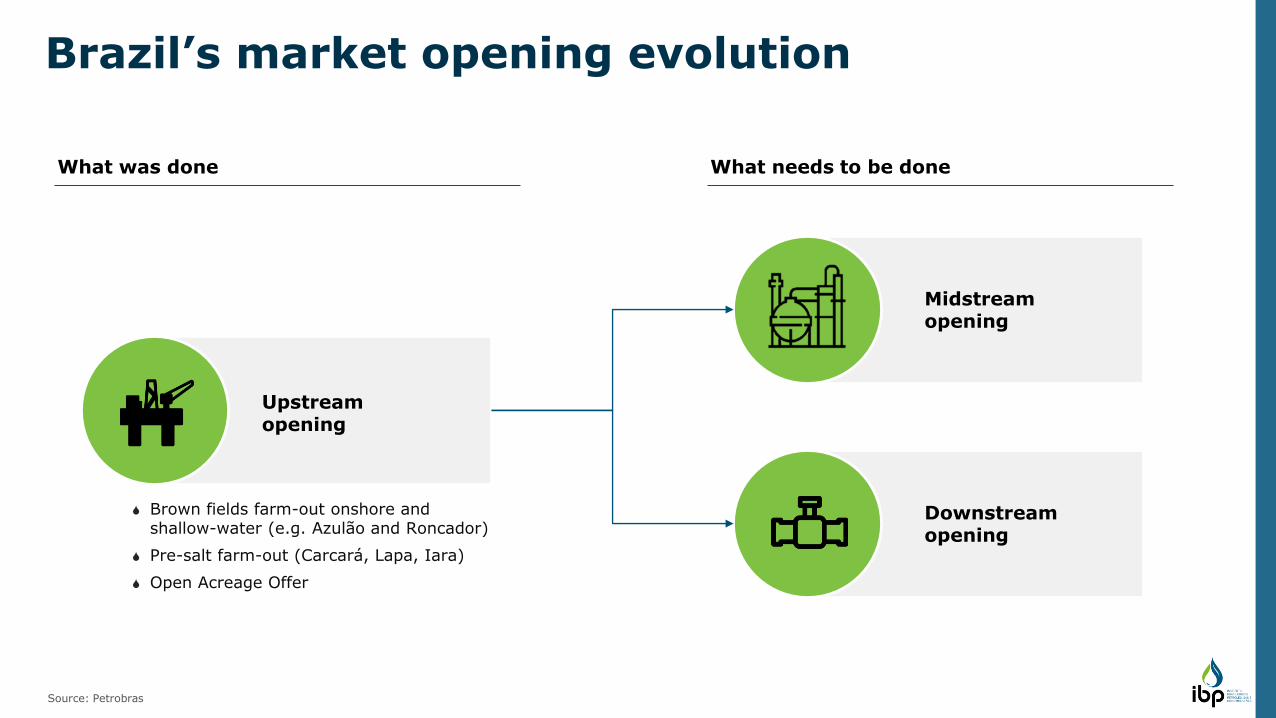
What was done What needs to be done
Upstreamopening
Midstreamopening
Downstreamopening
Brazil’s market opening evolution
Brown fields farm-out onshore and shallow-water (e.g. Azulão and Roncador)
Pre-salt farm-out (Carcará, Lapa, Iara)
Open Acreage Offer
Source: Petrobras
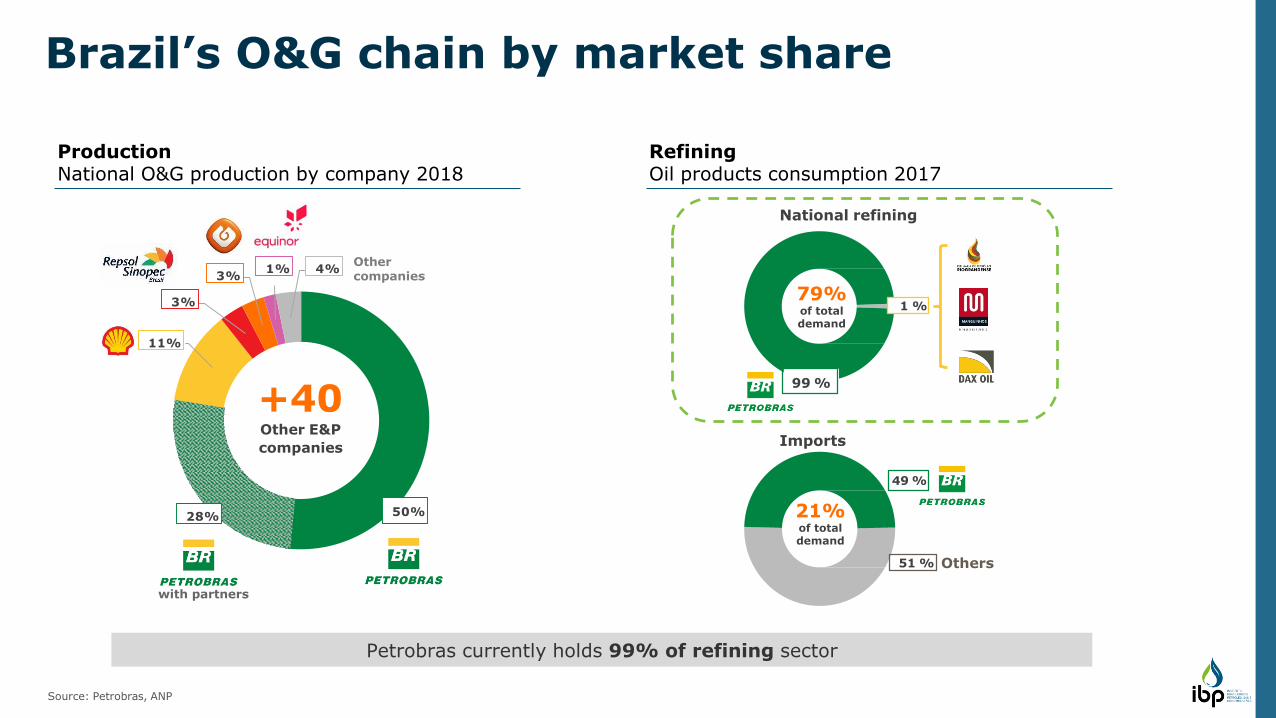
Source: Petrobras, ANP
Brazil’s O&G chain by market share
50%28%
11%
3%
3%1% 4%
+40Other E&P
companies
with partners
Other companies
Imports
51 %
21%of total demand
Others
National refining
99 %
1 %79%of total demand
49 %
Petrobras currently holds 99% of refining sector
ProductionNational O&G production by company 2018
RefiningOil products consumption 2017
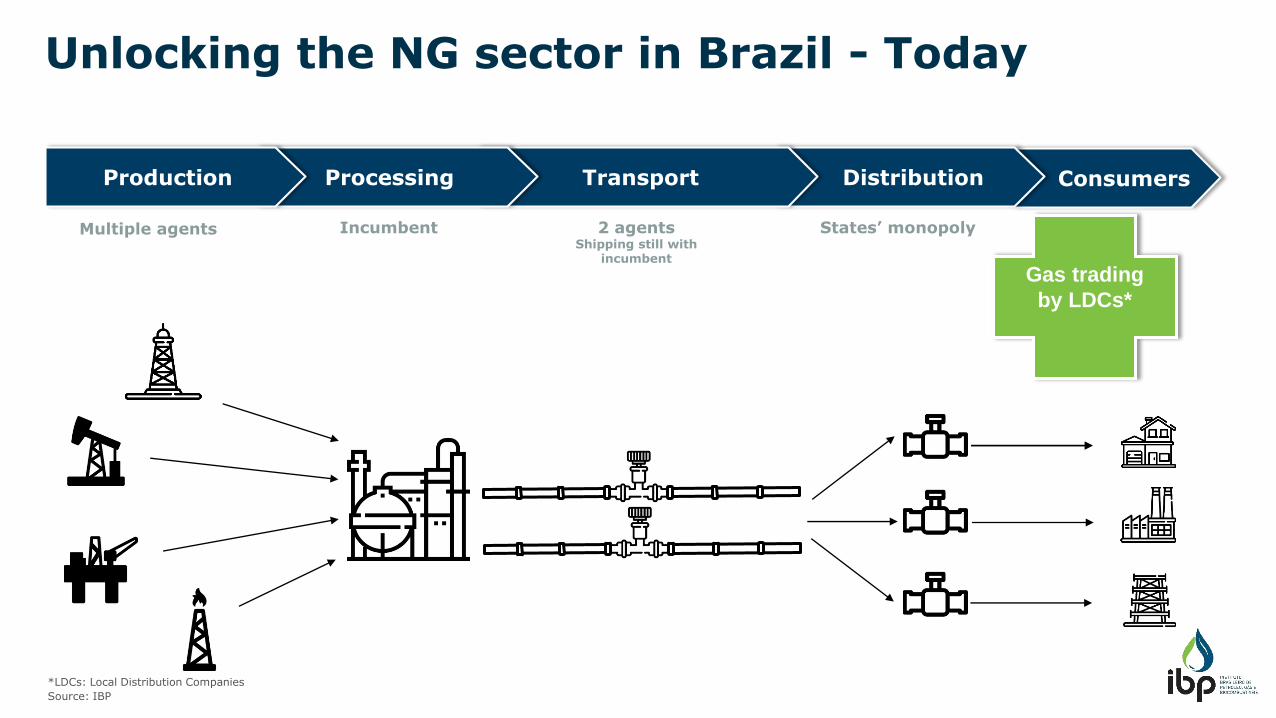
ConsumersDistributionTransportProcessingProduction
Multiple agents 2 agentsShipping still with
incumbent
States’ monopolyIncumbent
*LDCs: Local Distribution Companies
Source: IBP
Gas trading
by LDCs*
Unlocking the NG sector in Brazil - Today
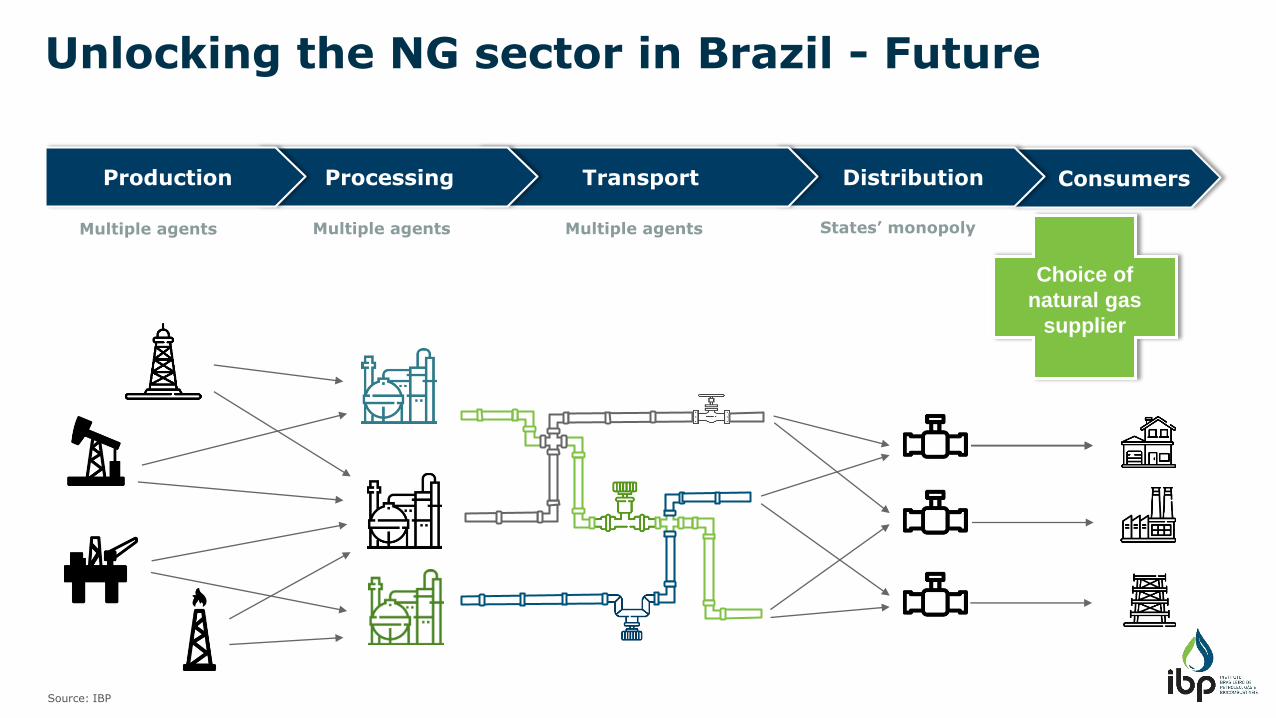
Multiple agentsMultiple agents
Choice of
natural gas
supplier
Source: IBP
ConsumersDistributionTransportProcessingProduction
Multiple agents States’ monopoly
Unlocking the NG sector in Brazil - Future
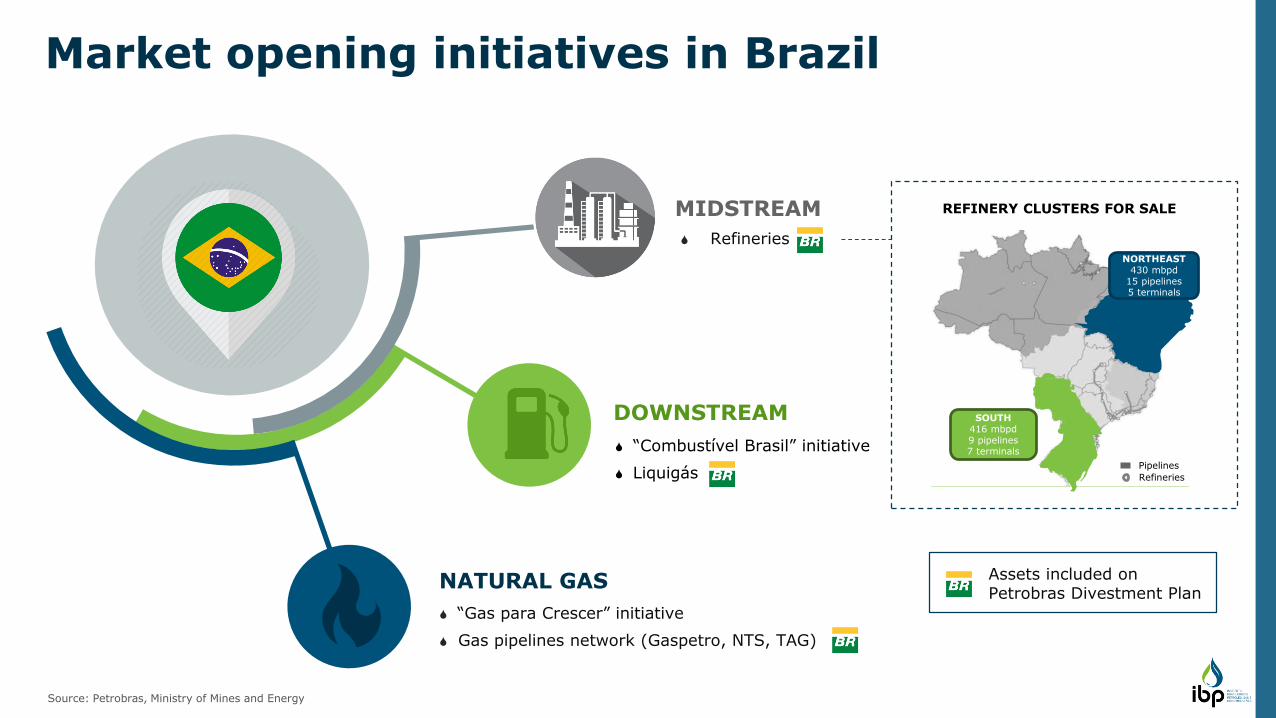
Pipelines
Refineries
NORTHEAST430 mbpd
15 pipelines5 terminals
SOUTH416 mbpd9 pipelines7 terminals
REFINERY CLUSTERS FOR SALE
NATURAL GAS
“Gas para Crescer” initiative
Gas pipelines network (Gaspetro, NTS, TAG)
Refineries
MIDSTREAM
“Combustível Brasil” initiative
Liquigás
DOWNSTREAM
Assets included on Petrobras Divestment Plan
Market opening initiatives in Brazil
Source: Petrobras, Ministry of Mines and Energy
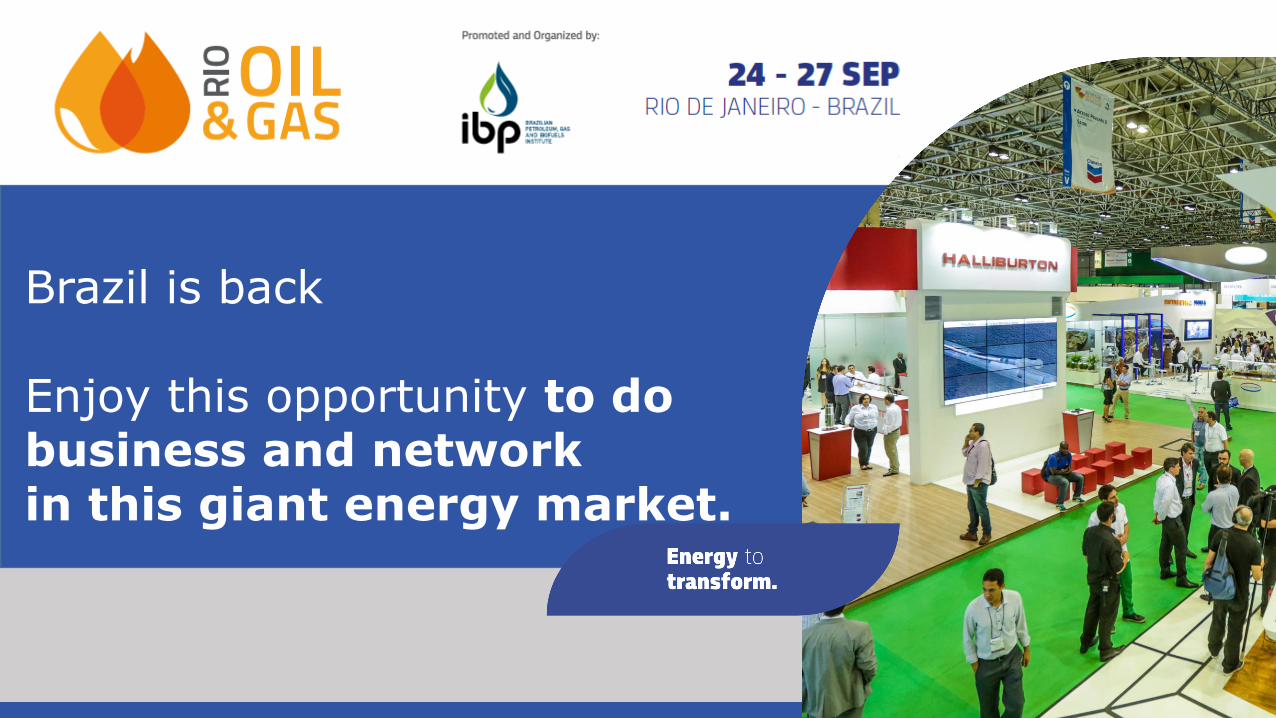
Brazil is back
Enjoy this opportunity to do business and networkin this giant energy market.
25
Thank you!
José Firmo
President of Brazilian Petroleum, Gas and Biofuels Institute
(IBP)