Embed Size (px)
Citation preview
95
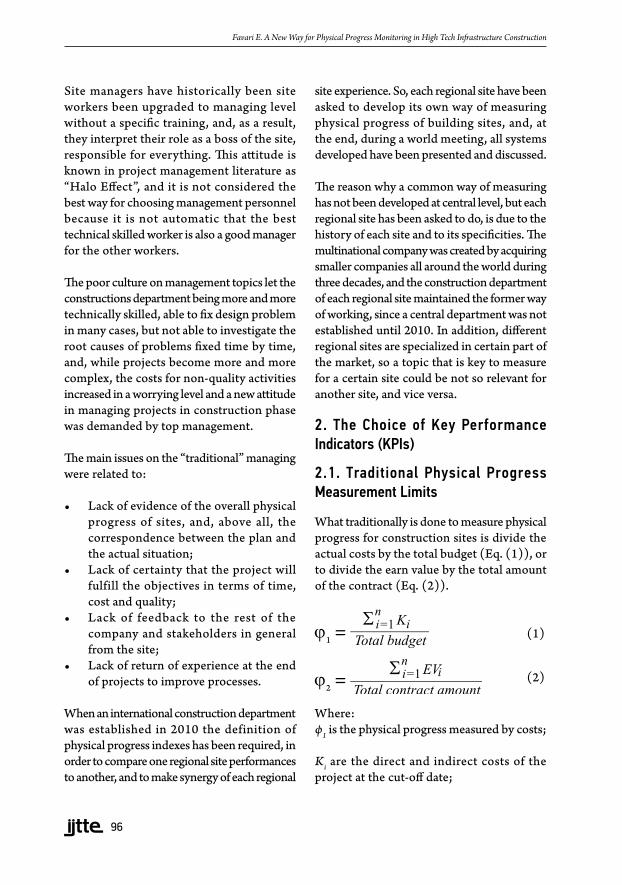
A NEW WAY FOR PHYSICAL PROGRESS MONITORING IN HIGH TECH INFRASTRUCTURE CONSTRUCTION
Edoardo Favari1
1 Environmental and Infrastructure Engineering – Politecnico di Milano, Italy
Received 2 January 2013; accepted 6 February 2013
Abstract: This paper presents the project of designing an agile physical progress measurement system for the construction management department of a multinational company operating in turnkey railway projects field. It has been pointed out that the classical physical progress measurement, based on Earn Value Management (EVM) and so financially based, is not suitable for modern high-tech and, in one word, complex, construction projects. So it has been looked for something different, more agile, to easily fix the problem of monitoring on a weekly basis the physical progress of sites. The work starts by describing the process of choosing KPIs, defines an overall physical progress index, than discusses the choice of a baseline to measure against, and at the end it illustrates the visual management implemented.
Keywords: construction, project, management, physical progress, KPI, visual management.
1 Corresponding author: [email protected]
1. Introduction
It has been asked by a multinational engineering and contracting company operating in the railway sector, mainly in the signalling field but providing turnkey system, to develop a way to keep under control the performances of the building sites managed by the Construction Department. The problem faced by the Company is that the classic physical progress measurement based on Earn Value Management (EVM) and so financially based (Bassioni et al., 2004), is not suitable for project in which schedule is compressed, many players all over the world are involved (departments of the Company in many parts of the world, many suppliers and subcontractors), and building sites are not just around the corner, so it’s not possible for middle management to get there and monitor and control so easily. In fact, in this case, financial information arrives no more often than once a month, and often
some player have some problem in sending information (in invoicing and so on), and for this reason the information on physical progress measurement is updated in the best case on a monthly basis and often it is not complete (Fleming and Koppelman, 2010). The aim of the Company was to be able to get a physical progress index on a weekly basis, even losing some information detail, in order to be able to see the trend of works on the building site and to be able to take promptly measure to correct it, in case. The project is still going on, and this paper describes the first results of it.
In the Company, building sites have always been managed in a “traditional” way. The site manager was responsible for controlling almost all sides of the building site: reviewing the design, surveying the quantities, fixing any problem, checking and reporting the physical progress, and take corrective actions in case.
UDC: 338.45:005.8DOI: http://dx.doi.org/10.7708/ijtte.2013.3(1).09
International Journal for Traffic and Transport Engineering, 2013, 3(1): 95 – 102
96
Site managers have historically been site workers been upgraded to managing level without a specific training, and, as a result, they interpret their role as a boss of the site, responsible for everything. This attitude is known in project management literature as “Halo Effect”, and it is not considered the best way for choosing management personnel because it is not automatic that the best technical skilled worker is also a good manager for the other workers.
The poor culture on management topics let the constructions department being more and more technically skilled, able to fix design problem in many cases, but not able to investigate the root causes of problems fixed time by time, and, while projects become more and more complex, the costs for non-quality activities increased in a worrying level and a new attitude in managing projects in construction phase was demanded by top management.
The main issues on the “traditional” managing were related to:
• Lack of evidence of the overall physical progress of sites, and, above all, the correspondence between the plan and the actual situation;
• Lack of certainty that the project will fulfill the objectives in terms of time, cost and quality;
• Lack of feedback to the rest of the company and stakeholders in general from the site;
• Lack of return of experience at the end of projects to improve processes.
When an international construction department was established in 2010 the definition of physical progress indexes has been required, in order to compare one regional site performances to another, and to make synergy of each regional
site experience. So, each regional site have been asked to develop its own way of measuring physical progress of building sites, and, at the end, during a world meeting, all systems developed have been presented and discussed.
The reason why a common way of measuring has not been developed at central level, but each regional site has been asked to do, is due to the history of each site and to its specificities. The multinational company was created by acquiring smaller companies all around the world during three decades, and the construction department of each regional site maintained the former way of working, since a central department was not established until 2010. In addition, different regional sites are specialized in certain part of the market, so a topic that is key to measure for a certain site could be not so relevant for another site, and vice versa.
2. The Choice of Key Performance Indicators (KPIs)
2.1. Traditional Physical Progress Measurement Limits
What traditionally is done to measure physical progress for construction sites is divide the actual costs by the total budget (Eq. (1)), or to divide the earn value by the total amount of the contract (Eq. (2)).
ϕ1 =
(1)
ϕ2 = (2)
Where:ϕ1 is the physical progress measured by costs;
Ki are the direct and indirect costs of the project at the cut-off date;
Favari E. A New Way for Physical Progress Monitoring in High Tech Infrastructure Construction
97
ϕ2 is the physical progress measured by earn value;
EVi is the Earn Value at the cut-off date.
By doing in this way, the physical progress can be given after the accounting office send its reports, typically on a monthly basis, and any problem in accounting, for example a late or incomplete invoice, let the physical progress measure be imprecise and not updated.
W hen projects become more complex (Kaimann, 1975), with challenging constrains in terms of delivery time, the updated physical progress percentage of building sites become crucial to let the project team timely take corrective actions when a slippage from the baseline occurs (Favari, 2012). So, the traditional way of measuring physical progress by financial drivers becomes useless in a complex and fast project environment.
2.2. Effort-Based KPIs
According both to managing directions and in site personnel experience, effort related KPIs are the most significant to record the physical progress of building sites. Nevertheless, the choice of consistent KPIs has not been immediate. In the railways field, the items to be installed are a great variety, different from project to project and from country to country, due to the fact that almost all railway systems have been developed in a specific country, without taking into account the problem of interoperability, since the issue emerged starting from the European Union’s TEN-T project.
The characteristics that KPIs must fulfill to the purpose are (Kerzner and Sponholtz, 2011):
• Small number, in order not to require much time to be record on a up to a weekly basis;
• Be a kind of Yes/No items, without uncertainty on if a specific item should be or not counted in a certain review (an item must be installed or not), without any grey areas;
• Must be relevant in terms of workload: it has been decided to avoid recording items that require short time to be installed, and would not have given a relevant contribution to the increase of the overall physical progress.
After a long debate, it has been made the categorization below for signalling:
• Track circuits installation [nr]• Switch points installation [nr]• Balises, pedals, indusi etc. [nr]• Signal masts and bridges [nr]• Main signals [nr]• Dwarf signals [nr]• Cable laying (any cable) [m]• Cable trenches (with or without pipes,
pegs, …) [m]• Concrete ducts [m].
For track works, it has been decided to monitor the following:
• Track laying [m]• Turnouts [nr]• Insulated joints [nr].
And similarly for other railway specialities.
Due to the most experienced site managers in the Company, those KPIs are enough to monitor the physical progress of a signalling building site (see below).
2.3. Comparison
At this point, it is possible to state the physical progress of each item defined, but the overall
International Journal for Traffic and Transport Engineering, 2013, 3(1): 95 – 102
98
physical progress index is defined in the next paragraph. Time (effort) based KPIs are the best to monitor the physical progress of a signalling building site. Moreover, they are quite easy to count, and do not require a big contribution from the personnel in site. They are also easy to check, and, in case of suspicion of not correct information provision from the personnel trying to hide problems faced in site, can be easily checked by a third party by performing a site survey.
3. The Overall Physical Progress Index
The need for an overall percentage expressing the total physical progress of the building site emerged since the beginning of the work. In fact, traditionally, site managers were able to provide the physical progress of each item (e.g. 70% of track and 30% of main signals installed) but, in this way, it was not possible to state if the building site was, overall, at a certain percentage of physical progress (e.g. the building site is at 60%). The problem laid in the difference of units of measure and in the effort required to install items that concur in defining the overall physical progress, for example meters of track and number of signal bridges.
3.1. The Weight Matrix
The best way conceived to put together KPIs having different significance and different physical dimension (in general, meters and absolute numbers) was to make all KPIs uniform by multiplying the value of each KPI by a coefficient based on the effort required to produce/install one unit of that KPI.
In this way, a matrix has been built, having on the first column the KPIs, and in the second column a weight given to each KPI in the overall physical progress measurement equation.
Each weight is equal to the inverse of the production per day of that KPI. So, if it is assumed that the average production of cable laying per day is 5000 meters per day, the value of weight for the cable laying KPI will be 1/5000 [day/meters] = 0,0002. Equally, assuming to require 5 days to install one signal, the value of the weight for signals installation would be 5 [day/nr].
The physical significance of these numbers is that it is required 5 days to install one signal and 1/5000 of day to install one meter of cable.
In this way, the physical progress provided by installing one signal bridge is the same than installing 5 x 5000 = 25000 meters of cables.
It must be pointed out that it has been chosen to make rough assumptions in order to have an agile instrument. For example, the contribution given by the installation of a double turnout is the same than a single turnout, even if it is known that the effort required is significantly smaller in the second case. To avoid big gap in the evaluation of the overall physical progress index, these problems in the definition of weights have been taken into account, defining an average production of the best and the worst case, using the well-known formula (Eq. (3)) (PMBOK 4th edition):
D = (3)
Where B stands for “best case”, W for “worst case”, N for “normal” and D for “average duration”.
In addition, it has been decided to define the weight matrix once for all, so it is not possible to take into account specific local condition, for example the hardness of ground to be dug. It has been estimated that the loss in accuracy in the physical progress measurement due to
Favari E. A New Way for Physical Progress Monitoring in High Tech Infrastructure Construction
99
local condition is less important than having an easy-to-use tool.
3.2. The Overall Physical Progress Equation
The overall physical progress equation has the (classic) following expression (Eq. (4)):
Φ = (4)
Where:KPIi,t is the value of the KPI at the cut-off date (t);
KPIi,tot is the value of the KPI at completion;
pi is the weight of the KPIi.
It provides a synthetic percentage that represents the overall physical progress of the building site, at a certain cut-off date.
Being a percentage, it is required to pay attention that it doesn’t overcome the 100%, because this would be meaningless. This could happen due to errors in writing the total amount of items to be installed, but, more often, when during the project execution phase a variation order is required by the Customer and the baseline is not updated consequently. For example, if in the original contract 100 signals are required, and during the project execution 5 additional signals are required, at the end of the project the physical progress would result of 105% if the baseline is not updated as soon as the variation order is signed. The example is regarding a single KPI, but it can be easily extended to the whole amount of KPIs.
3.3. The S Curve of the Overall Physical Progress
The percentage of physical progress can be easily put on a time-percentage chart,
to provide an immediate overview of the building site progress.
4. The Baseline to Measure Against
There are two possibilities to design the baseline in the time-% of physical progress chart, to compare the actual status to: a baseline build by planned values according to the project schedule, and an ideal baseline built with same characteristics in all projects and referring to historic data from well managed projects in the past.
4.1. Planned Baseline
The planned baseline is simply obtained by indicating, step by step, the value of each KPI according to the project plan. It can be created for the whole project since the beginning by inserting the planned value of each KPI for each cut-off date (e.g. nr of main signals or meters of track laid planned to be installed at a certain date).
This kind of baseline must be built for each project and required some effort to be built, and some effort to be updated in case of the baseline is changed during the project execution.
4.2. Ideal Baseline
In this case, the baseline is automatically drawn when the duration of the construction activities is defined.
It has been developed a historic research on the physical progress of project considered successful, and defined that, for example, after the 30% of time, the physical progress was 15% etc., and an S-curve has been built which is a function depending on the variable time.
International Journal for Traffic and Transport Engineering, 2013, 3(1): 95 – 102
100
This function is very easy to implement, and does not need to be updated in case, for example, of project time extension.
4.3. ComparisonThe advantages of adopting the “planned baseline” instead of the “ideal baseline” are easy to underline. In fact, the planned baseline:
• Is tailored to each project, so take into account specificities of the planning of the particular situation.
• Allows comparing the actual physical progress of each single KPI, instead in the “ideal baseline” environment where all the KPIs have the same progress grade at a certain moment.
• Is basically more refined and allows a more detailed analysis.
On the other hand, some advantages of the “ideal baseline” can be pointed out:
• It is very easy to implement, it is required no effort by the personnel in developing the baseline, but they are only focused on noticing the actual status of KPIs.
• As a consequence, there is no need for personnel skilled on project management who can understand what a baseline is, but just people able to count how many items have been installed.
The choice between adopting one type of baseline or the other must be made case by case, according to the detail required by the physical progress analysis, the qualification of personnel in site, and the level of effort the company want to allocate for physical progress detection.
5. Visual Management
Implementing a visual management both in the central Construction Department office and in each building site was a clear goal for the project since the beginning.
The information which has been decided to show on each building site office blackboard is:
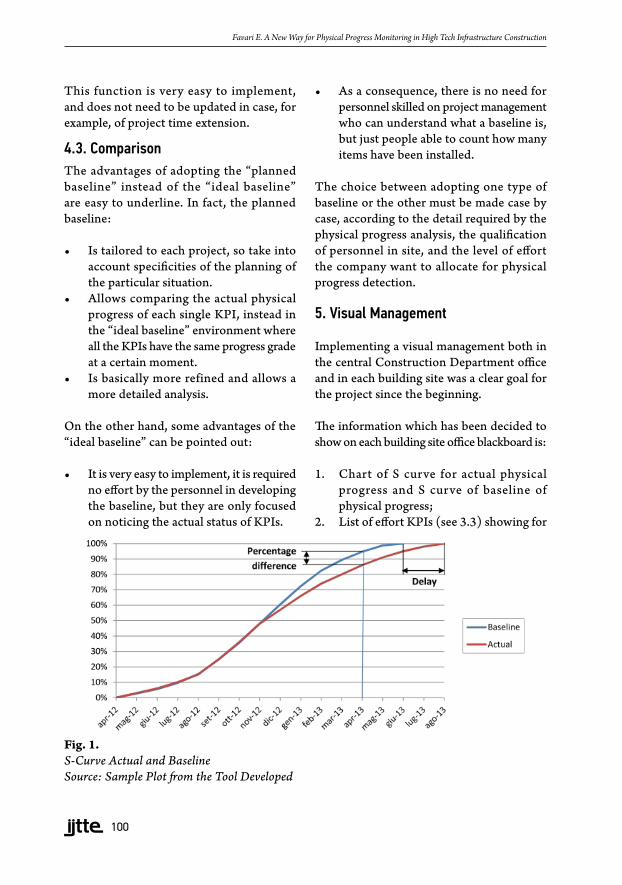
1. Chart of S curve for actual physical progress and S curve of baseline of physical progress;
2. List of effort KPIs (see 3.3) showing for
Fig. 1. S-Curve Actual and Baseline Source: Sample Plot from the Tool Developed
Favari E. A New Way for Physical Progress Monitoring in High Tech Infrastructure Construction
101
each actual physical progress, baselines expected at cut off time, emoticons happy till 2% of delay, neutral between 2 and 5%, sad for more than 5%;
3. Overall physical progress percentage and emoticon happy till 2% of delay, neutral between 2 and 5%, sad for more than 5%;
4. Cost overall KPI / budget and emoticon happy if bigger than overall physical progress percentage, neutral between 0 and 5% bigger than overall physical progress percentage, sad for more than 5%;
5. Quality KPI and an emoticon related to quality goal defined together with the quality department.
All this information is resumed on an A3 format sheet.
Information which have been decided to show on the central Construction Department office blackboard are:
• An A4 format sheet for each opened building site containing only the points 1, 3, 4 and 5 of the list above;
• A geographic map of Italy showing the physical progress percentage in correspondence of each building site position;
• An A3 format sheet containing general performance information in the department.
6. Conclusion
The tool described in this paper represents the first stage of the project of implementing good control practice on the Company’s building sites. Even if this work has been pretty appreciated by top management, the putting into service phase is still to be completed: site managers, who were used to be the only person to know all the information on their building site, are not at their ease in cooperating.
At central level, the fine tuning of indicators is in progress, in particular regarding the weight matrix: sometimes site managers state that the percentage represented by the overall physical progress percentage does not represent the actual situation of the building site. So some adjustment of values in the weight matrix will be required.
Visual management is working pretty well: from the central office is sent by email, monthly, the A3 sheet to each building site manager, and during quality audits the display of the visual management sheet is checked.
Currently it is ongoing the development of indicators able to monitor and control a complete railway building site, starting from the infrastructure and building works up to high tech system putting into service. The same approach has been recently applied, but managing a greater number of indexes is critical for the easy-to-use approach implemented, and the fine tuning of the larger weight matrix, encompassing all KPIs, is a key for having a realistic physical progress percentage.
A problem pointed out at some meetings is the level of so called “granularity” of indicators, that is the quantity of information collected to define the progress index: many site managers are not comfortable with indexes that put together civil works and electric works, for example in the case of the construction of a signal, a team of civil workers have to be considered for building the basement and the mast, and then a team of electrical workers for signals installation, wiring and putting into service: if the indicator is just “nr. of signals” the contribution of the activities performed by the teams is zero until the putting into service of the signal, and this is frustrating site managers that see the progress percentage of their site not increasing even when they are
International Journal for Traffic and Transport Engineering, 2013, 3(1): 95 – 102
102
working a lot. This is an open point the team is currently dealing with.
The topic which is being considered for further development is the definition of forecasts for this system: the classic Schedule Performance Index (SPI) is applicable to this approach, but the Cost Performance Index is currently not, and so a lot of classic EVM forecast indexes.
Finally, the team would like to define a performance index merging cost, quality and time performance, to assess projects in order to better analyze the historical records for return of experience purpose.
Acknowledgements
The author would like to thank Valeria Corsini for the big effort made for the first elaboration and the tuning of indicators, and Stéphane Romei and Giulio Salerno for their trust and support in the project.
References
Bassioni, H.; Price, A.; Hassan, T. 2004. Performance Measurement in Construction, Journal of Management in Engineering. DOI: http://dx.doi.org/10.1061/(ASCE)0742-597X(2004)20:2(42), 20(2): 42-50.
Favari, E. 2012. Reducing Complexity in Urban Infrastructure Projects. Procedia - Social and Behavioral Sciences, SIIV-5th International Congress - Sustainability of Road Infrastructures 2012, Volume 53: 9-5.
Fleming, Q.W.; Koppelman, J.M. 2010. Earned Value Project Management - Fourth Edition, Project Management Institute, ISBN: 9781935589082.
Kaimann, R.A. 1975. Defining the Complexity of a Project Management Network, Project management quarterly, 6(3): 32-34.
Kerzner, H.D.; Sponholtz, J. 2011. Project Management Metrics, KPIs, and Dashboards: A Guide to Measuring and Monitoring Project Performance, John Wiley & Sons, Inc., ISBN: 9781118026526.
VVAA, 2008. Project Management Body of Knowledge (PMBOK® – 4th ed.), Project Management Institute, ISBN: ISBN 9781933890517.
NOVA METODOLOGIJA ZA PRAĆENJE IZGRAĐENOSTI VISOKOTEHNOLOŠKE INFRASTRUKTURE
Edoardo Favari
Sažetak: U radu je predstavljen projekat koji ima za cilj razvoj metodologije za aktivno praćenje izgrađenosti pri sektoru za upravljanje izgradnjom jedne multinacionalne kompanije koja posluje po sistemu ključ u ruke u oblasti projektovanja železničke infrastrukture. U radu je pokazano da upravljanje procesima izgradnje i monitoring u konvencionalnom smislu, zasnovani na upravljanju ostvarenom vrednošću, nisu pogodni za moderne visokotehnološke, tj. složene, projekte izgradnje. Iz tog razloga, u radu je razvijena metodologija za lakše rešavanje problema monitoringa procesa izgrađenosti na nedeljnom nivou. U radu je najpre opisan proces izbora ključnih indikatora performansi (KPI) i definisan je opšti indeks napretka izgrađenosti. Takođe, razmotren je izbor referentnog plana izgradnje i predstavljeni su vizuelni alati za upravljanje projektima koji su primenjeni u radu.
Ključne reči: izgradnja, projekat, upravljanje, napredak izgrađenosti, ključni indikatori performansi (KPI), vizuelni alati.
Favari E. A New Way for Physical Progress Monitoring in High Tech Infrastructure Construction