Embed Size (px)
Citation preview

A new tool for supervised classification of satellite images available on web servers: Google Maps as a case of study
Agustín García-Flores1, Abel Paz-Gallardo2, Antonio Plaza1 and Jun Li3
1Hyperspectral Computing Laboratory, University of Extremadura, Cáceres, SPAIN 2Centro Investigaciones Energéticas, Medioambientales y Tecnológicas (CIEMAT), Trujillo, SPAIN
3Guangdong Provincial Key Laboratory of Urbanization and Geo-simulation, Center of Integrated Geographic Information Analysis, School of Geography and Planning,
Sun Yat-sen University, Guangzhou, CHINA
ABSTRACT
This paper describes a new web platform dedicated to the classification of satellite images called Hypergim. The current implementation of this platform enables users to perform classification of satellite images from any part of the world thanks to the worldwide maps provided by Google Maps. To perform this classification, Hypergim uses unsupervised algorithms like Isodata and K-means. Here, we present an extension of the original platform in which we adapt Hypergim in order to use supervised algorithms to improve the classification results. This involves a significant modification of the user interface, providing the user with a way to obtain samples of classes present in the images to use in the training phase of the classification process. Another main goal of this development is to improve the runtime of the image classification process. To achieve this goal, we use a parallel implementation of the Random Forest classification algorithm. This implementation is a modification of the well-known CURFIL software package. The use of this type of algorithms to perform image classification is widespread today thanks to its precision and ease of training. The actual implementation of Random Forest was developed using CUDA platform, which enables us to exploit the potential of several models of NVIDIA graphics processing units using them to execute general purpose computing tasks as image classification algorithms. As well as CUDA, we use other parallel libraries as Intel Boost, taking advantage of the multithreading capabilities of modern CPUs. To ensure the best possible results, the platform is deployed in a cluster of commodity graphics processing units (GPUs), so that multiple users can use the tool in a concurrent way. The experimental results indicate that this new algorithm widely outperform the previous unsupervised algorithms implemented in Hypergim, both in runtime as well as precision of the actual classification of the images.
Keywords: Remote sensing data processing, satellite/airborne image classification, web-based system, Random Forest, GPGPU.
1. INTRODUCTION Web mapping services have become a key tool for remote sensing image analysis, which previously relied on private and military satellites to obtain satellite imagery. Services as Google Maps can now be used as a powerful source of satellite imagery, providing high-resolution images across the entire world. As a result, efficient classification of satellite image data in large repositories provided by web map services is a very important challenge.
In this paper, we describe a new web-based system dedicated to the classification of satellite imagery from Google Maps. To perform the classification, we have resorted to a modified version of the CURFIL software package [1] and developed an implementation for graphics processing units (GPUs) of the well-known Random Forest [2] (RF) algorithm (accelerated using CUDA from NVIDIA and Boost from Intel).
A previous version of the tool [3] integrated two unsupervised algorithms: ISODATA [4] and K-means [5], but RF is more powerful for classification purposes since it is supervised. As a supervised algorithm, Random Forest have to be trained in some way. We developed a web tool to allow users to train the algorithm, allowing them to label training samples directly on the image data.
Our main goal with the integration of a GPU accelerated version of RF in the newly developed web-based tool is the reduction of the runtime of the classification process. The introduction of the custom version of CURFIL accelerated
Best Student Paper Award
High-Performance Computing in Geoscience and Remote Sensing VI, edited by Bormin Huang, Sebastián López, Zhensen Wu, Jose M. Nascimento, Jun Li, Valeriy V. Strotov, Proc. of SPIE Vol. 10007, 1000702
© 2016 SPIE · CCC code: 0277-786X/16/$18 · doi: 10.1117/12.2240088
Proc. of SPIE Vol. 10007 1000702-1
Downloaded From: http://proceedings.spiedigitallibrary.org/ on 10/27/2016 Terms of Use: http://spiedigitallibrary.org/ss/termsofuse.aspx

using GPU trains random forests up to 50 times faster than a CPU optimized version of the same algorithm, while the prediction phase is almost 18 times faster.
Although the improvement in runtime was the main goal of this development, with the introduction of RF we also achieved an improvement in precision of the classification compared with the unsupervised algorithms included in the previous version of our platform. In all of our test scenarios, the classification accuracy was similar to other implementations of RF in this field [6].
The remainder of this paper is organized as follows. After discussing the architecture of our platform, we introduce our training samples collection system and the developed CURFIL implementation in Sections 3 and 4 respectively. To validate our system, we run a series of tests to validate the results, which we describe in Section 5. Finally, we present our conclusions and future research lines in Section 6.
2. SYSTEM ARCHITECTURE Our web platform is structured following a modular design, which allow us to introduce new features easily. This modular design was achieved with the splitting of the application in several layers or modules, as Fig 1. shows.
From a high level viewpoint, we can categorize our platform in three main modules or layers:
2.1. Server layer
This is the most important layer of our system. In fact, this layer is formed by two different sub-modules: web server and compute server. The web server hosts the source code of our platform, dealing with the incoming traffic coming from the browsers of the clients. We have used Apache as a HTTP web server because of its wide use, free-of-charge license and performance. This layer was developed using technologies as HTML5, PHP, JavaScript and CSS. We have extensively used PHP in the server layer, both for managing the communication between the clients and the web server and between the web server and the compute server.
The compute server is basically in charge of managing the classification process, hosting the classification algorithms. It receives the images and data for the classification from the web server and return the results to the web server once the
Figure 1. Architecture of the system showing the different layers.
Proc. of SPIE Vol. 10007 1000702-2
Downloaded From: http://proceedings.spiedigitallibrary.org/ on 10/27/2016 Terms of Use: http://spiedigitallibrary.org/ss/termsofuse.aspx

o-
process is finished. Our modified version of the CURFIL package is integrated in this sub-module, making use of an NVIDIA GPU to accelerate the classification process. In order to execute the GPU implementation, the GPU must be compatible with Compute Capability 2.0 or higher. Additionally, the use of modern GPUs that support Compute Capability 5.2 will improve the performance of the algorithm.
Both sub-modules can be hosted in the same physical machine or run in different machines, which is particularly interesting if we want to exploit the capabilities of a specialized compute server equipped with GPUs.
2.2. Client layer
This layer allocates the web page that allows the users to interact with our system. To simplify the interaction, the user only needs a single web page to exploit all the functionality of the platform. This is achieved thanks to AJAX, a programming method that reduces the communication between the web browser and the web server, thus alleviating the communication overhead and allowing the user to interact with the interface while the system is processing images.
Figure 2. User interface of the Hypergim platform. The interface is divided in three main components: A toolbar at the top, a map container and a snapshot at the bottom.
Proc. of SPIE Vol. 10007 1000702-3
Downloaded From: http://proceedings.spiedigitallibrary.org/ on 10/27/2016 Terms of Use: http://spiedigitallibrary.org/ss/termsofuse.aspx

O L Lo Lowe LI k ...ft. Meadow MM. Mal. Imago book. 0.o Mob,. Mt
For the development of this layer JavaScript was extensively used, while the design of the interface has been done using jQuery UI. In order to capture the interaction of the users with the interface, we use event handlers included in the jQuery library. Almost all the user actions are executed in the client browser, restricting the communication with the server layer only to those actions related to the processing of the images.
The interface was divided in three main components (see Fig. 2). At the top, we include a toolbar to control all the parameters of the classification algorithms, interact with the map, create new map tabs and snapshots, change the number of classes to classify and the color representation, save the results and so on.
In the middle of the interface is located the container of the map. The user can interact with it using the controls of the toolbar or use the ones integrated in the map itself. Thanks to a system of tabs, we can work with multiple maps in parallel.
Finally, at the bottom we have a canvas for snapshots. A snapshots is a copy of the current state of the map. Users can create as many snapshots as they want. Classification is performed using this snapshots as an input and the results are presented to the user using the same canvas, allowing them to change the colors of the classes and even hiding unwanted classes.
2.3. Map layer
The Map Layer provides access to an image repository (in our case, Google Maps). In our developed tool, we use API v3 of Google Maps to access the full functionality of the service, allowing users to interact with the maps, changing levels of zoom, centering the map to a specific coordinates and so on. Although we are currently using Google Maps as a case of study, the integration of a different map provider as Microsoft will be study in the future.
3. TRAINING SAMPLES COLLECTION SYSTEM As mentioned before, the introduction of a supervised algorithm involved a big change in our platform, which was originally designed for unsupervised algorithms. The biggest challenge has been the inclusion of a way to train the RF classifier by allowing the end-user to label training samples interactively.
Figure 3. Web interface of our platform showing a real-world selection of training samples for the Random Forest algorithm.
Proc. of SPIE Vol. 10007 1000702-4
Downloaded From: http://proceedings.spiedigitallibrary.org/ on 10/27/2016 Terms of Use: http://spiedigitallibrary.org/ss/termsofuse.aspx
For this purpose, we developed a system that allows users to label training samples using a web interface. To label the samples, the user only needs to select an area of the image and the system will draw a geometrical figure according to the selection of the user in real time. The user can use various shapes (including individual points) and label as many samples per class as needed, as we show in Fig. 3. The training system has developed using JavaScript, which is integrated in the Client Layer. The system was developed in a generic way, allowing for the future integration of more supervised algorithms for image classification.
The user can interact with the system using the controls integrated in the toolbar or using keyboard shortcuts. To train a new class, the users only have to press “Enter” or the “Class++” button in the toolbar. If they want to change the selection mode, they should press “Mode++” button or the M key.
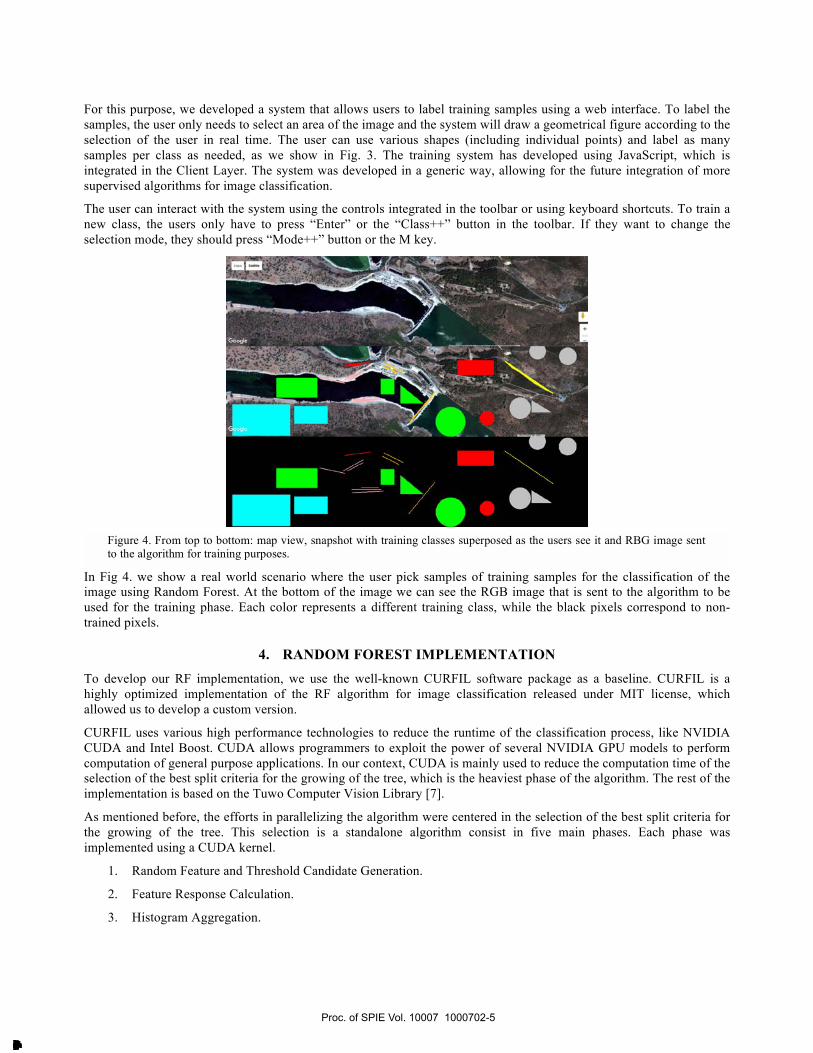
In Fig 4. we show a real world scenario where the user pick samples of training samples for the classification of the image using Random Forest. At the bottom of the image we can see the RGB image that is sent to the algorithm to be used for the training phase. Each color represents a different training class, while the black pixels correspond to non-trained pixels.
4. RANDOM FOREST IMPLEMENTATION To develop our RF implementation, we use the well-known CURFIL software package as a baseline. CURFIL is a highly optimized implementation of the RF algorithm for image classification released under MIT license, which allowed us to develop a custom version.
CURFIL uses various high performance technologies to reduce the runtime of the classification process, like NVIDIA CUDA and Intel Boost. CUDA allows programmers to exploit the power of several NVIDIA GPU models to perform computation of general purpose applications. In our context, CUDA is mainly used to reduce the computation time of the selection of the best split criteria for the growing of the tree, which is the heaviest phase of the algorithm. The rest of the implementation is based on the Tuwo Computer Vision Library [7].
As mentioned before, the efforts in parallelizing the algorithm were centered in the selection of the best split criteria for the growing of the tree. This selection is a standalone algorithm consist in five main phases. Each phase was implemented using a CUDA kernel.
1. Random Feature and Threshold Candidate Generation.
2. Feature Response Calculation.
3. Histogram Aggregation.
Figure 4. From top to bottom: map view, snapshot with training classes superposed as the users see it and RBG image sent to the algorithm for training purposes.
Proc. of SPIE Vol. 10007 1000702-5
Downloaded From: http://proceedings.spiedigitallibrary.org/ on 10/27/2016 Terms of Use: http://spiedigitallibrary.org/ss/termsofuse.aspx

4. Impurity Score Calculation.
5. Undefined Values.
CURFIL can be used as a bash tool or as a C library. In our case, we integrate it in our platform using the bash tools, making simple exec PHP calls and storing the results in the local storage of the compute server. Once the classification process is finished, the results are sent to the web server, which sends them to the client, were finally the web browser rendered them into the web interface.
5. EXPERIMENTAL RESULTS To validate our development, we run a set of tests to substantiate both the improvements in runtime and in classification accuracy. First, in order to validate the runtime benefits of the GPU implementation, we compared it with a CPU implementation of the same algorithm based on the Tuwo Computer Vision Library, but with some optimizations in the management of the cache of the CPU.
Secondly, due of the lack of ground-truth images to compare with the result of the classification, we cannot make a completely accurate measurement of the precision. To obtain an approximate estimation we use the Out of Bag technique, which allows us to obtain an unbiased estimation of the error rate.
In order to test the new capabilities of our platform, we contemplate two real-world scenarios of classification of satellite images from Google Maps. The tests were performed with the system deployed in a test server equipped with a Quad Core Intel i7 920 (2,66 GHz) CPU, 6 GB of RAM and a NVIDIA GTX580. In the future, our platform will be deployed in a cluster of high-end GPUs, improving the performance in a significant way.
In the following we describe both scenarios, analyzing the performance of the algorithm, both in terms of runtime and classification accuracy or precision. In both scenarios, the parameters of the algorithm were carefully tuned aiming at the maximum precision of the classification in detriment of the runtime. This will allow us to have a better picture of the advantage of the GPU solution in the most demanding conditions over the CPU implementation.
Proc. of SPIE Vol. 10007 1000702-6
Downloaded From: http://proceedings.spiedigitallibrary.org/ on 10/27/2016 Terms of Use: http://spiedigitallibrary.org/ss/termsofuse.aspx

K45;+7.4"
r
5.1. Iberian Peninsula.
In our first scenario, we approach the classification of a satellite image of the Iberian Peninsula (see Fig. 5). The resolution of the image is 3000x3000 pixels. There is no size limit for the classification of images in our platform, but with a total of 9 million pixels, this is considered as a big image in this context.
This image is particularly interesting because all the different classes present in it and their complexity. For example, the different kinds of seas, depending on their depth, is a big challenge for the classification algorithms. In this test, we decided to train just 5 different classes, which are the following:
• Desert.
• Deep sea.
• High density forest.
• Low density forest.
• Scrubland.
First, we analyze the accuracy results. As we say before, due to the lack of a ground-truth images, we calculate an estimation of the accuracy using the Out of Bag technique. With this in mind, in this first scenario, we obtained an estimated pixel accuracy of 89,38 %, which is similar to what was achieved with other RF implementations [6].
In one side, the best classification results were achieved in the desert and forests classes, with really high precision classifications. In the other side, the classification of the water was more difficult for the algorithm due to the different colors of the water depending of the depth of the sea. Relaxing the parameters of the algorithm should help with this problem, at the expense of losing general precision of the classification.
From Fig. 6, we can have a look at the visual results of the classification, both the raw result returned by the algorithm and the overlay of the classes over the original image presented to the user in the web interface.
Figure 5. Satellite image of the Iberian Peninsula and their surroundings.
Proc. of SPIE Vol. 10007 1000702-7
Downloaded From: http://proceedings.spiedigitallibrary.org/ on 10/27/2016 Terms of Use: http://spiedigitallibrary.org/ss/termsofuse.aspx

Regarding the speedup obtained by the GPU implementation, it was almost 53 times faster than the CPU implementation, while the prediction process was more than 16 times faster. As we can see in the table below, the training process took significantly more time than the prediction, making the speedup obtained in this phase by the GPU solution even more important to reduce the total time of the classification process.
Table 1. Runtime results for the first scenario.
Execution time (in seconds) GPU Speedup
Training phase GPU 185,87
52,8921 CPU 9831,06
Prediction phase GPU 3,0097
16,3704 CPU 49,2701
Figure 6. From left to right and top to bottom: classification result with the classified classes overlayed, training samples overlayed, raw classification result, training classes sent to the algorithm.
Proc. of SPIE Vol. 10007 1000702-8
Downloaded From: http://proceedings.spiedigitallibrary.org/ on 10/27/2016 Terms of Use: http://spiedigitallibrary.org/ss/termsofuse.aspx

5.2. Manhattan island.
This is the most challenging scenario for our algorithm for various reasons. The first one is the size of image, 4000x4000 pixels, 16 million pixels in total, 77 % more information than the previous scenario. The second one is the complexity of the area of Manhattan (see Fig. 7). Urban areas are quite difficult for image classification algorithms because the dispersion of the classes and their complexity.
In this scenario, we are going to reduce the training samples to the minimum possible to see how the algorithm works which a small set of training samples. Once again, we trained 5 classes, which are the following:
• Water.
• Buildings.
• Residential area.
• Trees.
• Sand.
The precision estimation in the scenario is especially interesting giving the high complexity of the image. In this scenario we achieved an estimated pixel accuracy of 93,3341 %, almost 4 % higher than que first scenario, which is surprising if we consider how much complex is this image. This accuracy is probably the result of better training samples.
After visually analyzing the result (see Fig. 8), we can see that the classes corresponding to buildings, trees and sand appeared good in terms of classification.
Figure 7. Satellite image of Manhattan
Proc. of SPIE Vol. 10007 1000702-9
Downloaded From: http://proceedings.spiedigitallibrary.org/ on 10/27/2016 Terms of Use: http://spiedigitallibrary.org/ss/termsofuse.aspx

With regard to the speedup obtained by the GPU solution, in this scenario the GPU implementation was almost 39 times faster than the CPU implementation in the training phase, while the prediction phase was 18 times faster.
Surprisingly, the speedup in the scenario decrease compared to the previous case, where the speedup was 52. This happens because we are using a fairly old GPU with only 1,5 GB of global memory and we filled this memory with a bigger image. The algorithm is designed in a way that it splits the images in various partitions, filling the memory each time until the whole image is processed. This process takes computational time, increasing the total execution time of the training.
Nevertheless, the whole classification process takes almost 3 hours to complete in the CPU implementation, while the GPU version is able to complete it in 4 minutes. This shows the improvement of the GPU implementation of the Random Forest algorithm with regards to the classic CPU implementation.
Figure 8. From left to right and top to bottom: original image, classes overlayed, training samples, raw classification result.
Proc. of SPIE Vol. 10007 1000702-10
Downloaded From: http://proceedings.spiedigitallibrary.org/ on 10/27/2016 Terms of Use: http://spiedigitallibrary.org/ss/termsofuse.aspx

Table 2 shows the execution times corresponding to this scenario.
Table 2. Runtime results for the second scenario.
Execution time (in seconds) GPU Speedup
Training phase GPU 235,58
38,9786 CPU 9182.58
Prediction phase GPU 5,09133
17,8565 CPU 90,9133
6. CONCLUSIONS AND FUTURE RESEARCH LINES In this paper, we have described a new web system for the classification of satellite imagery using computationally efficient algorithms. This system uses Google Maps as a source of satellite imagery, allowing users to perform the classification of these images using a simple and user-friendly custom designed web interface.
Thanks to the inclusion of a GPU accelerated implementation of the Random Forest classification algorithm, we have reduced the runtime of the classification process by a factor of 50 as compared to classic implementations. We also achieved an improvement in the precision of the classifications as compared to the results obtained with the unsupervised algorithms included in the previous version of our platform.
In the future we plan to continue improving this system, incorporating new features. For example, one of our next steps will be the incorporation of new supervised algorithms for classification of satellite images as Support Vector Machines.
Another interesting improvement could be the optimization of the web interface, working on its performance while working with very big images. We also plan to include new map providers as Bing Maps, expanding the possibilities of the current platform. Taking advantage of really high-performance hardware such as clusters of GPUs could also be important to handle really big images at high spatial resolution.
ACKNOWLEDGEMENTS
This work has been supported by Junta de Extremadura (decreto 297/2014, ayudas para la realización de actividades de investigación y desarrollo tecnológico, de divulgación y de transferencia de conocimiento por los Grupos de Investigación de Extremadura, Ref. GR15005). This work was also supported by the computing facilities of Extremadura Research Centre for Advanced Technologies (CETA-CIEMAT), funded by the European Regional Development Fund (ERDF). CETA-CIEMAT belongs to CIEMAT and the Government of Spain.
REFERENCES
[1] Schulz, H., Waldvogel, B, Sheikh, R. and Behnke, S., “CURFIL: Random Forests for Image Labeling on GPU,” 10th International Conference on Computer Vision, Theory and Applications (VISAPP), Berlin, 2015.
[2] Breiman, L., [Random Forests, Machine Learning], Volume 45, issue 1, 5-32 (2001). [3] Bernabe, S., Plaza, A., Marpu, P. R., Benediktsson, J. A., “A New Parallet Tool for Classification of Remotely
Sensed Imagery,” Computers & Geosciences, vol. 46, 208-212 (2012). [4] Ball, G., Hall, D., “ISODATA: A novel method of data analysis and classification,” Technical Report AD-69916,
Standford University, 1965. [5] Hartigan, J. A., Wong, M. A., [A K-Means Clustering Algorithm], Journal of the Royal Statistical Society, Series C
(Applied Statistics), Vol. 28, No. 1 100-108 (19799 [6] Bosch, A., Zisserman, A., Muñoz X., “Image Classification using Random Forest and Ferns”. [7] Nowozin, S., “Tuwo Computer Vision Library”. http://www.nowozin.net/sebastian/tuwo/ (May 2009).
Proc. of SPIE Vol. 10007 1000702-11
Downloaded From: http://proceedings.spiedigitallibrary.org/ on 10/27/2016 Terms of Use: http://spiedigitallibrary.org/ss/termsofuse.aspx

[8] Plaza, A., Benediktsson, J. A., Brazile, J., Bruzzone, L., Camps-Valls, G., Chanussot, J., Fauvel, M., Gamba, P., Gualtieri, J., Marconcini, M., Tilton, J., Trianni, G., “Spectral and spatial classification of hyperspectral data using svms and morphological profiles,” IEEE Trans. Geosci. Remote Sens., vol. 46, no 11, 3804-3814, 2008.
[9] Plaza, A., Plaza, J., Paz, A., “Parallel heterogeneous CBIR system for efficient hyperspectral image retrieval using spectral mixture analysis,” Concurrency and Computation: Practice and Experience, vol. 22, no. 9, 1138-1159, 2010.
[10] Plaza, A., Chang C., “High Performace Computing in Remote Sensing,” Boca Ratón, FL: Taylor & Francis, 2007. [11] Plaza, A., Valencia, D., Plaza, J., Martinez, P., “Commodity cluster-based parallel processing of hyperspectral
imagery,” J. Parallel and Distributed Computing, vol. 66, no. 3, 345-358, 2006. [12] Plaza, A., Plaza, J., Paz, A., Sanchez, S., “Parallel hyperspectral image and signal processing,” IEE Signal Process
Mag., vol. 28, no. 3, 119-126, 2011. [13] Plaza, A., “Special issue on architectures and techniques for real-time processing of remotely sensed images,” J.
Real-Time Image Process, vol. 4, 191-193, 2009 [14] Wei, S., Huang, B., “GPU acceleration of predictive partitioned vector quantization for ultraspectral sounder data
compression,” IEEE J. Sel. Topics Appl. Earth Observ. Remote Sens., vol. 4, no. 3, 677-682, 2011. [15] Plaza, A., Du, Q., Chang, Y. King, R. L., “Foreword to the special issue on high performance computing in earth
observation and remote sensing,” IEEE J. Sel. Topics Appl. Earth Observ. Remote Sens., vol. 4, no. 3, 503-507, 2011.
[16] Lee, C. A., Gasster, S. D., Plaza, A., Chang, C., Huang, B., “Recent developments in high performance computing for remote sensing: A review,” IEEE J. Sel. Topics Appl. Earth Observ. Remote Sens., vol. 4, no. 3, 508-527, 2011.
Proc. of SPIE Vol. 10007 1000702-12
Downloaded From: http://proceedings.spiedigitallibrary.org/ on 10/27/2016 Terms of Use: http://spiedigitallibrary.org/ss/termsofuse.aspx