Embed Size (px)
Citation preview

Dr. Michael Studer
Partner, Portfolio & Risk Management
Dr. Conradin Kraemer
Portfolio & Risk Management
A New Tool for Private Real Estate Performance Measurement
Partners Group Research Flash July 2012
Partners Group Research Flash July 2012
A New Tool of Private Real Estate Performance Measurement
2
EXECUTIVE SUMMARY
Over the past 20 years, Partners Group’s real estate team has invested over USD 30 billion in
private real estate. Historically, Partners Group has collected and maintained proprietary
industry-wide real estate data for in-house use and research projects. In order to leverage
these insights, in 2010 Partners Group teamed up with Thomson Reuters to develop an index
for private real estate investments.
The Partners Group Thomson Reuters Private Real Estate Index (“PGTR Index”) is a consistent
and high quality database that provides significant value-add for users and the broader
investment community. The data verifies several of the anecdotal claims and observations
about the private real estate asset class.
The data highlights the benefits of the asset class which has outperformed public equity
markets by over 8% since 2000.
Private real estate investments have continued their strong rebound, generating 10.4%
during 2011 despite a challenging economic environment in the second half.
The data suggests that careful selection of managers is even more important in private
real estate compared to private equity, where from 2000-2010 none of the vintage
years shows a negative median IRR.
Investors with a contrarian view, investing into a market with increased uncertainty are
typically rewarded with better performance relative to investments made during a
positive market environment (that typically exhibit higher fundraising). The PGTR data
highlights that vintage years with higher fundraising volume tend to underperform
(“money chasing deals”); a phenomenon already documented for private equity
investments.
Because of the lack of transparency, Partners Group has been conducting an industry
survey among non-core funds since 2001 to establish a broadly available global,
transparent standard for non-core private real estate fund data. In 2010, Partners
Group teamed up with Thomson Reuters, a leading provider of business data and
information.
PGTR Index complements existing databases. The index provides global performance
data based on net cash flows and net asset values for a sample of more than 300
opportunistic and value-added funds from over 60 firms.
PGTR Index provides standard industry performance measures such as IRRs, and time-
weighted returns for user-defined sample selections. Given several aspects of the data
collection, the data is believed to be representative for a “quality index” (i.e. having an
upward bias). At the same time, Partners Group and Thomson Reuters have a joint
vision to further broaden data collection in order to provide a view on the market that is
as unbiased as possible.
Partners Group Research Flash July 2012
A New Tool of Private Real Estate Performance Measurement
3
PRIVATE MARKETS – PRIVATE DATA
It is a common theme in private markets that data is not readily available. In industry surveys,
the lack of adequate data and the absence of longer time series of data are often bemoaned by
a broad range of market participants.1 Even in the most established private markets segment,
private equity, no database has established itself as the clear market leader.2 Decades since
the development of the private equity market, investors and academics still struggle to agree
on the most stable and accurate database. For younger segments of private markets, such as
private real estate, this problem is even more pronounced.
There are various reasons why private markets data is not readily available. A large part of
private markets transactions are not publicized and the final price is only a matter between
buyer and seller. This is often the case when transactions were changing hands in an auction
process where various bidders were involved. Keeping transaction data private is
understandable. At the same time, it is Partners Group’s conviction that in order to better
promote the benefits of private markets, and to allow investors to better assess its
characteristics, more fund-level transparency will be needed going forward.
THE PARTNERS GROUP THOMSON REUTERS PRIVATE REAL ESTATE INDEX
Over the past 20 years3, Partners Group’s real estate team has invested over USD 30 billion in
private real estate. Acknowledging the fact that no reliable data for private real estate
investments was available, the team has been collecting, aggregating and evaluating global
private real estate performance data for over a decade, in order to enhance the understanding
of the asset class on a global basis. In order to further promote the benefits of the asset class
and to share these insights with the broader investment community, Partners Group looked for
a strong partner to leverage its network of industry relationships, while handing the collection,
the technical backbone and the distribution over to a partner focused on providing high quality
financial market information.
To further increase the scope and breadth of the data collected, in 2010 Partners Group
teamed up with Thomson Reuters, a leading provider of business data and information. The
collaboration builds on the strengths of these two groups. Thomson Reuters is responsible for
running periodic surveys using its established processes and experience from 20 years of
private equity data collection; cleaning, aggregating and distributing the data through its
ThomsonOne.com platform. Extending these efforts to the private real estate universe was a
natural step. In addition, it is worth highlighting that Thomson Reuters is a dedicated data
provider and as such strives to provide an unbiased view on the relevant market segments.
Partners Group continues to support the data collection efforts by promoting survey
participation among its network of industry partners. Acknowledging the confidential nature of
individual fund data, the constituents of the database are kept anonymous.
Leveraging the foundation that Partners Group had established through its periodic data
surveys, the Partners Group Thomson Reuters Private Real Estate Index (“PGTR Index”) was
launched in 2010 with an initial sample of 250 opportunistic and value-added funds and has
1 See for example: The IPD Solvency II Review Summary: Informing a new regulatory framework for real estate, April 2011. 2 While Thomson Reuters and Cambridge Associates are the longest established databases, in recent years other market participants have emerged such as Preqin or The Burgiss Group. 3 Partners Group acquired the discretionary real estate asset management business and team of Pension Consulting Alliance, Inc. (“PCA”) on 1 July 2007. PCA was established in 1988.
Partners Group Research Flash July 2012
A New Tool of Private Real Estate Performance Measurement
4
grown as of the end of 2011 to a sample of 300 funds provided by over 60 firms with total
commitments of close to USD 200 billion. Given the industry has raised an estimated USD 650
billion, the PGTR Index currently covers approximately 30% of the market, which is a relative
high market share compared to other alternative data sources.
The PGTR Index is based on fund-level cash flows of opportunistic and value-added funds net
to investors. While the asset class has historically been dominated by North American firms,
the industry has expanded its geographical footprint during the last decade and is considered a
global asset class today.
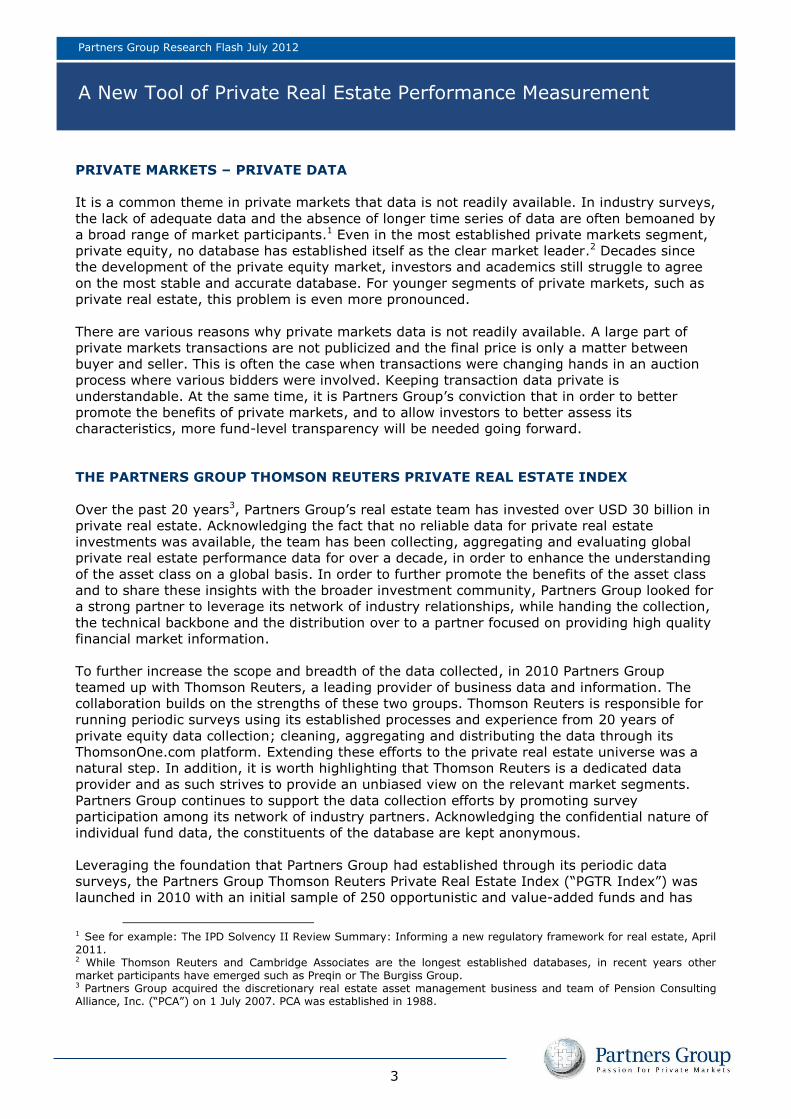
Exhibit 1 shows the PGTR Index’s regional composition with over 35% of the reporting funds
being active outside North America. The data focuses on opportunistic and value-added funds
in terms of value creation strategies. Opportunistic funds currently account for approximately
55% of the sample in terms of number of funds, but since the value creation strategy is self-
reported, caution should be exercised against focusing on the characteristics of any single
value creation strategy. The industry still lacks objective and widely recognized criteria in
determining whether a fund follows an opportunistic or a value-added approach.
One of the main questions the development of the PGTR Index sought to answer is to what
extent the index represents an unbiased picture of an asset class. Given the fact that there is
no performance data for the overall industry, a definitive conclusion is not possible. However,
arguments can be made that the PGTR Index today is still a “quality index” having an upward
bias for four main reasons:
Although constituents are anonymous and samples queried must be sufficiently large to
mask performance of any single fund, sponsors most likely will still tend to rather
report on better performing funds. Given the goal of establishing a leading index for the
private real estate asset class, this bias might diminish over time, with sponsors having
an incentive to report on less successful funds in order not to be measured against an
upward biased database (“reporting bias”).
Investment partners with whom Partners Group has built a relationship over the years
are more likely to contribute to the survey and a significant part of the Index is still
based on the initial sample collected by Partners Group’s real estate team (“selection
bias”).
Exhibit 1: Composition by region and strategy
Source: Partners Group Thomson Reuters Private Real Estate Index, data as of December 31, 2011. Percentage by number of funds.
Americas
64%
Asia-Pacific
16%
Europe
20%
Opportunistic
55%
Value-added
45%
Partners Group Research Flash July 2012
A New Tool of Private Real Estate Performance Measurement
5
There is a number of large funds from the boom era who do not yet provide data to the
survey (“size bias”).
We believe that there is a certain survivorship bias in the data with firms that have
gone out of business due to poor performance not reporting. At the same time, fully
liquidated funds will stay in the index, which reduces a potential survivorship bias.
Promoting participation in the PGTR Index by other investors active in the asset class,
and not just Partners Group, will be necessary to reduce these biases over time.
BEYOND TRADITIONAL BENCHMARKING
Historically, one of the main purposes of private markets data was benchmarking. In order for
a manager to get access to capital, a manager needed to provide evidence that prior programs
were part of the top quartile of the respective peer group. The top-quartile claim has since
been used in an inflationary manner, and this statement has lost some of its credibility among
investors.4 The ability for a manager to make this top-quartile claim is magnified in private real
estate, where no database can claim adequate coverage of the overall industry. At the same
time, further uses of data have emerged. We would want to give two additional applications
where access to quality data is highly relevant.
The first application relates to the use of data in a portfolio and risk management context.
More investors are seeking an answer on the optimal allocation of private markets assets
classes in an overall asset allocation framework. Simultaneously, private markets investments
have gained increasing importance in the portfolios of institutional and private investors.
Therefore, it has become more relevant for investors to quantify their allocations to private
markets segments beyond purely qualitative aspects. Understanding the characteristics of the
private markets data series (such as the significant auto-correlation inherent in the data) is
highly relevant to draw the right conclusions.5 These data series will not only assist in
identifying the appropriate allocation, but with regulation increasing across the globe (with for
example Basle III and Solvency II), reliable data will be necessary to highlight the benefits and
the characteristics of private markets for regulators.6
Second, next to the use of data in a portfolio management context, comparative data also
plays an integral role in the secondary underwriting (i.e. the purchase of portfolios or
individual assets on the secondary market). On top of analyzing and valuing individual assets
in a portfolio, investors active in the secondary market also need to price uncalled capital that
will be deployed in the future. Historical data will allow an assessment of both the quality of
the manager (using “traditional” benchmarking), but also give an indication of the range of
possible outcomes based on the prevailing economic environment.
ALTERNATIVE DATA SOURCES
The PGTR Index provides performance information of global (leveraged) opportunistic and
4 According to a study from Peracs, 77% of private equity funds can claim top-quartile status. Private Equity Online, July 28, 2009. 5 See also “What is the optimal allocation to private equity?”, Partners Group Research Flash March 2011. 6 See also “Private equity under Solvency II: Evidence form time series models”, Partners Group Research Flash September 2011. While private real estate investments are not specifically addressed in the Solvency II frame work, they will most likely fall under the category “Other Equity” together with private equity and asset classes such as hedge funds and commodities. This class is subject to a stress factor of 49% in the specifications for the latest quantitative impact study (see “QIS5 Technical Specifications”, European Commission, July 2010).
Partners Group Research Flash July 2012
A New Tool of Private Real Estate Performance Measurement
6
value-added private real estate fund returns net of fees. We have chosen to focus on net fund
level data because investors base their investment decisions on net returns and net returns are
finally reflected in their portfolios. In order to calculate aggregated performance measures, like
pooled IRRs or time-weighted returns, cash flows and NAVs of the underlying funds are
necessary. Providing only readily computed IRRs and time-weighted returns alone are
insufficient for the computation of meaningful aggregates across several funds. One might also
argue that letting managers calculate their funds’ IRRs and time-weighted returns is less
reliable compared to the PGTR Index where firms report cash flows and NAVs and returns are
calculated independently (i.e. by Thomson Reuters).
The PGTR Index is not the only source for private real estate data. In the US, the National
Council of Real Estate Investment Fiduciary (“NCREIF”) publishes the NCREIF Property Index
(“NPI”). The index is available on Bloomberg and provides property level returns of cash-
flowing US properties gross of any potential management and fund fees. The index thus
reflects unleveraged gross of fee core property returns. Only aggregated total returns on a
quarterly basis are available, either as an overall index or split-up by property type and region.
Methodologically, each property return is weighted by its market value and quarterly returns
are chain-linked to a time-weighted return series. NCREIF also publishes a complement to the
NPI, the open-end diversified core equity fund index “NFI-ODCE.” This index is based on the
investment returns reported by 26 open-end commingled funds pursuing a core investment
strategy.
IPD (“Investment Property Databank”) applies a similar approach as NCREIF with the NPI and
publishes several indices with a global, regional and country-specific focus. The indices report
time-weighted returns which are calculated based on a collection of property-level data and
gross of any fees. Some country data is available in annual frequency only, and so are thus the
aggregates. This provides a major drawback to investors that typically need quarterly (or
higher) frequency data for benchmarking and modeling purposes.
The NCREIF and IPD indices have a focus on core investments and cover a different part of the
real estate investment universe compared to the PGTR Index. Nevertheless, since standard
non-core benchmarks are not available, non-core investors often use core data adjusted by a
given risk premium for benchmarking purposes. Standard capital market theory suggests that
this should be valid, given that non-core and core strategies share the same underlying assets
(i.e. real estate). The considered risk premium accounts for incremental risks through
leverage, leasing risk, development risk, country risk and illiquidity.
The most comparable database to the PGTR Index is the NCREIF Townsend Index
(“NCREIF/Townsend”). The NCREIF Townsend database collects data from open-ended and
closed-ended vehicles across the private real estate universe covering core, value-added and
opportunistic strategies. The database contains about 280 funds in the value-added and
opportunistic space making the index largely comparable in terms of coverage of the industry.
Compared to the PGTR Index, where we collect the actual net cash flows of the underlying
funds, the NCREIF/Townsend collects performance figures directly and reports on IRRs,
multiples and time-weighted returns both on a net basis and on a gross basis. The
NCREIF/Townsend therefore provides an additional layer of insight into the industry by
providing a database of gross returns. At the same time, the fact that performance figures,
instead of underlying cash flows, are collected is a significant drawback compared with the
PGTR Index, as collecting performance figures on a standalone basis does not offer the ability
to generate pooled industry returns. Importantly, NCREIF/Townsend publishes data on USD
denominated funds only. While the majority of programs are predominantly US focused,
investments within North America account for 60% of the allocation in the segment
opportunistic and essentially 100% within core and value-added strategies. Therefore, the
Partners Group Research Flash July 2012
A New Tool of Private Real Estate Performance Measurement
7
NCREIF/Townsend does not adequately cover international (non-US) markets.
Last but not least, Preqin has gained in importance across the private markets industry in the
last few years. Collecting data based on FOIA7 requests allows Preqin to collect a considerable
amount of performance data. Preqin has recently launched indices for the overall private
equity industry including an index for private real estate investments. At the same time,
heavily relying on FOIA requests makes the database more vulnerable in terms of data quality
as data reported from FOIA investors may have investor specific features (e.g. a UK pension
fund might report the returns of a EUR investment in GBP which can heavily distort investment
performance).
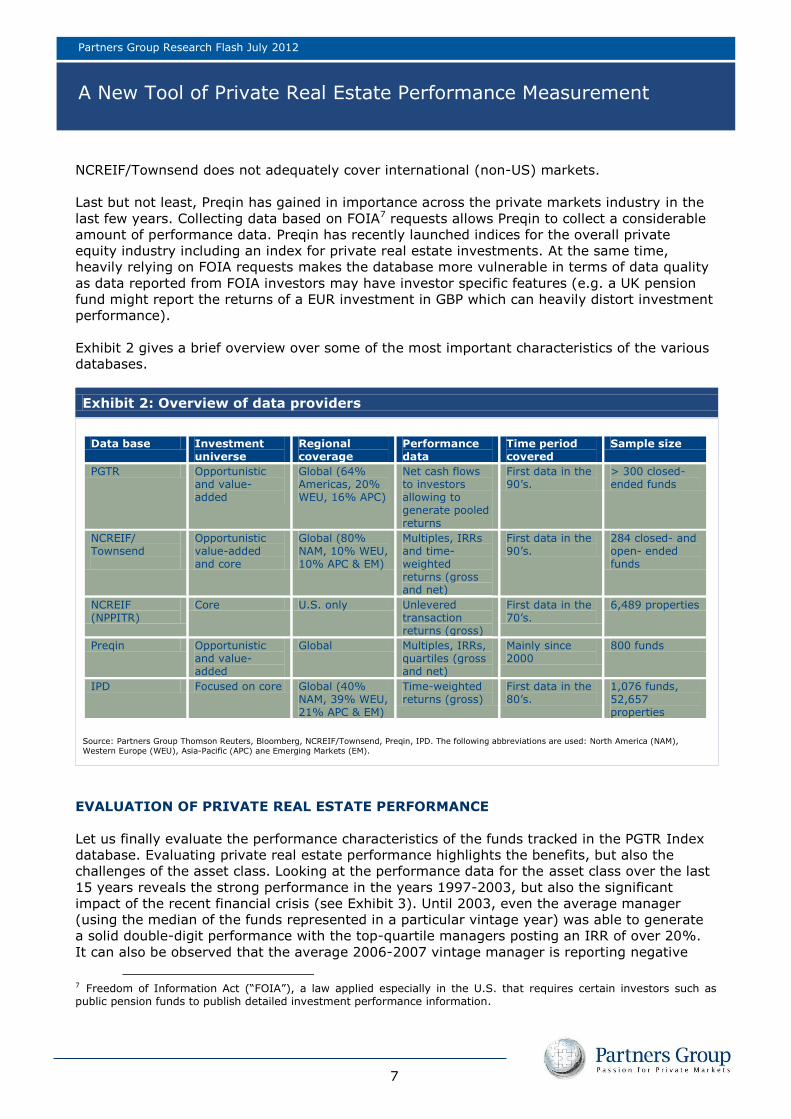
Exhibit 2 gives a brief overview over some of the most important characteristics of the various
databases.
Exhibit 2: Overview of data providers
Data base Investment universe
Regional coverage
Performance data
Time period covered
Sample size
PGTR Opportunistic and value-added
Global (64% Americas, 20% WEU, 16% APC)
Net cash flows to investors allowing to generate pooled returns
First data in the 90’s.
> 300 closed-ended funds
NCREIF/ Townsend
Opportunistic value-added and core
Global (80% NAM, 10% WEU, 10% APC & EM)
Multiples, IRRs and time-weighted returns (gross and net)
First data in the 90’s.
284 closed- and open- ended funds
NCREIF (NPPITR)
Core U.S. only Unlevered transaction returns (gross)
First data in the 70’s.
6,489 properties
Preqin Opportunistic and value-added
Global Multiples, IRRs, quartiles (gross and net)
Mainly since 2000
800 funds
IPD Focused on core Global (40% NAM, 39% WEU, 21% APC & EM)
Time-weighted returns (gross)
First data in the 80’s.
1,076 funds, 52,657 properties
Source: Partners Group Thomson Reuters, Bloomberg, NCREIF/Townsend, Preqin, IPD. The following abbreviations are used: North America (NAM),
Western Europe (WEU), Asia-Pacific (APC) ane Emerging Markets (EM).
EVALUATION OF PRIVATE REAL ESTATE PERFORMANCE
Let us finally evaluate the performance characteristics of the funds tracked in the PGTR Index
database. Evaluating private real estate performance highlights the benefits, but also the
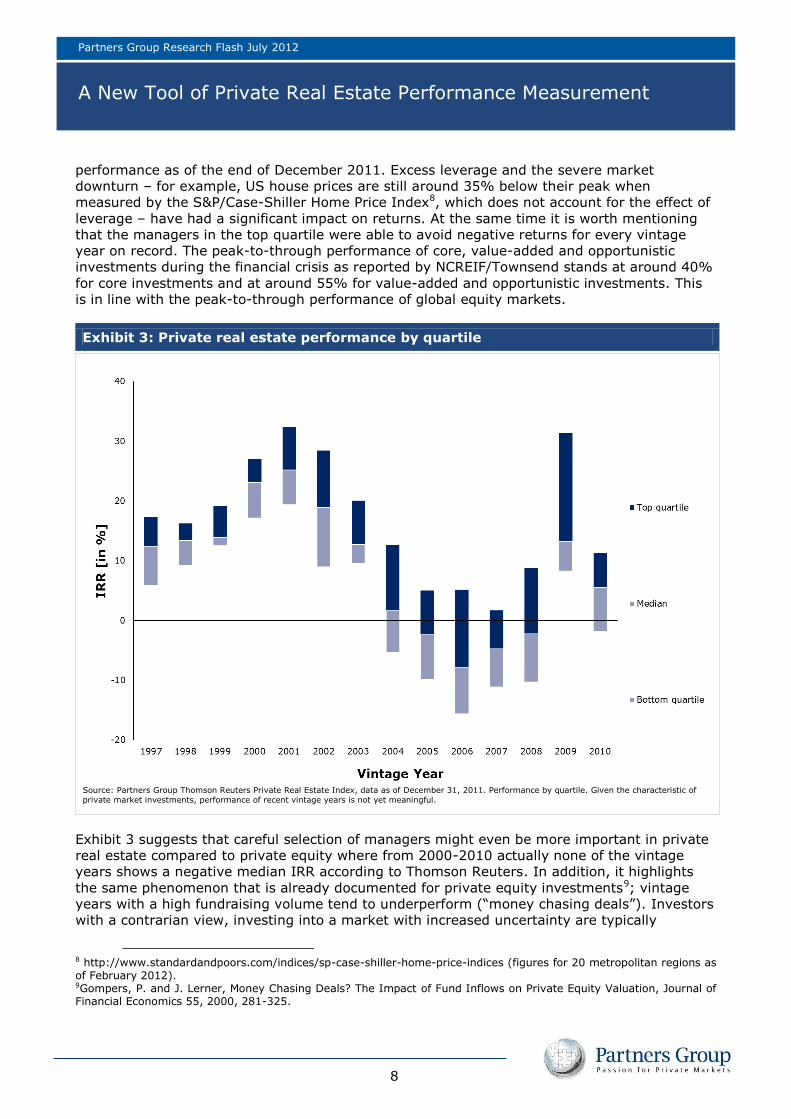
challenges of the asset class. Looking at the performance data for the asset class over the last
15 years reveals the strong performance in the years 1997-2003, but also the significant
impact of the recent financial crisis (see Exhibit 3). Until 2003, even the average manager
(using the median of the funds represented in a particular vintage year) was able to generate
a solid double-digit performance with the top-quartile managers posting an IRR of over 20%.
It can also be observed that the average 2006-2007 vintage manager is reporting negative
7 Freedom of Information Act (“FOIA”), a law applied especially in the U.S. that requires certain investors such as public pension funds to publish detailed investment performance information.
Partners Group Research Flash July 2012
A New Tool of Private Real Estate Performance Measurement
8
performance as of the end of December 2011. Excess leverage and the severe market
downturn – for example, US house prices are still around 35% below their peak when
measured by the S&P/Case-Shiller Home Price Index8, which does not account for the effect of
leverage – have had a significant impact on returns. At the same time it is worth mentioning
that the managers in the top quartile were able to avoid negative returns for every vintage
year on record. The peak-to-through performance of core, value-added and opportunistic
investments during the financial crisis as reported by NCREIF/Townsend stands at around 40%
for core investments and at around 55% for value-added and opportunistic investments. This
is in line with the peak-to-through performance of global equity markets.
Exhibit 3: Private real estate performance by quartile
Source: Partners Group Thomson Reuters Private Real Estate Index, data as of December 31, 2011. Performance by quartile. Given the characteristic of
private market investments, performance of recent vintage years is not yet meaningful.
Exhibit 3 suggests that careful selection of managers might even be more important in private
real estate compared to private equity where from 2000-2010 actually none of the vintage
years shows a negative median IRR according to Thomson Reuters. In addition, it highlights
the same phenomenon that is already documented for private equity investments9; vintage
years with a high fundraising volume tend to underperform (“money chasing deals”). Investors
with a contrarian view, investing into a market with increased uncertainty are typically
8 http://www.standardandpoors.com/indices/sp-case-shiller-home-price-indices (figures for 20 metropolitan regions as of February 2012). 9Gompers, P. and J. Lerner, Money Chasing Deals? The Impact of Fund Inflows on Private Equity Valuation, Journal of Financial Economics 55, 2000, 281-325.
Partners Group Research Flash July 2012
A New Tool of Private Real Estate Performance Measurement
9
rewarded with better performance relative to investments made during a positive market
environment (that typically exhibit higher fundraising).
However, private real estate investments should not only be judged in absolute terms. An
important characteristic to understand is how these investments have performed relative to
other asset classes, other market segments and whether they have added diversification
benefits.
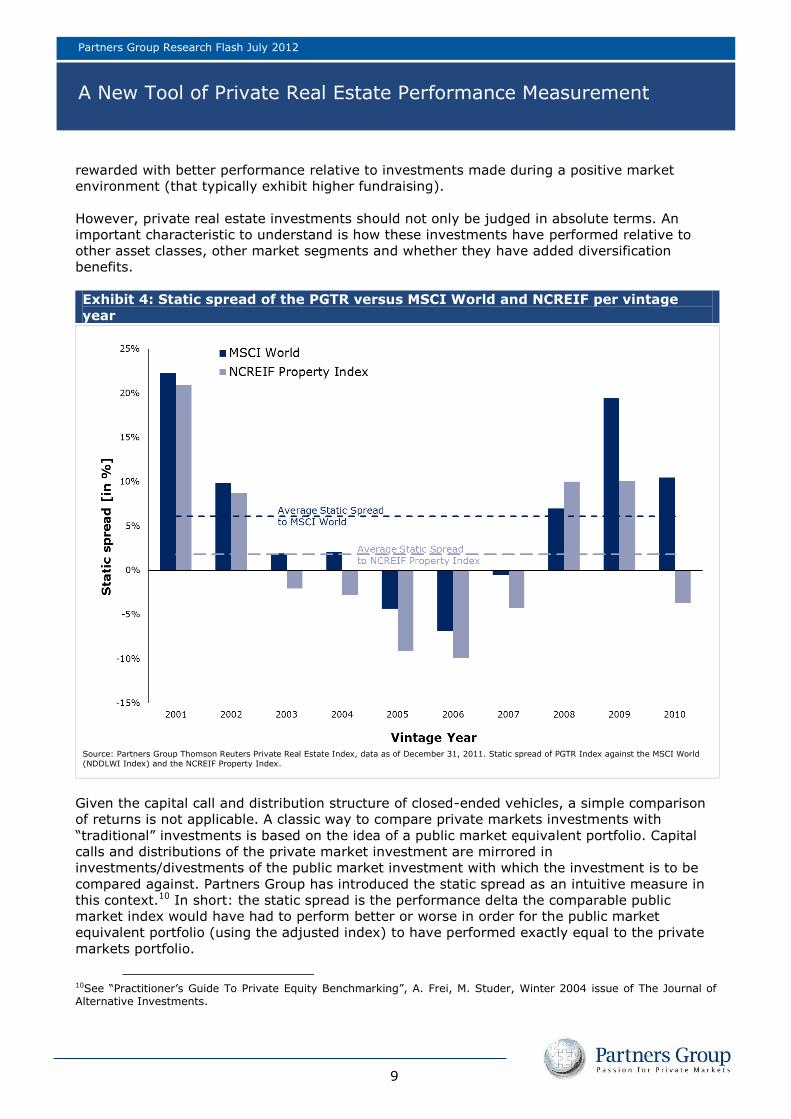
Exhibit 4: Static spread of the PGTR versus MSCI World and NCREIF per vintage
year
Source: Partners Group Thomson Reuters Private Real Estate Index, data as of December 31, 2011. Static spread of PGTR Index against the MSCI World
(NDDLWI Index) and the NCREIF Property Index.
Given the capital call and distribution structure of closed-ended vehicles, a simple comparison
of returns is not applicable. A classic way to compare private markets investments with
“traditional” investments is based on the idea of a public market equivalent portfolio. Capital
calls and distributions of the private market investment are mirrored in
investments/divestments of the public market investment with which the investment is to be
compared against. Partners Group has introduced the static spread as an intuitive measure in
this context.10 In short: the static spread is the performance delta the comparable public
market index would have had to perform better or worse in order for the public market
equivalent portfolio (using the adjusted index) to have performed exactly equal to the private
markets portfolio.
10See “Practitioner’s Guide To Private Equity Benchmarking”, A. Frei, M. Studer, Winter 2004 issue of The Journal of Alternative Investments.

Partners Group Research Flash July 2012
A New Tool of Private Real Estate Performance Measurement
10
An analysis of the static spread of private real estate investments compared to public equity
markets and core investments reveals that the pool of private real estate investments was able
to outperform both public stocks and core investments by an average of 200-500 basis points
for the vintage years 2001-2010. However, it also shows that funds raised in 2005-2007 have
not only underperformed in absolute terms (posting negative IRRs to date), but also have
underperformed stocks and core investments in relative terms.
Looking at the time-weighted returns11 achieved by private real estate investments from 1
January 2000 through 31 December 2011 (7.70% p.a.) reveals an outperformance compared
to stocks (-0.73% p.a. over the same time period), indicating that investors who invested
across the cycle fared better with their investments in private real estate12 relative to public
stocks.
PARTNERS GROUP THOMSON REUTERS PRIVATE REAL ESTATE INDEX - CONCLUSION
Analyzing the (quantitative) characteristics of various private market segments will gain
increasing importance in the future as investors continue to allocate to private markets
investments. The PGTR Index provides an additional tool for performance measurement of
private real estate. In order to make the database a leading provider of high quality data for
this asset class, Partners Group, in collaboration Thomson Reuters, will strive to further
broaden the sample covered by the PGTR Index. The intention is that the index will serve as a
complement to the core data that has been available from databases such as NCREIF and IPD,
and adds pooled performance figures of the asset class.
The data suggests that careful selection of managers might be even more critical in private
real estate compared to private equity; where between 2000-2010 no vintage year generated
a negative median IRR according to Thomson Reuters. Investors with a contrarian view,
investing into a market with increased uncertainty are typically rewarded with better
performance relative to investments made during a positive market environment (that typically
exhibit higher fundraising). The present data provides further evidence of the weak
performance of the funds launched shortly before the financial crisis. However, it also
highlights the benefits of the asset class, having outperformed public equity markets by over
8% since 2000. Thus, current data supports the notion that implementing a disciplined global
relative value investment approach in private real estate markets can deliver attractive risk-
adjusted returns.
11Time-weighted returns for the PGTR Index are calculated by generating a quarterly return using the change in NAV over a quarter adjusted for cash flows of the funds reporting. 12It must be noted however that the observation period is comparably short.
Partners Group Research Flash July 2012
A New Tool of Private Real Estate Performance Measurement
11
Client contact:
Kathrin Schulthess
Investment Solutions
Phone: +41 41 784 65 81
Email: [email protected]
Media relations contact:
Dr. Anna Hollmann
Phone: +41 41 784 63 72
E-mail: [email protected]
www.partnersgroup.com
ZUG | SAN FRANCISCO | NEW YORK | SAO PAULO | LONDON | GUERNSEY | PARIS | LUXEMBOURG | MUNICH | DUBAI | SINGAPORE | BEIJING | SEOUL | TOKYO | SYDNEY

Partners Group Research Flash July 2012
Disclaimer
12
This material has been prepared solely for purposes of illustration and discussion. Under no circumstances should the information contained herein be used or considered as an offer to sell, or solicitation of an offer to buy any security. Any security offering is subject to certain investor eligibility criteria as detailed in the applicable offering documents. The information contained herein is confidential and may not be reproduced or circulated in whole or in part. The information is in summary form for convenience of presentation, it is not complete and it should not be relied upon as such.
All information, including performance information, has been prepared in good faith; however Partners Group makes no representation or warranty express or implied, as to the accuracy or completeness of the information, and nothing herein shall be relied upon as a promise or representation as to past or future performance. This material may include information that is based, in part or in full, on hypothetical assumptions, models and/or other analysis of Partners Group (which may not necessarily be described herein), no representation or warranty is made as to the reasonableness of any such assumptions, models or analysis. Any charts which represent the composition of a portfolio of private markets investments serve as guidance only and are not intended to be an assurance of the actual allocation of private markets investments. The information set forth herein was gathered from various sources which Partners Group believes, but does not guarantee, to be reliable. Unless stated otherwise, any opinions expressed herein are current as of the date hereof and are subject to change at any time. All sources which have not been otherwise credited have derived from Partners Group.


![Trends in real estate private equity - EY - United StatesFILE/EY-Trends-in-real-estate-private-equity.pdf · Trends in real estate private equity Introduction >an] q]Yjk Y^l]j l`]](https://img.pdfslide.us/doc/110x75/5aadc84c7f8b9a59658eb8d3/trends-in-real-estate-private-equity-ey-united-fileey-trends-in-real-estate-private-equitypdftrends.jpg)