Embed Size (px)
Citation preview
A new Stata command for computing and graphingpercentile shares
Ben Jann
University of Bern, [email protected]
13th German Stata Users Group MeetingInstitute for Employment Research, Nuremberg, June 26, 2015
Ben Jann (University of Bern) Percentile shares Nuremberg, 26.06.2015 1

5. Die Vermögen – ungleich verteilt ECOPLAN
103
Grafik 5-1: Lorenzkurve des verfügbaren Einkommens pro Äquivalenzperson der Haushalte im Erwerbsprozess (EH) und Reinvermögen der Steuerpflichtigen natürlichen Personen, 1990, 1991, 1997 und 1998 (zu Preisen 2001)
0%
10%
20%
30%
40%
50%
60%
70%
80%
90%
100%
0% 10% 20% 30% 40% 50% 60% 70% 80% 90% 100%
Anteil steuerpflichtige, natürliche Personen / Haushalte im Erwerbsprozess
Ant
eil v
erfü
gbar
es Ä
quiv
alen
zein
kom
men
/ V
erm
ögen
Vermögen 1997Gini-Koef. 0.675
Vermögen 1991Gini-Koef. 0.641
Verfügbares Äquivalenzeinkommen
19901998
Quelle: Einkommens- und Verbrauchserhebung 1990 und 1998, Gesamtschweizerische Vermögensstatistik der natürlichen Personen 1993 (Vermögensbestand 1991) und 1999 (Vermögensbestand 1997), Auswertung Ecoplan.
Lesebeispiel: Vermögen: 90% der steuerpflichtigen, natürlichen Personen besitzen rund 30% (1991) des gesamten Vermögens. Die reichsten 10% besitzen demnach die restlichen 70% des gesamten Vermögens. Verfügbares Äquivalenzeinkommen: Die ärmsten 20% der Haushalte im Erwerbsprozess (gemessen am verfügbaren Äquivalenzeinkommen) erzielen knapp 10% (1990) der gesamten Äquivalenzeinkom-men.
Aufgrund der gesamtschweizerischen Vermögensstatistik der natürlichen Personen ist nicht ersichtlich, wie sich das Vermögen nach Bevölkerungsgruppen verteilt. Gemäss der Studie von Leu/Burri/Priester (1997), die über Daten der Vermögensverteilung aus dem Jahre 1992 verfügt, steigt das Haushaltsvermögen bis zur Altersklasse der 50 bis 59jährigen an, und nimmt dann wieder ab. Innerhalb der Erwerbsgruppen besitzen vor allem die Landwirte ein hohes Haushaltsvermögen. Haushalte mit einer ausländischen Referenzpersonen besitzen nur rund einen Fünftel des Vermögens, den ein Haushalt mit einer Schweizer Referenzper-son besitzt.
(Eco
plan
2004
). http://www.youtube.com/watch?v=slTF_XXoKAQ
. https://www.ted.com/talks/dan_ariely_how_equal_do_we_want_the_world_to_be_you_d_be_surprised
Ben Jann (University of Bern) Percentile shares Nuremberg, 26.06.2015 2

Outline
Motivation
Estimation of percentile shares
The pshare command
Examples using Bern tax data
Ben Jann (University of Bern) Percentile shares Nuremberg, 26.06.2015 3

Estimation of percentile shares
Outcome variable of interest, e.g. income: Y
Distribution function: F (y) = Pr{Y ≤ y}Quantile function: Q(p) = F−1(p) = inf{y |F (y) ≥ p}, p ∈ [0, 1]
Lorenz ordinates:
L(p) =∫ Qp
−∞y dF (y)
/∫ ∞−∞
y dF (y)
Finite population form:
L(p) =N∑
i=1
Yi I{Yi ≤ Qp}
/N∑
i=1
Yi
Ben Jann (University of Bern) Percentile shares Nuremberg, 26.06.2015 4

Estimation of percentile shares
Percentile share: proportion of total outcome within quantile interval[Qp1 ,Qp2 ], p1 ≤ p2
S(p1, p2) = L(p2)− L(p1)
Percentile share “density”:
D(p1, p2) =S(p1, p2)
p2 − p1=
L(p2)− L(p1)
p2 − p1
Ben Jann (University of Bern) Percentile shares Nuremberg, 26.06.2015 5

Estimation of percentile shares
Estimation given sample of size n:
Sn(p1, p2) = Ln(p2)− Ln(p1)
Ln(p) = (1− γ)Yj + γYj+1 where pj ≤ p < pj+1 with pj =jn
Yj =
j∑i=1
Y(i)
/n∑
i=1
Yi where Y(i) refers to ordered values
γ =p − pj
pj+1 − pj(linear interpolation)
Standard errorsI using estimating equations approach as proposed by Binder andKovacevic (1995)
I supports complex survey data
Ben Jann (University of Bern) Percentile shares Nuremberg, 26.06.2015 6

The pshare command
pshare estimateI estimates the percentile shares and their variance matrixI arbitrary cutoffs for the percentile groupsI joint estimation across multiple outcome variables or subpopulationsI shares as proportions, densities, totals, or averagesI etc.
pshare contrastI computes contrasts between outcome variables or subpopulationsI differences, ratios, or log ratios
pshare stackI displays percentile shares as stacked bar
pshare histogramI displays percentile shares as histogram
Ben Jann (University of Bern) Percentile shares Nuremberg, 26.06.2015 7

Examples
. use taxdata(Some tax data)
. describe
Contains data from taxdata.dtaobs: 119,939 Some tax data
vars: 3 27 Jun 2015 23:49size: 1,079,451
storage display valuevariable name type format label variable label
agecat byte %9.0g agecat Age groupincome float %9.0g Total incomewealth float %9.0g Net wealth
Sorted by:
. help pshare
Ben Jann (University of Bern) Percentile shares Nuremberg, 26.06.2015 8

Quintile shares (the default)
. pshare estimate income
Percentile shares (proportion) Number of obs = 119,939
income Coef. Std. Err. t P>|t| [95% Conf. Interval]
0-20 .029269 .0002685 109.02 0.000 .0287428 .029795220-40 .1048592 .0004634 226.30 0.000 .103951 .105767440-60 .1645584 .0006001 274.24 0.000 .1633823 .165734560-80 .2365146 .0008311 284.59 0.000 .2348856 .238143580-100 .4647989 .0018814 247.05 0.000 .4611113 .4684864
Interpretation: The top 20% percent of the population get 46.5% of allincome; the bottom 20% only get 2.9% of all income etc.
Ben Jann (University of Bern) Percentile shares Nuremberg, 26.06.2015 9

Decile shares
. pshare estimate income, nquantiles(10)
Percentile shares (proportion) Number of obs = 119,939
income Coef. Std. Err. t P>|t| [95% Conf. Interval]
0-10 .0045258 .0000935 48.42 0.000 .0043426 .00470910-20 .0247432 .0001932 128.07 0.000 .0243645 .025121920-30 .0435825 .0002279 191.23 0.000 .0431359 .044029230-40 .0612766 .0002527 242.45 0.000 .0607812 .06177240-50 .0752199 .0002815 267.19 0.000 .0746681 .075771750-60 .0893385 .0003267 273.48 0.000 .0886982 .089978860-70 .1065221 .0003835 277.74 0.000 .1057704 .107273970-80 .1299924 .0004627 280.95 0.000 .1290855 .130899380-90 .1654318 .0005818 284.32 0.000 .1642914 .166572290-100 .2993671 .0023598 126.86 0.000 .2947419 .3039922
Ben Jann (University of Bern) Percentile shares Nuremberg, 26.06.2015 10

Bottom 50%, Mid 40%, and Top 10%
. pshare estimate income wealth, percentiles(50 90)
Percentile shares (proportion) Number of obs = 119,939
Coef. Std. Err. t P>|t| [95% Conf. Interval]
income0-50 .2093481 .0008937 234.24 0.000 .2075964 .211099850-90 .4912848 .0016618 295.64 0.000 .4880278 .494541990-100 .2993671 .0023598 126.86 0.000 .2947419 .3039922
wealth0-50 -.0237426 .0010954 -21.67 0.000 -.0258896 -.021595650-90 .3042619 .0062104 48.99 0.000 .2920896 .316434390-100 .7194807 .0057992 124.07 0.000 .7081143 .730847
Ben Jann (University of Bern) Percentile shares Nuremberg, 26.06.2015 11

Stacked bars plot
. generate wealth0 = cond(wealth<0, 0, wealth)
. label variable wealth0 "Wealth (positive)"
. pshare estimate income wealth0, percentiles(50 90) percent
Percentile shares (percent) Number of obs = 119,939
Coef. Std. Err. t P>|t| [95% Conf. Interval]
income0-50 20.93481 .0893717 234.24 0.000 20.75964 21.1099850-90 49.12848 .1661772 295.64 0.000 48.80278 49.4541990-100 29.93671 .2359796 126.86 0.000 29.47419 30.39922
wealth00-50 1.314179 .029754 44.17 0.000 1.255862 1.37249650-90 29.32997 .5773461 50.80 0.000 28.19838 30.4615690-100 69.35585 .6038125 114.86 0.000 68.17239 70.53931
. pshare stack, plabels("bottom 50%" "mid 40%" "top 10%") ///> values mlabsize(zero) p3(mlabsize(large))
Ben Jann (University of Bern) Percentile shares Nuremberg, 26.06.2015 12

Stacked bars plot
20.9
1.31
49.1
29.3
29.9
69.4
Total income
Wealth (positive)
0 20 40 60 80 100outcome share (percent)
bottom 50% mid 40% top 10%
Ben Jann (University of Bern) Percentile shares Nuremberg, 26.06.2015 13

Histogram of densities
. pshare estimate wealth, p(1 5 10(10)90 95 99) density
Percentile shares (density) Number of obs = 119,939
wealth Coef. Std. Err. t P>|t| [95% Conf. Interval]
0-1 -1.740562 .0843581 -20.63 0.000 -1.905903 -1.5752221-5 -.3963251 .0106253 -37.30 0.000 -.4171505 -.3754998
5-10 -.0789102 .0027628 -28.56 0.000 -.0843253 -.073495110-20 -.0017146 .0001861 -9.21 0.000 -.0020794 -.001349720-30 .0062028 .0002404 25.80 0.000 .0057316 .006674130-40 .0363781 .0008941 40.69 0.000 .0346257 .038130640-50 .0937488 .002118 44.26 0.000 .0895975 .097950-60 .2023709 .0044304 45.68 0.000 .1936873 .211054460-70 .4100251 .0087438 46.89 0.000 .3928874 .427162870-80 .811196 .0168879 48.03 0.000 .778096 .844296180-90 1.619027 .0328938 49.22 0.000 1.554556 1.68349990-95 2.951972 .0589668 50.06 0.000 2.836398 3.06754695-99 5.990715 .114097 52.51 0.000 5.767087 6.21434499-100 33.22535 1.281602 25.92 0.000 30.71343 35.73727
. pshare histogram, yline(1) ylabel(0(5)35, angle(hor)) ti(Wealth distribution)
Ben Jann (University of Bern) Percentile shares Nuremberg, 26.06.2015 14

Histogram of densities
0
5
10
15
20
25
30
35
outc
ome
shar
e (d
ensi
ty)
0 20 40 60 80 100population percentage
outcome share 95% CI
Wealth distribution
Ben Jann (University of Bern) Percentile shares Nuremberg, 26.06.2015 15

Histogram of densities
InterpretationI Take 100 dollars and divide them among 100 people who line up alongthe x-axis.
I The heights of the bars shows you how much each one gets.I If all get the same, then everyone would get one dollar (red line).I However, according to the observed distribution, the rightmost person(i.e. the richest) would get 33 (!) of the 100 dollars, the next fourwould get 6 dollar each, and so on.
I At the bottom, there are also some people you would have to takeaway some money (e.g., you would have to take away 1.74 dollarsfrom the rightmost person).
Ben Jann (University of Bern) Percentile shares Nuremberg, 26.06.2015 16

Using spikes and group-specific styles. pshare hist, yline(1) ylabel(0(5)35, angle(hor)) ti(Wealth distribution) ///> spikes(100) lw(*3) psep legend(off)
0
5
10
15
20
25
30
35
outc
ome
shar
e (d
ensi
ty)
0 20 40 60 80 100population percentage
Wealth distribution
Ben Jann (University of Bern) Percentile shares Nuremberg, 26.06.2015 17
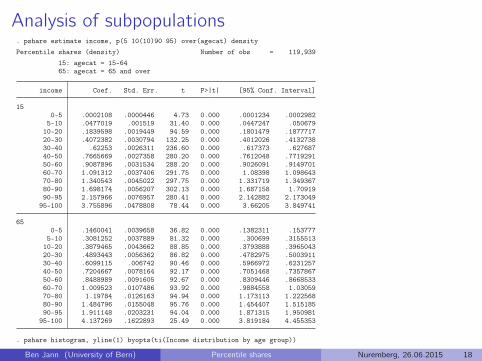
Analysis of subpopulations. pshare estimate income, p(5 10(10)90 95) over(agecat) density
Percentile shares (density) Number of obs = 119,939
15: agecat = 15-6465: agecat = 65 and over
income Coef. Std. Err. t P>|t| [95% Conf. Interval]
150-5 .0002108 .0000446 4.73 0.000 .0001234 .0002982
5-10 .0477019 .001519 31.40 0.000 .0447247 .05067910-20 .1839598 .0019449 94.59 0.000 .1801479 .187771720-30 .4072382 .0030794 132.25 0.000 .4012026 .413273830-40 .62253 .0026311 236.60 0.000 .617373 .62768740-50 .7665669 .0027358 280.20 0.000 .7612048 .771929150-60 .9087896 .0031534 288.20 0.000 .9026091 .914970160-70 1.091312 .0037406 291.75 0.000 1.08398 1.09864370-80 1.340543 .0045022 297.75 0.000 1.331719 1.34936780-90 1.698174 .0056207 302.13 0.000 1.687158 1.7091990-95 2.157966 .0076957 280.41 0.000 2.142882 2.17304995-100 3.755896 .0478808 78.44 0.000 3.66205 3.849741
650-5 .1460041 .0039658 36.82 0.000 .1382311 .153777
5-10 .3081252 .0037889 81.32 0.000 .300699 .315551310-20 .3879465 .0043662 88.85 0.000 .3793888 .396504320-30 .4893443 .0056362 86.82 0.000 .4782975 .500391130-40 .6099115 .006742 90.46 0.000 .5966972 .623125740-50 .7204667 .0078164 92.17 0.000 .7051468 .735786750-60 .8488989 .0091605 92.67 0.000 .8309446 .866853360-70 1.009523 .0107486 93.92 0.000 .9884558 1.0305970-80 1.19784 .0126163 94.94 0.000 1.173113 1.22256880-90 1.484796 .0155048 95.76 0.000 1.454407 1.51518590-95 1.911148 .0203231 94.04 0.000 1.871315 1.95098195-100 4.137269 .1622893 25.49 0.000 3.819184 4.455353
. pshare histogram, yline(1) byopts(ti(Income distribution by age group))
Ben Jann (University of Bern) Percentile shares Nuremberg, 26.06.2015 18

Analysis of subpopulations
01
23
4
0 50 100 0 50 100
15-64 65 and over
outcome share 95% CI
outc
ome
shar
e (d
ensi
ty)
population percentage
Income distribution by age group
Ben Jann (University of Bern) Percentile shares Nuremberg, 26.06.2015 19

Subpopulation contrasts
. pshare contrast
Differences in percentile shares (density) Number of obs = 119,939
15: agecat = 15-6465: agecat = 65 and over
income Coef. Std. Err. t P>|t| [95% Conf. Interval]
650-5 .1457933 .0039661 36.76 0.000 .1380198 .1535667
5-10 .2604233 .004082 63.80 0.000 .2524226 .26842410-20 .2039867 .0047798 42.68 0.000 .1946184 .21335520-30 .0821061 .0064225 12.78 0.000 .069518 .094694130-40 -.0126185 .0072372 -1.74 0.081 -.0268034 .001566440-50 -.0461002 .0082813 -5.57 0.000 -.0623314 -.02986950-60 -.0598907 .009688 -6.18 0.000 -.078879 -.040902360-70 -.0817888 .0113809 -7.19 0.000 -.1040952 -.059482470-80 -.1427025 .0133956 -10.65 0.000 -.1689575 -.116447480-90 -.213378 .0164921 -12.94 0.000 -.2457023 -.181053790-95 -.2468179 .0217313 -11.36 0.000 -.2894109 -.204224895-100 .3813731 .1692052 2.25 0.024 .0497337 .7130125
(contrasts with respect to preceding subpopulation)
. pshare hist, yline(0) ti(Difference in income distribution by age group)
Ben Jann (University of Bern) Percentile shares Nuremberg, 26.06.2015 20

Subpopulation contrasts
-.20
.2.4
.6.8
diffe
renc
e in
out
com
e sh
ares
(den
sity
)
0 20 40 60 80 100population percentage
difference in outcome shares 95% CI
Difference in income distribution by age group
Ben Jann (University of Bern) Percentile shares Nuremberg, 26.06.2015 21

Bivariate analysis: Wealth by income group
. pshare estimate wealth, p(10(10)90 95) pvar(income) density
Percentile shares (density) Number of obs = 119,939
wealth Coef. Std. Err. t P>|t| [95% Conf. Interval]
0-10 .094965 .0071814 13.22 0.000 .0808896 .109040310-20 .2175728 .0074677 29.14 0.000 .2029363 .232209320-30 .506814 .0192759 26.29 0.000 .4690335 .544594530-40 .5747378 .0238753 24.07 0.000 .5279426 .62153340-50 .5637113 .0153038 36.83 0.000 .5337161 .593706650-60 .6399473 .0169505 37.75 0.000 .6067245 .6731760-70 .8189444 .0215458 38.01 0.000 .776715 .861173770-80 1.029533 .0352054 29.24 0.000 .9605311 1.09853580-90 1.213529 .0341494 35.54 0.000 1.146597 1.28046190-95 1.75912 .0751482 23.41 0.000 1.611831 1.90640995-100 6.921371 .2682702 25.80 0.000 6.395566 7.447176
(percentile groups by order of income)
. pshare histogram, yline(1)
The results show that the top income households are also the onesamong which most of the wealth is accumulated.
Ben Jann (University of Bern) Percentile shares Nuremberg, 26.06.2015 22

Bivariate analysis: Wealth by income group
02
46
8ou
tcom
e sh
are
(den
sity
)
0 20 40 60 80 100population percentage (ordered by income)
outcome share 95% CI
Ben Jann (University of Bern) Percentile shares Nuremberg, 26.06.2015 23

ProblemsPercentile shares are affected by small sample bias.
The top percentile share is typically underestimated. This is becausefor unbound variables there is always some probability mass outsidethe range of the sampled data. A much larger outcome share ismissed at the top than at the bottom.The problem is difficult to fix.I Corrections could be derived based on parametric assumptions.I Smoothing out the data by adding random noise can be an option,but this also requires parametric assumptions.
I In pshare, I implemented non-parametric small-sample correctionusing a bootstrap approach: the bias in bootstrap samples is used toderive correction factors for the main results.
I This works very well in terms of removing bias (unless the distributionis extremely skewed).
I However: MSE increases compared to uncorrected results!I No idea how to improve on this. Therefore, small-sample correction iscurrently not documented.
Ben Jann (University of Bern) Percentile shares Nuremberg, 26.06.2015 24

References
Ecoplan (2004). Verteilung des Wohlstands in der Schweiz. Bern:Eidgenössische Steuerverwaltung.
Binder, D. A., M. S. Kovacevic (1995). Estimating Some Measuresof Income Inequality from Survey Data: An Application of theEstimating Equations. Survey Methodology 21(2): 137-145.
Ben Jann (University of Bern) Percentile shares Nuremberg, 26.06.2015 25