Embed Size (px)
DESCRIPTION
Citation preview
1/27
A New Scale Measuring Psychological Impact of Genetic Susceptibility Testing for Alzheimer’s Disease
Winston W. Chung, B.A.1
Clara A. Chen, M.H.S.5
L. Adrienne Cupples, Ph.D.3,4
J. Scott Roberts, Ph.D.6
Susan C. Hiraki, M.S.1
Anil K. Nair, M.D.1
Robert C. Green, M.D., M.P.H.1,2,4
Robert A. Stern, Ph.D.1
Depts. of 1Neurology and 2Medicine (Genetics Program), Boston University School of Medicine Depts. of 3Biostatistics and 4Epidemiology, Boston University School of Public Health5Data Coordinating Center, Boston University School of Public Health6Department of Health Behavior & Health Education, University of Michigan School of Public Health
Short Title: REVEAL Impact of Genetic Testing for AD (IGT-AD)
Corresponding Author: Robert A. Stern, PhDAssociate Professor of NeurologyBoston University School of Medicine715 Albany Street, R-7800, Boston, MA 02118Tel: (617) 638-5678; Fax: (617) 414-1197E-mail: [email protected]
Acknowledgements:This research was supported by NIH grants RO1-HG/AG-02213 (The REVEAL Study), K24-AG027841, RO1-AG09029 (The MIRAGE Study), P30-AG13846 (Boston University Alzheimer’s Disease Core Center), M01-RR00533 (Boston University General Clinical Research Center).
* Manuscript (All Manuscript Text Pages, including Title Page, References and Figure Le...
2/27
Abstract
This paper describes the development and psychometric properties of a new scale
for assessing the psychological impact of genetic susceptibility testing for Alzheimer’s
disease (AD). The new instrument, The REVEAL Impact of Genetic Testing for
Alzheimer’s disease (IGT-AD) was designed to examine the unique nature of genetic
information and the disease course of AD. The scale was tested as a part of a multi-
center clinical trial designed to evaluate the impact of AD risk assessment and data was
collected from 276 participants in the study. Using an iterative process of Principal
Component Analysis and Cronbach’s alpha, the final 16 item IGT-AD was found to have
a two factor structure with excellent internal reliability. Construct validity was
established by patterns of correlation with other standardized self-reported measures.
This scale should be useful in the identification of patients who maybe susceptible to the
negative effects of receiving genetic information, monitoring of patients who have
received genetic information, and as a tool for researchers who wish to study the effects
of genetic susceptibility testing for AD.
Key words: Alzheimer’s disease genetics, genetic testing, Alzheimer’s disease risk
assessment
3/27
Introduction
Alzheimer’s disease (AD) is the most common cause of all the dementing
disorders 1. With the oldest population groups rapidly growing in the United States, the
number of AD patients is expected to triple in the U.S. between 2000 and 2050, from 4.5
million to 13.2 million people with AD 2. The increase in the number of AD patients is a
matter of great concern not only from an individual’s perspective, but also from an
economic and pubic health point of view 3.
Mutations in three genes, amyloid precursor protein (APP), presenilin 1 (PS1),
and presenilin 2 (PS2), have been linked to rare early-onset forms of AD, with symptoms
that usually begin in the 4th or 5th decades. Polymorphisms in a number of other genes, in
particular apolipoprotein E (APOE) and neuronal sortilin-related receptor (SORL1), are
associated with the more common late-onset form of AD 4, 5. APOE and SORL1 are
susceptibility genes that are neither necessary nor sufficient to cause AD. This limitation,
coupled with a general lack of treatment options for AD, has prompted several consensus
statements to caution against the introduction of clinical susceptibility testing of genes in
asymptomatic individuals 6-9. At the same time, the lack of scientific data also prompted
these statements to encourage research on the benefits and limitations of disclosing
genetic susceptibility information. With the growing number of individuals with AD and
the even greater number of older Americans at risk for AD, it is likely that genetic
susceptibility testing will become an important clinical, ethical, and research issue in the
near future.
The REVEAL Study (Risk Evaluation and Education for Alzheimer’s Disease) is
a series of randomized clinical trials designed to evaluate the impact of risk assessment,
including APOE genotype disclosure, for AD. The study protocol was developed by a
4/27
multidisciplinary team of experts in the fields of AD, neurology, genetics, genetic
counseling, psychology, and bioethics, many of whom had previously been involved in
the consensus statements against APOE genetic susceptibility testing. A primary aim of
the REVEAL study was to determine whether AD genetic risk assessment can be
provided safely and effectively to adult children and siblings of AD patients. Thus far,
study results based on established outcome measures such as the Center for
Epidemiologic Studies Depression Scale (CES-D), Beck Anxiety Inventory (BAI), and
Impact of Event Scale (IES) have revealed that, in general, AD genetic risk assessment
can be disclosed safely 10-12.
In a separate but related study that collected qualitative data from select REVEAL
participants approximately eighteen months after their risk assessment disclosure, there
was some anecdotal evidence to suggest that some participants did experience a certain
amount of emotional distress 13. A few participants described their genetic results as
“depressing,” “frightening,” and “disappointing.” This pattern of results has previously
been shown in cancer research, and underscores the possibility that certain psychological
responses to genetic testing may not be fully captured by commonly used scales 14.
Because the CES-D and BAI are general measures of depression and anxiety, and
because the IES was created as a measure of subject distress for any event, these
instruments may not be appropriate for detecting psychological distress in a genetic
testing situation 15-17. And even though the IES has more recently been applied to
assessing the psychological impact of predictive genetic testing (e.g., Huntington’s
disease, and hereditary breast and ovarian cancer), AD may be sufficiently different from
other health conditions to warrant a disease specific approach to measuring the
psychological impact of genetic testing 18, 19.

5/27
A couple of scales have been developed to assess the impact of genetic testing.
One is The Multidimensional Impact of Cancer Risk Assessment (MICRA)
Questionnaire 14. It was published in 2002 as a questionnaire used to assess the impact of
cancer genetic testing with BRCA 1/2 testing as a model. It is a scale that takes into
account special features of genetic testing such as the impact of the results on family
members and relatives. Another available instrument is the PAGIS, or the Psychological
Adaptation to Genetic Information Scale, published in 2005 20. The PAGIS is based on
the conceptual framework of Skirton’s grounded theory of the client’s perspective of
genetic counseling as well as on the Roy Adaptation Model 20. The goal of the scale was
to isolate the impact of genetic testing regardless of the likelihood of the gene causing the
disease. The PAGIS was not developed with a specific disease in mind and it appears
that to date, there are no published reports using the PAGIS.
Still, the scales described above are not disease specific to AD. Thus, the purpose
of the present study was to develop a brief, self-report measure of the psychological
impact of genetic susceptibility tests for AD to be used in both clinical (e.g. genetic
counseling) settings as well as in research on genetic risk disclosure.
6/27
Materials and Methods
Overview of REVEAL II
Because this paper will focus on the development of a new scale using data from
the second REVEAL trial (REVEAL II), a brief description of the REVEAL II protocol
will be given here. Additional descriptions of the clinical trial rationale, design, and
results have been published elsewhere 21.
The primary aim of REVEAL II was to determine whether genetic risk
assessment with APOE disclosure could be safely carried out using a condensed,
clinically feasible protocol. Study participants were either randomized into the control
arm, which featured a comprehensive extended protocol with multiple preparatory visits
with genetic counselors, or the intervention arm, which used a shorter condensed protocol
utilizing an education brochure and supplementary brief genetic counseling sessions.
Participants in both arms of the study were given risk assessments based on their APOE
genotype, age, gender, race, and family history. The impact of learning this information
was tracked for one year with follow-up visits at six weeks, six months, and twelve
months after the disclosure.
Development of the protocol was overseen and approved by a study External
Advisory Board, as well as institutional review boards at each study site.
Participants
All participants were adult children of a person with clinically diagnosed and/or
autopsy-confirmed AD. Of the 437 participants who enrolled in the study, a vast
majority were self-referred. For example, 239 or 55% of the participants volunteered
because they heard about the study from a friend, an advertisement brochure, a
7/27
presentation given by a member of the REVEAL study, or another research study at any
one of the four study sites. An additional 161 or 37% of the participants heard about the
study through the internet, community newsletters, health fairs, other neurologists, or the
Alzheimer’s Association.
There were 280 participants in the study who received their genetic risk
assessment. Of those, 277 responded to the 6 week follow-up questionnaire, and 256
answered the questions necessary for the analysis. The respondents were of a mean age
of 58.0 (S.D.=10.5) with an average of 16.1 (S.D.=2.5) years of education. 71.1% of the
respondents were female, 81.25% were white, and 42.2% received a ε4+ genotype
disclosure.
Preliminary Item Pool
The preliminary item pool for the new instrument consisted of items from a
modification of the original MICRA developed by Cella and colleagues 14. The MICRA
was developed based on their belief that there were “meaningful-but as of yet
unmeasured-personal and family problems and concerns related to the information
transmitted during the [cancer] genetic testing experience.”(p.565) In other words, they
were taking note of the anecdotal evidence on the effects of cancer genetic testing that
were not measured by currently available psychiatric measurements. The same concern
was true in measuring the impact of AD susceptibility genetic testing. A more sensitive
test could capture the situational effects of AD genetic testing as opposed to the more
generalized effects captured by other outcome measures such as BAI or CES-D. Since
MICRA was one of the only validated scales designed specifically to assess the
psychological impact of genetic susceptibility testing for an adult-onset disease, it
8/27
provided a good basis from which to develop an AD specific scale. Furthermore, the
MICRA is unique in that it is also measuring the positives effects stemming from genetic
testing. That is, in addition to items that reflect the degree of anxiety, uncertainty, or
regret experienced by the disclosee, which is common among many scales, the MICRA
has four items that measure degrees of relief, happiness, and satisfaction experienced by
the disclosee.
The original MICRA questionnaire contains three sections, but only one of the
sections (Section 1) is for all respondents. Section 1 contains three subscales, a Positive
subscale (4 items), a Distress subscale (6 items), and an Uncertainty subscale (9 items),
and two additional items that did not fit into any of the subscales but that were retained
for the Total scale (21 items). Section 2 (2 items) pertained only to those respondents
who have children, and Section 3 (2 items) is for those respondents who have had or
currently have cancer. The questionnaire asked the respondents to indicate whether they
have experienced each statement on a four point scale (0, 1, 3, 5) in the past week. A
response of 0 indicated never experiencing the statement while a 5 indicated often
experiencing the statement. A higher score on any of the subscales or the total scale
indicated greater psychological distress. The positive subscale is reverse scored to reflect
this.
Our modification of the MICRA differed from the original questionnaire in two
ways. First, sections 2 and 3 were eliminated. Section 2 was eliminated in order to have
a uniform scale applicable to all respondents. Section 3 was eliminated because it is not
relevant to asymptomatic individuals. Second, because the original questionnaire applied
to genetic testing of cancer, the language for REVEAL’s modified scale was adapted to
reflect characteristics of AD. For example, item 9 of section 1 states, “Worrying about
9/27
my risk of getting cancer [or getting cancer again if you have ever been diagnosed with
cancer],” was modified to read “Worrying about my risk of getting AD.” In addition to
replacing “cancer” with “AD,” the clause in the parenthesis was stricken. Unlike cancer,
where there are treatment options such as chemotherapy, and surgery, AD currently does
not have any disease modifying therapies, and people affected by the disease do not
recover. A total of 6 items, items 9-14 of section 1 from the original scale were modified
in this manner.
In this form, the Modified MICRA was administered at each of the three follow-
up visits. The items were accompanied by the following instructions: “The questions
below are about some specific responses you may have had after receiving your genetic
test results. Please answer every question….. Indicate whether you have experienced
each statement never, rarely, sometimes or often in the past week, by circling the
corresponding number.”
Statistical Analysis
The first goal of the statistical analyses was to reduce the initial item pool to its
most parsimonious form, and to create the most psychometrically sound instrument. To
accomplish this, we used Factor Analysis (FA) and calculated Cronbach’s Alpha (CA) in
an alternating and iterative process to help us arrive at the final structure of the new scale.
After each analysis, whether it was FA or CA, we looked for items that did not fit a set of
criteria that we derived a priori, and eliminated them from the item pool. This process
was continued until all of the items fit our inclusion criteria (see below), resulting in the
final structure of our measure (Figure 1).
10/27
The FA, achieved by way of Principal Component Analysis (PCA) with Varimax
rotation, was used as a test of the internal construct validity of the scale. PCA determines
the number of components, or subscales, contained in the item pool, based on
intercorrelations among the items. Essentially the analysis tries to explain the variance in
the data by a set of latent factors by which items can be grouped. To determine the
number of factors from the analysis, we examined the Scree plot and the eigenvalues.
The eigenvalue is equivalent to the amount of variance in the item pool explained by each
factor, and the Scree plot is simply the visual plot of the eigenvalues by the number of
factors. Our a priori criteria for determining the number of components to retain included
a combination of eigenvalues greater than 1, and breaks in the curve of the Scree plot 22.
To determine which items would constitute each factor, we looked at factor
loading values. Prior to initiating our analysis, we set the inclusion criteria for each
factor at 0.50, and the exclusion criteria at 0.20. Thus, for an item to be retained and
included in a factor, it needed to have a factor loading value of greater than 0.50 for one
factor, and factor loading values of less than 0.20 for all other factors. If an item had a
factor loading value of greater than 0.20 for more than one factor, or if an item did not
have a factor loading value of greater than 0.50, then the item was eliminated.
CA was used to measure the resulting factors’ internal consistency, or the extent
to which the items within each of the factors measured the same domain or construct.
The measure is essentially an average correlation of the items within the test or subtest 23.
Additional analyses using CA evaluated the correlation of each item with the rest of the
factor item pool. After an item in the pool is removed, the alpha was calculated for the
remaining items. After the alpha was calculated, the removed item is placed back in the
pool and the next item is removed for the next alpha calculation. This procedure is
11/27
repeated for every item in the pool. If the alpha value increases after an item is removed,
then the conclusion can be drawn that the removed item is not highly correlated with the
rest of the items. Similarly, if the alpha value decreases after an item is removed, then it
can be concluded that the removed item is highly correlated with the rest of the pool.
Using this method, we were able to eliminate items that were not highly correlated with
the rest of the factor item pool (i.e., those items whose removal increased the alphas
value).
After two iterations of FA and CA, we were left with only items that fit the
inclusion criteria described above, leaving the final structure which we have named the
REVEAL Impact of Genetic Testing in Alzheimer’s Disease (IGT-AD) Scale. Next, we
used Pearson correlations to compare this final form of the IGT-AD with other more
established psychometric scales (see below) as a measure of construct validity.
Other Measures
The Impact of Event Scale (IES) is a 15-item self-report measure that assesses 2
common responses related to a specific stressful life event: intrusion and avoidance 17, 24.
It is a reliable scale that can be anchored to any specific life event and permits the
assessment of participants over time, comparison of the degree of distress among
subgroups, and comparison of the impact of various events 25. The IES has been
specifically anchored to test-related distress in previous genetic testing studies 15, 26. For
the purpose of this study, the total IES (range: 0 – 75) was used.
The Center for Epidemiologic Studies Depression Scale (CES-D) 16, 27-29 was
originally developed as a measure of depressive symptoms in community-dwelling adults
and has been widely used as a screening instrument in studies of non-clinical populations.
12/27
The 20 items are rated on a 4 point scale according to the frequency with which
symptoms were experienced during the preceding week and are summed to compute a
total score (range: 0 – 60). The CES-D shows good internal consistency for the general
population 28 and correlates strongly with the Beck Depression Inventory 29.
The Beck Anxiety Inventory (BAI) 30 is a 21-item screening test designed to
distinguish common symptoms of anxiety from those of depression and to be sensitive to
treatment change. It has been extensively validated and has shown excellent test-retest
reliability and internal validity 31. The BAI is scored on the basis of self-reported severity
of a given symptom over the past week for 0 (not at all) to 3 (severely), yielding a total
score from 0 to 63.

13/27
Results
Two iterations of FA and CA were performed to eliminate items that did not fit
the inclusion criteria. The first iteration reduced the number of items from twenty-one to
seventeen, and the second iteration eliminated one more item reducing the total number
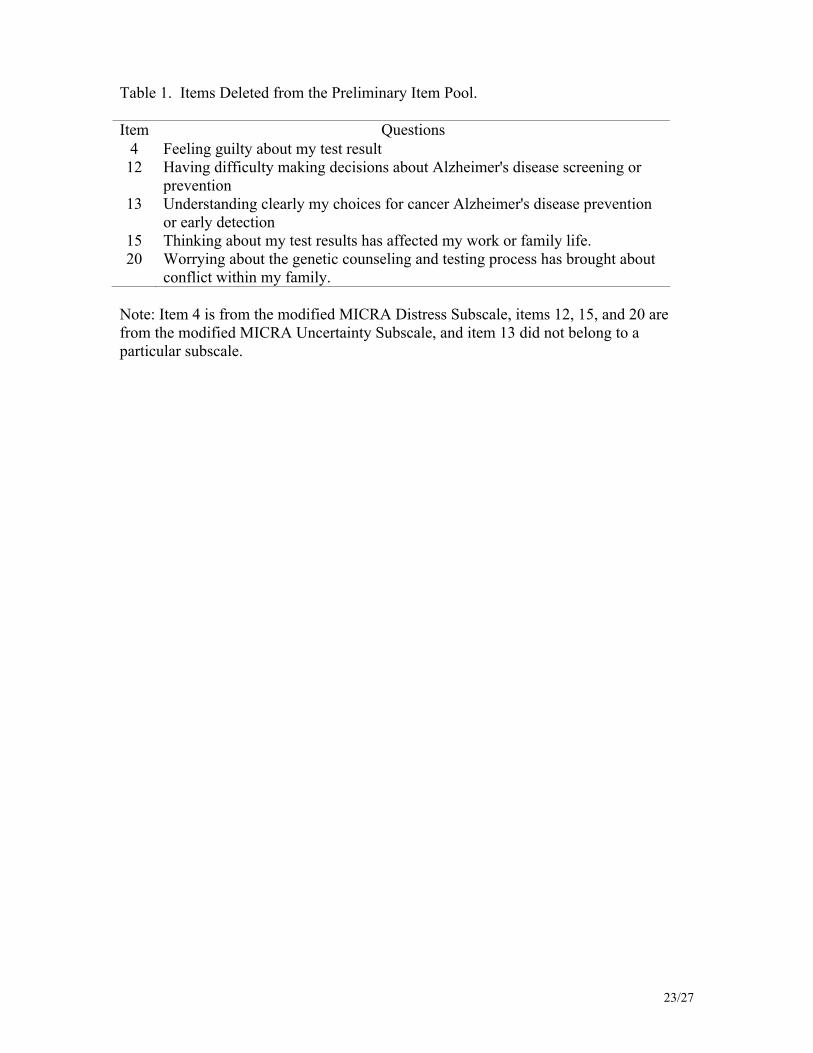
of items to sixteen (Figure 1 & Table 1)
Based on the eigenvalue criteria of greater than one, six factors could potentially
be identified in the scale. However, examination of the Scree plot, which identified the
possibility of two or three factors, and the factor loading coefficients, revealed that two
factors were optimal. Factor one, which we named the distress subscale due to the
context of the items, explained 32.9% of the total variance, and factor two, which we
named the positive subscale, explained 16.7% of the total variance. Thus, the two
components together explain 49.6% of the total variance (Table 2). Although the original
MICRA contained three components, our analyses suggest that two of the original
components (the distress subscale and the uncertainty subscale) are not measuring
significantly different dimensions of psychological impact as it pertains to AD genetic
testing.
The CA analysis eliminated any items that led to a significantly lower alpha value
when deleted. The raw alpha was used for comparison when evaluating internal
reliability of each component separately, but the standardized alpha was used when
evaluating both components together since the two components have dissimilar
variances. The distress subscale, which contains 12 items, has an alpha value of 0.86,
and the positive subscale, which contains 4 items, has an alpha value of 0.82. The total
scale also has an alpha value of 0.82.

14/27
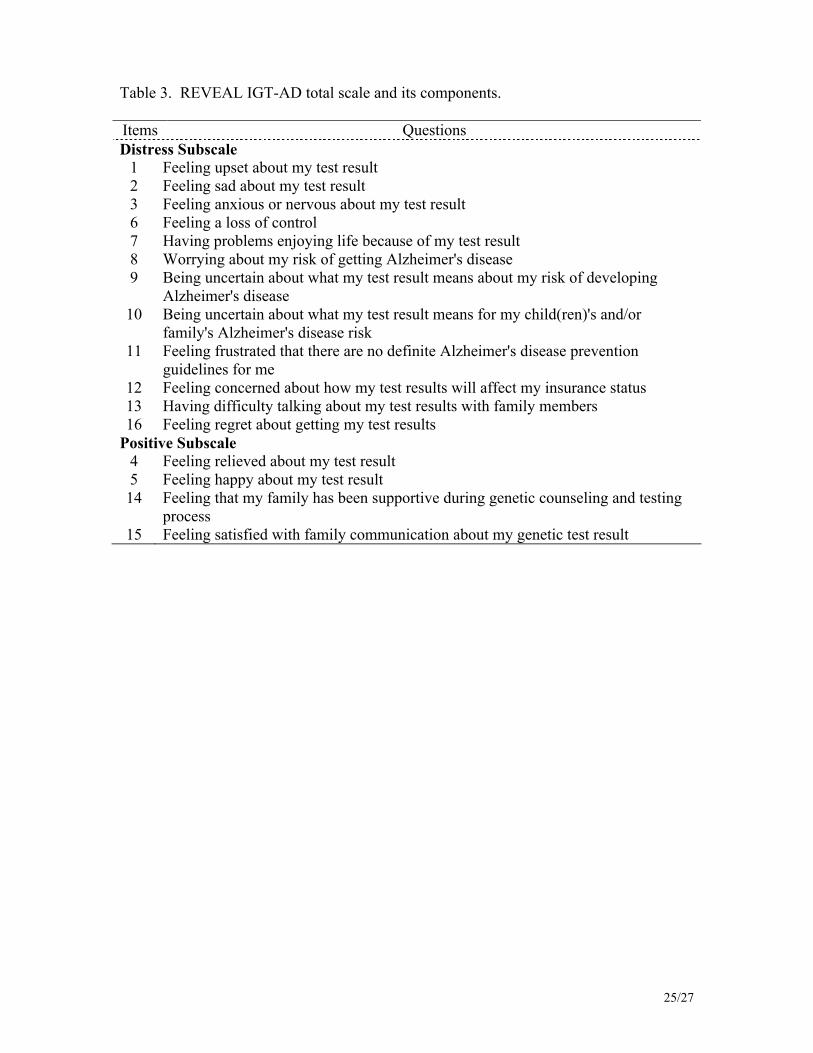
Table 3 presents the final REVEAL IGT-AD Scale items. The individual items of
each subscale are summed to form a score for each subscale. The items of the positive
subscale are reversed before summation (i.e. a “5” becomes a “0,” a “3” becomes a “1,”
and vice versa). The score of the total scale is the sum of the two subscale scores.
To establish the scale’s external validity, the IGT-AD was compared to other
more established scales, using Pearson correlation analysis. These correlations are
presented in Table 4 and indicate adequate convergent and divergent validity.

15/27
Discussion:
The IGT-AD is the first and only scale developed to assess the psychological
impact of AD genetic susceptibility testing. Results of this study indicate that it is a
valid, reliable scale that maybe more appropriate for measuring the impact of genetic
susceptibility testing in AD than generalized mood scales or other event specific scales
not sensitive to issues unique to genetic testing. This scale addresses the unique nature of
genetic information as it relates to AD and isolates the impact of this genetic information.
The IGT-AD has a number of unique features. For example, its item content is specific
to issues pertaining to AD genetic testing. Second, the inclusion of a distress subscale
and positive subscale allows for the measurement of both constructs in the same overall
scale. For example, in the context of APOE genetic testing, a respondent can be
distressed about being homozygous for the ε4 allele, but at the same time be relieved that
his or her risk of getting AD is not as high as he or she thought. Having a positive and a
negative component allows the IGT-AD to parse out two distinct potential reactions.
Limitations
One limitation of the IGT-AD is that it was not initially developed with direct
input from expert clinicians (e.g., neurologists, psychiatrists, and psychologists), genetic
counselors, geneticists or likely respondents to the questionnaire. The scale was adapted
from the MICRA 14, which was developed specifically for cancer genetic testing, using
participants interested in breast cancer genetic information. Thus, due to differences in
the age of onset, affected population, risk estimates, and treatment options between AD
and breast cancer, the IGT-AD may lack some sensitivity to AD genetic susceptibility
testing. Despite this, the preliminary statistical analyses presented here suggest that the
16/27
new scale has excellent internal reliability and construct validity, and that it is in fact
measuring additional element(s) not captured by the other established scales. Further
assessment of the validity of the new IGT-AD with additional convergent and divergent
measures would be helpful.
Another limitation of the study is the generalizability of the scale to the
population at large. So far, the psychometric properties of the scale have only been tested
on a single research population. REVEAL II participants reflect, for the most part, a
particular segment of the society (i.e. female, white, educated, and belonging to a higher
socioeconomic class), though it should be noted that African Americans were actively
recruited as a part of the study protocol and make up a substantial percentage of the study
participants, especially when compared to other clinical trials. Thus, both the validity
and the reliability of the IGT-AD need to be evaluated further in other populations that
are more heterogeneous in their ethnic, gender, and socioeconomic makeup.
Conclusion
The REVEAL IGT-AD is a valid and reliable scale that can be used to measure
the impact of genetic testing for AD (see appendix for the complete REVEAL IGT-AD
scale). As research on genetic testing for AD becomes more prominent, driven by the
increased prevalence of AD, consumer knowledge of genetics, and scientific knowledge
of the genetic components of AD, a scale like the IGT-AD can aid in understanding the
impact of genetic testing of AD. Used as an outcome measure, factors which lead to less
desirable outcomes due to AD genetic testing (i.e. sadness, anger, and/or guilt) can be
identified. As genetic testing of AD becomes more common, these studies would help
identify those patients who may be at risk for associated distress and who may benefit

17/27
from additional intervention.
18/27
References:
1. Green, R.C., Diagnosis and Management of Alzheimer's Disease and Other
Dementias. Second ed. 2005: Professional Communications, Inc.
2. Hebert, L.E., P.A. Scherr, J.L. Bienias, et al., Alzheimer disease in the US
population: prevalence estimates using the 2000 census. Arch Neurol, 2003.
60(8): p. 1119-22.
3. Sloane, P.D., S. Zimmerman, C. Suchindran, et al., The public health impact of
Alzheimer's disease, 2000-2050: potential implication of treatment advances.
Annu Rev Public Health, 2002. 23: p. 213-31.
4. Farrer, L.A., L.A. Cupples, J.L. Haines, et al., Effects of age, sex, and ethnicity on
the association between apolipoprotein E genotype and Alzheimer disease. A
meta-analysis. APOE and Alzheimer Disease Meta Analysis Consortium. Jama,
1997. 278(16): p. 1349-56.
5. Rogaeva, E., Y. Meng, J.H. Lee, et al., The neuronal sortilin-related receptor
SORL1 is genetically associated with Alzheimer disease. Nat Genet, 2007. 39(2):
p. 168-77.
6. Brodaty, H., M. Conneally, S. Gauthier, et al., Consensus statement on predictive
testing for Alzheimer disease. Alzheimer Dis Assoc Disord, 1995. 9(4): p. 182-7.
7. Farrer, L.A., M.F. Brin, L. Elsas, et al., Statement on use of apolipoprotein E
testing for Alzheimer's disease. JAMA, 1995. 274: p. 1627-1629.
8. Post, S.G., P.J. Whitehouse, R.H. Binstock, et al., The clinical introduction of
genetic testing for Alzheimer disease. An ethical perspective. Jama, 1997.
277(10): p. 832-6.
19/27
9. Relkin, N.R., Y.J. Kwon, J. Tsai, et al., The National Institute on
Aging/Alzheimer's Association recommendations on the application of
apolipoprotein E genotyping to Alzheimer's disease. Ann N Y Acad Sci, 1996.
802: p. 149-76.
10. Brown, T., J.S. Roberts, S. LaRusse, et al., Impact of genetic risk assessment for
Alzheimer's disease. J Genet Couns, 2002. 11: p. 446-447.
11. Roberts, J.S., R.C. Green, N.R. Relkin, et al., How do participants rate the impact
of genetic susceptibility testing for Alzheimer's disease? Neurology, 2003. 60: p.
A453.
12. Roberts, J.S., M. Lock, J. Prest, et al., How does genetic testing affect anxiety
about developing AD? Neurobiol Aging, 2004. 25(suppl2): p. 509.
13. Gooding, H.C., E.L. Linnenbringer, J. Burack, et al., Genetic susceptibility testing
for Alzheimer disease: motivation to obtain information and control as precursors
to coping with increased risk. Patient Educ Couns, 2006. 64(1-3): p. 259-67.
14. Cella, D., C. Hughes, A. Peterman, et al., A brief assessment of concerns
associated with genetic testing for cancer: the Multidimensional Impact of Cancer
Risk Assessment (MICRA) questionnaire. Health Psychol, 2002. 21(6): p. 564-72.
15. Leyfer, O.T., J.L. Ruberg, and J. Woodruff-Borden, Examination of the utility of
the Beck Anxiety Inventory and its factors as a screener for anxiety disorders. J
Anxiety Disord, 2006. 20(4): p. 444-58.
16. Radloff, L., The CES-D Scale: A Self-Report Depression Scale for Research in
the General Population. Applied Psychological Measurement, 1977. 1(3): p. 385-
401.
20/27
17. Horowitz, M., N. Wilner, and W. Alvarez, Impact of Event Scale: a measure of
subjective stress. Psychosom Med, 1979. 41(3): p. 209-18.
18. Broadstock, M., S. Michie, and T. Marteau, Psychological consequences of
predictive genetic testing: a systematic review. Eur J Hum Genet, 2000. 8(10): p.
731-8.
19. Sundin, E.C. and M.J. Horowitz, Impact of Event Scale: psychometric properties.
Br J Psychiatry, 2002. 180: p. 205-9.
20. Read, C.Y., D.J. Perry, and M.E. Duffy, Design and psychometric evaluation of
the Psychological Adaptation to Genetic Information Scale. J Nurs Scholarsh,
2005. 37(3): p. 203-8.
21. Green, R.C., J.S. Roberts, C. Chen, et al., Comparing the impact of a condensed
vs extended protocol for disclosure of APOE to relatives of patients with AD: The
REVEAL Study. Alzheimer's and Dementia, 2007. 3: p. S184.
22. Cattell, R.B., The Scree test for the number of factors. Multivariate Behavioral
Research, 1966. 1: p. 245-276.
23. Cronbach, L.J. and W.G. Warrington, Time-limit tests: estimating their reliability
and degree of speeding. Psychometrika, 1951. 16(2): p. 167-88.
24. Zilberg, N.J., D.S. Weiss, and M.J. Horowitz, Impact of Event Scale: A cross-
validation study and some empirical evidence supporting a conceptual model of
stress response syndromes. Journal of Consulting and Clinical Psychology, 1982.
50: p. 407-414.
25. Tennen, H. and S. Herzberger, Impact of Events Scale, in Test Critiques, R.C.
Sweetland and D.J. Keyser, Editors. 1985, Test Corporation of America: Kansas
City, MO. p. 358-366.
21/27
26. Reichelt, J.G., A.A. Dahl, K. Heimdal, et al., Uptake of genetic testing and pre-
test levels of mental distress in Norwegian families with known BRCA1 mutations.
Dis Markers, 1999. 15: p. 139-143.
27. Vernon, S.W., E.R. Gritz, S.K. Peterson, et al., Correlates of psychologic distress
in colorectal cancer patients undergoing genetic testing for hereditary colon
cancer. Health Psychology, 1997. 16(1): p. 73-86.
28. Corcoran, K. and J. Fisher, Measures for Clinical Practice: A Source Book. 1987,
New York: Free Press.
29. Santor, D.A., D.C. Zuroff, J.O. Ramsay, et al., Examining scale discriminability
in the BDI and CES-D as a function of depressive sererity. Psychological
Assessment, 1995. 7: p. 131-139.
30. Beck, A.T., N. Epstein, G. Brown, et al., An inventory for measuring clinical
anxiety: psychometric properties. J Consult Clin Psychol, 1988. 56(6): p. 893-7.
31. Wetherell, J.L. and P.A. Arean, Psychometric evaluation of the Beck Anxiety
Inventory with older medical patients. Psychological Assessment, 1997. 9(2): p.
136-144.

22/27
Figure Caption
Figure 1. Development of the REVEAL Impact of Genetic Testing in Alzheimer’s Disease (IGT-AD) Scale.
23/27
Table 1. Items Deleted from the Preliminary Item Pool.
Item Questions4 Feeling guilty about my test result12 Having difficulty making decisions about Alzheimer's disease screening or
prevention13 Understanding clearly my choices for cancer Alzheimer's disease prevention
or early detection15 Thinking about my test results has affected my work or family life.20 Worrying about the genetic counseling and testing process has brought about
conflict within my family.
Note: Item 4 is from the modified MICRA Distress Subscale, items 12, 15, and 20 are from the modified MICRA Uncertainty Subscale, and item 13 did not belong to a particular subscale.

24/27
Table 2. Varimax Rotated Component Pattern of the Final 16 REVEAL IGT-AD Items
Item Component 1 Component 21 0.80 -0.122 0.77 -0.033 0.77 -0.044 -0.05 0.825 -0.18 0.786 0.70 0.007 0.56 0.028 0.68 0.059 0.66 0.0710 0.63 0.1011 0.60 0.1612 0.51 0.1313 0.55 -0.1114 0.18 0.7615 0.10 0.8316 0.59 -0.17
Note: Bold formatting indicates loading on the respective component based on the inclusion criteria of greater than 0.50, and exclusion criteria of 0.20.
25/27
Table 3. REVEAL IGT-AD total scale and its components.
Items QuestionsDistress Subscale
1 Feeling upset about my test result2 Feeling sad about my test result3 Feeling anxious or nervous about my test result6 Feeling a loss of control7 Having problems enjoying life because of my test result8 Worrying about my risk of getting Alzheimer's disease9 Being uncertain about what my test result means about my risk of developing
Alzheimer's disease10 Being uncertain about what my test result means for my child(ren)'s and/or
family's Alzheimer's disease risk11 Feeling frustrated that there are no definite Alzheimer's disease prevention
guidelines for me12 Feeling concerned about how my test results will affect my insurance status13 Having difficulty talking about my test results with family members16 Feeling regret about getting my test results
Positive Subscale4 Feeling relieved about my test result5 Feeling happy about my test result14 Feeling that my family has been supportive during genetic counseling and testing
process15 Feeling satisfied with family communication about my genetic test result

26/27
Table 4. Construct Validity: Pearson’s Correlations with Other Scales.
IGT-AD Total
IGT-AD Distress
IGT-AD Positive
IES Total BAI CES-D
IGT-AD Total Corr= 0.73* 0.63* 0.52* 0.27* 0.33*IGT-AD Distress
-0.07 0.68* 0.36* 0.39*
IGT-AD Positive
-0.01 0.00 0.05
IES Total 0.38* 0.37*
BAI 0.65*
CES-D* P<0.0001, all others are not significant.Note: IGT-AD = Impact of Genetic Testing for Alzehimer’s Disease; IES = Impact of Event Scale; BAI = Beck Anxiety Inventory; CES-D = Center for Epidemiologic Studies Depression Scale.
27/27
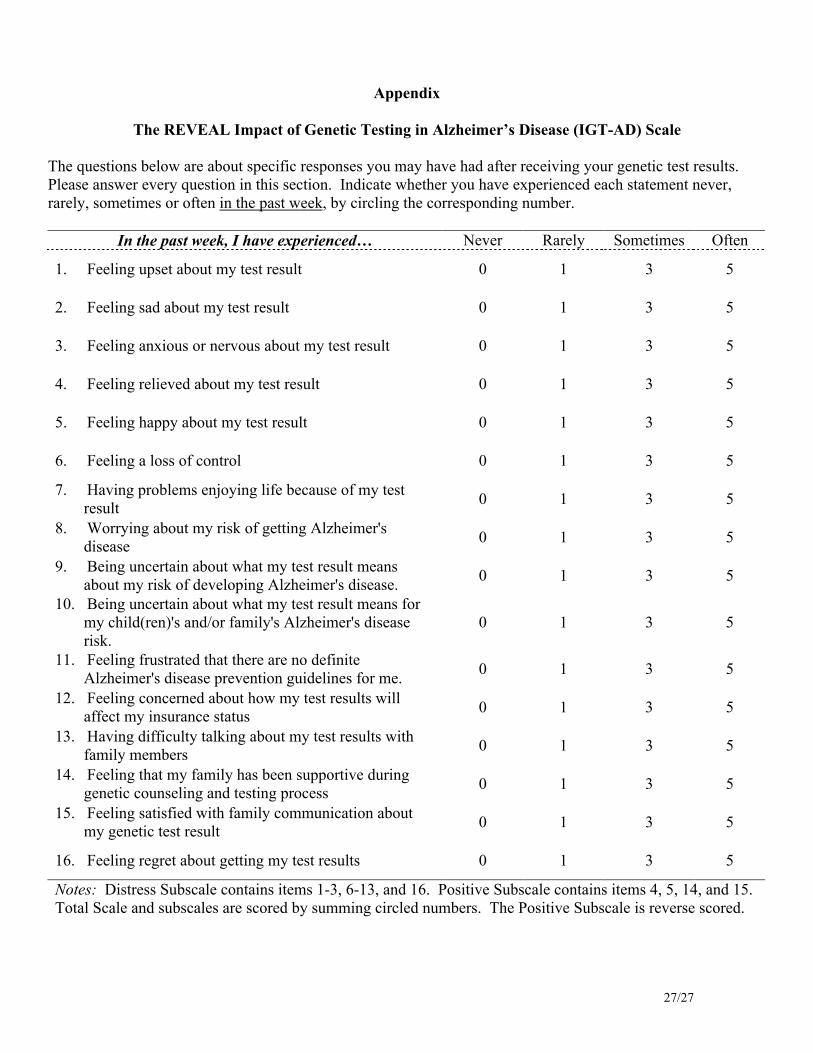
Appendix
The REVEAL Impact of Genetic Testing in Alzheimer’s Disease (IGT-AD) Scale
The questions below are about specific responses you may have had after receiving your genetic test results. Please answer every question in this section. Indicate whether you have experienced each statement never, rarely, sometimes or often in the past week, by circling the corresponding number.
In the past week, I have experienced… Never Rarely Sometimes Often
1. Feeling upset about my test result 0 1 3 5
2. Feeling sad about my test result 0 1 3 5
3. Feeling anxious or nervous about my test result 0 1 3 5
4. Feeling relieved about my test result 0 1 3 5
5. Feeling happy about my test result 0 1 3 5
6. Feeling a loss of control 0 1 3 5
7. Having problems enjoying life because of my test result
0 1 3 5
8. Worrying about my risk of getting Alzheimer's disease
0 1 3 5
9. Being uncertain about what my test result means about my risk of developing Alzheimer's disease.
0 1 3 5
10. Being uncertain about what my test result means for my child(ren)'s and/or family's Alzheimer's disease risk.
0 1 3 5
11. Feeling frustrated that there are no definite Alzheimer's disease prevention guidelines for me.
0 1 3 5
12. Feeling concerned about how my test results will affect my insurance status
0 1 3 5
13. Having difficulty talking about my test results with family members
0 1 3 5
14. Feeling that my family has been supportive during genetic counseling and testing process
0 1 3 5
15. Feeling satisfied with family communication about my genetic test result
0 1 3 5
16. Feeling regret about getting my test results 0 1 3 5
Notes: Distress Subscale contains items 1-3, 6-13, and 16. Positive Subscale contains items 4, 5, 14, and 15. Total Scale and subscales are scored by summing circled numbers. The Positive Subscale is reverse scored.

FigureClick here to download high resolution image

This piece of the submission is being sent via mail.
Copyright Transfer Form