Embed Size (px)
Citation preview
A New Product Adoption Model with Price, Advertising, and UncertaintyAuthor(s): Shlomo KalishSource: Management Science, Vol. 31, No. 12 (Dec., 1985), pp. 1569-1585Published by: INFORMSStable URL: http://www.jstor.org/stable/2631795 .
Accessed: 14/07/2014 21:29
Your use of the JSTOR archive indicates your acceptance of the Terms & Conditions of Use, available at .http://www.jstor.org/page/info/about/policies/terms.jsp
.JSTOR is a not-for-profit service that helps scholars, researchers, and students discover, use, and build upon a wide range ofcontent in a trusted digital archive. We use information technology and tools to increase productivity and facilitate new formsof scholarship. For more information about JSTOR, please contact [email protected].
.
INFORMS is collaborating with JSTOR to digitize, preserve and extend access to Management Science.
http://www.jstor.org
This content downloaded from 68.200.230.42 on Mon, 14 Jul 2014 21:29:24 PMAll use subject to JSTOR Terms and Conditions
MANAGEMENT SCIENCE Vol. 31, No. 12, December 1985
Printed in U.S.A.
A NEW PRODUCT ADOPTION MODEL WITH PRICE, ADVERTISING, AND UNCERTAINTY*
SHLOMO KALISH Recanati Graduate School of Business Administration,
Tel Aviv University, Tel Aviv, Israel Graduate School of Management, University of Rochester, Rochester, New York 14627
This paper introduces a framework for modeling innovation diffusion that includes price and advertising. The adoption of a new product is characterized by two steps: awareness and adoption. Awareness is the stage of being informed about the product search attributes. The process of becoming aware is modeled as a simple 'epidemic' type model, where the information is spread by advertising and word of mouth. The second step, adoption, is conditional on awareness, and it occurs if the perceived risk adjusted value of the product exceeds its selling price. The population is heterogeneous with respect to valuation of the product. Individuals are risk averse, and therefore are willing to pay more for the product, on the average, as information from early adopters reduces uncertainty about the product. Optimal control of the diffusion process by pricing and advertising over time is analyzed, and a comparative estimation of the model in one application is reported. (MARKETING; NEW PRODUCTS; DIFFUSION OF INNOVATION)
1. Introduction
Diffusion of innovations is the process by which an innovation is adopted by a society over time (Rogers and Shoemaker 1971). Several studies in the last two decades have suggested mathematical models that describe innovation diffusion. Most are variations of simple epidemic models, where the analogy is between an epidemic and an innovation. Thus, once an innovation is introduced, it spreads like an epidemic, where nonadopters are influenced by adopters as they contact them, leading to an eventual adoption. Price and advertising have typically been incorporated into this framework in a rather ad hoc way.
The objective of this study is to suggest a model that is consistent with existing theories of individual behavior, that complies with the observed phenomena, and that is useful for understanding innovation management. The framework we suggest is similar to Jeuland (1981b), in that awareness information spreads in an epidemic-like manner, and the actual adoption depends on price and the individual's valuation of the product. However, we argue that experience type information is only produced by actual adopters. This type of information (e.g. product reliability, durability, taste of a new food) reduces the uncertainty associated with the new product. The population is heterogeneous with respect to their valuation of the product (reservation prices), due to income and taste differences. They also discount the value of the product due to the uncertainty associated with it as a result of lack of information. As experience information becomes available, the uncertainty associated with the new product is reduced, and accordingly the product's value increases.
The rate of adoption is therefore determined by awareness diffusion, which is controlled by advertising, and the rate of growth of the potential adopter population, which is controlled by price. We show how this model complies with observed phenomena, and how it relates to previous work. We also show how the adoption process is related to observed sales in the cases of durable goods, repeat purchase
*Accepted by John R. Hauser; received September 1984. This paper has been with the author 1 month for 1 revision.
1569 0025-1909/85/31 12/1569$0 1.25
Copyright ?Z 1985, The Institute of Management Sciences
This content downloaded from 68.200.230.42 on Mon, 14 Jul 2014 21:29:24 PMAll use subject to JSTOR Terms and Conditions
1570 SHLOMO KALISH
goods, and services. We then discuss pricing and advertising policies (?4), where it is shown that the qualitative nature of those policies is consistent with previous studies. In ?5 we report on estimation of the model using one product, and compare it to alternative models.
2. Literature Review
The study of innovation diffusion has a long history.' The much younger field of quantitative modeling of innovation diffusion in marketing started with the introduc- tion of the simple epidemic model by Bass (1969).2 In what follows, we briefly review the relevant literature development.3 Let N be the population size, and X(t) be the number of adopters by time t. Let the conditional likelihood of adoption be increasing linearly in the number of existing adopters, i.e. a + bX(t), where a and b are parameters; then the adoption rate, X(t),4 is:
X(t) = [N-X(t)][a + bX(t)]. (1)
Note that this model implicitly assumes a homogeneous population, because all individuals in the population are equally "susceptible". This is perhaps a good approximation for the diffusion of information. Similar models have been proposed in that context by Ozga (1960), Stigler (1961), and Gould (1970). Jeuland (1981 a) suggests a model where the individuals are heterogeneous with respect to "susceptibility". Each homogeneous segment is described by equation (1), with rates varying across segments. The aggregate process that results is a generalization of equation (1).
Most of the research effort in diffusion models in the last decade was directed at extending the Bass model to include marketing mix variables. Horsky and Simon (1983) modified the parameter a in equation (1) to be a function of advertising, and their estimation of the model produced encouraging results. Monahan (1984) has extended this model in a stochastic framework.
Robinson and Lakhani (1975) introduced price into (1) in a multiplicative way as follows:
X = [- X] [a + bX]e-dP()
where P(t) is price, and d is a price sensitivity parameter. (We eliminate the time argument whenever there is no confusion.) This model was subsequently used by Dolan and Jeuland (1981) for analyzing optimal monopolistic pricing, and Thompson and Teng (1984) who have extended the model for an oligopoly situation.
An alternative formulation was introduced by Mahajan and Peterson (1978, 1982) and developed specifically with respect to price in Kalish (1980 and 1983) and in Feichtinger (1982). Here the potential population is a function of price, i.e., N = N(P), which leads to the following model:
X = [N(P)-X] [a + bXj.
The interpretation of the model is that the size of the potential population is a function of price, while the conditional adoption rate still depends linearly on penetration level as before.
A third approach was introduced by Bass (1980) followed by Bass and Bultez
'See Rogers (1983) for a comprehensive review. 2See Jeuland (1981a, b) for insightful review of preceding work in other fields. 3For more comprehensive reviews see Mahajan and Muller (1979) and Kalish and Sen (1985). 4We adopt the dot notation for the time derivative, i.e. X(t) = dX(t)/dt.
This content downloaded from 68.200.230.42 on Mon, 14 Jul 2014 21:29:24 PMAll use subject to JSTOR Terms and Conditions
NEW PRODUCT ADOPTION MODEL 1571
(1982). They suggest that the rate of adoption is multiplicative as follows:
X =f(P)g(t),
where f(P) is decreasing in P, and g(t) is an exogenous s curve as a function of time. Jeuland (1981b), building on Schmalensee's (1982) model, introduced the idea that
individuals are characterized by their reservation prices for the product, i.e., the maximum amount that they would be willing to pay for the product given full information. If the actual price is below the individual's reservation price he would buy and vice versa. However, there is an element of uncertainty about the new product's performance, i.e., some probability that its value will be lower than expected. There- fore, the reservation price is the expected value of the two outcomes, which is clearly lower than the value under full information. Once the individual is informed about the product, the individual's reservation price immediately jumps to the higher undis- counted level, since there is no more uncertainty. Individuals become informed by an information diffusion process similar to equation (1), with a = 0. That is, the informa- tion is spread only by word of mouth, where the seed is the initial adopter population. The rate of adoption is then determined by information diffusion and price changes over time.
There are several composite models that separate information flow from the adop- tion process (Midgley 1976, Dodson and Muller 1978, Mahajan, Muller, and Kerin 1983, Hauser and Wisniewski 1982). Those models, however, do not include price explicitly.
In sum, it is clear that considerable progress has been made in the field in the last two decades. This paper seeks to extend the state of the art by building a model that is consistent with established theories of individual behavior, incorporating two impor- tant marketing variables, price and advertising, and testing the model against alterna- tive models.
3. The Model
Following Nelson (1974) we differentiate between search and experience product attributes. Search attributes are product attributes that can be easily verified, and therefore can be effectively transmitted by advertising (e.g., color, weight, size, power, etc.). We define awareness as being familiar with the product search attributes. Awareness is generated by advertising and word of mouth.5
On the other hand, some product attributes (experience attributes) will be revealed only by using the product (e.g. reliability, durability, taste, ease of use, etc.). This type of information will be released by adopters, as they use the product, and is spread by word of mouth, publicity, and sometimes reinforced by advertising. Adoption is con- tingent on the value of the product to the customer being greater than its price. As the product is introduced, there is uncertainty associated with the product's experience- type attributes. The value of the new product to a risk-averse customer is lower than product's value if all experience information was available. As more customers adopt the innovation more of the uncertainty is removed and the valuation of the-product increases. The population is heterogeneous with respect to their valuation of the product, due, e.g., to income and taste differences. Hence, only those whose risk adjusted valuation exceeds the product's price will be potential buyers. In what follows we formalize these ideas in detail.
5We use word of mouth in a general way, representing not only pure word of mouth, but also other phenomena that spread information in proportion to the number of products in the market, such as the product self-advertising by just being out there in the case of automobiles, etc.
This content downloaded from 68.200.230.42 on Mon, 14 Jul 2014 21:29:24 PMAll use subject to JSTOR Terms and Conditions
1572 SHLOMO KALISH
3.1. Awareness Diffusion
Let No be the relevant population size, I(t) be the proportion of the population aware by time t, and X(t) the number of adopters by t. We assume that information diffusion is homogeneous (geographically, as well as by population segments). Un- aware individuals can become aware by word of mouth, or by advertising. Thus the conditional likelihood of becoming aware is proportional to the number of "transmitters", and to the advertising effectiveness. Let A (t) be the advertising spending rate, and f(A) the likelihood that a randomly chosen individual is exposed to the advertising (as usual, we expect f'(A) > 0, f(O) = 0, f"(A) < 0, and a saturation level at some point). Assuming actual adopters transmit information more effectively than just informed individuals, with contact rates b and b" respectively, then the awareness diffusion equation is:
I(t) =[I I]{f[A(t)] +[ ( N ) + b"( )} (2)
Let b' = b" - b, then (2) can be rewritten as:
I I - -] [f(A ) + bl + b'( X- (3)
Equation (3) simply states that the rate at which awareness is generated is proportional to the portion not yet informed and to the conditional likelihood of being informed. This implicitly assumes that individuals are homogeneous with respect to information diffusion.
3.2. Market Potential
Different customers will value the new product differently due, e.g., to income and taste differences in the consumer market, or different cost savings induced by the innovation in the industrial markets. Suppose that an individual has all the relevant information about the product, and thus he has no uncertainty about the product's performance and value. Let v be his valuation of the product. Let Fv(v) be the proportion (density) of individuals with valuation v. The customer then will buy if the price of the product is less than its value, i.e., P < v. The market potential at price P under full information is then the sum of all individuals that value the product at least P, or mathematically:
N(P) = N Fv(v)dv= Nof_ Fv(v)dv. >) P v=P
Note that N(P) is similar to a demand function, and is a nonincreasing function of price. It gives the steady state number of potential adopters as a function of price under full information.
3.3. Uncertainty
Since there is uncertainty with regard to the product's experience attributes, the actual value of the product to the consumer is not known for sure. Risk averse individuals will be willing to pay less for a risky choice, when compared with getting the expected value for sure (see, e.g., Arrow 1970). Let CE be the certainty equivalent, or the value of the uncertain product to the consumer. Define u = CE/v, i.e., the ratio of the value of the uncertain product to the value under certainty.
We further assume that the level of uncertainty in the market decreases as the number of adopters, X, increases, and that u is the same across all customers at a given
This content downloaded from 68.200.230.42 on Mon, 14 Jul 2014 21:29:24 PMAll use subject to JSTOR Terms and Conditions
NEW PRODUCT ADOPTION MODEL 1573
0.9
0.8
0.7
2 0.6 F- 0~ 0.5- o U0.8 a_ 0.4 0 Q~ 0.3
ch ~~~~~~~~~certainty case 0.2
01 U O.6
0 0 30 60 90 120 150 180 210
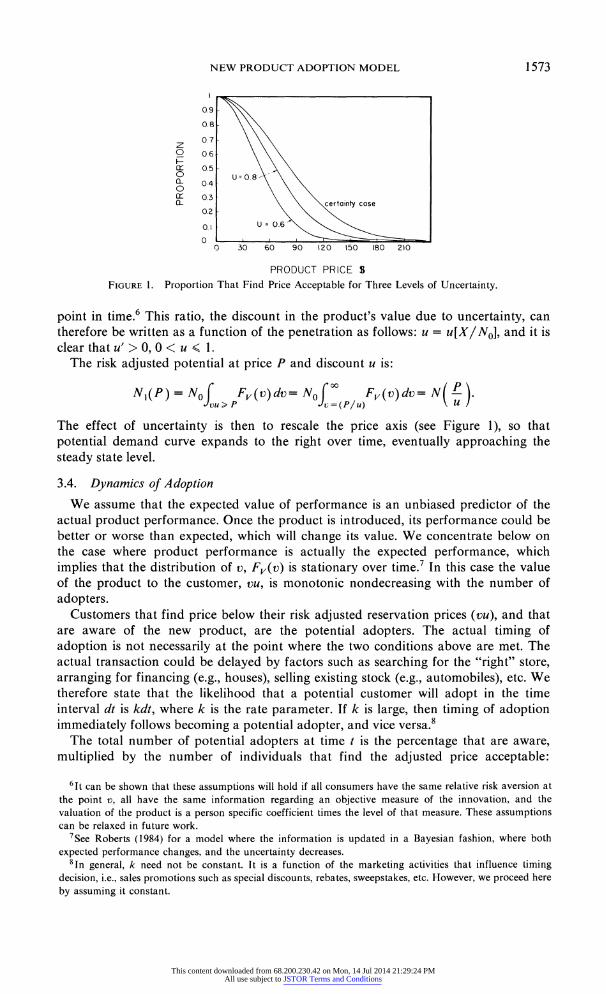
PRODUCT PRICE $ FIGURE 1. Proportion That Find Price Acceptable for Three Levels of Uncertainty.
point in time.6 This ratio, the discount in the product's value due to uncertainty, can therefore be written as a function of the penetration as follows: u = u[X/NO], and it is clear that u' > 0, 0 < u < 1.
The risk adjusted potential at price P and discount u is:
NI(P) = No F ((v) v=Nof F(v)dv= N( P).
The effect of uncertainty is then to rescale the price axis (see Figure 1), so that potential demand curve expands to the right over time, eventually approaching the steady state level.
3.4. Dynamics of Adoption
We assume that the expected value of performance is an unbiased predictor of the actual product performance. Once the product is introduced, its performance could be better or worse than expected, which will change its value. We concentrate below on the case where product performance is actually the expected performance, which implies that the distribution of v, Fv(v) is stationary over time.7 In this case the value of the product to the customer, vu, is monotonic nondecreasing with the number of adopters.
Customers that find price below their risk adjusted reservation prices (vu), and that are aware of the new product, are the potential adopters. The actual timing of adoption is not necessarily at the point where the two conditions above are met. The actual transaction could be delayed by factors such as searching for the "right" store, arranging for financing (e.g., houses), selling existing stock (e.g., automobiles), etc. We therefore state that the likelihood that a potential customer will adopt in the time interval dt is kdt, where k is the rate parameter. If k is large, then timing of adoption immediately follows becoming a potential adopter, and vice versa.8
The total number of potential adopters at time t is the percentage that are aware, multiplied by the number of individuals that find the adjusted price acceptable:
6Itcan be shown that these assumptions will hold if all consumers have the same relative risk aversion at the point v, all have the same information regarding an objective measure of the innovation, and the valuation of the product is a person specific coefficient times the level of that measure. These assumptions can be relaxed in future work.
7See Roberts (1984) for a model where the information is updated in a Bayesian fashion, where both expected performance changes, and the uncertainty decreases.
81n general, k need not be constant. It is a function of the marketing activities that influence timing decision, i.e., sales promotions such as special discounts, rebates, sweepstakes, etc. However, we proceed here by assuming it constant.
This content downloaded from 68.200.230.42 on Mon, 14 Jul 2014 21:29:24 PMAll use subject to JSTOR Terms and Conditions
1574 SHLOMO KALISH
N[P/u]I. Assuming for the moment that all past adopters would still adopt given current prices and uncertainty, then the net potential is the difference between the total potential and the number who are already adopters. The aggregate adoption equation is then:
N[( ( )i- X ]k (adoption) (4a)
where I is given by the awareness diffusion equation:
I =[1-I] f(A) + b+ b' X (awareness). (4b)
It is possible that past adopters would not be in the potential adopter population at the current price. This happens if P/u is higher than it has been in the past. Equation (4a) implicitly assumes that those adopters for whom the risk adjusted price is above their reservation price will stop being adopters with rate k. This will be the case for repeat purchase goods, services, club memberships, magazine subscriptions, and some dura- ble goods with good secondary markets. In the latter case those adopters will resell their goods to new adopters, and equation (4a) above is still correct with the added constraint that total change (4a) is nonnegative.
The other extreme case is a situation where disadopting the innovation is not possible (e.g., going to a new movie), or too costly. In this case if P/u is increasing, then since there is no possibility of disadoption, the net change in adoption is:
[N( u(X/N) )- (X)l (4c)
where +(X) is the part of existing adopters that would still adopt under current conditions. Note that the computation of the subgroup ?(X) is difficult, since it depends on the entire price history.
The adoption model (4a) has to be converted to sales when we apply it to a specific innovation. If the innovation is a durable good (i.e., product lifetime is longer than the planning horizon), then the sales rate is equal to adoption rate, i.e., each individual adopts one unit once. Examples of such products are refrigerators, books, movies, and some novelty items (e.g., Rubik's cube). At the other extreme, if the innovation is of the repeat purchase type, then each adopter generates a stream of sales. If usage rate is independent of price, then the sales rate is proportional to the number of adopters. Examples of such products are magazines, services (e.g., "pay-by-phone" banking), leasing, etc. In the case of durable goods with shorter lifetimes, or if extended forecasts are required, then replacement purchases would have to be incorporated.9
The model complies with many of the generalizations suggested by Roger and Shoemaker (1971) regarding diffusion of innovations. The model also generates many previous diffusion models as special cases. See Kalish (1984) for details and simula- tions of the model.
9One way to do this is the following. Let h(w) be the product survival function, that gives the probability, or proportion of products of age w that are still in use. The number of adopters who have an operational product then is the sum of all existing stock, and the resulting sales equation is:
S=[ N( (XN) ) fS(s)h(t-s)ds]K (5)
where S is the sales rate (see Kalish and Lilien 1985 for an implementation). If the depreciation of products is equal to a fixed percentage every year, then once the introductory stage effects of awareness and uncertainty are gone, equation (5) is the same as the stock adjustment model for durable goods (see, e.g., Chow 1960).
This content downloaded from 68.200.230.42 on Mon, 14 Jul 2014 21:29:24 PMAll use subject to JSTOR Terms and Conditions
NEW PRODUCT ADOPTION MODEL 1575
4. Policy Implications
In what follows we analyze optimal pricing and advertising by a monopolist. We consider two types of products: durable and repeat purchase goods. In the first case the sales rate is equal to the adoption rate, since each adopter buys one unit. In the second, we look at the case where sales is proportional to the number of adopters.
We assume that the firm maximizes the net present value of cash flow. Let r be the discount rate, C be average cost at time t, S be sales at time t, and T the end of the planning period. The mathematical statement of the problem is:
Max fTe-rt[(P C)S -A]dt s.t.
x=[N( N P )I- Xlk (adoption), (4a)
I[ - I[f(A ) + bI+ (awareness). (4b)
In what follows we state the results. The proofs are in the Appendix. It should be emphasized, however, that we assume that an internal solution to the problem exists.
4. 1. Advertising
PROPOSITION 1. If there is no discounting (r = 0) and decreasing returns to scale in advertising (f"(A) < 0), then optimal advertising is monotonic decreasing over time (possibly terminating completely after some awareness level has been achieved).
PROOF. See Appendix A.1. The result can be extended to nonzero discount rates as long as r is not "too big"
(see Appendix). If r is large, then under some situations it is possible that advertising expenditure will be deferred so that it is used just before a price drop, and therefore the interest on the expense saved. It can also be extended to the limiting case where k is very large, i.e., the case where there is no delay, and X = NI (see Appendix A. 1). Note that the Horsky and Simon (1983) model is a special case of this model. This then generalizes their result to any concave advertising response function.
4.2. Pricing Durable Goods
In the case of durable goods, the sales rate is the adoption rate. We model average cost to be a function of cumulative production, X, C'(X) < 0 (experience curve).
PROPOSITION 2. The monopolist selling durable goods should never increase price so that (4a) is not positive, except possibly for zero adoption in a continuous interval ending at T.
PROOF. See Appendix A.2. Next we consider the price path over time.
PROPOSITION 3. Price path is monotonically decreasing unless: (1) The effectiveness of adopters in generating awareness is high (b'), and/or (2) The uncertainty reduction of early adopters is high (u'). In either of these situations price could be increasing.
PROOF. Appendix A.2.
COROLLARY 3.1. If there is no uncertainty, and adopters do not spread awareness information more efficiently than other aware individuals (b' < 0), then optimal price is monotonic decreasing.
COROLLARY 3.2. If there is no uncertainty, but adopters are very effective in generat-
This content downloaded from 68.200.230.42 on Mon, 14 Jul 2014 21:29:24 PMAll use subject to JSTOR Terms and Conditions
1576 SHLOMO KALISH
ing awareness by word of mouth (b'> 0) then optimal price is increasing initially, decreasing later on.
COROLLARY 3.3. At the points where uncertainty reduction due to additional adopters is large (u' > 0), then optimal price is increasing.
This latter situation will typically occur at introduction, where information is not available, and the marginal value of information is highest.
4.3. Pricing Repeat Purchase Goods
In the repeat purchase goods category we analyze the special case of the model where the timing constant, k, is very large, no uncertainty effects, and average cost is a function of production rate alone. We make these assumptions for analytical conve- nience, although we believe that due to the nature of repeat purchase goods the special case analyzed below is representative of the majority of cases. Uncertainty is less of an issue when trial of the product is inexpensive. Timing delays in adoption are less of an issue unless the measurement period is small as compared with the interpurchase time (e.g., weeks). Experience effects in production tend to be less important in many packaged goods products, unless the new products are technology driven (e.g., inte- grated circuits), as opposed to market driven innovations (e.g., new snacks). In the latter, manufacturing technology is not new, and therefore experience effects may not be a major factor.
In this case the number of users is X = N(P)I, i.e., those that find price acceptable and are aware immediately buy. We also assume below that the buying rate is independent of price (e.g., magazines and other services) and without loss of general- ity, each adopter consumes one unit per period. We ignore sales resulting from trial alone (see also Feichtinger 1982).
The normalized sales are then S = X = N(P)I, and C = C(X). The results are summarized in the following proposition:
PROPOSITION 4. For repeat purchase goods, if production cost is constant then price is monotonically increasing if and only if advertising is decreasing. If marginal cost is increasing, then if advertising is decreasing price is increasing.
PROOF. See Appendix A.3. Recall that advertising will be decreasing in the zero interest case (Proposition 1),
and is likely to be decreasing unless interest is high. It therefore follows that price in these cases is monotonically increasing to the steady state level if there are no economies of scale.
The results above are generally consistent with previous work in the area. Previous research has focused on one marketing variable at a time, mostly price or advertising (see Kalish and Sen 1985, for a review). Here we show that many of the qualitative results extend to the case of jointly maximizing price and advertising. The results are also consistent with conjectures made based on numerical optimization of price and advertising by Thompson and Teng (1984). They show that advertising pulses are followed by price cuts. As we have shown above, if the interest rate is zero, then advertising will be monotonically decreasing, however for positive interest rates, saving advertising expenses for just before price cuts could be optimal. In what follows we interpret the results, and discuss the limitations.
Consider advertising first. Each informed individual is possibly a potential adopter. Moreover, he becomes a source that spreads information by word of mouth. It is therefore better to make an individual informed earlier. Due to decreasing returns to scale in advertising, however, pulsing at t = 0 is not optimal. Rather we expect that advertising spending rate be high at introduction, decreasing monotonically thereafter.
This content downloaded from 68.200.230.42 on Mon, 14 Jul 2014 21:29:24 PMAll use subject to JSTOR Terms and Conditions
NEW PRODUCT ADOPTION MODEL 1577
This proposition was proved mathematically, for the zero interest case. Note however that if targeting is a viable option, this policy might change. In that case advertising campaigns are expected to precede price reduction, and to be aimed at the segments that will be the new potential adopters resulting from the price cut. This way advertising expenses would be deferred, and thus the interest on that amount saved. Note also that if there is forgetting in awareness, then the argument presented above is strengthened; that is, more advertising expenditures will be deferred.'0
Consider repeat purchase goods pricing next. Here all the interactions are positive, i.e., each additional adopter will have positive effects on future demand. Therefore price will be below the myopic price. The marginal future benefit from additional adopters decreases as more individuals become aware. Therefore if production cost is constant over time, price will be lowest at introduction, monotonically increasing to a steady state level." We have proven above that price is increasing if advertising is decreasing (in the constant or increasing marginal cost case).
Pricing of durable goods involves the extra factor of saturation. Since each customer purchases once only, the seller can sell at a high price to the high bidders, and reduce price as the segment is removed from the market, and so on.'2 We have proven that without the information factors, price indeed will be monotonically decreasing over time. If, on the other hand, early adopters are very effective in either transmitting awareness information, or in reducing uncertainty about the product, then initial price would be low and increasing, followed by a decreasing price. We have also shown that in such cases price increases will never be so dramatic as to cause sales to cease or be negative.
Although we have only modeled price and advertising, other marketing instruments can be used. In our context, uncertainty can be reduced by providing warranties, by using a reputable brand name (e.g., Sony), or by a free-trial period. Which combina- tion of the instruments will be used and at what level depends on their relative cost effectiveness. For example, if the durable good is portable, we expect a free-trial period (e.g., mail-order goods) to be a low cost alternative, as compared with heavy appli- ances, where extended warranties could be more effective.
Another factor in the durable context is the speed of adoption once the price is acceptable. Although we have modeled it as a constant (i.e., the parameter k in equation (4a)), it can be influenced in several ways in practice, for example, by special promotions, by reducing the transaction cost for the consumer, i.e., providing financ- ing and trade-in options, etc.
Finally, we can use the model to compute bounds on expenditures marketing activities. For example, if we are interested in computing the value of a 'perfect' warranty policy that eliminates uncertainty completely, then we can compute the present value of profits assuming u= 1, and subtract it from the present value of profits using the normal model. This is an upper bound on the gross value of a warranty, which can be compared to costs.
5. Estimation and Comparison
In this section we illustrate an application of the model to a durable good and compare the model with three alternative models. The product we model has a life time of about ten years. Since we model the first eight years, we ignore replacement
'0Note also that we did not model here other possible effects of advertising in addition to generating awareness, such as goodwill advertising, advertising special price promotions, etc.
l A low introductory price could be implemented indirectly by free samples, coupons, rebates, etc. "2This phenomenon will persist even if consumers have correct expectations about future prices, although
we have not modeled it above.
This content downloaded from 68.200.230.42 on Mon, 14 Jul 2014 21:29:24 PMAll use subject to JSTOR Terms and Conditions
1578 SHLOMO KALISH
sales. We only use the adoption part of the model, since awareness data were not available in this case. As a result we do not use the first three years after introduction, after which we assume approximately 100% awareness was achieved.
The data consist of quarterly sales and unit prices for eight years. We use years 4-7 for estimation, while the last year is reserved as a hold out sample for forecasting comparisons.'3 The original quarterly sales data were deseasonalized using the X11 program in the TROLL (1979) statistical package. There were several models and brands in this product class, all of them providing the same type of service. The price used here is the minimum average retail price of all the models in the market. The minimum is used because it determines the market potential.'4 Prices were all deflated to correct for inflation.
We model the special case where the awareness level is one. We use the discrete version of the model.'5 The sales rate, S(t + 1) = X(t + 1) - X(t), is given by:
S( + 1) [N( (X1N) ) - k. (6)
We use a simple parameterization of the model as follows: N(P) = Noe-dP where No is the market potential at zero price, and u(w) = (a + w2)/(a + 1), where a is a parameter to be estimated. These functions are used because of their flexibility. Substituting in (6) above we get:
S(t+ JLo[ pk a + dx(t)/0)2) - X(t) k (Proposed Model). (7a)
The above model has four parameters to be estimated, NO, a, d, and k. Three other models were estimated with the same data for comparison. One is the multiplicative separable form, originally introduced by Robinson and Lakhani (1975). The second is the model suggested originally by Mahajan and Peterson (1978). The third is a naive model, where sales is assumed to be a function of price alone. The three models estimated are:
S(t + 1) = [No - X] [k + bX]e-dP (ROBINSON/LAKHANI), (7b)
S(t + 1) = [Noe-dP - X][k + bX] (MAHAJAN/PETERSON), (7c)
SQt + 1) = Noe- dP (NAIVE). (7d)
The nonlinear least square method (TROLL 1979) was used to estimate the models' parameters. The results for these four models are given in Table 1, with asymptotic standard errors in parentheses.
The three non-naive models provide good fits to the data. Note, however, that No represents the market potential at zero cost, in all but the naive model. This number should be related to the number of households in our case. Since the number of households in this period was around 70 million, the estimate of No based on the proposed model is the closest. The actual sales data, along with the fit of the four
13Due to the proprietary nature of the data, we cannot provide more details about the data base in the paper.
141t is presumable that some customers would find the price of a high quality model too high, but the quality of the inexpensive model too low, and thus not buy at all. However this procedure still seems superior to the alternative of computing a weighted average price, as was determined by comparing the two.
15Conceptually, one can estimate the continuous version as well, but this is a computationally complex procedure.
This content downloaded from 68.200.230.42 on Mon, 14 Jul 2014 21:29:24 PMAll use subject to JSTOR Terms and Conditions
NEW PRODUCT ADOPTION MODEL 1579
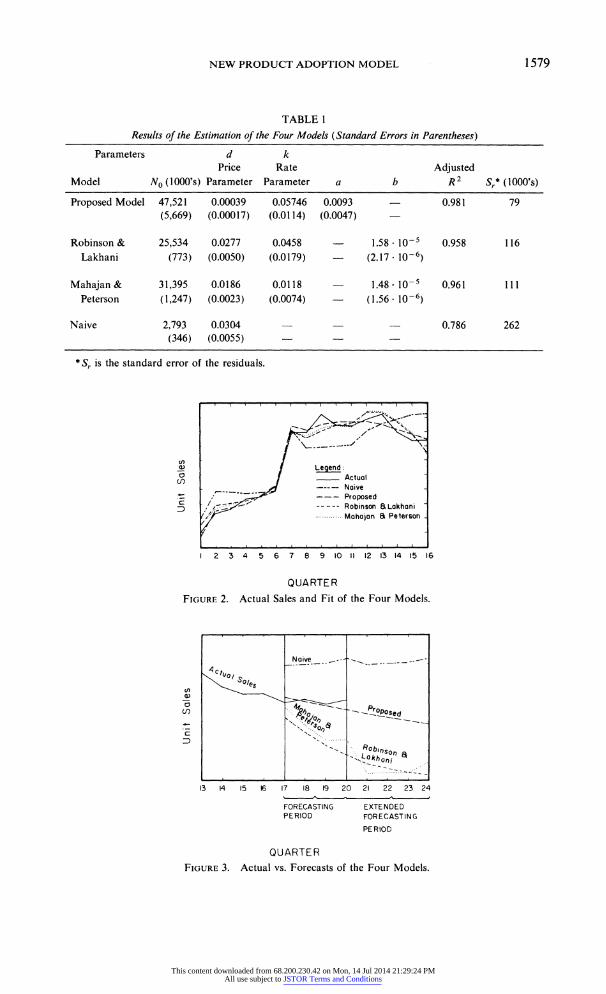
TABLE I
Results of the Estimation of the Four Models (Standard Errors in Parentheses)
Parameters d k Price Rate Adjusted
Model No0(1000's) Parameter Parameter a b R2 Sr* (1000's)
Proposed Model 47,521 0.00039 0.05746 0.0093 - 0.981 79 (5,669) (0.00017) (0.0114) (0.0047)
Robinson & 25,534 0.0277 0.0458 - 1.58 10-5 0.958 116 Lakhani (773) (0.0050) (0.0179) - (2.17- 10-6)
Mahajan & 31,395 0.0186 0.0118 - 1.48 10-5 0.961 111 Peterson (1,247) (0.0023) (0.0074) - (1.56- 10-6)
Naive 2,793 0.0304 - 0.786 262 (346) (0.0055) -
*Sr is the standard error of the residuals.
e> s ~~~~~~Legend: o
I
~~~~~~~~~~Actual LO~~~A Naive
. | , ~~~~~~~~Proposed D
,/ ,~~~~ ~ a> ~Robinson a l-khoni
,,,e............. .......... mohojon a Pe terson-
1 6 7 8 9 lo 1l 12 13 14 Is 16
QUARTE R
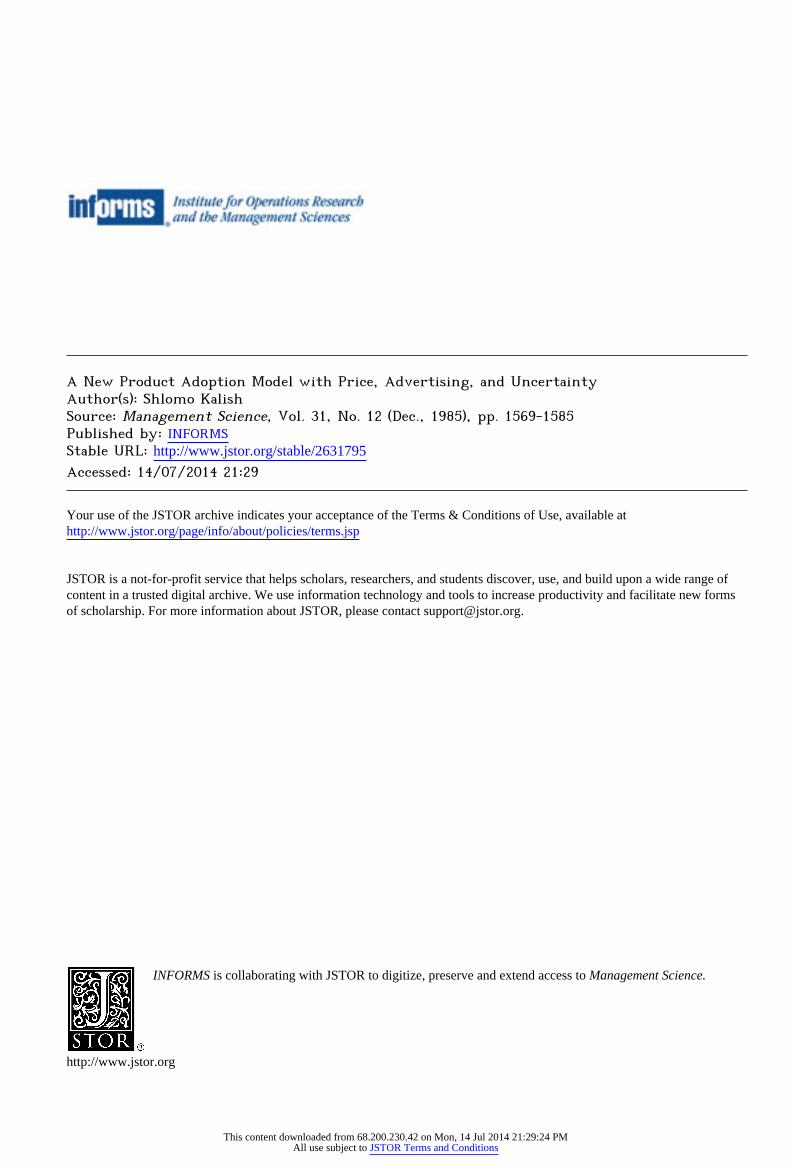
FICJURF. 2. Actual Sales and Fit of the Four Models. 0)
D Robinson S~~~~~othonis Mohoon &Ptro
t ~~~~~~~~~~~~~~~~~~. . . ;. . .... ...
1 3 4 15 6 17 18 19 20 21 22 23 24
FORECASTING EXTENDED PERIOD FORECASTING
PE RIOD
QUARTER FIGURE 3. Actual vs. Forecasts of the Four Models.
This content downloaded from 68.200.230.42 on Mon, 14 Jul 2014 21:29:24 PMAll use subject to JSTOR Terms and Conditions
1580 SHLOMO KALISH
models, are given in Figure 2. The difference in the estimators of No is more crucial than what may be initially thought. The cumulative number of adopters by the end of the estimation period was around 22 million. Hence, remaining potential is rather small in the two alternative models (ROBINSON/LAKHANI and MAHAJAN/ PETERSON). Therefore, we expect these two models to forecast a steep decline in sales. On the other hand, the naive model does not account for past adopters at all, and, therefore, will forecast a sales increase, since price was decreasing over time.
To compare the four models in forecasting, we used the estimated parameters to forecast the eight quarters that followed. Actual prices were used to forecast the first four periods, and smoothed price trends after that. Actual cumulative sales were used to predict the first quarter, and the predicted sales for the following periods. Figure 3 presents these point estimates of future sales, along with the actual sales level for four quarters. As expected, the two competing models forecast a steep sales decline (ROBINSON/LAKHANI and MAHAJAN/PETERSON), while the naive model over-predicts by a factor of two. The proposed model predicts a slight sales decline with a standard error of the differences between actual and predicted is 191,000 (sales levels are in millions).
Since this is a size one sample, we do not draw conclusions beyond Figure 3. A cross-sectional test of these models and others is left for future work.
6. Future Directions, Limitations and Conclusion
The framework of the model is well suited to include other extensions which are likely to be useful in many practical applications. We discuss these below.
In applications where long-range forecasts are considered, the population size can be changing in a predicted way. A simple way to incorporate this is by letting N(P)= N(t)F(P), where N(t) is the population size over time, and F(P) is the portion that finds price acceptable.
If quality is known to change in a predictable manner, then it can be incorporated in the valuation of the product by consumers. Suppose for example that the product quality is designed to be improving over time after introduction. This will have an effect on increasing the valuation for a given price. This will result in changing N(P) in a way similar to the uncertainty effect, except that N(P) expands as a function of time, and not penetration level. Other factors that increase the value of the product to the adopter as a function of the number of adopters (network effects) will have an effect similar to the uncertainty effect.
Promotions and sales efforts reduce the search costs and other costs of doing business on the customer's side. Apart from their effect on generating awareness, they increase the likelihood of adoption given acceptability. Therefore, k, which is our term for the likelihood of adoption, can be modeled as a function of these efforts. Note also that seasonality factors could also be incorporated in k, since seasonal factors indicate that the likelihood of purchasing in a particular season is higher. Similarly, other economic indicators can be incorporated in k (e.g., high interest rates could delay buying a new automobile).
The level of details to be incorporated in any particular application should be determined by the trade-off between the model's flexibility, and the cost of calibration and estimation. See Kalish and Lilien (1985) for applications where some of the factors above are incorporated.
The model has several limitations. The main limitation is the stationarity of N(P), i.e., that the potential number of adopters is a function of the product price alone. This assumption will certainly be violated in the case of competition, where the potential is a function of the competitive products as well. Therefore the model is best applicable
This content downloaded from 68.200.230.42 on Mon, 14 Jul 2014 21:29:24 PMAll use subject to JSTOR Terms and Conditions
NEW PRODUCT ADOPTION MODEL 1581
to situations of a monopoly product or a product class. The incorporation of competi- tion is a major direction for future research. Some attempts at doing that have already been done (Bass and Rao 1984, Clarke and Dolan 1984, Eliashberg and Jeuland 1983, Hauser, Roberts and Urban 1983, Roberts 1984, and Thompson and Teng 1984).
Another reason for the shifting of N(P) is that the actual product performance may not be the expected one. It is clear that if the product performs below expectations, and if the problems are inherent and cannot be corrected, then the potential at a given price is reduced. While a priori it is logical to assume that expected performance is an unbiased estimate of actual performance, as we have done, the stochastic nature of the process is of interest. This is particularly important when issues such as the probabili- ties of failure of the innovation and the development of appropriate adaptive reaction strategies for unexpected performance are of interest. The appropriate procedures for updating the parameters are to be developed (see Roberts 1984 for an interesting development along this line).
Other assumptions that can be relaxed are the following: Risk Aversion Heterogeneity. We have assumed that all individuals have the
same attitude towards risk, and therefore the utility is discounted by the same proportion across all individuals. Clearly, the degree of risk aversion varies across individuals. While segmenting the market on this dimension as well will complicate the model, the benefit is high, since this has an important implication for marketing strategy, in particular, targeting of products and information.
Information Diffusion Independence. We have assumed that awareness is homoge- neous in the population. If the population with high reservation price can be targeted, then clearly it is more effective to advertise to these individuals first. Moreover, word of mouth is likely to be more effective across people from the same social stratum, so that the actual potential population would have a higher awareness rate than the rest. One approach to introduce heterogeneity could be based on Jeuland (1981a), who incorporates heterogeneity in the basic Bass model (equation (1)). Another extension to the awareness process could be the addition of a forgetting term for some individuals who are aware, but have not purchased yet.
Timing of Adoption. We have explained why the actual timing of adoption may be delayed due to exogenous factors. Therefore, only a fraction, kdt, will actually adopt at each time period dt. However, in our model, k is independent of the benefit to the consumer in adopting, which is the difference between the reservation price and actual price.
Usage Rate for Frequently-Purchased Goods. We have assumed that usage rate for frequently purchased goods is independent of price and reservation price. This limits the applicability of the model to a subset of repeat purchase products (e.g., magazines).
-Consumers' Expectations. We have assumed that consumers act myopically, i.e., they do not form expectations about future prices. This could be an inadequate approximation in cases where price changes rapidly (e.g., home computers). Modeling the formation of expectations is an important direction for future research.
Finally, while the objectives vie set (see ? 1) for developing the model have been largely achieved, a comprehensive empirical testing of this and other new product models, both by survey methods and using cross-sectional time series is still called for.'6
16The author thanks Gary Lilien, John D. C. Little, Daniel Kleitman and Al Silk for valuable advice and encouragement at the dissertation stage, and Subrata K. Sen, Anne Coughlan, Dan Horsky and John Roberts for numerous constructive comments on subsequent drafts. Any remaining errors are, of course, mine.
This content downloaded from 68.200.230.42 on Mon, 14 Jul 2014 21:29:24 PMAll use subject to JSTOR Terms and Conditions
1582 SHLOMO KALISH
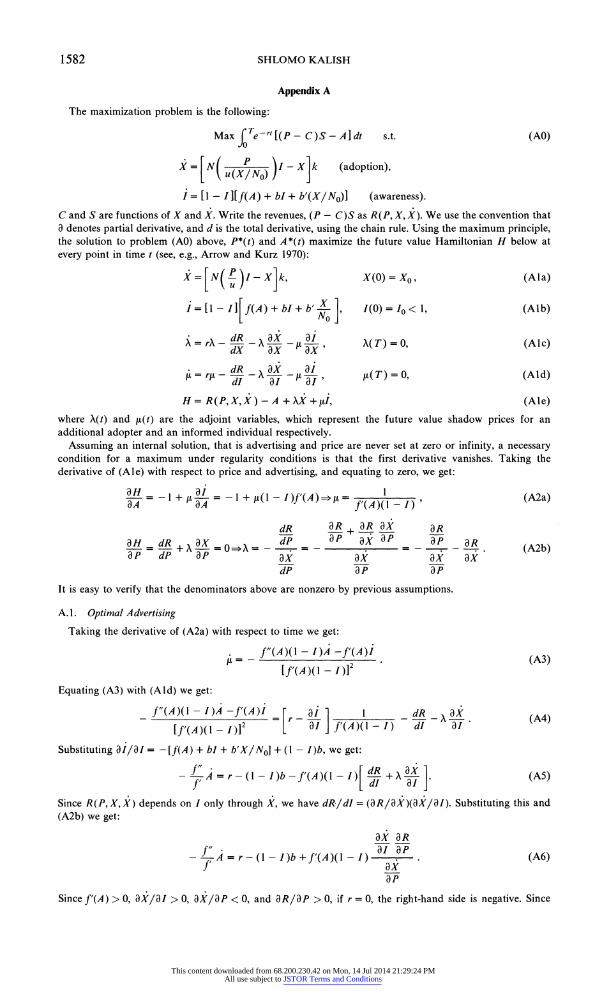
Appendix A
The maximization problem is the following:
Max Te-rt[(P- C)S-Aldt s.t. (AO)
P
X = [N u(XN) I-X Xlk (adoption),
I = [1-I I[f(A) + bI + b'(X/No)I (awareness).
C and S are functions of X and X. Write the revenues, (P - C)S as R(P, X, X). We use the convention that a denotes partial derivative, and d is the total derivative, using the chain rule. Using the maximum principle, the solution to problem (AO) above, P*(t) and A *(t) maximize the future value Hamiltonian H below at every point in time t (see, e.g., Arrow and Kurz 1970):
X= [N( P )I-X]k X(0)= X0, (Ala)
I = [1-I f[(A) +bI +b' No] I(0) =IO < 1, (Alb)
Ar dR X- ax- ax' 4(T)=0, (AIc) dX ax ,ax
= r_ a_ ai II(T) =0, (Ald)
H= R(P,X,X)-A +XX+,uI, (Ale)
where X(t) and ,u(t) are the adjoint variables, which represent the future value shadow prices for an additional adopter and an informed individual respectively.
Assuming an internal solution, that is advertising and price are never set at zero or infinity, a necessary condition for a maximum under regularity conditions is that the first derivative vanishes. Taking the derivative of (Ale) with respect to price and advertising, and equating to zero, we get:
aH I + 81aA =I + ( l-I)f'( )- I > , (A2a)
dR aR + aR aX aR 811 dR a8X 8P1' x 8P 81' _ R 8 = dP 8A+ X =X ax aP a (A2b)
dP aP aP
It is easy to verify that the denominators above are nonzero by previous assumptions.
A. 1. Optimal Advertising
Taking the derivative of (A2a) with respect to time we get:
f"(A)(l-I)A-f'(A)I (A3)
[f'(A)(I-I)]
Equating (A3) with (Ald) we get:
_f -(A)(l- I)A -f'(A)I 1 1 dR _ax
[f'(A)(I _ 1)12 [ a8 f'(A)(I- I) dl aI
Substituting aI/8a =I-[f(A) + bI + b'X/NO] + (I - I)b, we get:
A = A r- (I - I)b -f'(A)(I-I)[ dI 81 (A5)
Since R(P, X, X) depends on I only through X, we have dR/dI = (aR/aX)(aX/I 1). Substituting this and (A2b) we get:
ax aR
- L A = r- (I - I)b +f'(A)(II) 81 a1' (A6)
aP Since f '(A )> 0, 8X/81 > 0, 8X/8P < 0, and aR/a P > 0, if r = 0, the right-hand side is negative. Since
This content downloaded from 68.200.230.42 on Mon, 14 Jul 2014 21:29:24 PMAll use subject to JSTOR Terms and Conditions
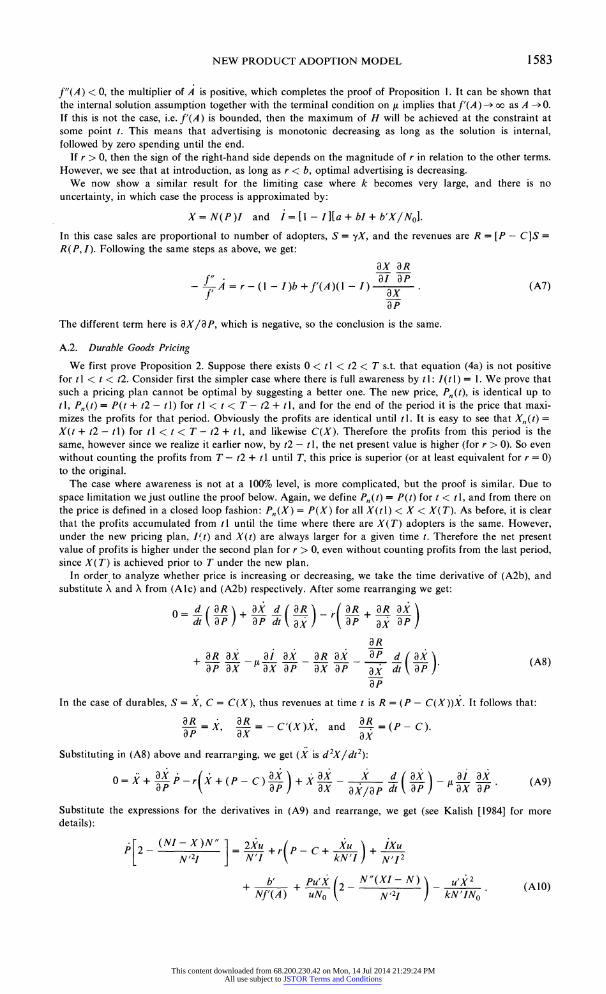
NEW PRODUCT ADOPTION MODEL 1583
f"(A) < 0, the multiplier of A is positive, which completes the proof of Proposition 1. It can be shown that the internal solution assumption together with the terminal condition on ,1 implies that f'(A) -* oo as A - 0. If this is not the case, i.e. f'(A) is bounded, then the maximum of H will be achieved at the constraint at some point t. This means that advertising is monotonic decreasing as long as the solution is internal, followed by zero spending until the end.
If r > 0, then the sign of the right-hand side depends on the magnitude of r in relation to the other terms. However, we see that at introduction, as long as r < b, optimal advertising is decreasing.
We now show a similar result for the limiting case where k becomes very large, and there is no uncertainty, in which case the process is approximated by:
X = N(P)I and i = [1-I I[a + bI + b'X/No].
In this case sales are proportional to number of adopters, S = yX, and the revenues are R = [P - C]S= R(P, I). Following the same steps as above, we get:
ax aR
-f--A = r-(I-I)b +f'(A)(-I) x(A7)
aP The different term here is aX/aP, which is negative, so the conclusion is the same.
A.2. Durable Goods Pricing
We first prove Proposition 2. Suppose there exists 0 < tl < t2 < T s.t. that equation (4a) is not positive for tl < t < t2. Consider first the simpler case where there is full awareness by tl: I(tl) = 1. We prove that such a pricing plan cannot be optimal by suggesting a better one. The new price, Pn(t), is identical up to tl, P,(t) = P(t + t2 - tI) for tI < t < T- t2 + tl, and for the end of the period it is the price that maxi- mizes the profits for that period. Obviously the profits are identical until tM. It is easy to see that Xn(t) =
X(t + t2 - ti) for tI < t < T - t2 + tl, and likewise C(X). Therefore the profits from this period is the same, however since we realize it earlier now, by t2 - t I, the net present value is higher (for r > 0). So even without counting the profits from T - t2 + t I until T, this price is superior (or at least equivalent for r = 0) to the original.
The case where awareness is not at a 100% level, is more complicated, but the proof is similar. Due to space limitation we just outline the proof below. Again, we define Pn(t) = P(t) for t < tl, and from there on the price is defined in a closed loop fashion: P,(X) = P(X) for all X(tl) < X < X(T). As before, it is clear that the profits accumulated from tl until the time where there are X(T) adopters is the same. However, under the new pricing plan, It) and X(t) are always larger for a given time t. Therefore the net present value of profits is higher under the second plan for r > 0, even without counting profits from the last period, since X(T) is achieved prior to T under the new plan.
In order to analyze whether price is increasing or decreasing, we take the time derivative of (A2b), and substitute X and X from (Alc) and (A2b) respectively. After some rearranging we get:
O=d (aR ax d (aR aR aR ax dt ap1 aP dt aX a P ax aPJ
aR aR ax ai ax aR ax aP d (ax) +ap ax -ax ap ax ap- aX (A8)
aP In the case of durables, S = X, C = C(X), thus revenues at time t is R = (P - C(X))X. It follows that:
aR ~ aRaR = X, a=-C'(X)X, and (P - C).
Substituting in (A8) above and rearranging, we get (X is d2X/dt2):
0= X + P-r(X +(P- C) ap)+ X - a 'ap dt XaP) ax ap (A9)
Substitute the expressions for the derivatives in (A9) and rearrange, we get (see Kalish [1984] for more details):
P (2 (N1X)N" 1 2Xu +rP Xu +IXu N'21 J N'I ( kN'I) N'12
b' + Pu'x (2_ N"(XI _-___ (A10) Nf~ ~~ '(A ) uT I N2 J kN'I 0o
This content downloaded from 68.200.230.42 on Mon, 14 Jul 2014 21:29:24 PMAll use subject to JSTOR Terms and Conditions
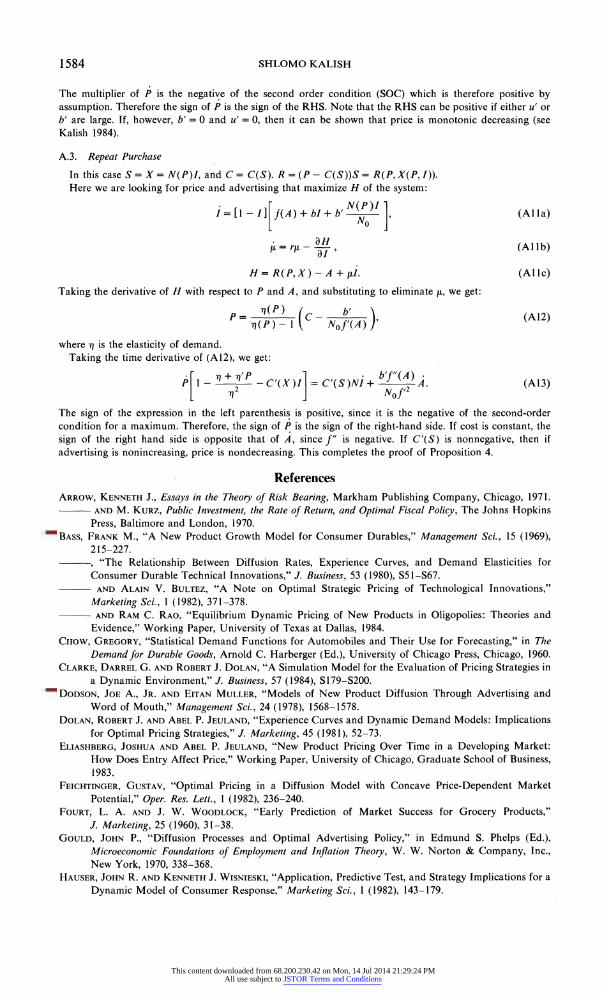
1584 SHLOMO KALISH
The multiplier of P is the negative of the second order condition (SOC) which is therefore positive by assumption. Therefore the sign of P is the sign of the RHS. Note that the RHS can be positive if either u' or b' are large. If, however, b' = 0 and u' = 0, then it can be shown that price is monotonic decreasing (see Kalish 1984).
A.3. Repeat Purchase
In this case S = X = N(P)I, and C = C(S). R = (P- C(S))S = R(P,X(P, I)). Here we are looking for price and advertising that maximize H of the system:
I=[l-I][f(A) +bI~ No 1 (Alla)
,i = r~l - ads ' (Al lb)
H= R(P,X)-A + ,ud. (Alic)
Taking the derivative of H with respect to P and A, and substituting to eliminate a, we get:
,1(p) i I N~of'(A)) A2
where -q is the elasticity of demand. Taking the time derivative of (A12), we get:
[ I 1 C (X VI = O S )NI + ) A. (A 13)
The sign of the expression in the left parenthesis is positive, since it is the negative of the second-order condition for a maximum. Therefore, the sign of P is the sign of the right-hand side. If cost is constant, the sign of the right hand side is opposite that of A, since f" is negative. If C'(S) is nonnegative, then if advertising is nonincreasing, price is nondecreasing. This completes the proof of Proposition 4.
References ARROW, KENNETH J., Essays in the Theory of Risk Bearing, Markham Publishing Company, Chicago, 1971.
AND M. KURZ, Public Investment, the Rate of Return, and Optimal Fiscal Policy, The Johns Hopkins Press, Baltimore and London, 1970.
BASS, FRANK M., "A New Product Growth Model for Consumer Durables," Management Sci., 15 (1969), 215-227. , "The Relationship Between Diffusion Rates, Experience Curves, and Demand Elasticities for Consumer Durable Technical Innovations," J. Business, 53 (1980), S5 1-S67.
AND ALAIN V. BULTEZ, "A Note on Optimal Strategic Pricing of Technological Innovations," Marketing Sci., 1 (1982), 371-378.
AND RAM C. RAO, "Equilibrium Dynamic Pricing of New Products in Oligopolies: Theories and Evidence," Working Paper, University of Texas at Dallas, 1984.
CHOW, GREGORY, "Statistical Demand Functions for Automobiles and Their Use for Forecasting," in The Demandfor Durable Goods, Arnold C. Harberger (Ed.), University of Chicago Press, Chicago, 1960.
CLARKE, DARREL G. AND ROBERT J. DOLAN, "A Simulation Model for the Evaluation of Pricing Strategies in a Dynamic Environment," J. Business, 57 (1984), S179-S200.
DODSON, JOE A., JR. AND EITAN MULLER, "Models of New Product Diffusion Through Advertising and Word of Mouth," Management Sci., 24 (1978), 1568-1578.
DOLAN, ROBERT J. AND ABEL P. JEULAND, "Experience Curves and Dynamic Demand Models: Implications for Optimal Pricing Strategies," J. Marketing, 45 (1981), 52-73.
ELIASHBERG, JOSHUA AND ABEL P. JEULAND, "New Product Pricing Over Time in a Developing Market: How Does Entry Affect Price," Working Paper, University of Chicago, Graduate School of Business, 1983.
FEICHTINGER, GUSTAV, "Optimal Pricing in a Diffusion Model with Concave Price-Dependent Market Potential," Oper. Res. Lett., 1 (1982), 236-240.
FOURT, L. A. AND J. W. WOODLOCK, "Early Prediction of Market Success for Grocery Products," J. Marketing, 25 (1960), 31-38.
GOULD, JOHN P., "Diffusion Processes and Optimal Advertising Policy," in Edmund S. Phelps (Ed.), Microeconomic Foundations of Employment and Inflation Theory, W. W. Norton & Company, Inc., New York, 1970, 338-368.
HAUSER, JOHN R. AND KENNETH J. WISNIESKI, "Application, Predictive Test, and Strategy Implications for a Dynamic Model of Consumer Response," Marketing Sci., 1 (1982), 143-179.
This content downloaded from 68.200.230.42 on Mon, 14 Jul 2014 21:29:24 PMAll use subject to JSTOR Terms and Conditions
NEW PRODUCT ADOPTION MODEL 1585
JOHN R. ROBERTS AND GLEN L. URBAN, "Forecasting Sales of a New Consumer Durable," in Advances and Practices of Marketing Science, F. S. Zufryden (Ed.), The Institute of Management Sciences, Providence, RI, 1983, 115-128.
HORSKY, DAN AND LEONARD S. SIMON, "Advertising and the Diffusion of New Products," Marketing Sci., 2 (1983), 1-17.
JEULAND, ABEL P., "Parsimonious Models of Diffusion of Innovation Part A: Derivations and Compari- sons," Working Paper, University of Chicago, Graduate School of Business, 1981a. , "Parsimonious Models of Diffusion of Innovation Part B: Incorporating the Variable of Price," Working Paper, University of Chicago, Graduate School of Business, 1981b.
KALISH, SHLOMO, "Models of the Diffusion of Innovations and Their Implications for Government Policies," Master's Thesis, Massachusetts Institute of Technology, Cambridge, Mass., 1980. , "Control Variables in Models of Innovation Diffusion," Unpublished Ph.D. Dissertation, Massa- chusetts Institute of Technology, Cambridge, Mass., June 1982. , "Monopolist Pricing with Dynamic Demand and Production Cost," Marketing Sci., 2 (1983), 135-159. , "A New Product Adoption Model with Price Advertising and Uncertainty," Working Paper, University of Rochester, August 1984. AND GARY LILIEN, "Applications of Innovation Diffusion Model in Marketing," forthcoming in
Mahajan and Wind (Eds.), Innovation Diffusion Models of New Product Acceptance, Ballinger Publishing Company, 1985. AND SUBRATA SEN, "Diffusion Models and the Marketing Mix for Single Products," forthcoming in
Mahajan and Wind (Eds.), Innovation Diffusion Models of New Product Acceptance, Ballinger Publishing Company, 1985.
MAHAJAN, VIJAY AND EITAN MULLER, "Innovation Diffusion and New Product Growth Models in Market- ing," J. Marketing, 43, 4 (Fall 1979), 55-68. 1 AND ROGER A. KERIN, "Introduction Strategy for New Product with Positive and Negative Word-of-Mouth," Working Paper, 1983.
AND ROBERT A. PETERSON, "Innovation Diffusion in a Dynamic Potential Adopter Population," Management Sci., 24 (1978), 1589-1597. AND , "Erratum to: Innovation Diffusion in a Dynamic Potential Adopter Population,"
Management Sci., 28 (1982), 1087. MIDGLEY, DAVID F., "A Simple Mathematical Theory of Innovative Behavior," J. Consumer Res., 3 (1976),
31-41. MONAHAN, GEORGE E., "A Pure Birth Model of Optimal Advertising with Word-of-Mouth," Marketing Sci.,
3, 2 (Spring 1984), 169-178. NELSON, PHILIP, "Advertising as Information," J. Political Economy, 82 (1974), 729-754. OREN, SHMUEL S., MICHAEL H. ROTHKOPF AND RICHARD D. SMALLWOOD, "Evaluating a New Market: A
Forecasting System for Nonimpact Computer Printers," Interfaces, 10 (1980), 76-87. OZGA, S., "Imperfect Markets Through Lack of Knowledge," Quart. J. Econom., (1960). ROBERTS, JOHN H., "A Multiattribute Utility Diffusion Model: Theory and Application to Pre-launch
Forecasting of Autos," Unpublished Ph.D. Thesis, Massachusetts Institute of Technology, Cam- bridge, Mass., 1984.
ROBINSON, B. AND C. LAKHANI, "Dynamic Price Models for New-Product Planning," Management Sci., 21
(1975), 1113-1122. ROGERS, EVERETT M., Diffusion of Innovations, Third Edition, The Free Press, New York, 1983.
AND F. F. SHOEMAKER, Communication of Innovations: A Cross-Cultural Approach, Second Edition, The Free Press, New York, 1971.
RUSSELL, THOMAS, "Comments," J. Business, 53 (1980), S69-S74. SCHMALENSEE, RICHARD, "Product Differentiation Advantages of Pioneering Brands," Amer. Economic Rev.,
72 (.1982), 349-365. SPREMANN, K., "Hybrid Product Life Cycles and the Nerlov-Arrow Theorem," Working Paper, Abt.
Wirtschaftswessenschagten, Universitat Ulm, D-7900 Ulm, Federal Republic of Germany, 1981. STIGLER, GEORGE, "The Economics of Information," J. Political Economy, (1961), 213-225. TENG, J. AND G. L. THOMPSON, "Optimal Strategies for General Price-Advertising Models," Working Paper,
Carnegie-Mellon University, 1983. THOMPSON, GERALD L. AND JINN-TSAIR TENG, "Optimal Pricing and Advertising Policies for New Product
Oligopoly Models," Marketing Sci., 3, 2 (Spring 1984), 148-168. TROLL, TROLL Reference Manual, 2nd ed., Massachusetts Institute of Technology, Center for Computa-
tional Research in Business and Management Science, Cambridge, Mass., 1979.
This content downloaded from 68.200.230.42 on Mon, 14 Jul 2014 21:29:24 PMAll use subject to JSTOR Terms and Conditions