Embed Size (px)
Citation preview
TitleA New Peptide Antibiotic Produced by Bacillussubtilis 168 : Isolation, Structural Analysis,and Biogenesis.
Author(s) Babasaki, Katsuhiko
Citation
Issue Date
Text Version ETD
URL http://hdl.handle.net/11094/24326
DOI
rights
SUBTI LOSI N A
A New Peptide Antibiotic Produced by Bacillus subtilis 168:
Isolation, Structural Analysis, and Biogenesis.
- 1 -
ABBREVIATIONS
HPLC; high performance liquid chromatography; TFA, trifluoro
acetic acid; DTNB, 5,5 1 -dithio-bis(2-nitrobenzoic acid); DABITC,
4-N,N-dimethylamino-azobenzene-4 1 -isothiocyanate; PITC, phenyl
isothiocyanate; dansyl, l-dimethylaminonaphthalene-5-sulphonyl; RCM,
reduced and S-carboxymethylated; NSM, nutrient sporulation medium;
MIC, minimum inhibitory concentration; FAB, fast atom bombardment;
N-, amino-; C-, carboxyl-; ~, molecular weight; ~, electric charge;
MES, 2-(N-morpholino)ethanesulfonic acid monhydrate.
- 2 -
SUMMARY
Subti10sin A, a new antibiotic produced by Bacillus subti1is
168, was extracted from culture medium with n-butano1 and purified to
homogeneity by a combination of gel filtration and thin-layer
chromatography. Two methods (Methods A and B) were used for the
isolation of subti10sin A. The yields according to the method A and
B were 2 mg and 5.5 mg from a 1iter of culture, respectively. This
antibiotic is hydrophobic, and has bacteriocidal activity against
some gram-positive bacteria. Amino acid analysis and FAB mass
spectrometry showed that it is a peptid~ with a molecular weight of
3398.9, consisting of 32 residues of usual amino acids and some
non-amino acid residues. Methionine, tyrosine, phenylalanine,
histidine and arginine were missing. Its amino~ and carboxyl-termini
were blocked. No D-amino acids and sugars were detected. By the
analysis of the fragments obtained by partial acid hydrolysis,
chymotryptic and thermo1ysin digestion of reduced and S-carboxy
methylated samples and Achromobacter protease I digestion of
performic acid-oxixized samples, the amino acid sequence was
determined. The analyses on cross-linking structures revealed that
there were linkages between the amino- and carboxyl-termini and
between the Cys-19 residue and the G1x-28 residue through an unknown
residue with a residue weight of 163. Consequently, subti10sin A was
deduced to be a cyclic peptide antibiotic with a novel cross-linking
structure.
The production of subtilosin A begins at the end of vegetative
growth and finishes before spore formation. The antibiotic produced
- 3 -

i I .
was mostly secreted into medium. The maximal concentration was about
8 mg per liter of culture. Studies of the correlation between the
production of subtilosin A and spore formation with decoy;nine and
with asporogenous mutants of ~. subtilis 168 suggested that there w~s
no close correlation between the two phenomena. The production of
subtilosin A was repressed by inhibitors of protein and RNA syntheses
in contrast to that of many other antibiotic peptides, suggesting
that it is synthesized by the mechanism of usual protein synthesis.
Glucose also suppressed the production of subtilosin A as well as
spore formation. Subtilosin A-like antibiotics were found to be
produced by ~. natto and B. subtilis ATCC 6633.
- 4 -

INTRODUCTION
Microorganisms of genus Bacillus, which are useful in fermen
tation industries, are capable of entering into dormancy as spores
when rapidly metabolizable nutritents such as glucose and amino acids
are deprived from their growing environments. Sporulation of genus
Bacillus species has been thought to be a model system for the
studies of cell differentiation, and investigated extensively. As
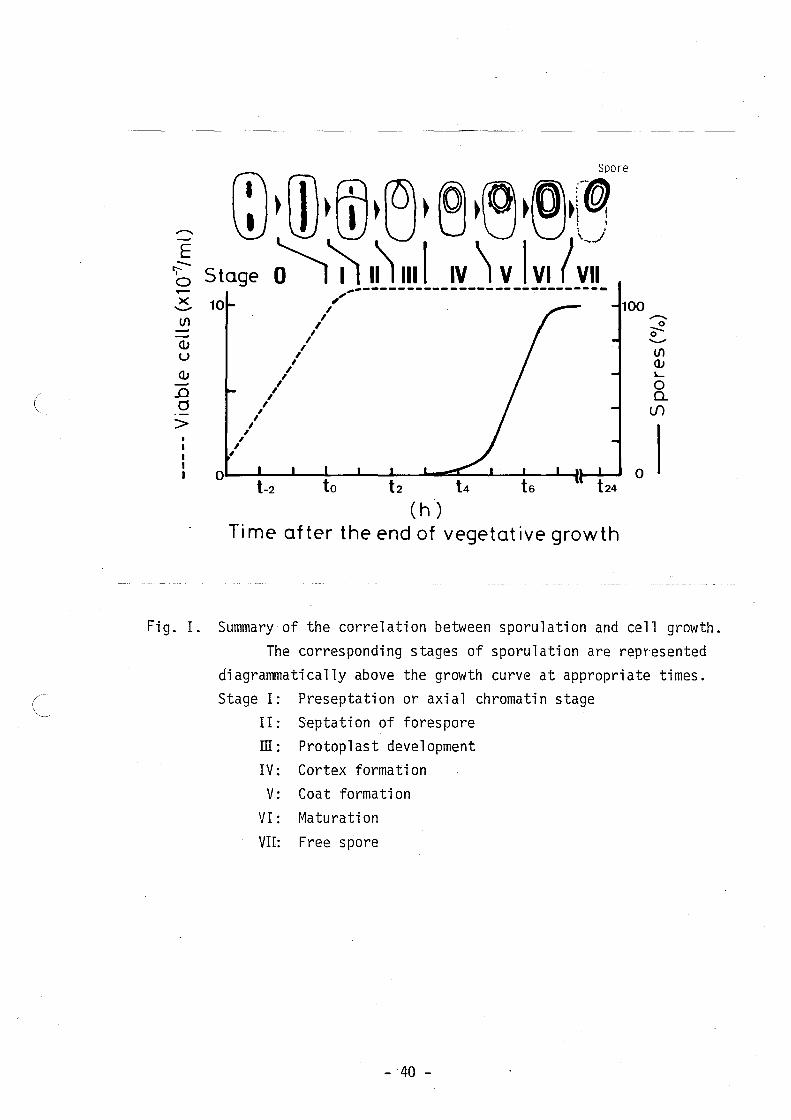
shown in Fig. 1 (1), cells of Bacillus species differentiate to
spores in about 8 h after the end of vegetative growth in a sporu
lation medium. Sporulation was divided into seven stages on the
basis of biochemical and morphological changes. In addition, during
sporulation a number of substances such as antibiotics, and alka}ine
and neutral proteases are produced and excreted by the cells (2-4).
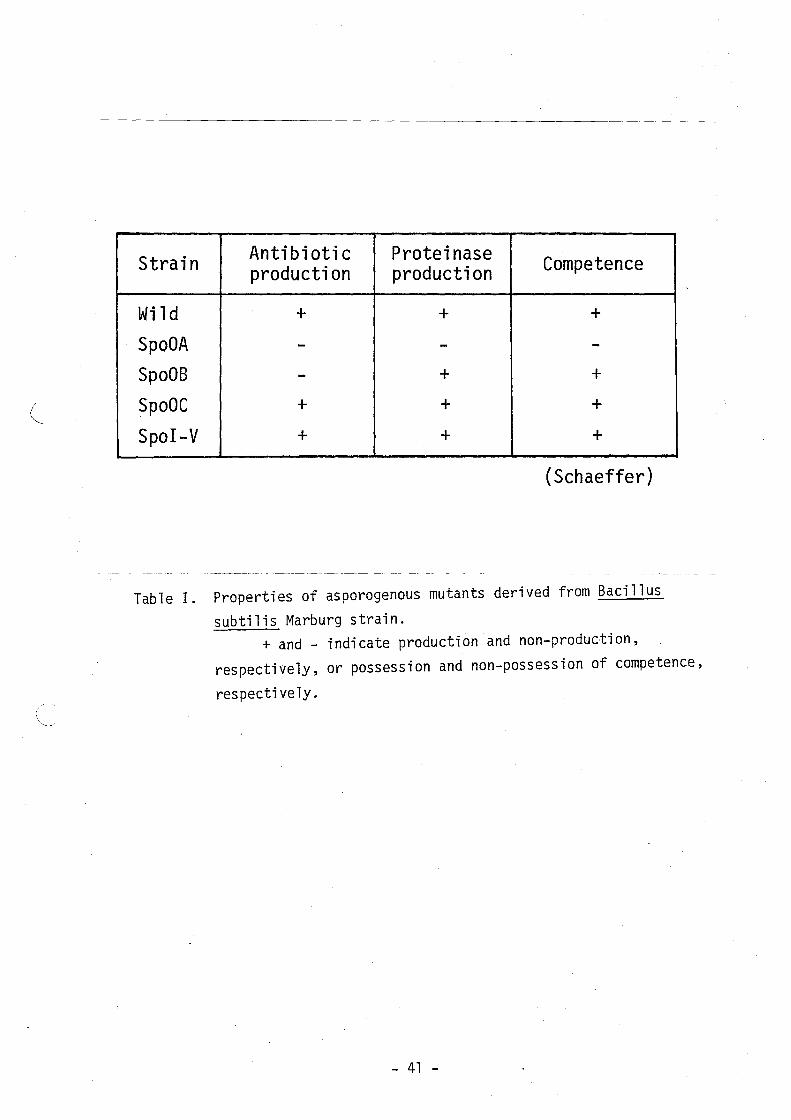
Schaeffer (~) isolated many asporogenous mutants of Bacillus subtilis
Marburg strain, and grouped these mutants on the basis of the
producibility of antibiotics and protease~, and competence, that is,
a potency to be transformed with DNA, as shown in Table I. Of these
mutants, cells with spoOA and spoOB mutation, of which genes were
thought to be involved in the initiation or an earlier process of
sporulation, were found to be non-producer of antibiotics as well as
of spores. From this result, Schaeffer suggested the possible
correlation between the production of antibiotics and sporulation.
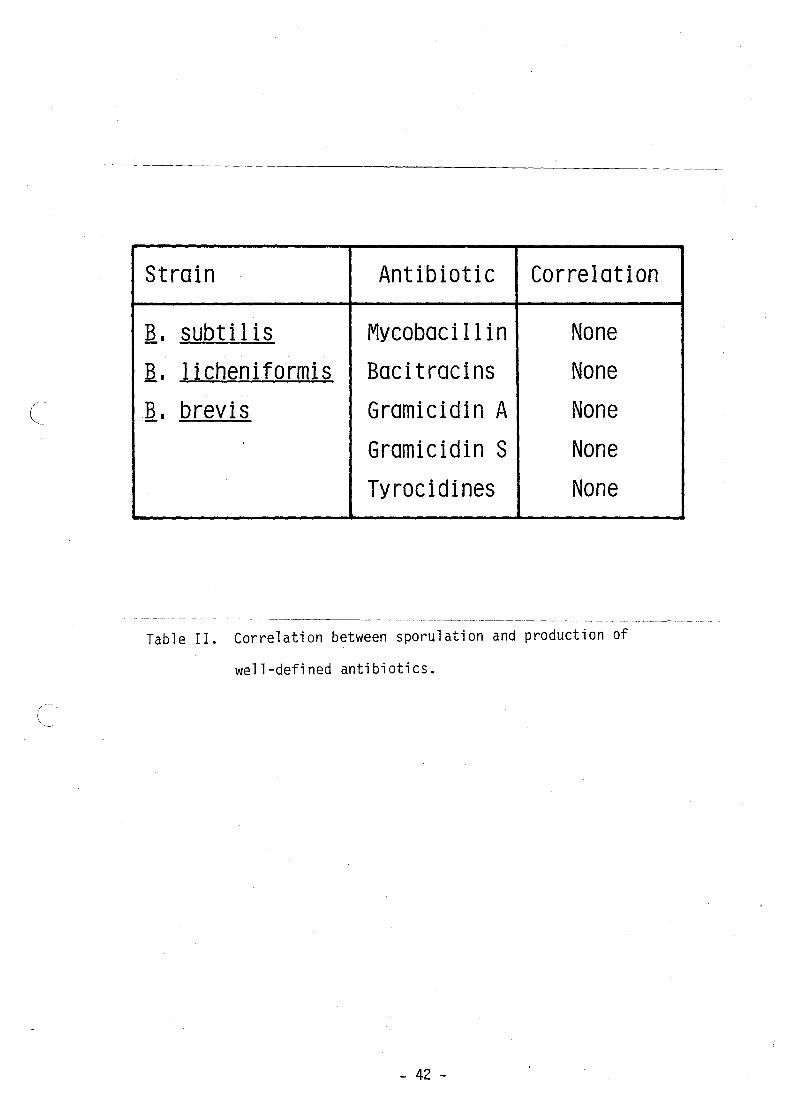
The correlation between the formation or its physiological function
of the well-defined antibiotics such as bacitracins~ mycobacillin,
gramicidin S, tyrocidines, or gramicidin A, and sporulation have been
studied extensively by many workers (cf 4, 6). In some cases,
- 5 -
results that favor a function of antibiotic in sporulation were
obtained as reported by Ristow and Pau1as (2): Gramicidin A and
tyrocidines promoted spore formation of the producer organism, but in
others, the results that there was no direct cause and effect
relationship between antibiotics and sporulation as shown in Table II
were obtained. On the basis of the consideration of the-work thus
far reported, the use of a Marburg strain of Bacillus species,
Bacillus subti1is 168, which is the most well-characterized strain,
genetically and biochemically, among members of genus Bacillus and
has been used extensively for the study of sporulation of bacterial
cells (8-10), was thought to be most desirable for complete 1
elucidation of the correlation between the production and the
physiological function of antibiotics and sporulation, though there
are little information about antibiotics produced by this strain.
The close correlation between antibiotic production and spore
formation in the Marburg strain of ~. subti1is has been reported by
Ba1assa et~. (ll), Schmitt and Freese (~) and Spizizen (ll). + .
Schaeffer (~) reported that in the crude filtrate of the Spo culture
three distinct antibiotics were present. Schmitt and Freese (12)
observed that there is no antibiotic activity during exponential
growth, but that it greatly increases during the developmental
period. They distinguished three major and two minor antibiotic
components by thin-layer chromatography and column chromatography on
Sephadex LH-20. However, none of them has been isolated or
characterized further.
Recently, Freese and coworkers (14) have demonstrated that in
- 6 -
~. subtilis 168 sporulation can be intiated in the presence of excess
glucose by conditions causing a partial deprivation of purine, in
particular guanine nucleotides. In addition, by using such
conditions they showed that some phenomena which accompany
sporulation is not essential for sporulation itself. Their device
permited to study more substantially sporulation phenomena.
Considering these facts, the author has attempted to study
antibiotics produced by Bacillus subtilis 168. This thesis describes
the isolation and structural analysis of subtilosin A, which is a new
antibiotic peptide with a molecular weight of about 3400 and produced
at the end of vegetative growth in the sporulation medium. Some
properties, including the correlation with sporulation, are also
discussed.
- 7 -
MATERIALS AND METHODS
Materials -- The sources of materials used in this work were as
follows: Nutrient broth, tryptone, yeast extract, vitami'n assay
casamino acids, and Bacto-agar from Difco laboratories; pre-coated
TLC plates silica gel (5715 ,5721,11845 and 5745) from E. Merck;
analytical TLC precoated plates KC 18 from Whatman Inc.; Sephadex
LH-20 and -60 (40-120 ~m) and SP-Sephadex C-25 (40-120 ~m) from
Pharmacia Fine Chemicals, Inc.; EKICRODISC 13 from Gelman Sciences
Japan, LTD; morpholinopropane sulfonate and 2-(N-morpholino)
ethanesulfonic acid monohydrate (MES) from Dojindo Laboratories;
fluorescamine from Hoffmann-La Roche Inc.; rifamycin SV sodium salt
(B grade) from Calbiochem-Behring; chloramphenicol from Sankyo, Co.,
LTD.; proline-specific endopeptidase from Seikagaku Kogyo Co., LTD.;
a-chymotrypsin and carboxypeptidase A-DFP from Sigma Chemical Co.;
thermolysin from Nakarai Chemicals, LTD.; dansyl chloride, phenyl
isothiocyanate (PITC) and 5,5 1 -dithio-bis(2-nitrobenzoic acid) (DTNB)
from Wako Pure Chemical Industries; hydrazine (anhydrous),
aminopeptidase M and 4-N,N-dimethylamino-azobenzene-4 1 -isothiocyanate
(DABITC) from Pierce Chemical CO.; carboxypeptidase Y from Oriental
Yeast Co., LTD.; polyamide layer sheets from Cheng Chin Trading Co.,
LTD.; liquid chromatography columns, Yanapak ODS-T (4 x 250 mm, 10
~m) from Yanagimoto MFG. Co., LTD. and Chemcopak (4.6 x 250 mm, C8' 7
~m, and C18 ' 5 ~m) from Chemco Scientific CO., LTD. Decoyinine U-
7984 was a gift from Dr. Joseph E. Grady of the Upjohn Co. and
Achromobacter protease I was supplied by Dr. Kazuo Fujikawa of
- 8 -
University of Washington. All other chemicals were obtained
commercially. Solvents for sequencing were of sequencing grade.
Acetonitrile and 2-propanol were of high performance liquid chromato
graphy (HPLC) grade.
Bacterial Strains --- B. subtilis 168 obtained from Dr. S. Okubo
was used as a producer organism of subtilosin A. Other B. subtilis
sporulation mutants tested for the production of subtilosin A were
obtaind from Drs. J. Spizizen and P. Schaeffer as described previ
ously (15).
Media --- Nutrient sporulation medium (NSM) is 2x SG medium of
Korch and Doi (16) except that it contained double strengths of
nutrient broth and glucose. S6C medium is the same as that described
by Freese et~. (l!) except for the omission of methionine. S6CG
medium contained 1% glucose. LB medium contained 10 9 of tryptone, 5
g of yeast extract, 5 g of NaCl supplemented with g of glucose per
liter, pH being adjusted to 7.0 with NaOH. LB agar and soft agar
were supplemented with 1.5% and 0.7% agar, respectively.
Thin-layer Chromatography and Detection of Subtilosin ~--
Subtilosin A was chromatographed on the following thin-layer plates
with solvent systems A, Band C.
(1) Silica gel plates (Merck 5715, 11845 or 5745, 200 x 200
mm) with Solvent System A (CHC1 3 : CH 30H : H20 = 60 25:
4, v/v)
- 9 -
(2) Silica gel plates (Merck 5721,200 x 200 mm) with
Solvent System B (CHC1 3 : DMFA H20 = 50 : 44 : 6, v/v)
(DMFA denotes dimethy1formamide)
(3) Reversed-phase plate (Whatman KC 18 , 200 x 200 mm) with
Solvent System C (CH30H : H20 = 70 : 30, v/v)
Subti10sin A on silica gel plates was detected by UV, f1uorescamine,
the Ehr1ich ' s reagent, and bioautography with Bacillus amy101ique=
faciens H as an indicator organism according to the method of Schmitt
and Freese (12). The Rf values were found to be around 0.5 and 0.65
on silica gel plates with the solvent system A and B, respectively,
and 0.2 on the reversed-plate with the solvent system C.
Quantitative Analysis of Subti10sin ~-- An appropriate amount
of culture removed at intervals was mixed with one fourth volume of
n-butano1 and vortexed for a few minutes. The organic phase was
removed and centrifuged. One mil1i1iter of the supernatant solution
was evaporated to dryness. The residue was dissolved in 1 m1 of 20%
acetonitrile in 0.1% trif1uoroacetic acid (TFA) and filtered through
a EKICRODISC 13. The filtrate was subjected to HPLC (Yanaco liquid
chromatograph L-4000W) on a reverse-phase column (C18 , 10 pm, 4 x 250
mm) equilibrated with 0.1% TFA. The elution was carried out with 40
ml acetonitrile with a linear gradient from 55% to 65% in 0.1% TFA at
a flow rate of 1.5 m1/min and monitored with a Yanaco UV detector
S-310A at 280 nm. Subti10sin A was eluted at 58% acetonitrile in
0.1% TFA. The amount of subtilosin A was estimated from the absor
bance at 280 nm, using the molecular extinction coefficient of trypto-
- 10 -
phan 5690, because subtilosin A contains one residue of tryptophan
per mol.
Fast Atom Bombardment (FAB) Mass Spectrometry -- The molecular
weight of subtilosin A was determined in a double focusing mass
spectrometer (Jeol JMS-HX100) equipped with an FAB ion source and a
mass data analysis system (Jeol JMA-3l00 or DA-5000). Typical
experimental conditions were carried out with a xenon atom beam
source at 7-keV accelerating potential. Mass assignment was made
using a mixture of CsI and KI as a mass reference. A sample solution
containing 15-40 ~g of subtilosin A was loaded on a stainless steel
plate and mixed with glycerol and a-thioglycerol on the plate.
Analyses of Amino Acid Composition and Sequence-- (1) Amino
acid analyses: Amino acid analyses of peptides were performed on an
amino acid analyzer (Hitachi 835-S) after hydrolysis with constant
boiling HCl containing 0.2% phenol in evacuated, sealed tubes at
1100C for 24 h. No corrections were made for the destruction of
amino acids during acid hydrolysis. Cysteine residues were deter=
mined as cysteic acid after oxidation of a sample with performic acid
(17). Tryptophan residues were determined after hydrolysis of a
sample with 4 M methane sulfonic acid containing 0.2% 3-(2-amino
ethyl)indole (18) .
. (2) Methylamine treatment, reduction and carboxymethylation:
Because reduction and S-carboxymethylation of subtilosin A could not
- 11 -
be achieved sufficiently by the standard method of Crestfield et ~.
(19), the following modification was devised. Subtilosin A was
dissolved in methanol containing 40% methylamine and kept at room
temperature for 1.5 h. After evaporation of the solvent, the method
of Crestfield et al. (19) was followed. Salt was removed by gel
filtration on Sephadex G-10 with 0.1% formic acid as a solvent.
(3). Partial acid hydrolyses: Reduced and S-carboxymethylated
(RCM) subtilosin A (2.55 mg) was dissolved in 1 ml of 50% acetic acid
containing 30 mM HCl and hydrolyzed at 1050C for 12 h. Intact
subti10sin A (3 mg) was dissolved in 0.3 m1 of iron-free concentrated
HCl and hydro1yzed at 370C for 17 h.
(4) Digestion of RCM-subti1osin ~ with proteases: Samples, 1.5
mg and 0.2 mg, were dissolved in 1 m1 and 0.2 m1 of 0.1 M NH 4HC03 containing 10 mM CaC1 2, pH 8.1 and digested with 50 ~g of chymo=
trypsin at 370C for 6 h and with 10 ~g of thermo1ysin at 600C for
h, respectively.
(5) Digestion of performic acid-oxidized subti10sin ~ with
Achromobacter protease l: Two samples (1.4 mg each) were dissolved
in 0.14 m1 of 0.1 M NH4HC03 containing 10 mM CaC1 2. One sample was
digested with 28 ~g of Achromobacter protease I at 370C for 2 hand
the other with 3.5 ~g of the enzyme at 370C for 45 min.
- 12 -
(6) Peptide isolation: The digests or the hydro1yzates were
applied to HPLC on reverse-phase columns (CB' 7 ~m; C1B , 10 ~m or
5 ~m) and peptide fragments were eluted with concentration gradients
of acetonitrile in 0.1% TFA, or of a 7:3 mixture of 2-propano1 and
acetonitrile in 0.1% TFA. The amino (N)-termina1 fragments yielded
by chymotryptic or thermo1ysin digestion were isolated as f1ow
through fractions of ion-exchange chromatography on an SP-Sephadex
C-25 column (12 x 50 mm) with 25 mM phosphoric acid as a solvent and
purified by HPLC.
(7) Sequence determination: The dansy1-Edman procedure was
performed as described by Chen (20) and Kimura (~). The DABITC/PITC
double coupling method of Chang et~. (~) modified by A11en (23)
was used. Digestion with carboxypeptidase A was performed on about
100 nmo1 of performic acid-oxidized samples in 100 p1 of 0.2 M N
ethy1morphorine acetate buffer, pH B.5. Carboxypeptidase A was used
at an enzyme to substrate ratio of 1 : 23 by weight and incubation
was at 37oC. Digestion with carboxypeptidase Y was performed on
samples dissolved in 20 mM sodium phosphate buffer, pH 6.4, at a
concentration of 0.1% (w/v). The enzyme to substrate ratio was 1
50 by weight and incubation was at 37oC. After lyophilizing, the
digests were directly applied to an amino acid ana1yzer.
(B) Titration of thio1 groups: Dried subti10sin A was
dissolved in anhydrous hydrazine, left at room temperature for 5 min,
evaporated to dryness and titrated with DTNB according to the method
- 13 -
.'. of Kortt and L i u (24).
Isolation of Fragments with ~ Cross-linking Structure: Intact
subtilosin A (1 mg) was suspended in 1.6 ml of 0.1 M MES buffer, pH
6.5, containing 10 mM CaC1 2, and digested with 255 ~g of thermolysin
at 370 C for 75 h. The fragments with a cross-linking structure were
isolated from the digests by reverse-phase HPLC, and then dissolved
in 50 ~l of 50 mM sodium phosphate buffer, pH 6.5, and subjected to
additional digestion with 60 ~g of proline-specific endopeptidase at
370C for 17 h. After digestion, fragments were isolated by reverse-
phase HPLC.
- 14 -
RESULTS
Selection of an Indicator Strain for Bioassay of Antibiotics
Produced by Bacillus subtilis 168 Because antibiotics are
well-known to have antibiotic spectra characteristic to themselves,
an indicator strain suitable for bioassay of antibiotics produced by
Bacillus subtilis 168 was selected. LB-soft agar cultures containing
fresh cells of various bacteria were overlaid on the colonies of B.
subtilis 168 grown on Schaeffer's agar medium plates, and the plates
incubated at 370C overnight. By inspection of the size of the growth
inhibition zones formed around the colonies, Bacillus amylo
liqefaciens Hand Staphylococcus aureus were found to be more
sensitive than the others examined. The growth inhibition zone of B.
amyloliquefaciens H was clear, whereas that of ~. aureus was turbid.
Because it is a non-pathogenic microbe, in addition to the
sensitivity and the convenience to define the boundary of growth
inh,bition zones, B. amyloliquefaciens H was selected as an indicator
strain.
Selection of The Medium and Production of Antibiotics by ~.
subtilis 168 --- In preliminary experiments with several media,
including sporulation and non-sporulation media, it was found that
the patterns of antibiotic produced by this strain were dependent on
the nature of the media used. One of the purpose of this work is to
examine the correlation between the production of antibiotics and
- 15 -

sporulation in ~. subtilis 168, so that a sporulation medium
designated as NSM was selected for the production of antibiotics.
This medium was derived from the schaeffer's sporulation medium. NSM
contained twice as much nutrient broth and glucose as the 2 x SG
medium of Korch and Doi (16). The modifications lead to the increase
of the number of cells and the amounts of antibotics produced, but
practically no change of the pattern of antibiotic production was
observed under sufficient aeration.
As shown in Fig. 2, ~. subtilis 168 produced more than 10 anti
biotics in NSM. If some antibiotics have an effect on spore
formation, they should be produced before the appearence of spore,
that is, by 8 h after the end of vegetative growth. Accordingly, a
major antibiotic which was produced at 4-8 h, and had the Rf value of
about 0.7 in this bioautogram was selected as the subject of the
research. This antibiotic was designated as subtilosin A.
Isolation of Subtilosin A --As shown by the diagram in Fig. 3,
two methods (Method A and B) were used for the isoltion of sUbtilosin
A, but the first three procedures of both methods were identical.
Unless otherwise stated, operation was performed. at room.temperature.
Cell growth was monitored by using Klett-Summerson colormeter with
No. 66 filter.
Cells of B. subtilis 168 were inoculated from an overnight
culture in LB-broth into a culture tube containing 30 ml of LB-broth,
and incubated at 370C in a water bath on a reciprocal shaker at a
speed of 120 strokes per minute. When the turbidity of cells
- 16 -
attained 170 K1ett units, 1 m1 each of the culture was transferred
into ten 2-1iter Erlenmeyer flasks containing prewarmed 350 m1 of
NSM. Culture was incubated at 370 C on a New Brunswick rotatory
shaker model 25 with vigorous shaking until 5 h after the end of
vegetative growth, when the .leve1 of subtilosin A reached the maximum.
To the culture was added one fourth volume of n-butano1. The
mixture was emulsified vigorously for 1 h and allowed to stand
overnight at room temperature. The butanol layer was removed and
evaporated to dryness under reduced pressure. The residue was
dissolved in a minimum volume (less than 6 m1) of methanol and
applied to a 2 x 47 cm column of Sephadex LH-20 equibrated with
methanol. Elution was performed with methanol at a flow rate of 120
m1/h. Fractions of 3 m1 were collected. Figure 4 shows the results
of the Sephadex LH-20 column chromatography of the butanol extract.
Subtiso1in A eluted in the void fractions of this column chromato
graphy vias separated ft'om most of other UV absorb; ng materi a 1 sand
antibiotics. To remove the antibiotic substances still contaminating
in the subtilosin A fractions, the void fractions were concentrated
~ vacuo, and applied to one preparative TLC plate (Merck 5745) of
silica gel followed by development with the solvent system A. After
chromatography, subti10sin A fractions were scraped out from the
plate, and extracted with methanol and concentrated in vacuo.
Thin-layer chromatography on a silica gel plate (Merck 11845) with
the solvent system A of the sample thus prepared revealed that there
were still two minor UV absorbing impurities; one migrating in front
of and the other trailing subti10sin A. They had no antibi10tic
- 17 -
activities against ~. amy1o1iquefaciens H, and were negative for the
reaction with the Eh1rich's reagent. Therefore, the samples were
further purified by two kinds of method as follows: Method A; after
thin-layer chromtography on four silica gel plates (Merck 11845) with
the solvent system A, subti10sin A fractions were passed through a
84.5 x 1.6 cm column of Sephadex LH-60 equilibrated with methanol.
Elution was carried out with methanol at a flow rate of 32 m1/h.
Fractions of 2 m1 were collected. The e1uates were monitored at 280
nm. In addition, the samples were chromatographed on three silica
gel plates (Merck 5721) with the solvent system B and on Sephadex
LH-60 column in the same manner as above.
Method B; the subti10sin A fractions obtained from the first
TLC were chromatographed on 'three reversed-phase TLC plates with the
solvent system C and on a Sephadex LH-20 column as above.
Table III shows the summary of isolation of subti10sin A by
both methods. Subti10sin A thus obtained was homogeneous in HPLC on
a reverse-phase column as shown in Fig. 5 and in mass spectrometry
(data not shown). The concentration of subti10sin A in the culture
was about 8 mg per liter, and the overall yield of the method A and B
were 2 mg and 5.5 mg, respectively, from one 1iter of culture, or 25%
and about 70%, respectively.
Later, in the small scale preparation, sUbti10sin A was found
to be remarkably purified from the butanol extract by one reverse
phase HPLC. Figure 6 shows the chromatogram of the reverse-phase
HPLC of the butanol extract.
- 18 -
Properties of Subti10sin ~ -- Subti10sin A is a hydrophobic
peptide as evidenced by its elution at 58% acetonitrile in 0.1% TFA
on a reverse-phase co1umun (C 18 ) in HPLC (Fig. 5). It is soluble in
methanol, glacial acetic acid, 70% formic acid, dimethylsu1foxide,
but not in non-polar organic solvents such as ether or hexane. It is
soluble in alkaline solutions, but labile and decomposed gradually.
When subti10sin A was incubated in 0.1 M NH 4HC03 containing 10 mM
CaC12
, it was decomposed considerably in 17 h, and almost completely
in 38 h as shown in Fig. 7, whereas it was degraded little at pH 6.5.
However, the derivatives which were formed under the alkaline
conditions had the same amino acid composition as that of sUbti10sin
A and still the antibiotic activity. It is insoluble in acidic
solutions. Its solubi1ities in 0.1 M NH 4HC0 3 containing 10 mM CaC1 2 and 0.1 M MES buffer containing 10 mM CaC1 2 (pH 6.5) were more than
1.6 mg/m1 and less than 98.5 ~g/m1, respectively. SUbti10sin A gives
positive reactions with f1uorescamine and the Eh1rich ' s reagent, and
shows a bacteriocidal activity against gram-positive bacteria such as
Bacillus megaterium, ~. amy101iquefaciens and Streptococcus faecium
as shown in Table IV. It is also effective on B. subti1is 168 which
is the producer organism of subti10sin A, but not on fungi tested.
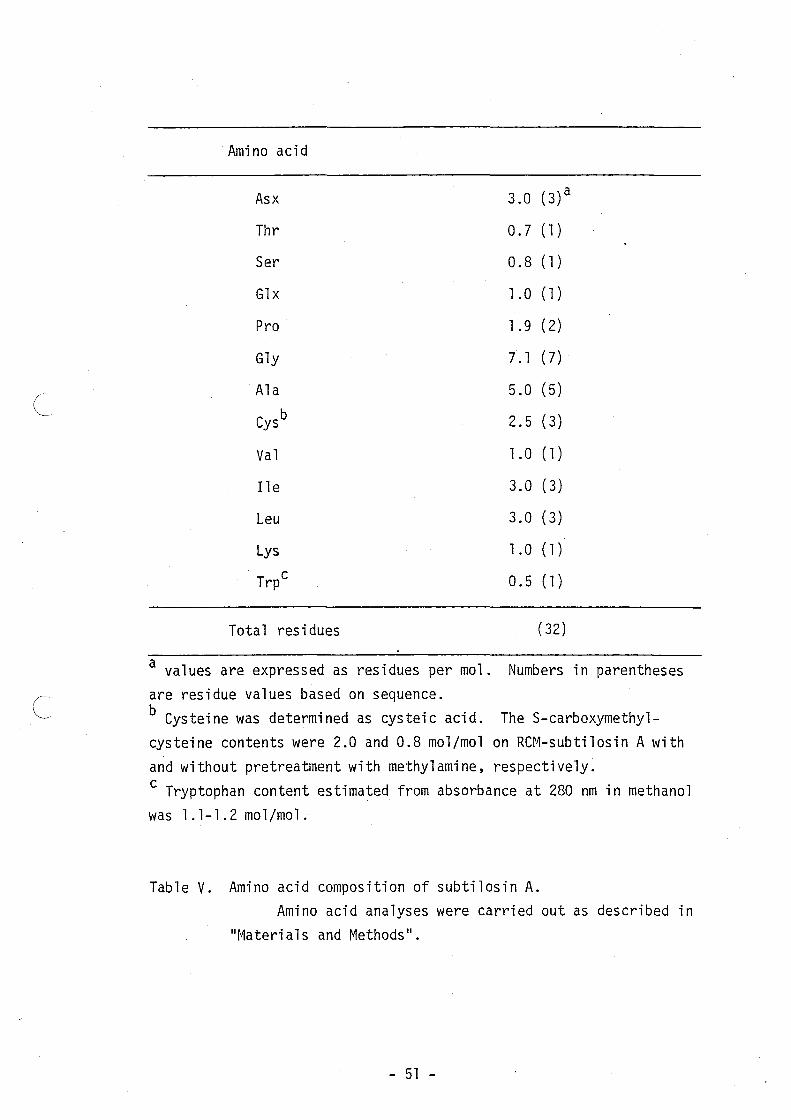
Structural Analysis of Subti10sin ~ -- Table V shows the amino
acid composition of subti10sin A. It consists of 32 amino acid
residues. Methionine, tyrosine, phenylalanine, histidine, and
arginine are missing. No unusual ninhydrin-positive peaks were found
in the amino acid analyses of performic acid-oxidized samples.
- 19 -
D-amino acids were not detected in acid hydrolyzates of subtilosin A
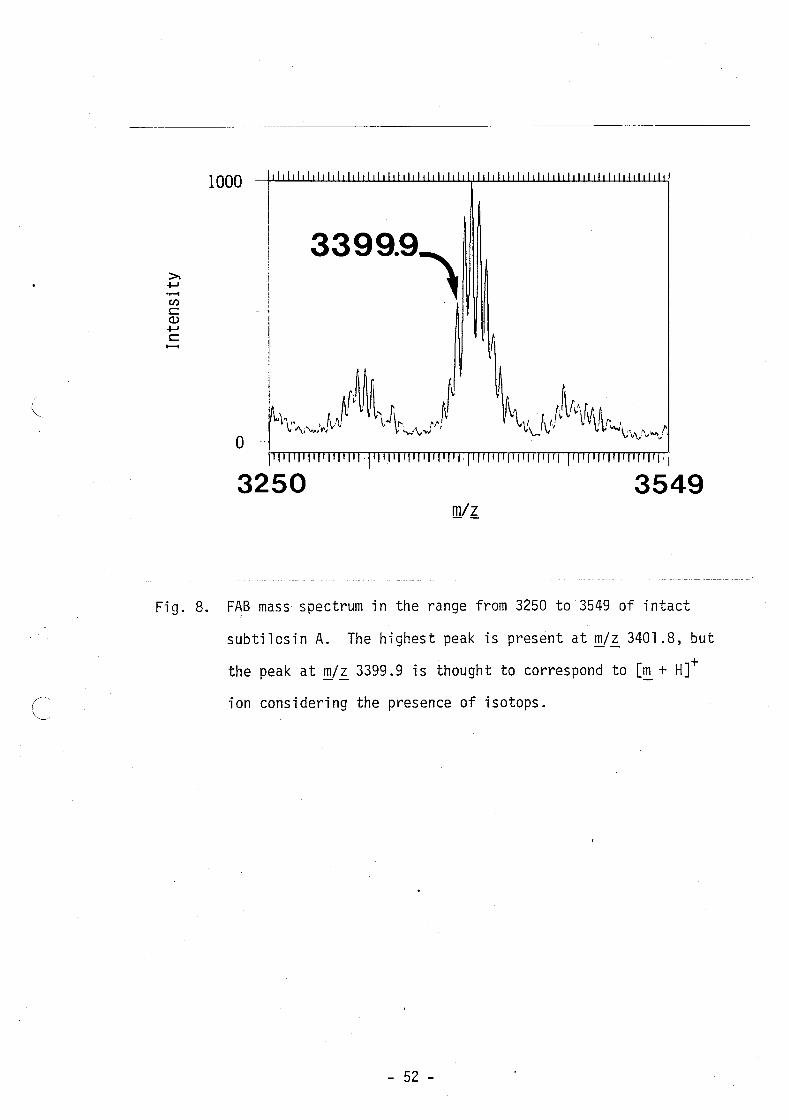
with D-amino acid oxidase (data not shown) (27). The FAB mass
spectrum of intact subtilosin A gave an intense signal at ~/~ 3399.9
as shown in Fig. 8 (~ and ~ denote a molecular weight and an electric
charge, respectively). Because the mass values of underivatized
peptides were observed as [~ + H]+ in the positive mass spectra, the
molecular weight of subtilosin A was estimated to be 3398.9. It was
by 369.5-373.4 larger than the theoretical values (3025.5-3029.4)
calculated from the amino acid composition. From this it was
inferred that subtilosin A possesses other constituents than amino
acids.
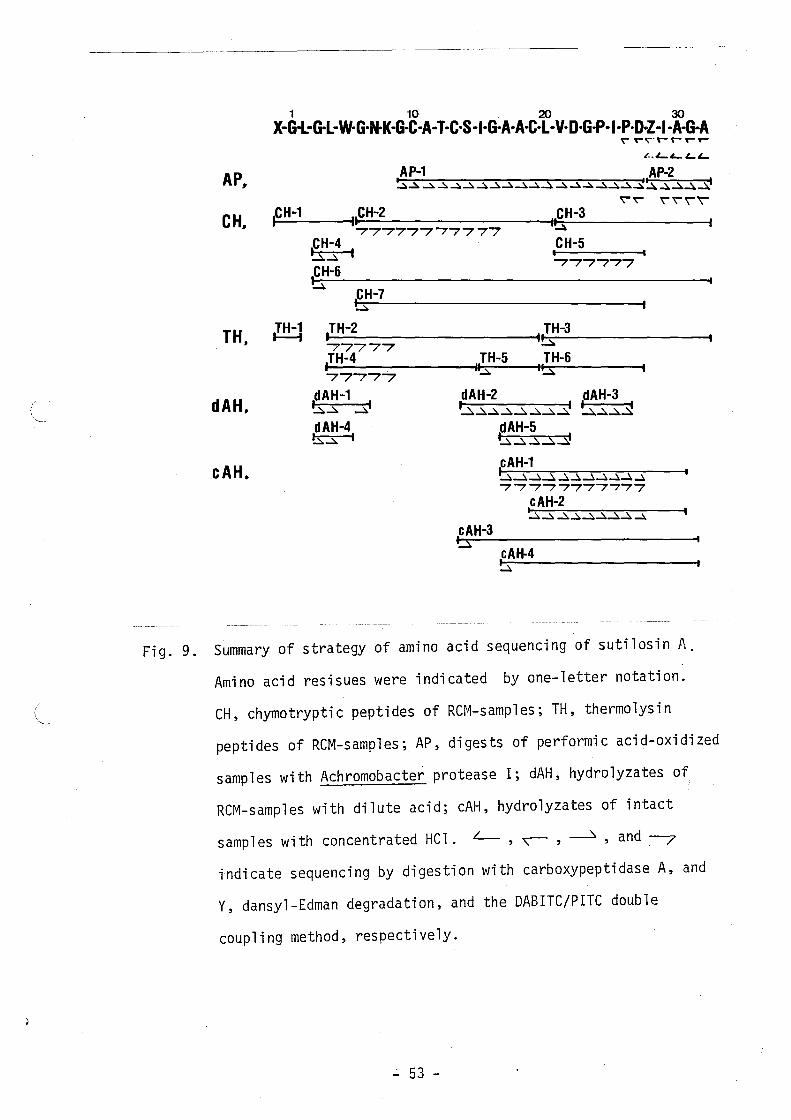
Figure 9 summarizes the strategy of amino acid sequencing of
the peptide portion. Because preliminary experiments indicated that
the N-terminal residue of this antibiotic was blocked, fragments with
free amino groups were first obtained by partial acid hydrolysis of
an intact sample with concentrated Hel, digestion of RCM-samples with
chymotrypsin or thermolysin, partial acid hydrolysis of an ReM-sample
with 0.03 M Hel in 50% aqueous acetic acid, or digestion of a
performic acid-oxidized sample with Achromobacter protease I. The
resultant fragments were purified by HPLC on a reverse-phase column.
The N-terminal fragments were independently isolated by HPLC from the
flow-through fractions from ion-exchange chromatography on a SP
Sephadex C-25 column of the chymotryptic and thermolysin peptides of
RCM-samples. Details of isolation of fragments were shown in
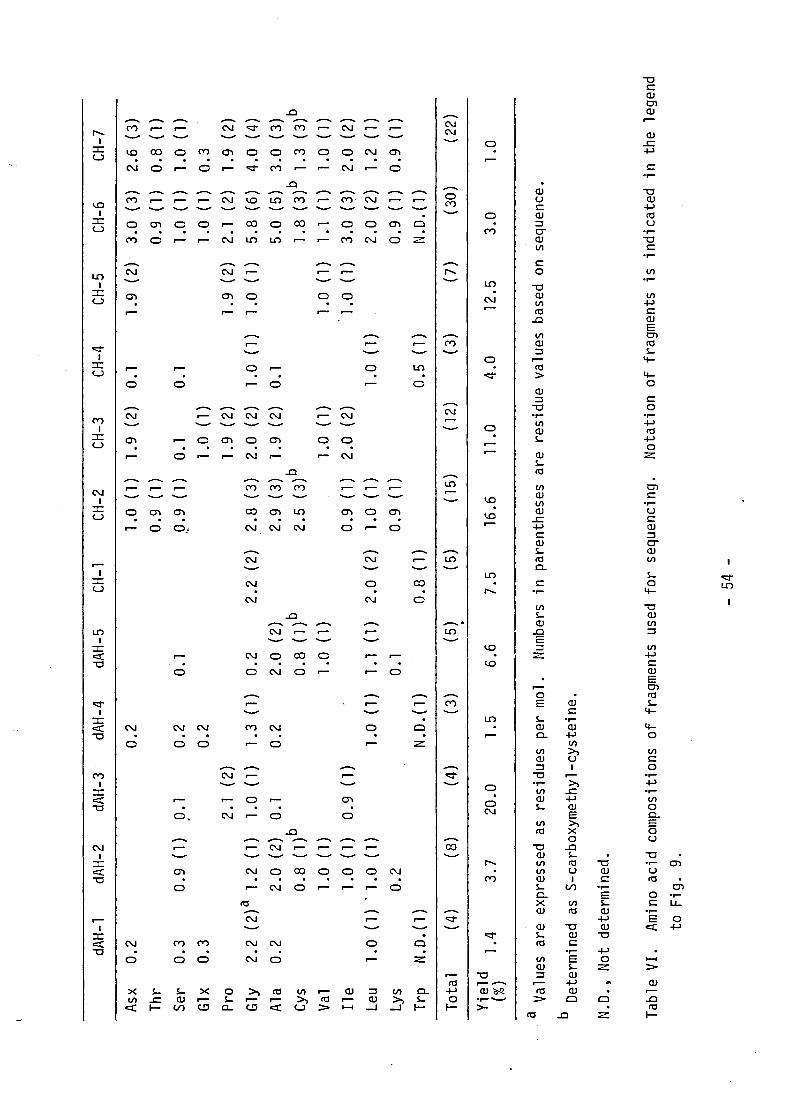
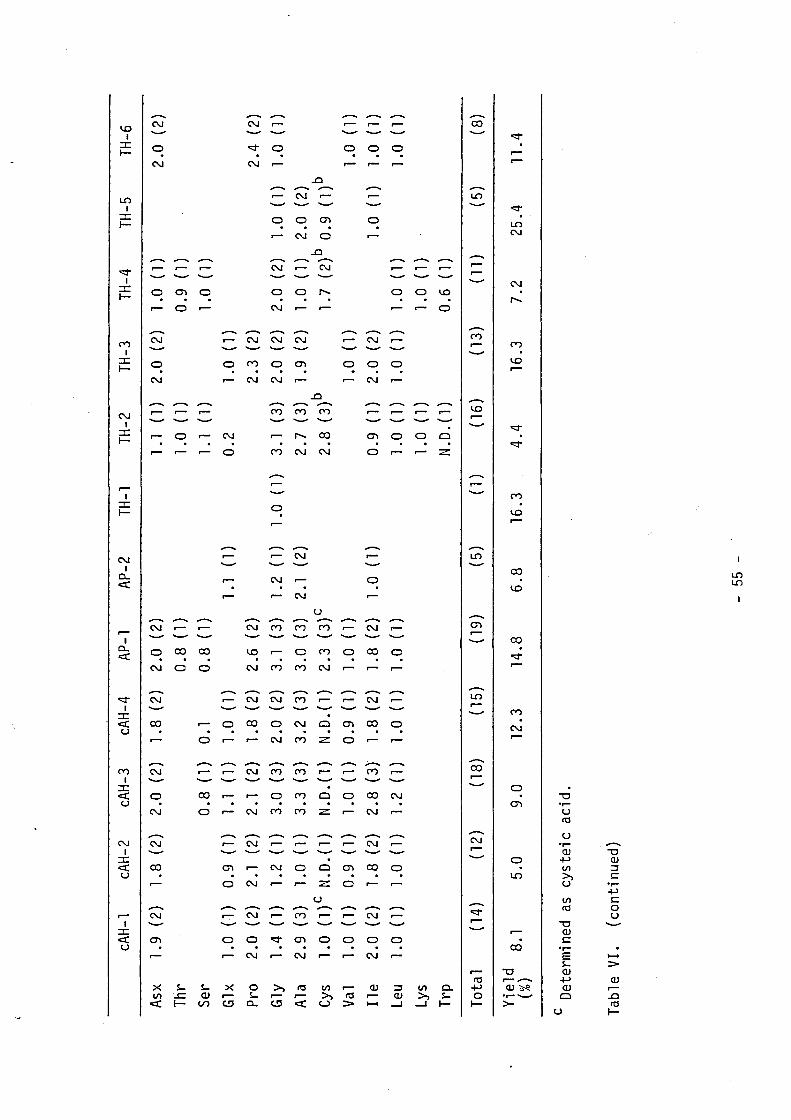
"Supplementary Materials". Table VI shows the amino acid composition
of the fragments used for sequencing. Sequencing of these fragments
- 20 -
by the dansy1-Edman method, the DABITC/PITC double coupling method
and the analysis with carboxypeptidase Y was repeated at least twice.
The carboxyl (C)-terminal sequence was also determined by digestion
with carboxypeptidase A or Y of performic acid-oxidized subti10sin A
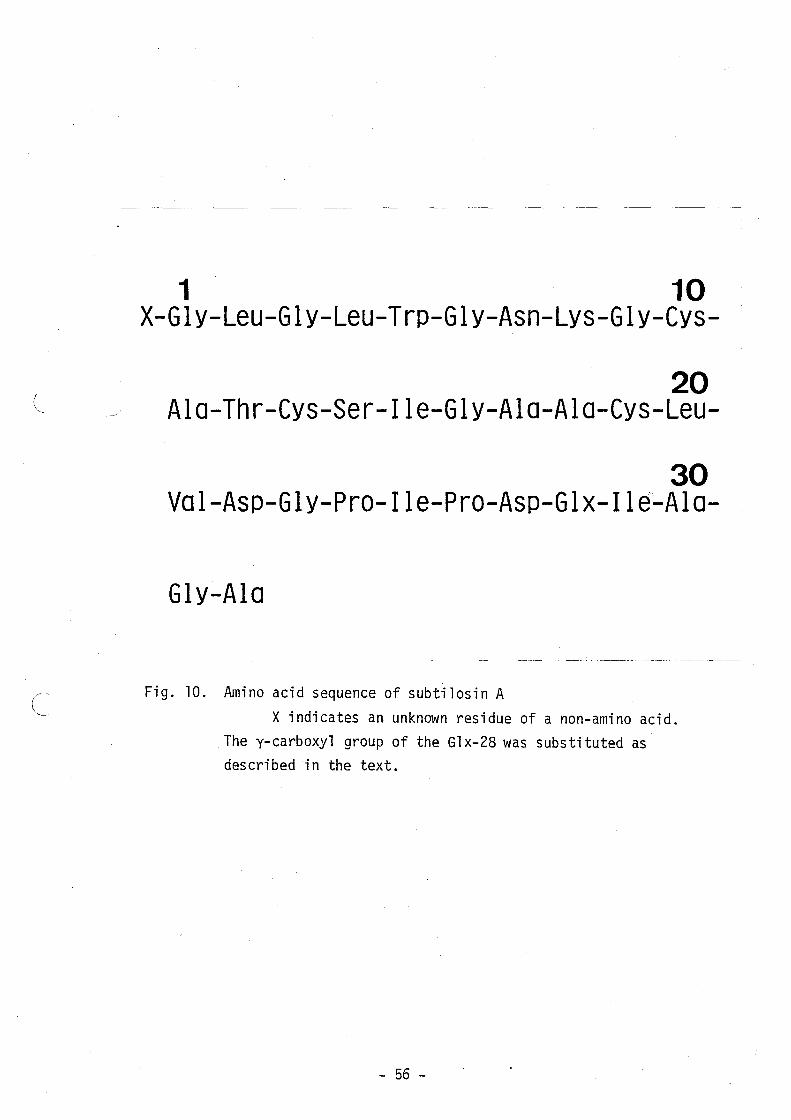
(Fig. 1S). As shown in Fig. 10, the complete amino acid sequence of
subti10sin A was constructed from the above results. It is a single
peptide with an N-b1ocked glycine residue at the N-terminus and with
an alanine residue at the C-terminus. The y-carboxy1 group of the
G1x residue at position 28 is substituted as will be described below.
Therefore, it was not possible to determine whether this residue was
derived from glutamic acid or glutamine.
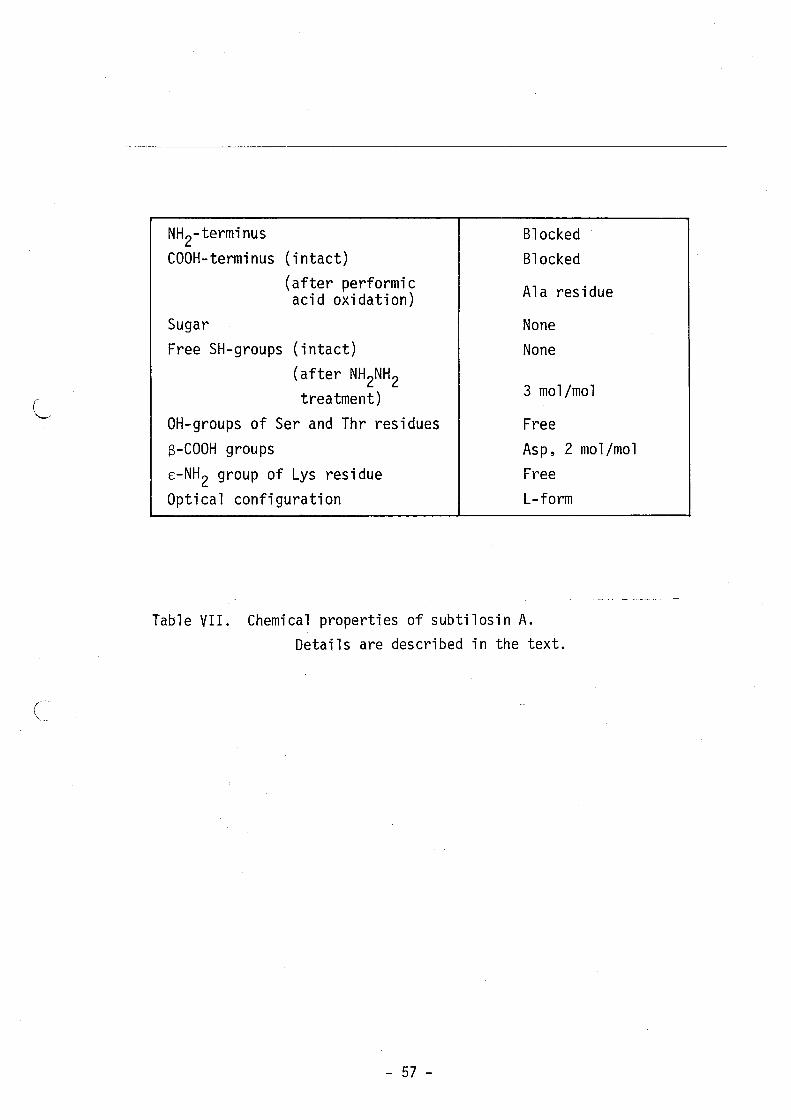
Table VII summarizes the results of preliminary analyses of the
possible modification of side chains of amino acid residues. The
OH-groups of Serine and threonine residues were not substituted,
because they were sensitive to oxidation with chromic acid (28).
Dansy1 chloride reacted with only the £-amino group of the lysine
residue. Two of the three Asx residues were concluded to be aspartic
acid by analysis of the sample which was esterified with methanol-HCl
followed by reduction with sodium borohydride (29). These results
were also confirmed by sequencing of the fragments containing the
relevant residues. As shown in Table V, subti10sin A has three
cysteine residues determined as cysteic acids, but no thio1 groups
were titrated with DTNB, whereas they all were alky1ated with
iodoacetic acid after reduction (Table VI, CH-2). When the total
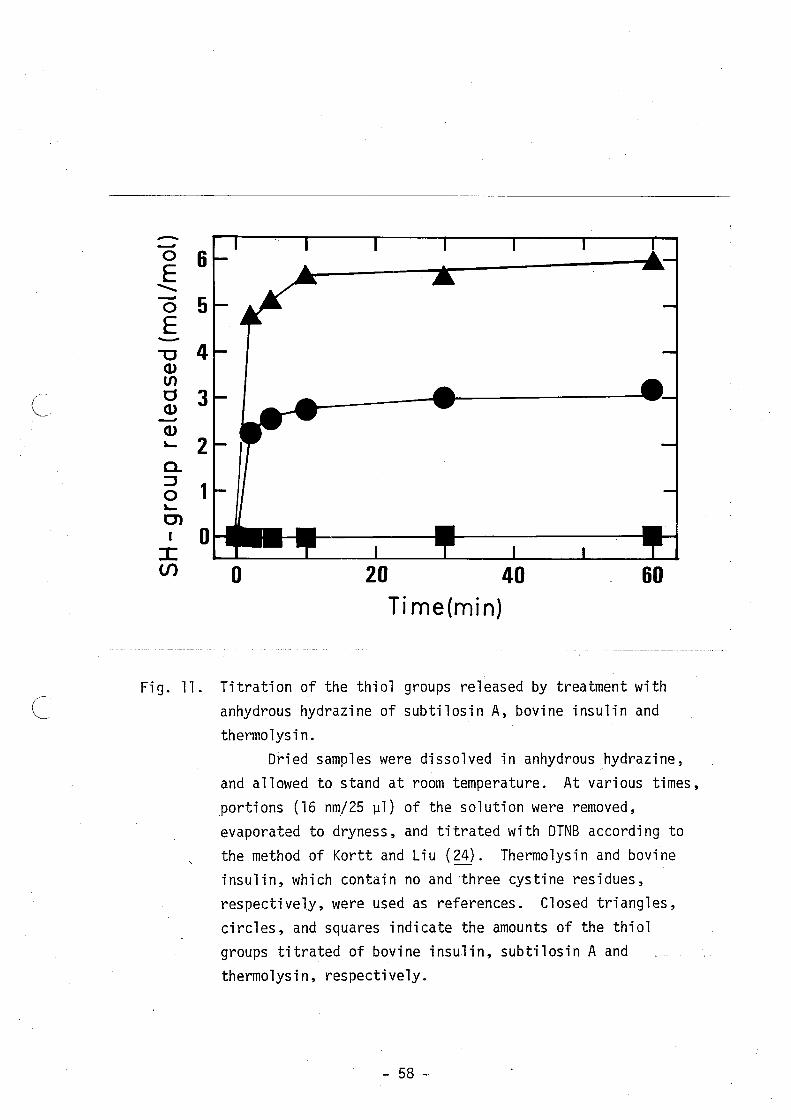
thio1 groups of this antibiotic were titrated with DTNB after
treatment with anhydrous hydrazine, it was found that there were
- 21 -

three thiol groups as shown in Fig. 11. These results suggest that
this antibiotic contains a modified cysteine residue in addition to
cystine.
To verify the speculation and locate the modified cysteine
residue, an intact subtilosin A was digested with thermolysin at pH
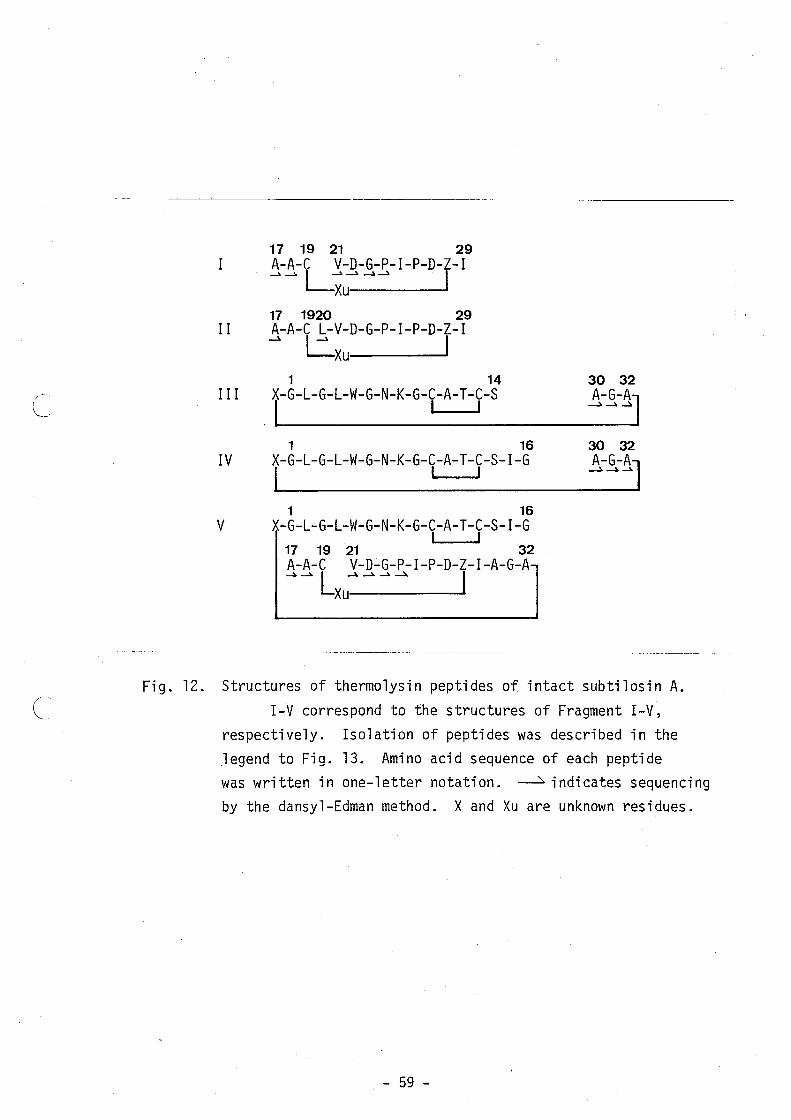
6.5. Five peptide fragments (Fig. 11), which were designated as
Fragment I-V, were obtained from the digests by reverse-phase HPLC
(Fig. 12). On the basis of the results of amino acid analysis (Table
VIII) and sequencing (Fig. 11), Fragment I and 11 were found to have
a novel cross-linking structure through the cysteine residue at
position 19, whereas Fragment III and IV indicated the possibility of
a linking between the N- and C-termini. Fragment V consisted of
three peptide fragments which linked with each other through two
cross-linking structures mentioned above.
The FAB mass spectrum of Fragment I gave two intense signals
(Fig. 14, I): A parent ion signal at ~~ 1362 and a fragment ion
signal around m/z 1101. This fragmentation in FAB mass spectrometry
will be considered below. The molecular weight of Fragment I was
estimated to be 1361 from the parent ion signal. This value was by
145-146 larger than what was accounted for by the amino acid
composition, suggesting that another constituent in addition to amino
acids was present. This unknown residue was designated as Xu.
To analyse the cross-linking structure in Fragment I and locate
Xu, further digestion of Fragment I with proline-specific endo
peptidase pH 6.5 was carried out. A peptide from the digests was
obtained by reverse-phase HPLC (Fig.15), and designated as Fragment
- 22 -
U. Based on the results of amino acid analysis and sequencing,
Fragment U was found to consist of two fragments, the fragment with
sequence from residue 17 through residue 19 Ala-Ala-Cys (chain A) and
the fragment with the sequence from residue 25 through residue 29
Ile-Pro-Asp-Glx-Ile (chain B). As shown in Fig. 16, the FAB mass
spectrometry of Fragment U again showed the fragmentation as
demonstrated in Fragment I, and gave a parent ion signal at ~/~ 994
and a fragment ion signal around ~/~ 733. From the parent ion signal
the molecullar weight of Fragment U was estimated to be 993, and
again by 145-146 larger than the theoretical value calculated from
the amino acid composition. From this result and amino aced
sequencing, Fragment U was infered to have a new cross-linking
structure which the Cys-19 linked with Glx-28 through XU with a
residue weight of 163. The fragment ion signal was of an irregular
form, and its observed mass value was by 261-263 smaller than that of
the parent ion signal. Since the molecular weight of chain A (Ala
Ala-Cys) is 263, the fragment ion signal is thought to correspond to
the fragment consisting of chain Band Xu, which was derived from
Fragment U by the cleavage of the Cys-Xu bond. The frag~entation in
the FAB mass spectrometry of Fragment I was thought to occur in the
same manner as above, because the observed mass value of the fragment
ion signal (m/z 1101) was by 261-263 smaller than that of the parent
ion signal (m/z 1362). As an example of fragmentation in FAB mass
spectrometry, splitting of the disulfide bonds of cystine residues
has already been reported (30).
To define which residue of chain B links with Xu, we digested
- 23 -
fragment U with aminopeptidase M, and analyzed its digests in FAB
mass spectrometry. As shown in Fig. 17, after incubation in 0.1%
NH4HC03 (pH 7.9) at 37°C for 4 h, fragment U gave new intense signals
at m/z 343, 406 and 748 in addition to signals at ~/~ 994 and 733,
suggesting that fragment U is labile under alkaline conditions. This
phenomenum was also found in an another fragment containing this
cross-linking structure under the same conditions. When subtilosin A
was digested with proteases under alkaline conditions, splitting of
the peptide bond between Asp-27 and Glx-28 was often encountered as
indicated by AP-l, CH-5 and -7, and TH-6 in Fig. 9. From this fact
and fragmentation in FAB mass spectrometry, the signal at ~~ 406 was
infered to correspond to [Glx(Xu)-Ile]+ ion. Figure 18 shows an FAB
mass spectrum of the digest of fragment U with aminopeptidase M in
0.1% NH4HC03 (pH 7.9) at 370 C overnight. Intense signals are present
at m/z 229, 344, 406,521, 538, 636 and 731, but the parent ion
signal at ~/~ 994 and the signals at ~/~ 343 and 748 are absent. The
signals at m/z 731, 521 and 406 are considered to be the fragment
ions in FAB mass spectrometry, which were formed by splitting of the
bond between Cys-19 and Xu, and to correspond to [Ile-Pro-Asp
Glx(Xu)-Ile]+, [Asp-Glx(Xu)-Ile]+ and [Glx(Xu)-Ile]+ ions, respective
ly. Whereas signals at ~/~ 229 and 344 are thought to indicate [Ile
Pro + H]+ and [I1e-Pro-Asp + H]+, respectively. The above results,
especially the presence of signals at ~/~ 344 and 406, indicate that
Xu with a residue weight of 163 is present between Cys-19 and G1x-28
as shown in Fig. 19.
The FAB mass spectra of Fragment III and IV showed intense
- 24 -
signals ~/~ 1809.9 and 1979.8, respectively (Fig. 14, III and IV).
No fragment ion signal was detected in both the FAB mass spectra as
described in those of Fragment I and U. The molecular weights of
both Fragment III and IV were 227.9 larger than the theoretical
values calculated from the amino acid compositions. From the amino
acid compositions and sequencings of these fragments, the N-terminus
was suggested to link with the C-terminus, though the possibility
that the C-terminus does not link with the N-terminus but with the
Cys-10 and -13 residue as was seen in the cross-linkng structure of
Fragment U cannot be excluded. However, from the concentrated HCl
hydrolyzates of intact sUbtilosin A, fragments which had a Gly
residue at the N-terminus and consisted of four residues as shown in
Fig. 19 were obtained, though the yields of fragments were so low as
about 2%. From the amino acid compositions and N-terminal analysis,
these fragments are considered to be composed of the peptide with the
N-terminal sequence of residues 1 and 2 and the peptide with the
C-terminal sequence of residues 31 and 32. Therefore, I concluded
that the N-terminus linked with the C-terminus. That C-terminus of
intact subtilosin A was substituted was also suggested because no
amino acids were detected when C-terminal analysis of intact
subtilosin A was performed by the hydrazine method (31).
Consequently, from the above results the primary structure of
subtilosin A was deduced as shown in Fig. 20.
Production of Subtilosin ~ in Relation to Sporulation --- Since
many reports on the correlation between the production of antibiotics
- 25 -
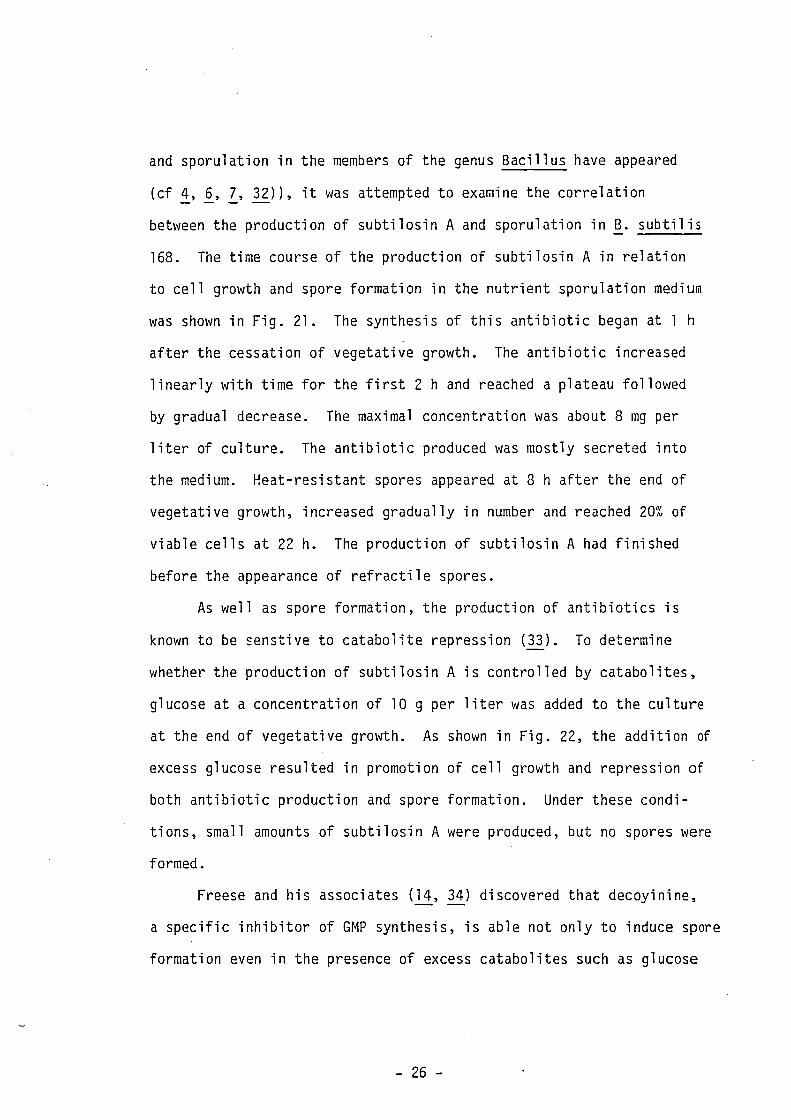
and sporulation in the members of the genus Bacillus have appeared
(cf ±, ~, i, ~)), it was attempted to examine the correlation
between the production of subtilosin A and sporulation in ~. subtilis
168. The time course of the production of subtilosin A in relation
to cell growth and spore formation in the nutrient sporulation medium
was shown in Fig. 21. The synthesis of this antibiotic began at 1 h
after the cessation of vegetative growth. The antibiotic increased
linearly with time for the first 2 h and reached a plateau followed
by gradual decrease. The maximal concentration was about 8 mg per
liter of culture. The antibiotic produced was mostly secreted into
the medium. Heat-resistant spores appeared at 8 h after the end of
vegetative growth, increased gradually in number and reached 20% of
viable cells at 22 h. The production of subtilosin A had finished
before the appearance of refractile spores.
As well as spore formation, the production of antibiotics is
known to be senstive to catabolite repression (~). To determine
whether the production of subtilosin A is controlled by catabolites,
glucose at a concentration of 10 g per liter was added to the culture
at the end of vegetative growth. As shown in Fig. 22, the addition of
excess glucose resulted in promotion of cell growth and repression of
both antibiotic production and spore formation. Under these condi
tions, small amounts of subtilosin A were produced, but no spores were
formed.
Freese and his associates (li, 34) discovered that decoyinine,
a specific inhibitor of GMP synthesis, is able not only to induce spore
formation even in the presence of excess catabolites such as glucose
- 26 -
and ammonium ions, but also to lead some asporogenous mutants to
initiate spore formation. To determine whether the production of
subtilosin A as well as spore formation is induced with this drug in
the presence of excess glucose, sporulation was induced with this drug,
and the production of subti10sin A was followed under the similar
conditions as described by Freese et~. (14). Figure 23 shows the
effect of decoyinine on cell growth. As reported by Fresse et at.
(li), this drug repressed cell growth and indeed induced sporulation to
a normal level in the presence of glucose, but no production of
subtilosin A was detected in either experiment with or without the
addition of decoyinine as shown in Table IX, suggesting that the
mechanism of repression of subti10sin A production and sporulation by
glucose may be different and that the two phenomena have no correlation
with each other.
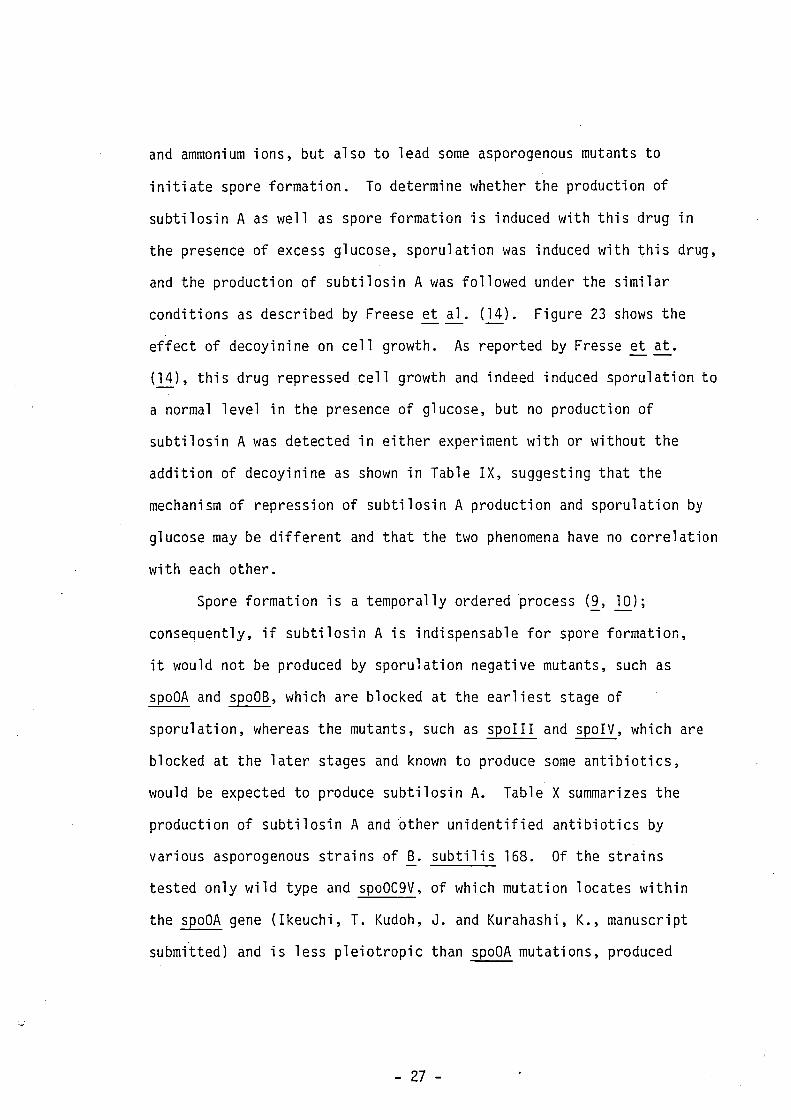
Spore formation is a temporally ordered process (~, lQ);
consequently, if subti10sin A is indispensable for spore formation,
it would not be produced by sporulation negative mutants, such as
spoOA and spoOB, which are blocked at the earliest stage of
sporulation, whereas the mutants, such as spoIII and spoIV, which are
blocked at the later stages and known to produce some antibiotics,
would be expected to produce sUbtilosin A. Table X summarizes the
production of subtilosin A and ~ther unidentified antibiotics by
various asporogenous strains of ~. subtilis 168. Of the strains
tested only wild type and spoOC9V, of which mutation locates within
the spoOA gene (Ikeuchi, T. Kudoh, J. and Kurahashi, K., manuscript
submitted) and is less pleiotropic than spoOA mutations, produced
- 27 -
both subtilosin A and other antibiotics. As expected, spoOA and
spoOB mutants did not produce subtilosin A as well as other
antibiotics, but spoIII and spoIV mutants failed to produce
sUbtilosin A, while the latter two produced other antibiotics.
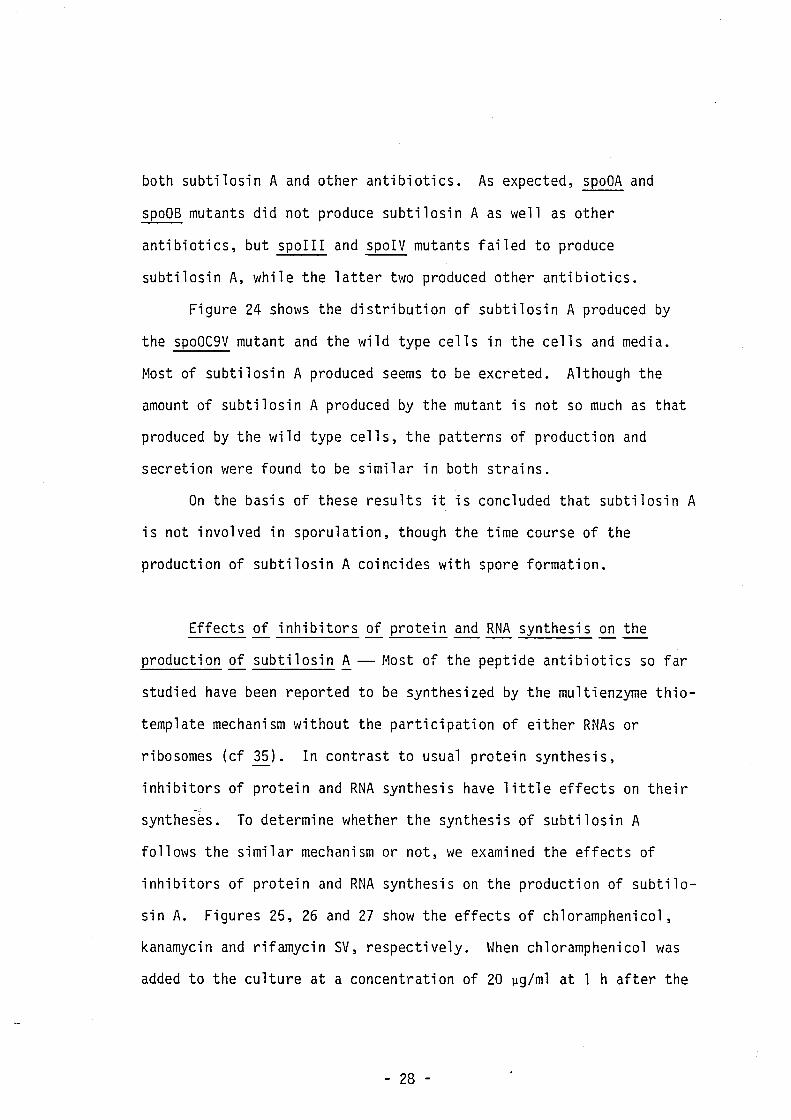
Figure 24 shows the distribution of subtilosin A produced by
the spoOC9V mutant and the wild type cells in the cells and media.
Most of subtilosin A produced seems to be excreted. Although the
amount of subtilosin A produced by the mutant is not so much as that
produced by the wild type cells, the patterns of production and
secretion were found to be similar in both strains.
On the basis of these results it is concluded that subtilosin A
is not involved in sporulation, though the time course of the
production of subtilosin A coincides with spore formation.
Effects of inhibitors of protein and RNA synthesis on the
production of subtilosin ~ -- Most of the peptide antibiotics so far
studied have been reported to be synthesized by the multienzyme thio
template mechanism without the participation of either RNAs or
ribosomes (cf 35). In contrast to usual protein synthesis,
inhibitors of protein and RNA synthesis have little effects on their
syntheses. To determine whether the synthesis of subtilosin A
follows the similar mechanism or not, we examined the effects of
inhibitors of protein and RNA synthesis on the production of subtilo
sin A. Figures 25, 26 and 27 show the effects of chloramphenicol,
kanamycin and rifamycin SV, respectively. When chloramphenicol was
added to the culture at a concentration of 20 ~g/ml at 1 h after the
- 28 -
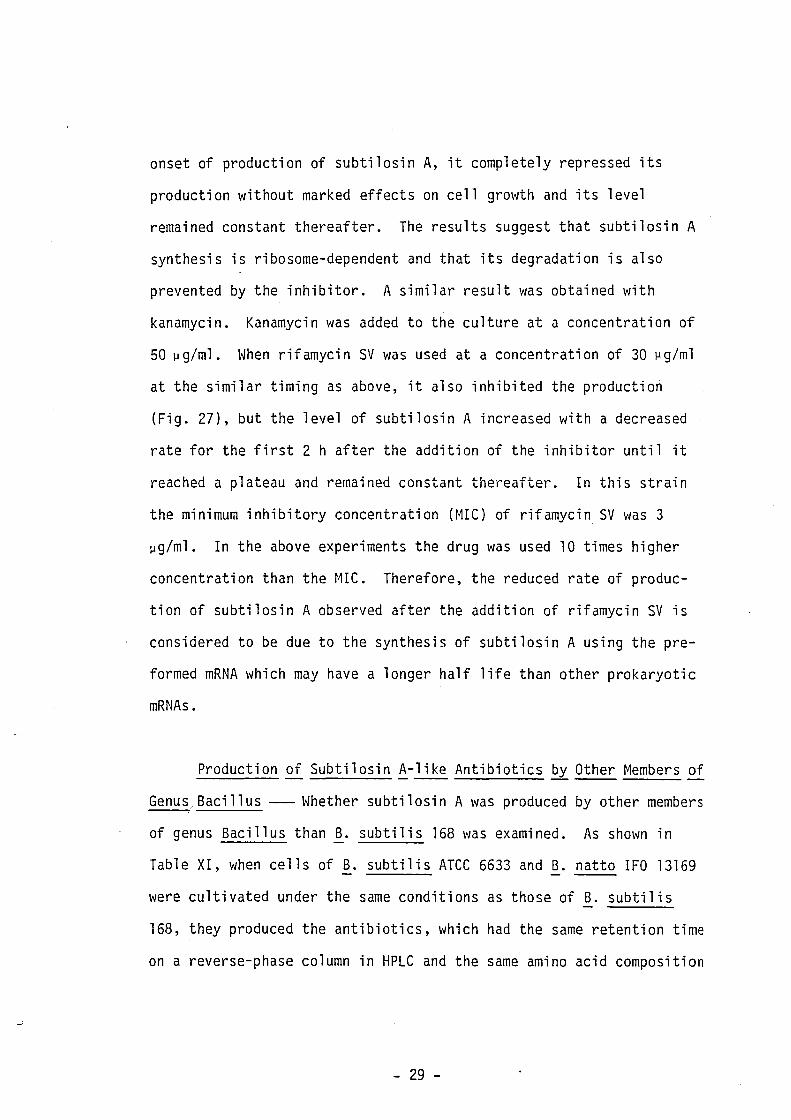
onset of production of subtilosin A, it completely repressed its
production without marked effects on cell growth and its level
remained constant thereafter. The results suggest that subtilosin A
synthesis is ribosome-dependent and that its degradation is also
prevented by the inhibitor. A similar result was obtained with
kanamycin. Kanamycin was added to the culture at a concentration of
50 ~g/ml. When rifamycin SV was used at a concentration of 30 ~g/ml
at the similar timing as above, it also inhibited the production
(Fig. 27), but the level of subtilosin A increased with a decreased
rate for the first 2 h after the addition of the inhibitor until it
reached a plateau and remained constant thereafter. In this strain
the minimum inhibitory concentration (MIC) of rifamycin SV was 3
~g/ml. In the above experiments the drug was used 10 times higher
concentration than the MIC. Therefore, the reduced rate of produc
tion of subtilosin A observed after the addition of rifamycin SV is
considered to be due to the synthesis of sUbtilosin A using the pre
formed mRNA which may have a longer half life than other prokaryotic
mRNAs.
Production of Subtilosin ~-like Antibiotics by Other Members of
Genus Bacillus --- Whether sUbtilosin A was produced by other members
of genus Bacillus than ~. subtilis 168 was examined. As shown in
Table XI, when cells of B. subtilis ATCC 6633 and B. natto IFO 13169
were cultivated under the same conditions as those of B. subtilis
168, they produced the antibiotics, which had the same retention time
on a reverse-phase column in HPLC and the same amino acid composition
- 29 -
as that of subtilosin A (data no shown). Thus far, there is little
information on the antibiotics produced by ~. natto. ~. megaterium
and B. amyloliquefaciens H did not produce such a substance.
- 30 -

DISCUSSION
B. subtilis 168 was found to produce more than 10 antibiotics
in the sporulation medium. Subtilosin A studied here is one of the
major antibiotics produced in the early stages of sporulation.
When the pH of the culture was higher than 9, antibiotics were
extracted from the culture with n-butanol without acidification of
the culture to pH 2 or lower. Certainly, the butanol extraction
under acidic conditions was more efficient. But the resultant
extracts contained many undesirable substances to complicate the
isolation of antibiotics, because cells were destroyed completely at
acidic pHs and the cell debris were extracted together into the
butanol layer. Most of subtilosin A was readily extracted from
untreated cultures with n-butanol.
Two methods (Methods A and B) were used for the isolation of
subtilosin A, but Method B was found better than Method A in many
respects. During thin-layer chromatography on silica gel plates
subtilosin A seems to be degraded considerably. Therefore, if
possible, the procedure should be avoided for isolation of subtilosin
A.
Subtilosin A consists of 32 amino acid residues of usual amino
acids and two non-amino acid residues. No sugars were detected in
subtilosin A by the phenol-sulfuric acid reaction (36). As shown in
Fig. 28 and 29, small amounts of unknown ninhydrine-positive peaks
were sometimes observed, but these peaks are absent in amino acid
analyses of performic acid-oxidized samples, and if any, do not
always appear quantitatively. Accordingly, these peaks are not
- 31 -
thought to indicate unknown amino acids contained in subtilosin A.
They might be artifacts formed during hydrolysis with HCl of a
compound like O-(Y-L-glutamyl)-L-serine (~).
Subtilosin A is a small peptide without unusual amino acids,
but its structural analyses has encountered with many difficulties.
Since both termini are blocked, it is necessary to obtain fragments
with free amino groups for amino acid sequencing. When intact
subtilosin A was subjected to digestion with various proteases, it
was little degraded even in the presence of denaturants. The
reduction and S-carboxymethylation of subtilosin A could not be
achieved sufficiently by the usual method even if the reduction time
was prolonged, as shown in the footnote of Table V. The resultant
RCM-samples were also resistant to proteases. Later, pretreatment of
subtilosin A with methylamine was found to be helpful for the
reduction and S-carboxymethylation of this antibiotic. R01-samples
thus prepared were easily digested with proteases such as chymo
trypsin and thermolysin. This finding enable me to determine the
complete amino acid sequence of subtilosin A.
However, when I attempted to isolate the N-terminal fragments
from thermolysin peptides of this RCM-sample, the reverse-phase HPLC
of the N-terminal fragments gave many peaks, of which amino acid
analyses showed only glycine as their components as shown in Fig. 9S
and Table IXS, suggesting that the N-blocking group might have been
destroyed during the following three processes: 1) Reduction and
S-carboxymethlation, 2) digestion with thermolysin and 3) chromato
graphy. In contrast to intact subtilosin A, the RCM-derivatives gave
- 32 -
rise to many heterogeneous peaks in reverse-phase HPLC, and gave
broad weak signals in FAB mass spectrometry (data not shown).
Therefore the first possibility seems very likely. However, by FAB
mass spectrometry it was revealed that some N-termina1 fragments
changed in mass values but not in amino acid compositions during
digestion with thermo1ysin in 0.1 M NH 4HC0 3 containing 10 mM CaC1 2 at
370C or in 0.1 M MES buffer containing 10 mM CaC1 2, pH 6.5, at higher
than 600C (data not shown). These results show that subti10sin A is
labile, particularly in alkali, suggesting that the above second
possibility can not be ruled out. All these facts might explain that
the reverse-phase HPLCs of the digests and the hydro1yzates, as shown
in Fig. 2S-9S, gave complex chromatograms in spite of the small size
of subti10sin A and that the yields of fragments isolated were low.
The N-terminus is blocked by an unknown residue X. There are
unique cross-linking structures between the cysteine residue at
position 19 and the G1x residue at positiion 28 through an unknown
residue Xu, and between the N- and C-terminus (Fig. 19). Such a
cross-linking structure between a cysteine residue and a glutamine or
glutamic acid residue has already been reported in complement 3 (38)
and a2-macrog1obu1in (~). However, in contrast to that of
subtilosin A, the thioester bonds are formed directly between the
thio1 group of the cysteine residue and y-carboxy1 group of the G1x
residue.
The linking between the cysteine 19 and Xu may be considered to
be th~ough a thioester bond because of its 1abi1ity in alkali
treatment and performic acid oxidation, while the linkage between the
- 33 -
Glx-28 and Xu may be an a-ester bond. Because performic acid
oxidized subtilosin A has a free a-carboxyl group, the linking
between the N- and C-termini is infered not to be an amide bond. To
determine whether this antibiotic has S- and/or a-ester bonds, when
intact subtilosin A was subjected to the alkaline hydroxylamine
method (40), it gave a purple-brown color which indicates the forma
tion of the corresponding ferric-hydroxamic acid complexes. As the
resultant complexes were quantitated spectrophotometrically based on
the calibration curve for the ferric-acetohydroxamic acid complex,
its amount corresponded to 1.3 equivalent/mol. This result
demonstrates that sUbtilosin A has one ester bond at least.
The method for determination of thiol groups used in this work
is simple and very quantitative, and also gave the expected values on
bovine trypsin and hen lysozyme in addition to bovine insulin,
suggesting that hydrazine could split the disulfide bonds
quantitatively. Therefore, no other residues with thioi groups than
the three cysteine residues are considered to be present in
subtilosin A.
Of the antibiotic peptides produced by species of Bacillus, of
which structures and synthetic mechanisms. have been clarified, only
subtilin is similar to subtilosin A in size and the synthetic
mechanism. Subtilin is a peptide antibiotic produced by ~. subtilis
ATCC 6633, and consists of 32 amino acid residues including unusual
amino acids, such as methyllanthionine, lanthionine, dehydroalanine,
and dehydrobutyrine. It was shown to be formed by processing of
precursor proteins (26). Since subtilosin A was shown to be
- 34 -
synthesized by a mechanism dependent on mRNA-ribosome and it had no
methionine residues, it may well be synthesized as a large precursor
protein.
Ray and Bose (il) and Haavik and Thomassen (42) showed that the
nonproducer mutants of mycobaci11in and bacitracin were able to
sporulate normally, suggesting that these antibiotics were dispens=
able for spore formation. Our results showed that subti10sin A seems
to have no direct correlation with sporulation. However, some other
antibiotics produced by ~. subti1is 168 were found to increase in
amounts considerably during sporulation induced by decoyinine, while
no subti10sin A was produced as described above. Whether these
antibiotics have any effects on sporulation remains to be studied in
more detail.
Further studies are required to elucidate the complete
structure of subti10sin A. The blocking group at the N-terminus and
the cross-linking structure between cysteine at residue 19 and G1x at
residue 28 are being studied.
- 35 -
ACKNOWLEDGMENTS
The author is deeply indebted to Mr. T. Takao and Dr. Y.
Shimonishi, Miss Y. Vagi, and Dr. S. Tsunasawa and Dr. F. Sakiyama of
Institute for Protein Research, Os aka Universty for FAB mass
spectrometry and valuable discussions, for amino acid analyses, and
for helpful advices, respectively, during the course of this study.
The author is also very grateful to Dr. J. E. Grady of the Upjohn Co.
and Dr. K. Fujikawa of University of Washington for generous gifts of
decoyinine U-7984 and Achromobacter protease I, respectively. The
author thanks Drs. S. Okubo, P. Schaeffer, J. Spizizen and H. Araki
for supplying us strains of bacteria. Finally, the author wishes to
thank Professor K. Kurahashi and Asistant Professor M. Yamada of
Insutitute for Protein Reseach, Osaka Universty for encouragements
and helpful advices throughout this work.
- 36 -
REFERENCES
1. Murrell, W.G. (1969) in Advances in Microbial Physiology (Rose,
A.H. & Wilkinson, J.E., eds.) Vol. I, p. 133, Academic Press,
Inc., London & New York
2. Berdy, J. (1974) Advan. Appl. Microbiol. 18,309-406
3. Bodanszky, M. & Perlman, D. (1964) Nature 204, 840-844
4. Katz, E. & Demain, A.L. (1977) Bacteriol. Rev. 41, 449-474
5. Shaeffer, P. (1967) Folia Microbiol. 12,291-296
6. Freese, E. (1981) in Sporulation and Germination (Levinson, H.S.,
Sonenshein, A.L., & Tipper, D.J., eds.) pp.1-12, Am. Soc.
Microbiol., Washington, D.C.
7. Ristow, H. & Paulas, H. (1982) Eur. J. Biochem. 129,395-401
8. Schaeffer, P. (1969) Bacteri 01. Rev. 33, 48-71
9. Piggot, P.J. & Coote, J.G. (1976) Bacteriol. Rev. 40, 908-962
10. Hoch, J. (1976) Advan. Genetics 18, 69-98
11. Balassa, G.M., Ionesco, H., & Schaeffer, P. (1963) C. R. Acad.
Sci. 257, 986-988
12. Schmitt, R. & Freese, E. (1968) ~. Bacteriol. 96, 1255-1265
13. Spizizen, J. (1965) in Spores lI! (Campbell, L.L. & Halvorson,
H.O., eds.) pp. 125-137, Am. Soc. Microbiol., Washington, D.C.
14. Freese, E.B., Vasantha, N., & Freese, E. (1979) MQl. Gen. Genet.
170, 67-74
15. Ikeuchi, T. & Kurahashi, K. (1978) J. Bacteriol. 134, 440-445
16. Korch, C.T. & Doi, R.H. (1971) J. Bacteriol. 105, 1110-1118
17. Hirs, C.H.W. (1967) in Methods ~ Enzymology (Hirs, C.H.W. ed.) /
Vol. XI, pp. 197-199, Academic Press, Inc., New York
- 37 -
18. Simpson, R.J., Nenberger, M.R., & Liu, T.-T. (1976) ~. Biol.
Chem. 251, 1936-1940
19. Crestfield, A.M., Stein, W.H., & Moore, S. (1963) J. Biol. Chem.
238, 2413-3419
20. Chen, R. (1976) Hoppe-Seyler's~. Physiol. Chem. 357, 873-886
21. Kimura, S. (1974) Japan Analyst 23, 563-574
22. Chang, J.Y., Brauer, D., & Wittmann-Liebold, B. (1978) FEBS Lett.
93, 205-214
23. Allen, G. (1981) in Laboratory Techniques in Biochemistry and
Molecular Biology (Work, T.S. & Burndon, R.H., gen. eds.),
Sequencing of proteins and peptides, pp. 223-226, Elsevier,
North-Holland Biomedical Press, Amsterdam.
24. Kortt, A.A. & Liu, T.Y. (1973) Biochemistry 12, 320-327
25. Kavanagh, F., Ross, G.W., & O'Callaghan, C.H. (1975) in Methods
~ Enzymology (Hash, J.H. ed.) Vol. XLIII, pp. 55-69, Academic
Press, Inc., New York
26. Nishio, C., Komura, S., & Kurahashi, K. (1983) Biochem.
Biophys. Res. Commun. 116, 751-758
27. Boulanger, P. & Osteux, R. (1974) in Methods of Enzymatic
Analysis (Bargmeyer, H.U., ed) Vol. 4, pp. 1648-1655
28. Sheehan, J.C. (1958) J. Am. Chem. Soc. 80, 3349-3355
29. Wilcox, P.E. (1967) in Methods ~ Enzymology (Hirs, C.H.W. ed.)
Vol. XI, pp. 65-76, Academic Press, Inc., New York
30. Takao, T., Yoshida, M., Hong, Y.-M., Aimoto, S., & Shimonishi, Y.
(1984) Biomed. Mass Spectro. in press
31. Akabori, S., Ohno, K., & Narita, K. (1952) Bull. Chem. Soc. Jap.
- 38 -
-'
25, p. 241
32. Hanson. R.S., Peterson, J.A., & Youstern, A.A. (1970) Ann. Rev.
Biochem. 24, 53-90
33. Martin, J.F. & Demain, A.L. (1980) Microbio1. Rev. 44, 230-251
34. Freese, E., Heinze, T., Mitani, T., & Freese, E.B. (1976) Spores
VII (Chamb1iss, G. & Vary, J., eds.) pp. 277-285, Am. Soc.
Microbial., Washington, D.C.
35. Kurahashi, K. (1981) in Antibiotics. Biosynthesis (Corcoran,
J.W., ed~) Vol. IV, pp. 325-352, Springer-Ver1ag, Berlin,
Heide1berg, New York
36. Dubis, M., Gi11es, K.A., Hamilton, J.K., Rebers, P.A., & Smith,
F. (1956) Anal. Chem. 28, 350-356 -- --37. Ikawa, M. & Snell, E.E. (1961) ~.Bio. Chem. 236, 1955
38. Tack, B.F., Harrison, R.A., Jonatova, J., Thomas, M.L., & Prah1,
J.W. (1980) Proc. Nat1. Acad. Sci. USA 77,5764-5768
39. Sottrup-Jensen, L., Hansen, H.F., Mortensen, S.B., Petersen,
T.E., & Magnusson, S. (1981) FEBS Lett. 123, 145-148
40. Snyder, F. & Stephens, N. (1961) Biochem. Biophys. Acta. 54.
356-360
41. Ray, B. & Bose, S.K. J1971)~. Gen. App1. Microbio1. 17,491-498
42. Haavik, H.I. & Thomassen, S. (1973) J. Gen. Microbial. 76, 451-454
- 39 -
\ ..
~-----------------------------~ 10 ," , , 100 Vl --ClJ u ClJ
.D d >
Fi g. 1.
I I ,
I I , , ,
I
/ , I , ,
I I
I I
O~~---L--~~~~--~~~~---L--~;~-L~
b (h)
Ti me after the end of vegetat ive growth
lfI ClJ L-
o Q.
If)
Summary of the correlation between sporulation and cell growth. The corresponding stages of sporulation are represented
diagrammatically above the growth curve at appropriate times. Stage I: Preseptation or axial chromatin stage
II: Septation of forespore III: Protoplast development IV: Cortex formation
V: Coat formation VI : r~aturati on
VII: Free spore
- 40 -
( "----
Strain Antibiotic Proteinase production production Competence
Wild + + +
SpoDA - - -SpoDB - + +
SpoDC + + +
SpoI-V + + +
(Schaeffer)
Table I. Properties of asporogenous mutants derived from Bacillus
subtilis Marburg strain. + and - indicate production and non-production,
respectively, or possession and non-possession of competence,
respectively.
- 41 -
(
Strain Antibiotic Correlation
B. subtilis Mycobaci llin None
a. licheniformis Bacitracins None B. brevis Gramicidin A None
Gramicidin S None Tyrocidines None
Table II. Correlation between sporulation and production of
well-defined antibiotics.
- 42 -
c
Fi g. 2.
, • I I
-0.5 0 2 4 6 8 19 32 52
Time(h)
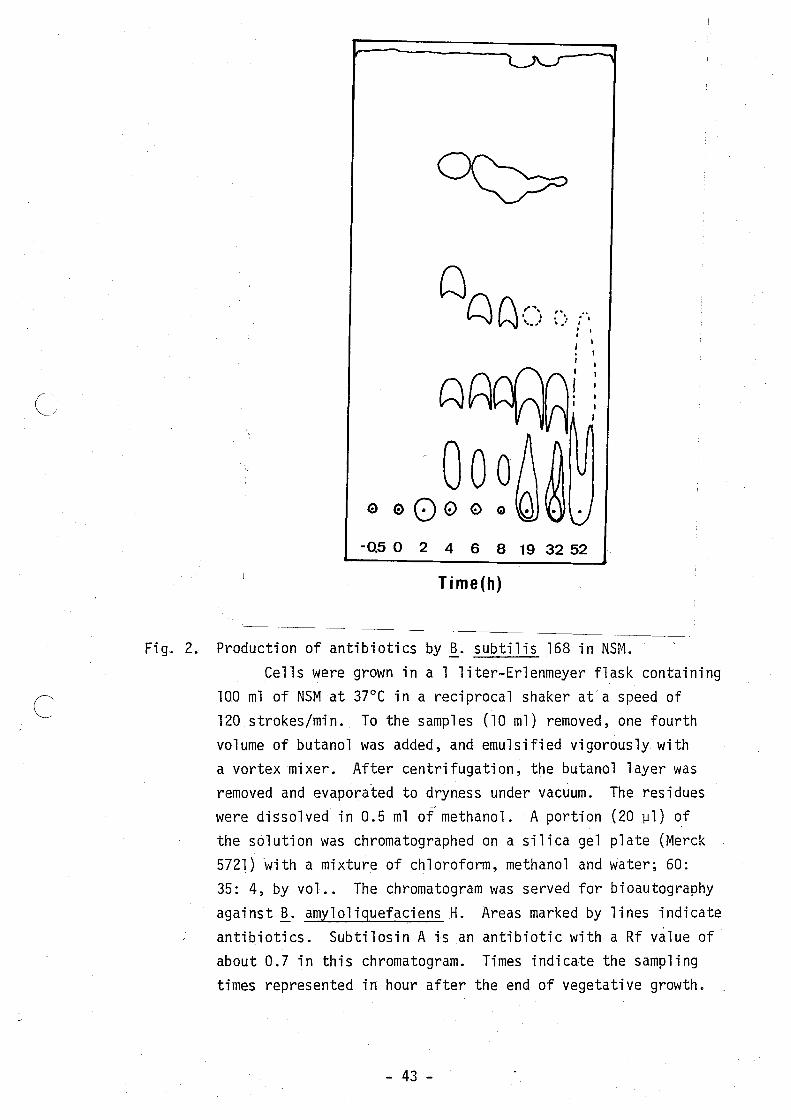
Production of antibiotics by ~. subtilis 168 in NSM. Cells were grown in a 1 liter-Erlenmeyer flask containing
100 ml of NSM at 37°C in a reciprocal shaker at a speed of 120 strokes/min. To the samples (10 ml) removed, one fourth volume of butanol was added, and emulsified vigorously with a vortex mixer. After centrifugation, the butanol layer was removed and evaporated to dryness under vacuum. The residues were dissolved in 0.5 ml of methanol. A portion (20 ~l) of the solution was chromatographed on a silica gel plate (Merck 5721) with a mixture of chloroform, methanol and water; 60: 35: 4, by vol .. The chromatogram was served for bioautography against~. amy10liguefaciens H. Areas marked by lines indicate antibiotics. Subtilosin A is an antibiotic with a Rf value of about 0.7 in this chromatogram. Times indicate the sampling times represented in hour after the end of vegetative growth.
- 43 -
(
Whole culture
J Butanol extract
Sephadex LH-20 gel filtration in methanol
~arative TLC ~ (CHC1 3:CH30H:H20=60:25:4,v/v)
-----~==---==:::::::::::. TLC on silica gel plates (CHC1 3:CH30H:H20=60:25:4,v/v)
~Phadex LH-60 gel filtration ~ i" methanol
~C on silica gel plates ~ (CHC1 3:DMFA:H20=50:44:6,v/v)
~Phadex LH-60 gel filtration ~ in'methanol
(Method A)
Reversed-phase TLC (CH30H:H20=70:30,v/v)
~Phadex LH-20 gel filtration ~ i,,'methanol
(Method B)
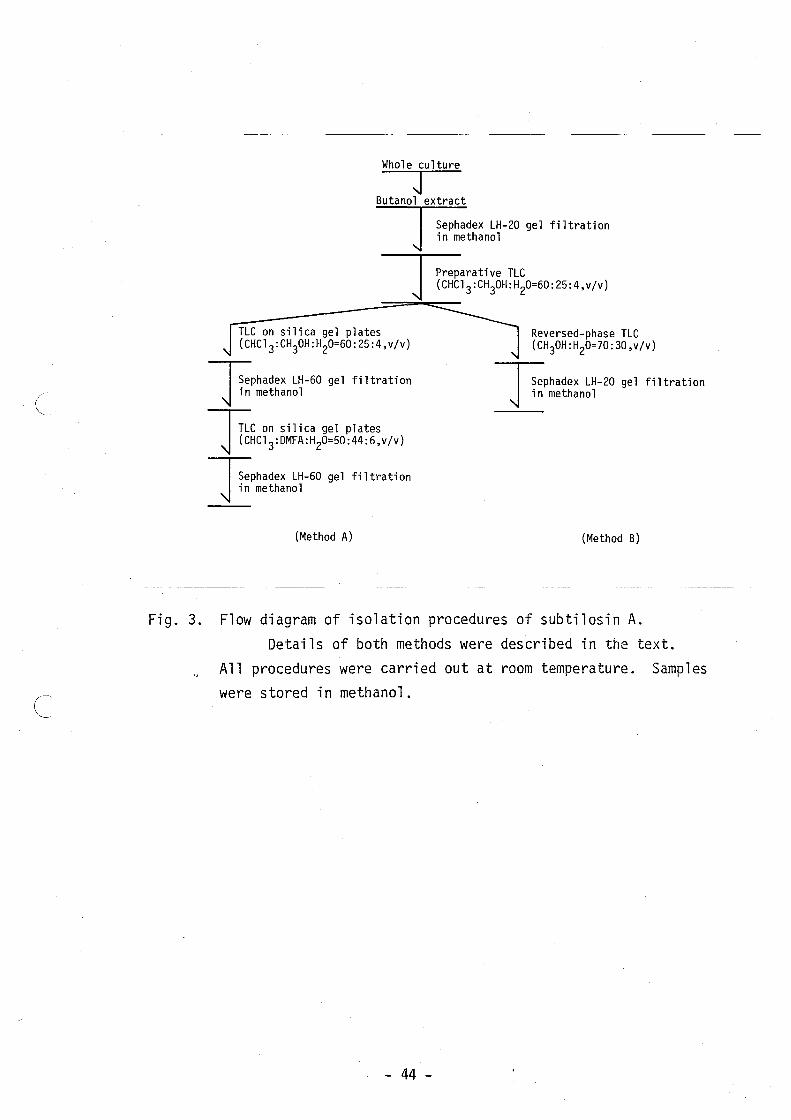
Fig. 3. Flow diagram of isolation procedures of subtilosin A.
Details of both methods were described in the text.
All procedures were carried out at room temperature. Samples were stored in methanol.
- 44 -
C~
c
Vo , E 200 c
0 ("t") N +-'
d <1> 100 u c d
..0 ~
0 Ul
..0 50 «
00 10 20 30
c::::
VI ,
40 50 60 Fraction
;)
43 49 55 61 Fraction
70
67
(A)
80 90 100
(8)
73 79 85 91
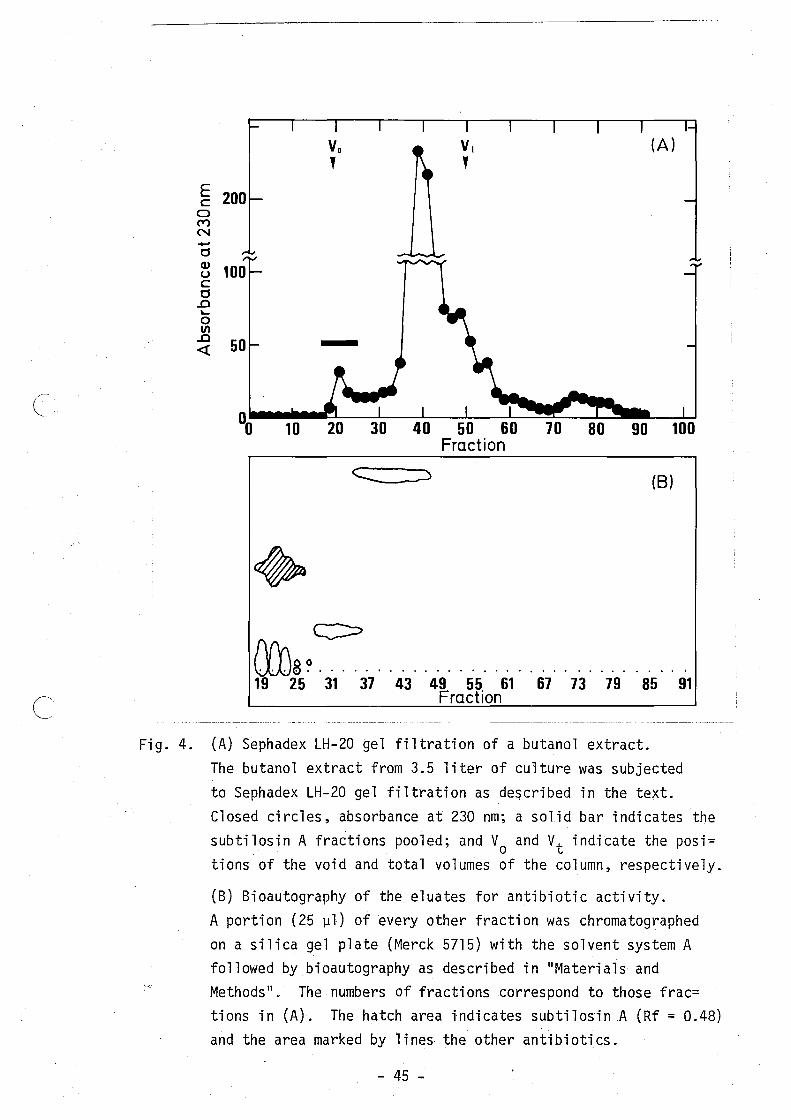
Fig. 4. (A) Sephadex LH-20 gel filtration of a butanol extract. The butanol extract from 3.5 liter of culture was subjected to Sephadex LH-20 gel filtration as described in the text. Closed circles, absorbance at 230 nm; a solid bar indicates the subtilosin A fractions pooled; and Va and Vt indicate the posi= tions of the void and total volumes of the column, respectively.
(B) Bioautography of the eluates for antibiotic activity. A portion (25 111) of every other fraction was chromatographed on a silica gel plate (Merck 5715) with the solvent system A followed by bioautography as described in IIMaterials and Methods··. The numbers of fractions correspond to those frac= tions in (A). The hatch area indicates subtilosin A (Rf = 0.48) and the area marked by lines the other antibiotics.
- 45 -
Method A
Volume Contents
Whole culture 3.5 1
n-Butanol extract ca. 0.8 1
Sephadex LH-20 gel filtration
Preparative TLC (silica gel) 32.2 mg
TLC (silica gel)
Sephadex LH-60 16.5 mg gel filtration
TLC (silica gel) 8.1 mg
Sephadex LH-60 7.0 mg gel filtration
Method B
Volume Contents
Whol e culture 3.5 1
n-Butanol extract ca. 0.8 1
Sephadex LH-20 gel filtration
Preparative 32.2 mg TLC (silica gel)
Reversed-phase TLC
Sephadex LH-20 19.4 mg gel filtration
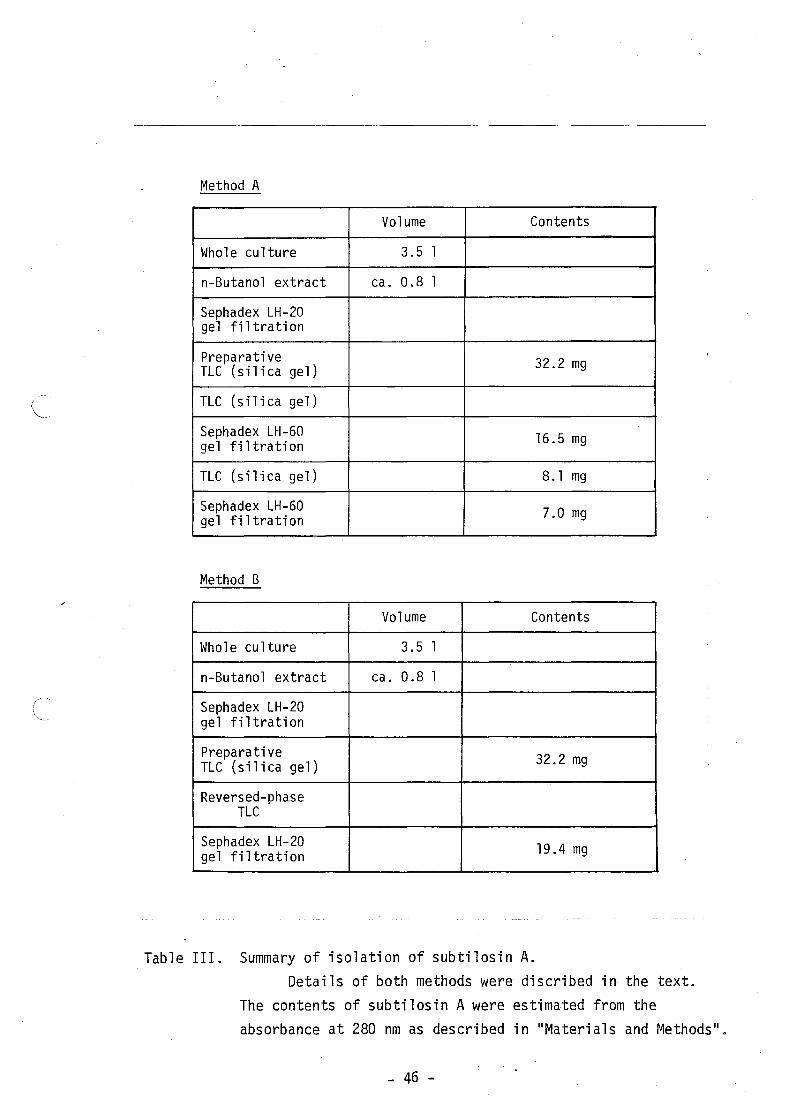
Table III. Summary of isolation of subtilosin A. Details of both methods were discribed in the text.
The contents of subtilosin A were estimated from the absorbance at 280 nm as described in "Materials and Methods".
- 46 -
f
"-
c
I
O. I . .~ .. 70...!..
I z ----- (.)
E g -- 60~ ---- (.) c ----
U") ----_. 50~ ,-- 0.4 I
N I ..... I a I 40 I (I,) I U I C I 30 a I ..c0.2 ~ -0 20 Ill'
..c <{ .~
10
I I I I Q 5 10 15
Time(min)
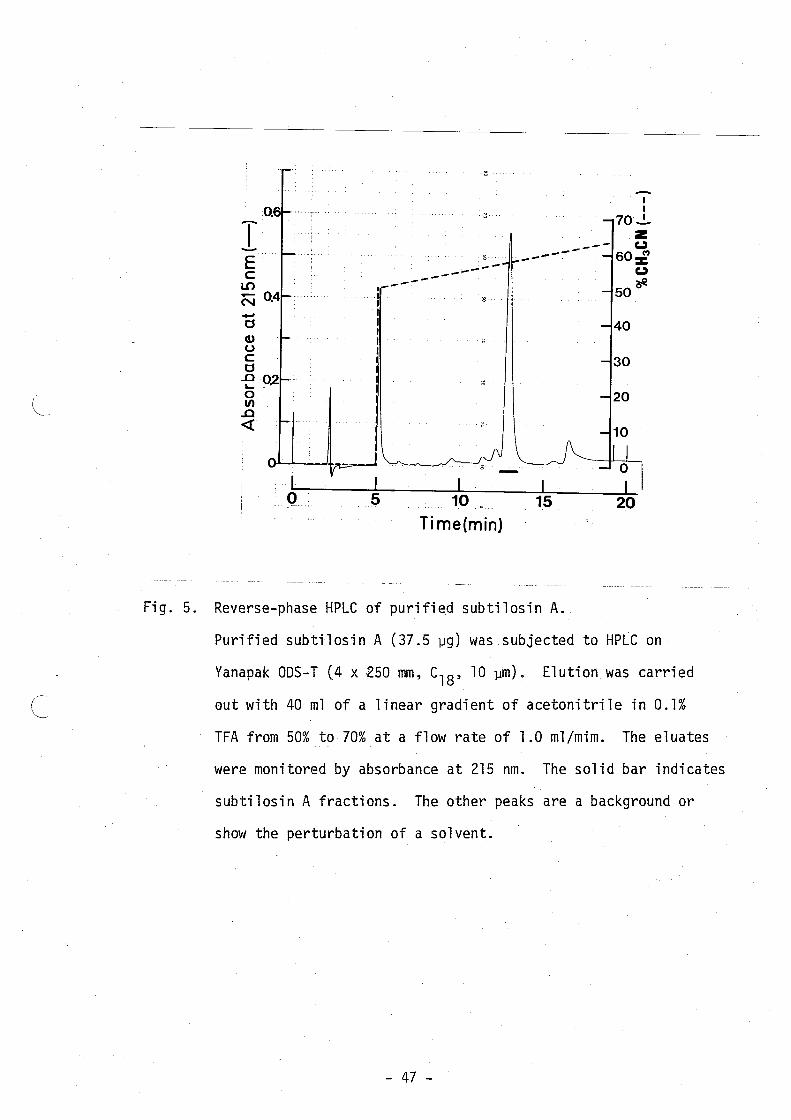
Fig. 5. Reverse-phase HPLC of purified subtilosin A.
Purified subtilosin A (37.5 ~g) was subjected to HPLC on
Yanapak ODS-T (4 x ~50 mm, C18 , 10 ~m). Elution was carried
out with 40 ml of a linear gradient of acetonitrile in 0.1%
TFA from 50% to 70% at a flow rate of 1.0 ml/mim. The eluates
were monitored by absorbance at 215 nm. The solid bar indicates
subtilosin A fractions. The other peaks are a background or
show the perturbation of a solvent.
- 47 -
c
o CO C\I
c:c
o I
jAUFS 0.01
-.-__ -- I -- -- -160 i --- 55 ~
Time.min 5 I
*
Z ()
Jog ~
10 I
o
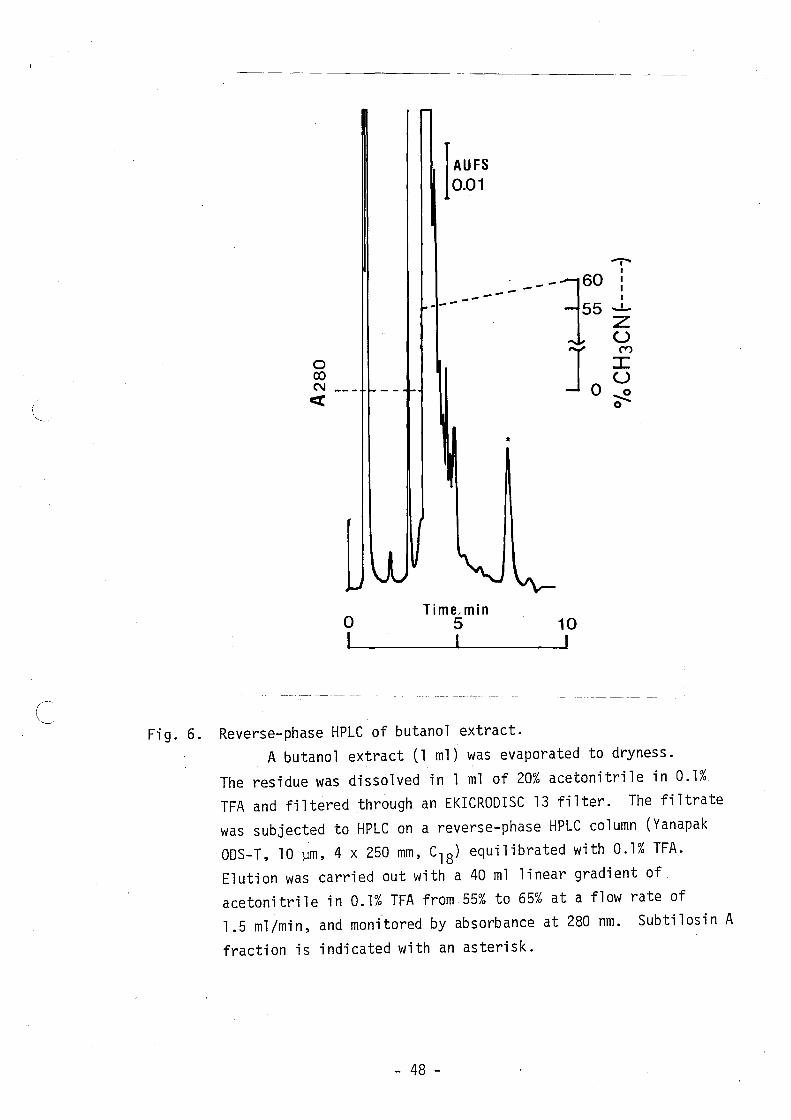
Fig. 6. Reverse-phase HPLC of butanol extract. A butanol extract (1 m1) was evaporated to dryness.
The residue was dissolved in 1 m1 of 20% acetonitrile in 0.1% TFA and filtered through an EKICROOISC 13 filter. The filtrate was subjected to HPLC on a reverse-phase HPLC column (Yanapak OOS-T, 10 ~m, 4 x 250 mm, C18) equilibrated with 0.1% TFA.
Elution was carried out with a 40 ml linear gradient of acetonitrile in 0.1% TFA from 55% to 65% at a flow rate of 1.5 ml/min, and monitored by absorbance at 280 nm. Subti10sin A
fraction is indicated with an asterisk.
- 48 -
l
Microorganisms
Bacillus amyloliquefaciens H
Bacillus brevis AlCC 9999
Bacillus licheniformis AlCC 10716
Bacillus megaterium IFO 12108
Bacillus natto IFO 13169
Bacillus polymyxa AlCC 10401
Bacillus subtilis 168
Bacillus subtilis AlCC 6633
Lactobacillus casei IFO 3435
Staphylococcus aureus IFO 12732
Streptococcus faecium IFO 3181
Escherichia coli K-12 HB 101
Aspergillus niger IFO 6341 a
Mucor juvanicus IFO 4570a
a Grown at 28oC.
Sensitivity
++
++++
++
+
+
+
+++
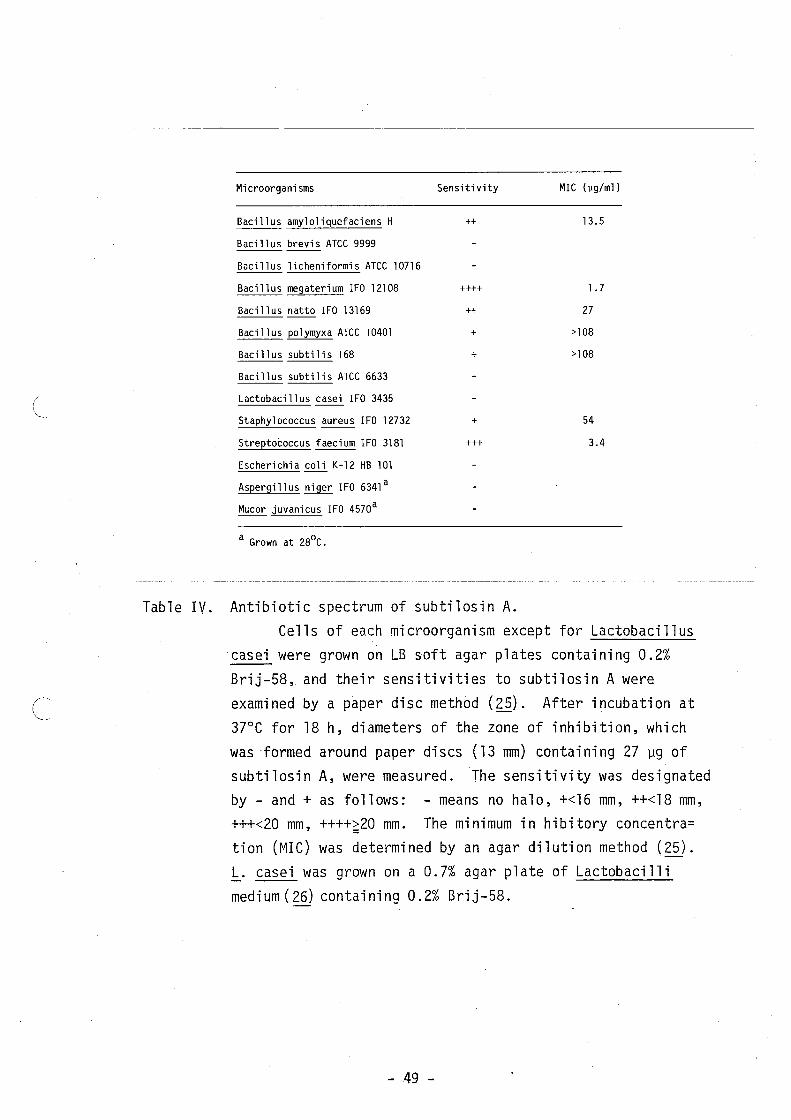
Table IV. Antibiotic spectrum of subtilosin A.
MIC ()lg/ml)
13.5
1.7
27
>108
>108
54
3.4
Cells of each microorganism except for Lactobacillus
casei were grown on LB soft agar plates containing 0.2%
Brij-58, and their sensitivities to subtilosin A were
examined by a paper disc method (25). After incubation at
37°C for 18 h, diameters of the zone of inhibition, which
was "formed around paper discs (13 mm) containing 27 ]1g of subtilosin A, were measured. "The sensitivity was designated by - and + as follows: - means no halo, +<16 mm, ++<18 mm, +++<20 mm, ++++;20 mm. The minimum in hibitory concentra= tion U~IC) was determined by an agar dilution method (25).
h. casei was grown on a 0.7% agar plate of Lactobacilli
medium (26) containing 0.2% Brij-58.
- 49 -
c 17h
pH6.5,38h 37°C
215nm
IAUFS 0.05
i ----- _____ .J
Io.05
l 10.2
1
10.2
10min Time
~
.. 60 :
I -!.-
40 Z U
20 ::2 u
O~
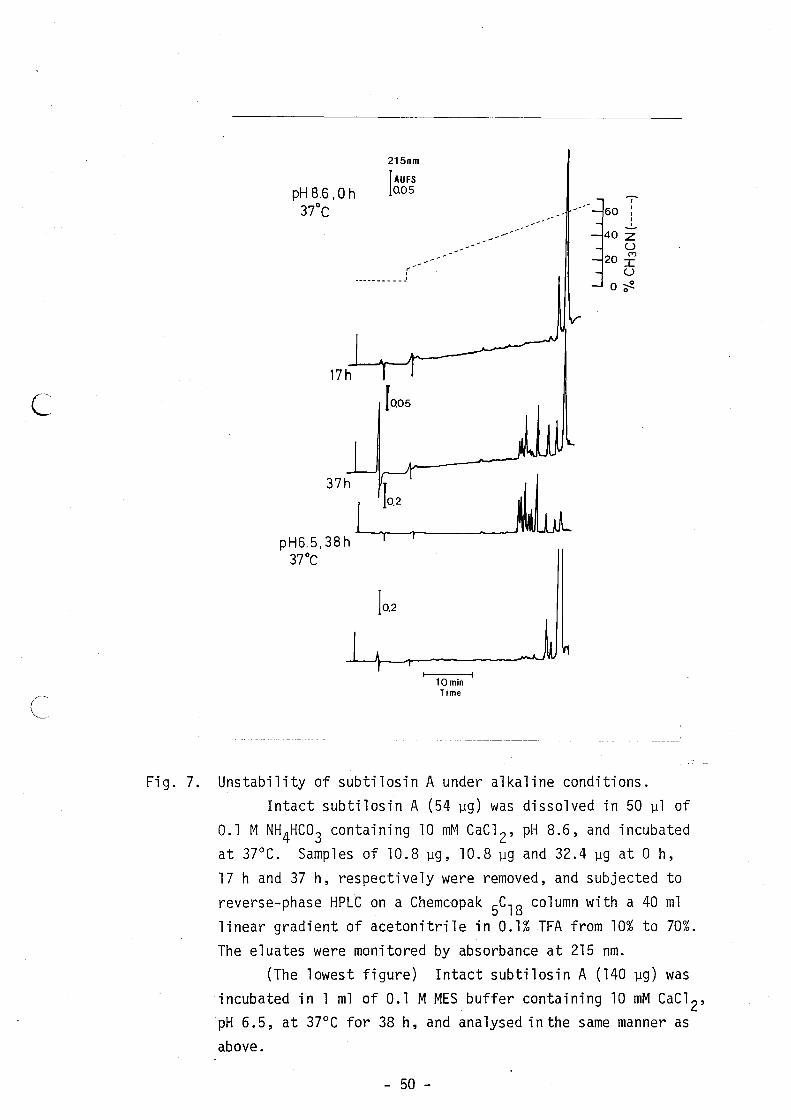
Fig. 7. Unstabi1ity of subti10sin A under alkaline conditions. Intact subti10sin A (54 ~g) was dissolved in 50 ~1 of
0.1 M NH 4HC03 containing 10 mM CaC1 2, pH 8.6, and incubated at 37°C. Samples of 10.8 ~g, 10.8 ~g and 32.4 ~g at 0 h, 17 hand 37 h, respectively were removed, and subjected to
reverse-phase HPLt on a Chemcopak 5C18 column with a 40 m1 linear gradient of acetonitrile in 0.1% TFA from 10% to 70%. The eluates were monitored by absorbance at 215 nm.
(The lowest figure) Intact subti10sin A (140 ~g) was incubated in 1 m1 of 0.1 M MES buffer containing 10 mM CaC1 2, pH 6.5, at 37°C for 38 h, and ana lysed in the same manner as above.
- 50 -
(~
r-~.
Amino acid
Asx 3.0 (3)a
Thr 0.7 (1)
Ser 0.8 ( 1 )
Glx l.0 (1)
Pro l.9 ( 2)
Gly 7.1 (7)
Ala 5.0 (5)
Cysb 2.5 (3 )
Val 1.0 (1)
Ile 3.0 (3 )
Leu 3.0 (3)
Lys 1.0 (1)
Trpc 0.5 (1)
Total residues (32)
a values are expressed as residues per mol. Numbers in parentheses are residue values based on sequence. b Cysteine was determined as cysteic acid. The S-carboxymethyl-cysteine contents were 2.0 and 0.8 mol/mol on RCM-subtilosin A with and without pretreatment with methylamine, respectively. c Tryptophan content estimated from absorbance at 280 nm in methanol
was 1.1-1.2 mol/mol.
Table V. Amino acid composition of subtilosin A. Amino acid analyses were carried out as described in
IIr~ateri a 1 s and Methods II.
- 51 -
( "'-. ..
>. -I-J ...... en c (]) -I-J C ........
1000
3250
Fig. 8. FAB mass spectrum in the range from 3250 to 3549 of intact
subti10sin A. The highest peak is present at ~~ 3401.8, but
the peak at ~~ 3399.9 is thought to correspond to [~ + HJ+
ion considering the presence of isotops.
- 52 -
( \.......
AP,
CH,
TH,
dAH,
cAH.
1 10 20 30 X-G-L-&L-W·G·N·K·G-t-A-T·C·S-I·G·A·A-t·L-V·O·G·P-I·P·O .. Z-I-A-G·A
CH-1 I
1H-1 ~
~~""rr,~
L •• L.I-~L-
.AP-1 AP-2 ~~~~~~~~~~~~~~~~~~~~~~~~
~, \~\\"
CH-3 77777777777
I~
CH-5 CH-4 . ~~ t CH-6 L
CH-7 ~
1H-2 • 77777 1H-4 I 77777
dAH-1 ~~ ~I
dAH-4 ~~ I
•
1H-3 t~
1H-5 ,,~
1H-6 I~
dAH-2 ~~~~~~~~I
dAH-5 t~~~::s~
cAH-3 '.:3
cAH-1 '....::.~~~~~~....::.....::.~....::. /7777777//7
cAH-2 ~~~~~~~~~
cAH-4 ~
Fig. 9. Summary of strategy of amino acid sequencing of sutilosin A
Amino acid resisues were indicated by one-letter notation.
CH, chymotryptic peptides of RCM-samples; TH, thermolysin
peptides of RCM-samples; AP, digests of performic acid-oxidized
samples with Achromobacter protease I; dAH, hydrolyzates of
RCM-samples with dilute acid; cAH, hydrolyzates of intact
samples with concentrated HC1. L--, ~ , ~ , and ~
indicate sequencing by digestion with carboxypeptidase A, and
Y, dansyl-Edman degradation, and the DABITCjPITC double
coupling method, respectively.
- 53 -
dAH
-l dA
H-2
dAH-
3 dA
H-4
dA
H-5
CH-l
CH-2
CH
-3
CH-4
CH
-5
CH-6
CH
-7
Asx
0.
2 0.
2 1.
0 (1
) 1.
9 (2
) 0.
1 1.
9 (2
) 3.
0 (3
) 2.
6 (3
) Th
r 0.
9 (1
) 0.
9 (1
) 0.
8 (1
)
Ser
0.3
0.9
(1)
0.1
0.2
0.1
0.9
(1)
O. 1
0.
1 1.
0 (1
) 1.
0 (1
) '.~.
Glx
0.
3 0.
2 1.
0 (1
) 1.
0 (1
) 0.
3 Pr
o 2.
1 (2
) 1.
9 (2
) 1.
9 (2
) 2.
1 (2
) 1.
9 (2
) G
ly
2.2
(2)a
1.2
(1)
1.
0 (1
) 1.
3 (1
) 0.
2 2.
2 (2
) 2.
8 (3
) 2.
0 (2
) 1.
0 (1
) 1.
0 (1
) 5.
8 (6
) 4.
0 (4
) A
la
0.2
2.0
(2)
0.1
0.2
2.0
(2)
2.9
(3)
1.9
(2)
0.1
5.0
(5)
3.0
(3)
Cys
0.8
(1)b
0.
8 (1
)b
2.5
(3)b
1.
8 (3
)b
1.3
(3)b
Va1
1.0
(1)
1.0
(1)
1.0
(1)
1.0
(1)
1.1
(1)
1.0
(1)
Ile
1.0
(1)
0.9
(1)
0.9
(1)
2.0
(2)
1.0
(1)
3.0
(3)
2.0
(2)
Leu
1.0
(1)
. 1.
0 (1
) 1.
0 (1
) 1.
1 (1
) 2.
0 (2
) 1.
0 (1
) 1.
0 (1
) 2.
0 (2
) 1.
2 (1
)
Lys
0.2
0.1
0.9
(1)
0.9
(1)
0.9
(1)
Trp
N.D
.(1)
N.D
.(1)
0.8
(1)
0.5
(1)
N.D
.(1)
Tot
al
(4)
(8)
(4)
(3)
(5)
( 5)
(15)
( 1
2)
( 3)
(7)
(30)
(2
2)
. Y
ield
1.
4 3.
7 20
.0
1.5
6.6
7.5
16.6
11
.0
4.0
12.5
3.
0 1.
0 (%
)
a V
alue
s ar
e ex
pres
sed
as
resi
dues
pe
r m
ol.
Num
bers
in
par
enth
eses
are
res
idue
val
ues
base
d on
seq
uenc
e.
b D
eter
min
ed a
s S
-car
boxy
met
hyl-
cyst
eine
.
N.D
., N
ot d
eter
min
ed.
Tab
le V
I. A
min
o ac
id c
ompo
sitio
ns
of f
ragm
ents
us
ed
for
sequ
enci
ng.
Not
atio
n of
fra
gmen
ts
is i
ndic
ated
in
the
lege
nd
to F
ig.
9.
-54
-
cAH
-l cA
H-2
cA
H-3
cA
H-4
A
P-l
AP-
2 TH
-l TH
-2
TH-3
TH
-4
TH-5
TH
-6
Asx
1.
9 (2
) 1.
8 (2
) 2.
0 (2
) 1.
8 (2
) 2.
0 (2
) 1.
1 (1
) 2.
0 (2
) 1.
0 (1
) 2.
0 (2
) Th
r 0.
8 (1
) 1.
0 (1
) 0.
9 (1
)
Ser
0.8
(1)
0.1
0.8
(1)
1.1
(1)
1.0
(1)
G1x
1.0
(1)
0.9
(1)
1.1
(1)
1.0
(1)
1.1
(1)
0.2
1.0
(1)
Pro
2.0
(2)
2.1
(2)
2.1
(2)
1.8
(2)
2.6
(2)
2.3
(2)
2.4
(2)
Gly
1.
4 (1
) 1.
2 (1
) 3.
0 (3
) 2.
0 (2
) 3.
1 (3
) 1.
2 (1
) 1.
0 (1
) 3.
1 (3
) 2.
0 (2
) 2.
0 (2
) 1.
0 (1
) 1.
0 (1
)
Ala
2.
9 (3
) 1.
0 (1
) 3.
3 (3
) 3.
2 (3
) 3.
0 (3
) 2.
1 (2
) 2.
7 (3
) 1.
9 (2
) 1.
0 (1
) 2.
0 (2
) Cy
s 1.
0 (l
)c N
.D.(1
) N
.D.(1
) N
.D.(1
) 2.
3 (3
)c
2.8
(3)b
1.
7 (2
)b 0
.9
(l)b
V
al 1.
0 (1
) 0.
9 (1
) 1.
0 (1
) 0.
9 (1
) 1.
0 (1
) 1.
0 (1
) 1.
0 (1
) !l
e 2.
0 (2
) 1.
8 (2
) 2.
8 (3
) 1.
8 (2
) 1.
8 (2
) 1.
0 (1
) 0.
9 (1
) 2.
0 (2
) 1.
0 (1
) 1.
0 (1
) Le
u 1.
0 (1
) 1.
0 (1
) 1.
2 (1
) 1.
0 (1
) 1.
0 (1
) 1.
0 (1
) 1.
0 (1
) 1.
0 (1
) 1.
0 (1
) Ly
s 1.
0 (1
) 1.
0 (1
)
Trp
N.D
.(1)
0.6
(1)
Tot
al
(14
) ( 1
2)
( 18)
(1
5 )
( 19)
(5
) ( 1
) ( 1
6)
( 13)
(1
1)
(5 )
( 8)
Yie
ld
8 1
(%)
• 5.
0 9.
0 12
.3
14.8
6.
8 16
.3
4.4
16.3
7.
2 25
.4
11.4
c D
eter
min
ed a
s cy
stei
c ac
id.
Tab
le V
I. (c
ontin
ued)
-55
-
.
c
-.--~~~~~~--~--~ ~~--------~
1 10 X-GlY-Leu-GlY-Leu-Trp-GlY-Asn-Lys-Gly-Cys-
20 Ala-Thr-Cys-Ser-Ile-GlY-Ala-Ala-Cys-Leu-
30 Val-Asp-GlY-Pro-Ile-Pro-Asp-Glx-Il~-Ala-
GlY-Ala
Fig. 10. Amino acid sequence of subtilosin A
X indicates an unknown residue of a non-amino acid. The y-carboxyl group of the Glx-28 was substituted as described in the text.
- 56 -
NH2-terminus Blocked COOH-terminus (intact) Blocked
(after performic Ala residue acid oxidation) Sugar None Free SH-groups (intact) None
(after NH2NH2 3 mol/mol
r treatment) ( "-.....-- OH-groups of Ser and Thr residues Free
S-COOH groups Asp, 2 mol/mol E-NH2 group of Lys residue Free Optical configuration L-form
Table VII. Chemical properties of subtilosin A. Details are described in the text.
- 57 -
-0 6 E ......... -- 5 0
E --0 4 (1) Ul
" 0 3 L (1)
(1) "- 2 0-::J
1 0 "-en I 0
I (f) 0 20 40 60
Time(min)
----- ------
Fig. 11. Titration of the thiol groups released by treatment with ( ~. anhydrous hydrazine of subtilosin A, bovine insulin and
thermolysin. Dried samples were dissolved in anhydrous hydrazine,
and allowed to stand at room temperature. At various times, portions (16 nm/25 ]11) of the solution were removed, evaporated to dryness, and titrated with DTNB according to the method of Kortt and Liu (24). Thermolysin and bovine insulin, which contain no and 'three cystine residues, respectively, were used as references. Closed triangles,
circles, and squares indicate the amounts of the thiol groups titrated of bovine insulin, subtilosin A and thermolysin, respectively.
- 58 -
17 19 21 29 A-A-C V-D-G-P-I-P-D-Z-I -> -> L;u-' ->-> I 17 1920 29
II A-A-C L-V-D-G-P-I-P-D-Z-I -> Lxu I
1 14 30 32 III X-G-L-G-L-W-G-N-K-G-C-A-T-C-S . I I I
~->~ A-G-A
J 1 16 30 32
IV X-G-L-G-L-W-G-N-K-G-C-A-T-C-S-I-G I l I A-G-A
J ~-> ......
1 16 V X-G-L-G-L-W-G-N-K-G-C-A-T-C-S-I-G
I I 17 19 21 32 A-A-C V-D-G-P-I-P-D-Z-I-A-G-A _L-" Lxu~ -> ...... ~ I
Fig. 12. Structures of thermolysin peptides of intact subtilosin A.
c= I-V correspond to the structures of Fragment I-V, respectively. Isolation of peptides was described in the legend to Fig. 13. Amino acid sequence of each peptide was written in one-letter notation. ~ indicates sequencing by the dansyl-Edman method. X and Xu are unknown residues.
- 59 -
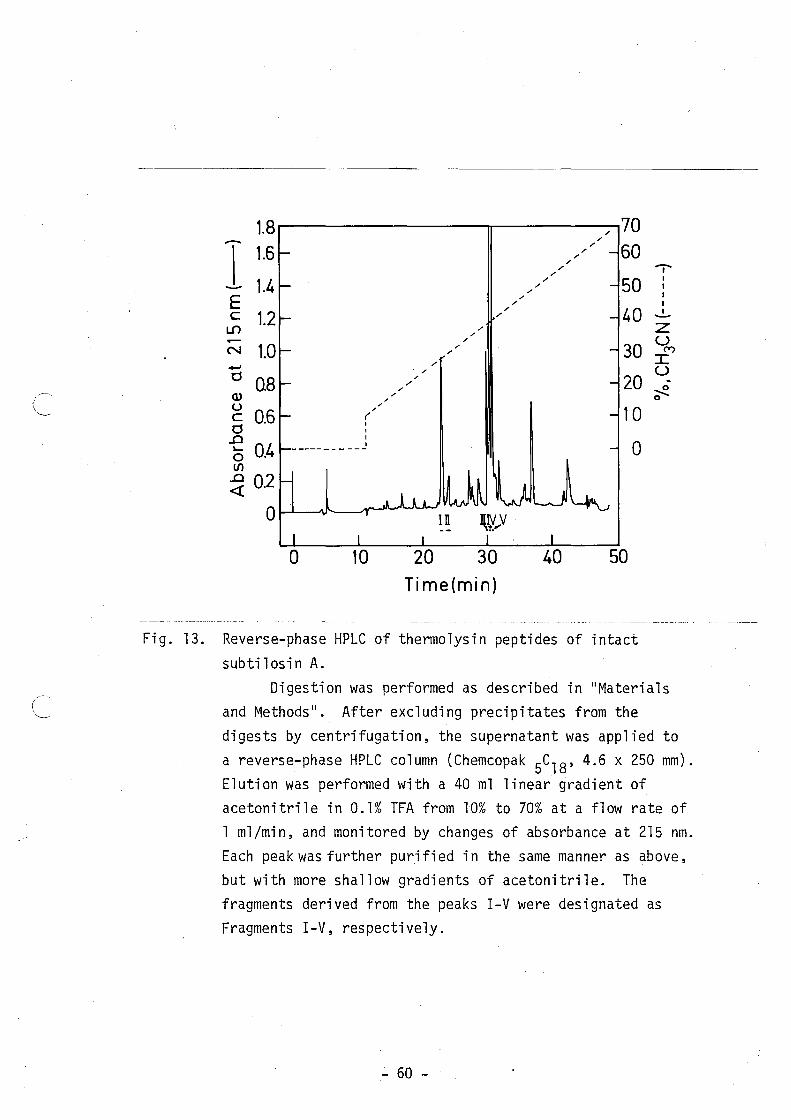
"---,
! "--..
Fig. 13.
c
-1 E c
L.{)
N ...... 0
Cl> u c 0
..0 ~
0 VI
..0 «
1.8 1.6
1.4
1.2
1.0
U8
0.6
0.4
0.2
0
( I
I I I -----------
.-.-.-
,./ "
. ,.- "
,-,-
In
,-,
,-
,-,-
JIN"y It.
Time(min)
,-,-
,-,-
,- 70 ,-
,-60 ,-
,-,-
,-,-
,- 50 40
30
20
10
0
50
Reverse-phase HPLC of thermolysin peptides of intact subti10sin A.
..... I I I I
..2-z u
(V)
::c u -~ 0
Digestion was performed as described in "Materials and Methods". After excluding precipitates from the digests by centrifugation, the supernatant was applied to
a reverse-phase HPLC column (Chemcopak 5C18' 4.6 x 250 mm). Elution was performed with a 40 ml linear gradient of acetonitrile in 0.1% TFA from 10% to 70% at a flow rate of 1 ml/min, and monitored by changes of absorbance at 215 nm. Each peak was further puri fi ed in the same manner as above, but with more shallow gradients of acetonitrile. The fragments derived from the peaks I-V were designated as Fragments I-V, respectively.
- 60 -
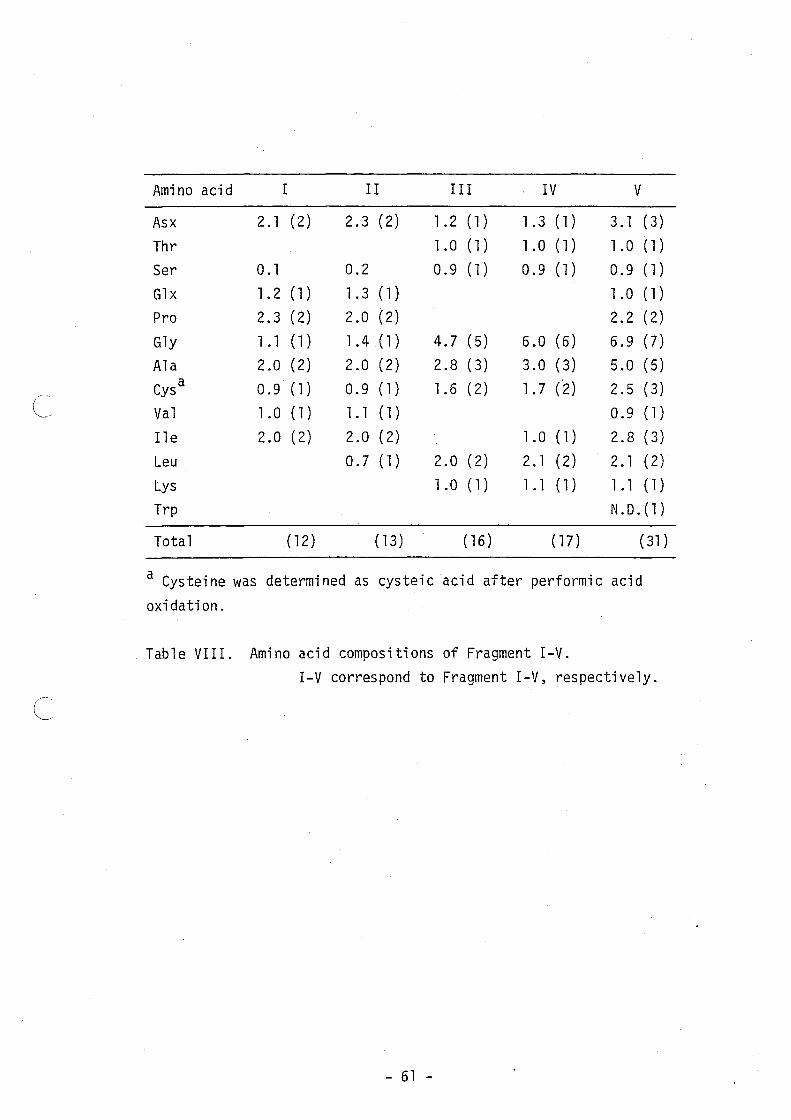
Amino acid I II III IV V
Asx 2.1 (2) 2.3 (2) 1.2 (1) 1.3 (1) 3.1 (3) Thr 1.0 ( 1 ) 1.0 (1) 1.0 (1)
Ser 0.1 0.2 0.9 ( 1 ) 0.9 (1) 0.9 (1)
Glx 1.2 (1) 1.3 (1) 1.0 (1)
Pro 2.3 (2) 2.0 (2) 2.2 (2)
Gly 1.1 (1) 1.4 (1) 4.7 (5) 6.0 (6) 6.9 (7)
Ala 2.0 (2) 2.0 (2) 2.8 (3) 3.0 (3) 5.0 (5)
Cys a 0.9 (1) 0.9 (1) 1.6 (2) 1. 7 (2) 2.5 (3) /---,
L, Val 1.0 (1) 1.1 (1) 0.9 (1)
I1e 2.0 (2) 2.0 (2) 1.0 (1) 2.8 (3) Leu 0.7 (1) 2.0 ( 2) 2.1 (2) 2.1 (2) Lys 1.0 ( 1 ) 1.1 (1) 1.1 (1)
Trp N.D.(1)
Total (12) ( 13) (16 ) (17) (31)
a Cysteine was determined as cysteic acid after performic acid
oxidation.
Tab 1 e VII I. Amino acid compositions of Fragment I-V. I-V correspond to Fragment I-V, respectively.
C
- 61 -
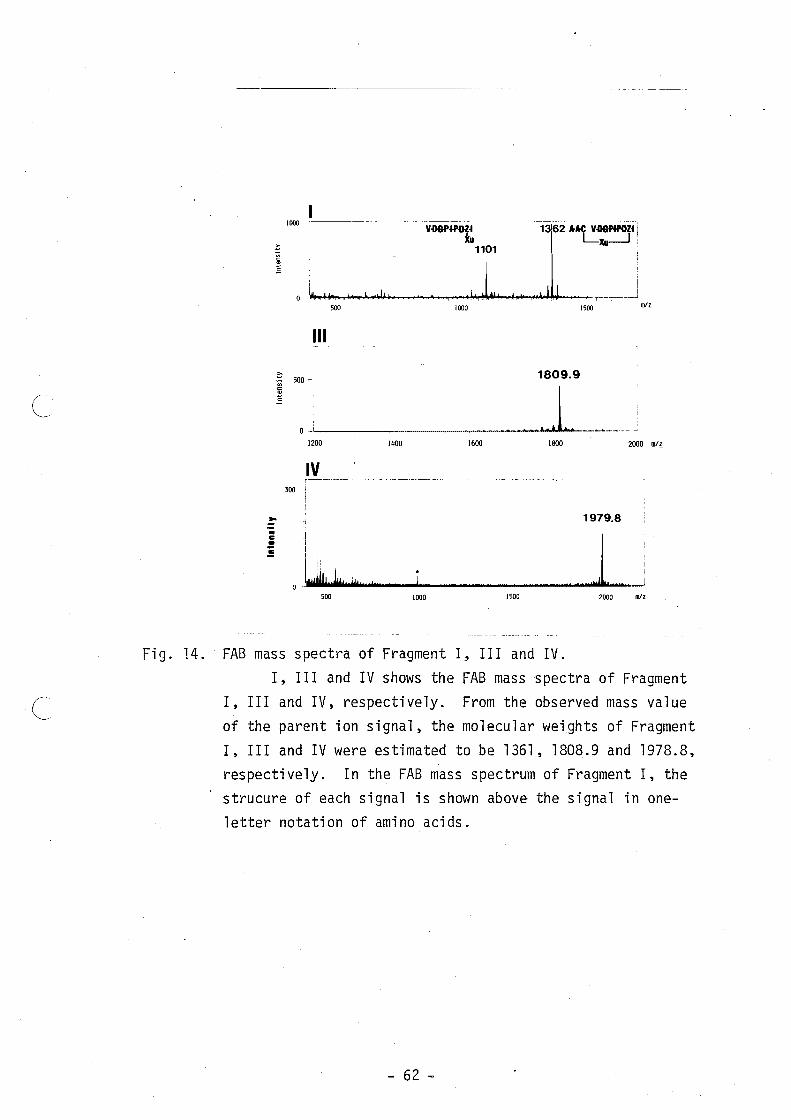
Fig. 14.
C
FAB
I , of I ,
.. • = •
1000
500
III
V-DG¥~¥~!
1101
,I. 11! 1000 1500
i 500-
o _j~_=-. __ ~ __ ~~"""","""""'.l."""--. ~ 1809.9
1200 1400 1600 1800 2000 !!!Il
IV 300
1979.8
1 l i
J I i o.IN.!II~h~.n~!h~M~"~tj~,, ____ ~ ________________ ,_·_'~'H.I~I_" ___ I
500 1000 1500 2000 i!Vc
mass spectra of Fragment I, III and IV. I, I II and IV shows the FAB mass spectra of Fragment
III and IV, respectively. From the observed mass value the parent ion signal, the molecular weights of Fragment
III and IV were estimated to be 1361,1808.9 and 1978.8, respectively. In the FAB mass spectrum of Fragment I, the strucure of each signal is shown above the signal in oneletter notation of amino acids.
- 62 -
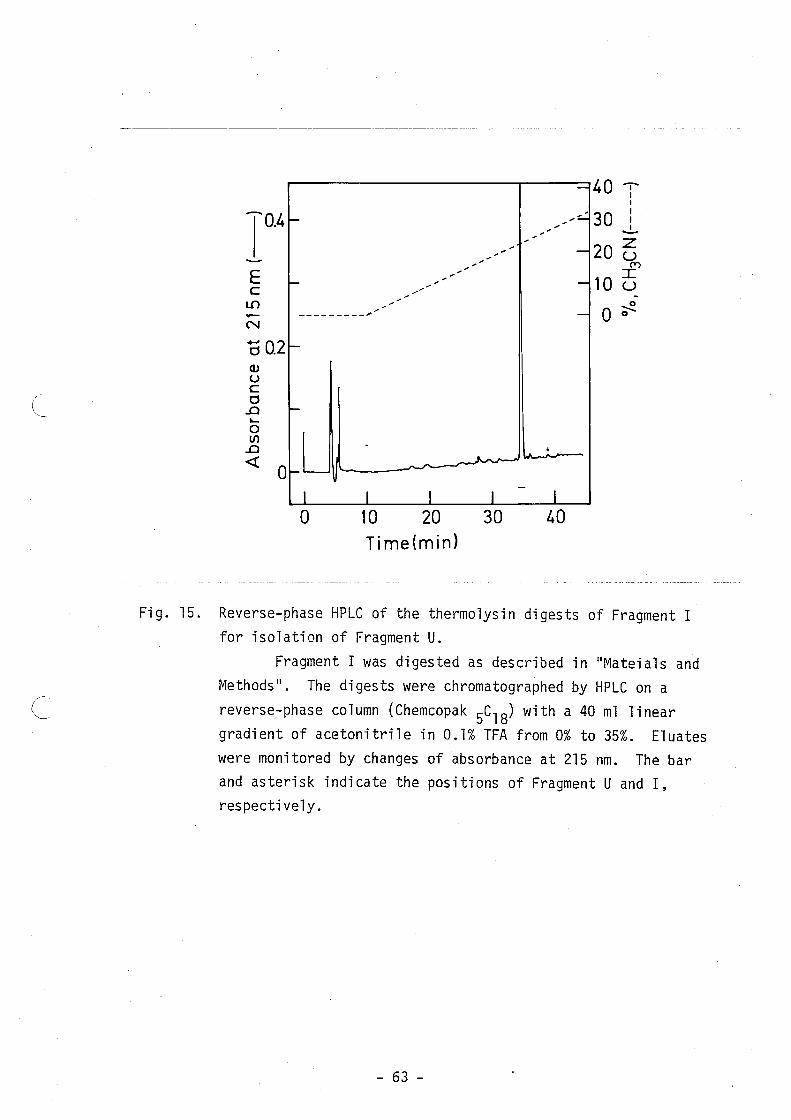
( "--
c
- 40 -.-I I
-0.4 f---
,--::":: , ,
30 I I
...!.-, ,
--, -,
, ----
,
--,
f- , -- -----
,.--
20 z u
('t")
10 I U -
E c
-- -------------", -- - 0 ~ 0 L{')
N
"00.2 I--OJ u c 0
..c I--..... 0 U)
..c * .. .-..r-
...,...,. _I--<!
0 -
I I I I I o 10 20 30 40
Time(min)
Fig. 15. Reverse-phase HPLC of the thermolysin digests of Fragment I for isolation of Fragment U.
Fragment I was digested as described in "Mateials and Methods". The digests were chromatographed by HPLC on a
reverse-phase column (Chemcopak 5C18) with a 40 ml linear gradient of acetonitrile in 0.1% TFA from 0% to 35%. Eluates were monitored by changes of absorbance at 215 nm. The bar and asterisk indicate the positions of Fragment U and I, respectively.
- 63 -
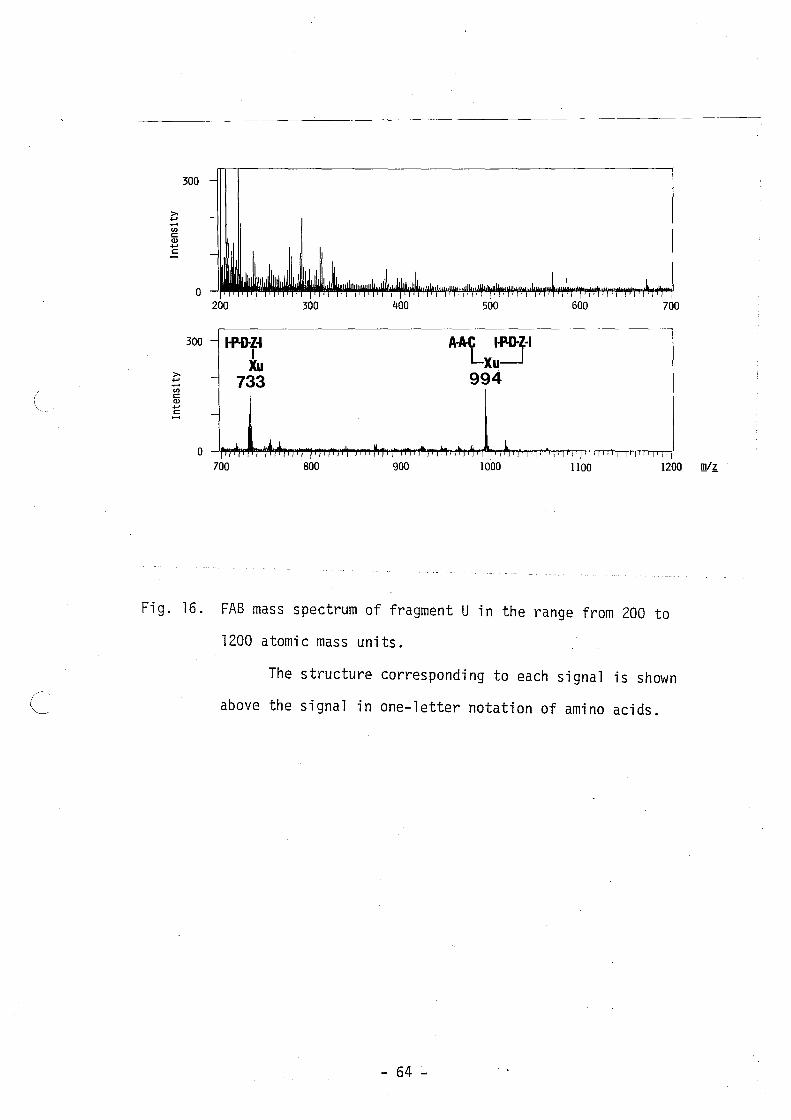
(
300
>-..... -en co Q.) ..... oS
0 ' , I
200 300 400 500 600 700
300 - I-P-D-Z-I A-A-C I.p.oll I Lxu Xu
>- 733 994 ..... -en co Q.) ..... oS -
.11 IL I. i 0 , I I I I , I I I I
700 800 900 1000 1100 1200
Fig. 16. FAB mass spectrum of fragment U in the range from 200 to
1200 atomic mass units.
The structure corresponding to each signal is shown
above the signal in one-letter notation of amino acids.
- 64 -
!!lI~
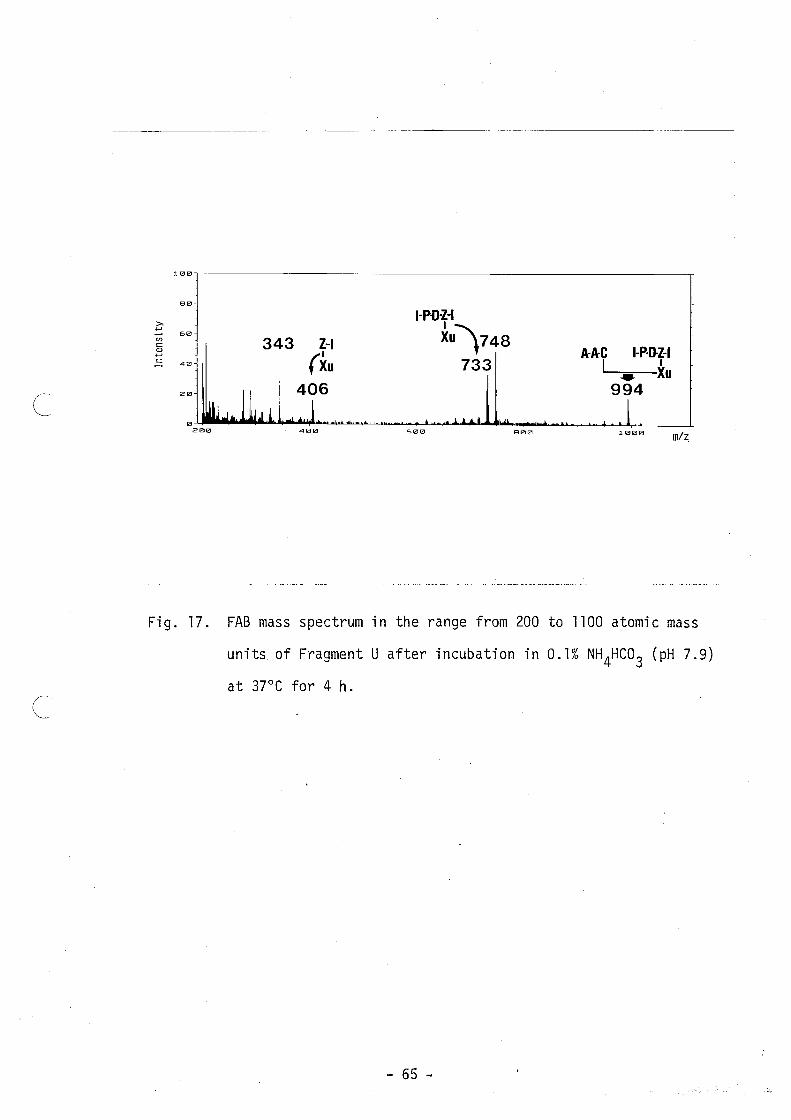
c
100.-----------------------------------------------__ ~
» ..... en c
'" .....
80
C <10
20
343
<100
I-P-D-Z-I
XU\748 733
500 800
A-A·C I
I-P·D-Z-I I
..... Xu 994
112100
Fig. 17. FAB mass spectrum in the range from 200 to 1100 atomic mass
units. of Fragment U after incubation in 0.1% NH 4HC03 (pH 7.9)
at 37°C for 4 h_
- 65 -
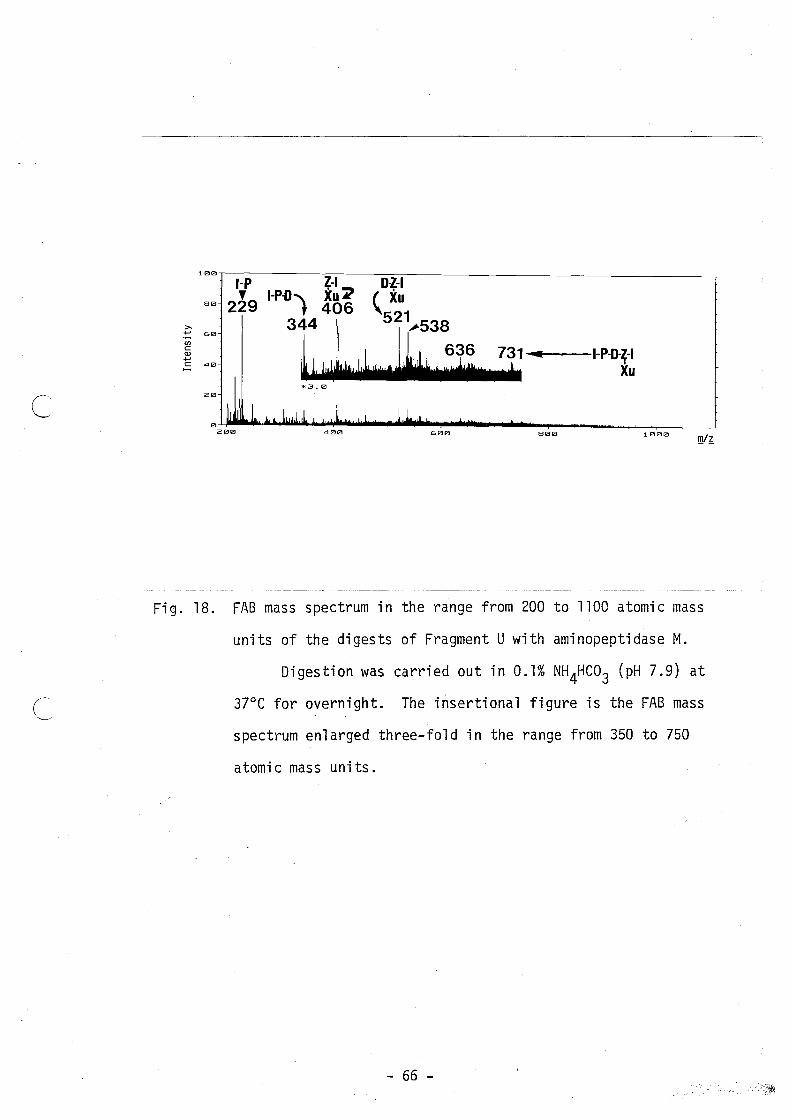
c
c
U) c Q.) ...,
100~~------~.---~~ ______________________________ ~
I-P Z-I D·Z-I , I-P·D"" XU 2 (XU
S0 229 t 406 \
C 40
344 1 . 521~538 I L 11 4 636 731-... ...---I-P·D-~-1 ~ l. H toll: tt, I. t; I mdtr t dn Xu *3.0
20
Fig. 18. FAB mass spectrum in the range from 200 to 1100 atomic mass
units of the digests of Fragment U with aminopeptidase M.
Digestion was carried out in 0.1% NH4HC03 (pH 7.9) at
37°C for overnight. The insertional figure is the FAB mass
spectrum enlarged three-fold in the range from 350 to 750
atomic mass units.
- 66 -

c
17 19 25 29 Ala-Ala-Cys Ile-Pro-Asp-Glx-Ile
I 7 ~XU ____ 7 ____ 7 ____ 7 ___ 1
Fragment U
31 32 1 2 Gly-Ala---X-Gly-Leu ,
Fig. 19. (Upper) Structure of Fragment U with a cross-linking structure between Cys~19 and Glx-28.
The amino acid composition of Fragment U was as
follows: Asx l .O' Glx l . l , Prol .O' Ala2.0 , CysO.l (1)' Ile2. l · The molecular weight of Fragment U is 993. The molecular weight of chain A (Ala-Ala-Cys) minus H and chain B (IlePro-Asp-Glx~Ile) minus OH or NH2 are 262 and 568, respectively. The residue weight of Xu is estimated to be 163.- ~ indicates sequencing by the DABITCjPITC double coupling method.
(lower) Strucure of a fragment with a cross-linking structure between amino- and carboxyl-terminus.
The fragment was derived from the fraction IV or V of the hydrolyzates of intact subtilosin A with concentrated HCl (See Fig. 3S). ~ indicates amino-terminal analysis by the dansylation metnod. The yield of this fragment was about 2%.
- 67 -
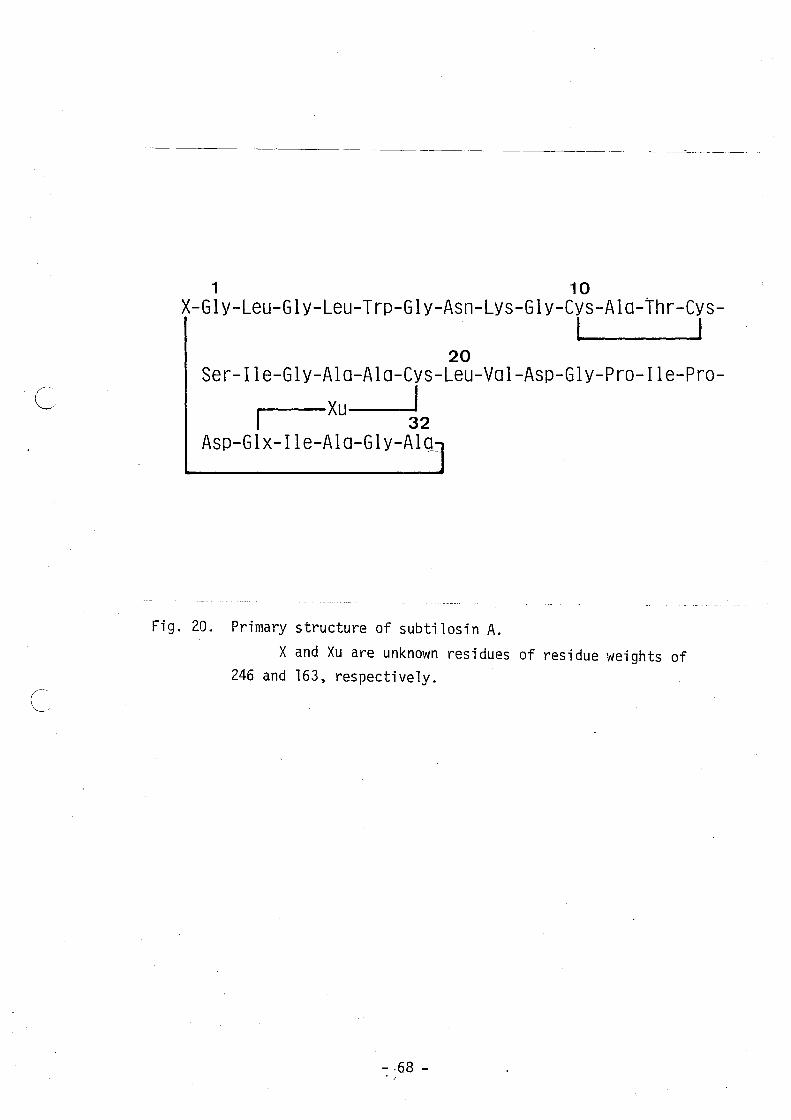
----------------
1 10 X-GlY-Leu-GlY-Leu-Trp-GlY-Asn-Lys-Gly-Cys-Ala-Thr-Cys-
I I 20
Ser-Ile-Gly-Ala-Ala-Cys-Leu-Val-Asp-GlY-Pro-Ile-Pro-I
f Xu 32 Asp-Glx-Ile-Ala-GlY-AlQL
Fig. 20. Primary structure of subtilosin A.
X and Xu are unknown residues of residue weights of 246 and 163, respectively_
- ·68 -. ,
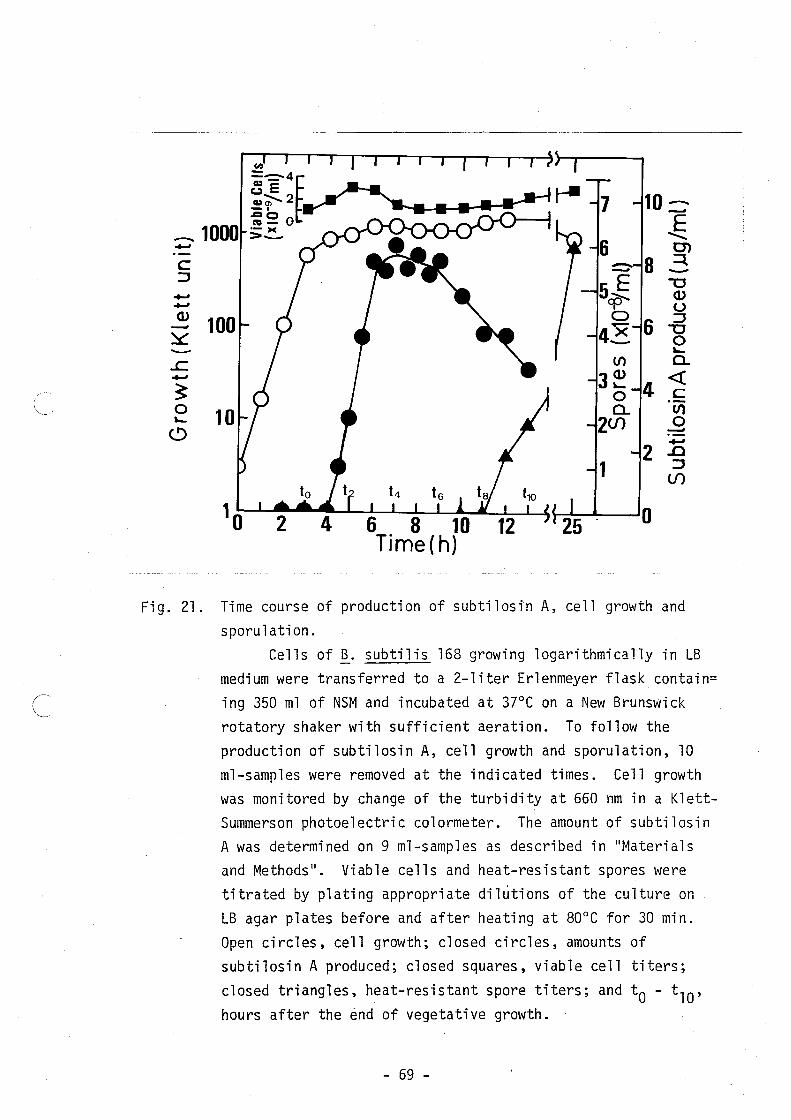
~--
7 10--_1000 E ........ ..... 0')
c :::J.. -::J
5~ -0 ..... <J) ..... I U <J) 100 0
6 ::J - ...- -0 ~ 4~ 0 - L..
..c 1Il a. ..... 3~ <{ ~ 0 4 c 0 10 a. C/l L.. 2U) 0 ~ -.....
2 .0
1 ::J (f)
10 6 8 10 0 Time (h)
Fig. 21. Time course of production of subtilosin A, cell growth and sporulation.
Cells of ~. subtilis 168 growing logarithmically in LB medium were transferred to a 2-liter Erlenmeyer flask contain= ing 350 ml of NSM and incubated at 37°C on a New Brunswick rotatory shaker with sufficient aeration. To follow the production of subti10sin A, cell growth and sporulation, 10 ml-samples were removed at the indicated times. Cell growth was monitored by change of the turbidity at 660 nm in a KlettSummerson photoelectric colormeter. The amount of subtilosin A was determined on 9 m1-samples as described in "Materials and Methods". Viable cells and heat-resistant spores were titrated by plating appropriate dilutions of the culture on LB agar plates before and after heating at 80°C for 30 min. Open circles, cell growth; closed circles, amounts of subtilosin A produced; closed squares, viable cell titers;
closed triangles, heat-resistant spore titers; and to - t lO ' hours after the end of vegetative growth.
- 69 -
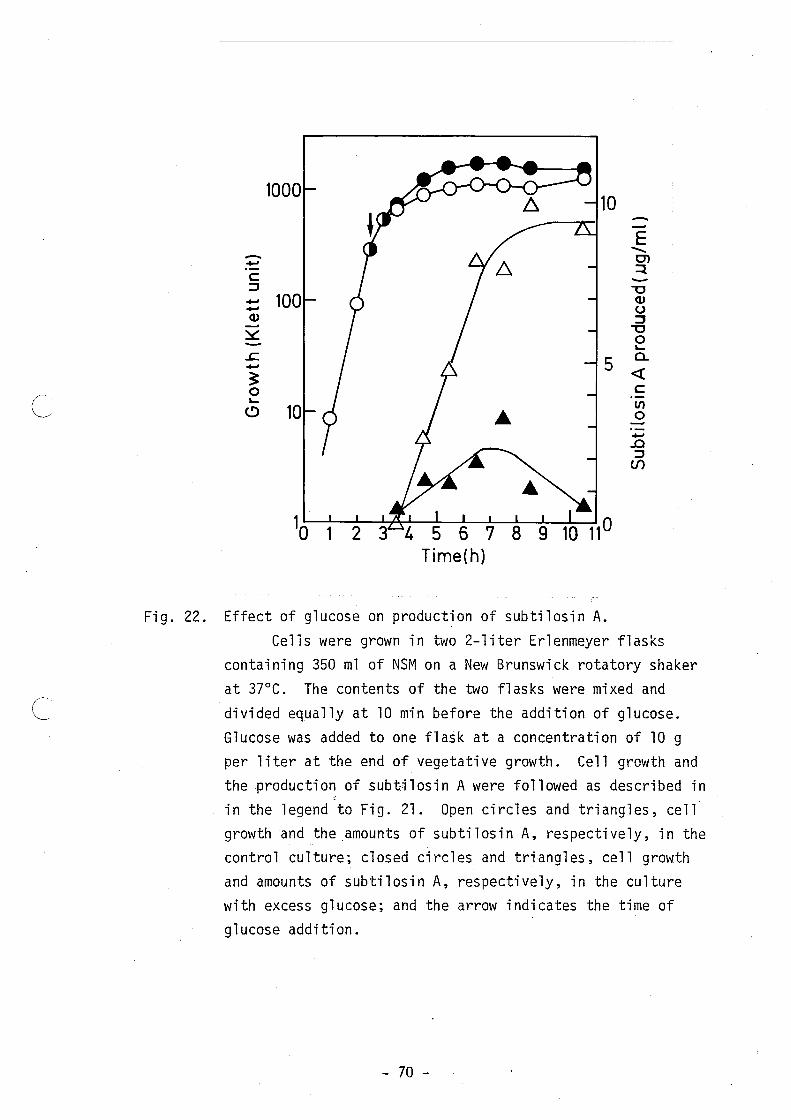
C
1000
-E -... - en .. ~
C :::J "U .. 100 (I) .. 0 (I) ~ - "U ~ 0
"-.r=. 5
Q. .. « ~ 0 c "- til C!) 10 0 ..
..c :::J (f)
Fig. 22. Effect of glucose on production of subtilosin A. Cells were grown in two 2-liter Erlenmeyer flasks
containing 350 ml of NSM on a New Brunswick rotatory shaker at 37°C. The contents of the two flasks were mixed and
c= divided equally at 10 min before the addition of glucose. Glucose was added to one flask at a concentration of 10 g per liter at the end of vegetative growth. Cell growth and the production of subtilosin A were followed as described in in the legend to Fig. 21. Open circles and triangles, cell growth and the amounts of subtilosin A, respectively, in the control culture; closed circles and triangles, cell growth and amounts of subtilosin A, respectively, in the culture with excess glucose; and the arrow indicates the time of glucose addition.
- 70 -
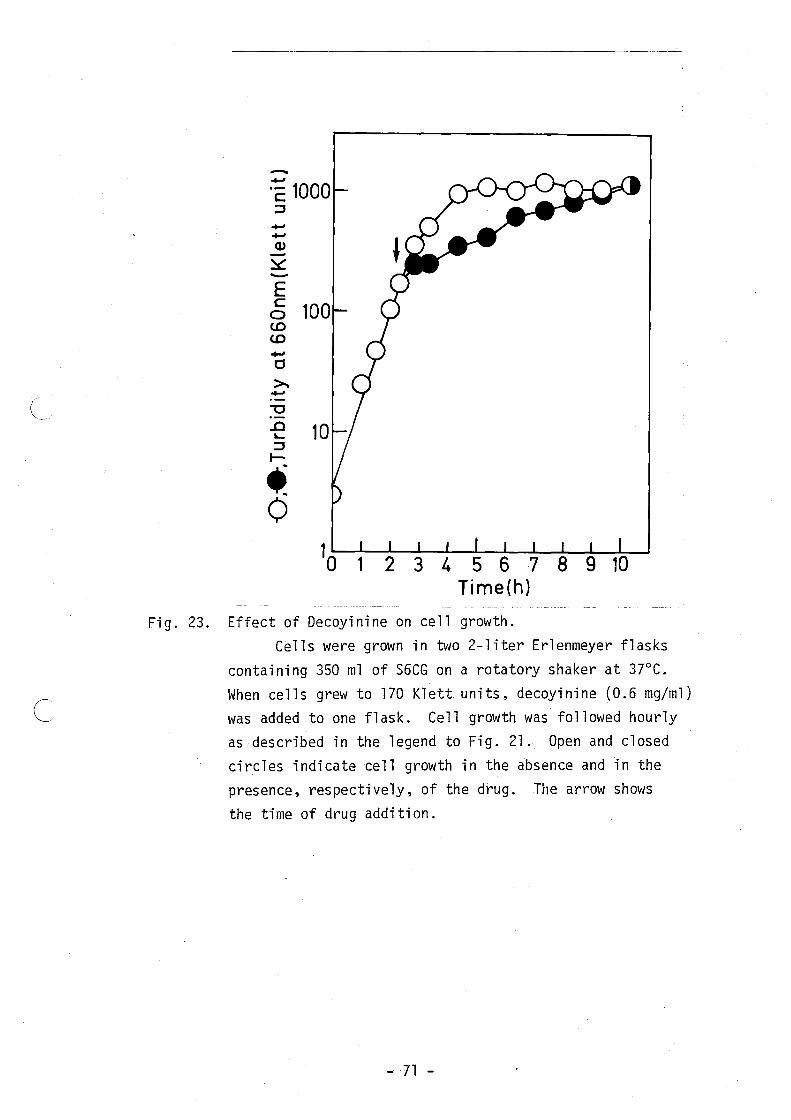
/~
l
Fig. 23.
-... ·c 1000 ::::J ... ... <V ---~ -E c: 100 a
(,0 (,0 ... d ~ ...
"'0 ..0 10 ~
::::J t--.. 0
3 4 5 6 7 Time(h)
Effect of Decoyinine on cell growth.
9 10
Cells were grown in two 2-liter Erlenmeyer flasks containing 350 ml of S6CG on a rotatory shaker at 37°C. When cells grew to 170 Klett units, decoyinine (0.6 mg/ml) was added to one flask. Cell growth was followed hourly as described in the legend to Fig. 21. Open and closed circles indicate cell growth in the absence and in the presence, respectively, of the drug. The arrow shows the time of drug addition.
- 71 -
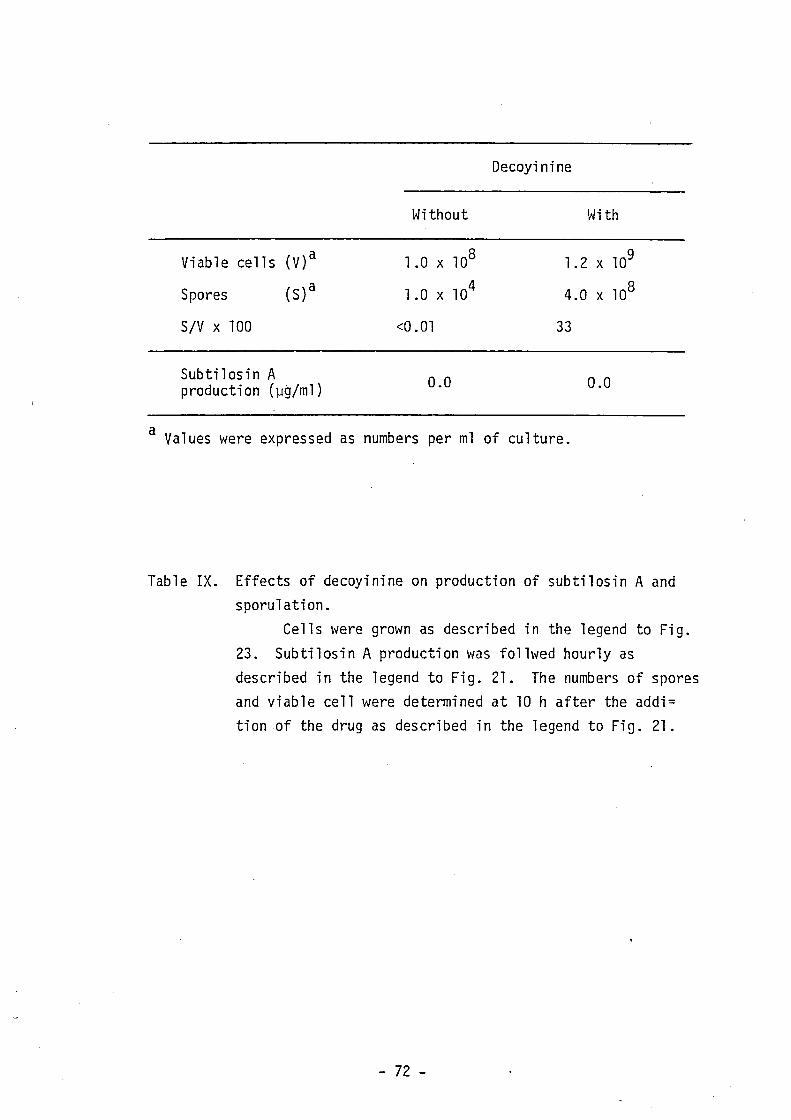
Viable cells (V)a
Spores (S)a
SIV x 100
Subtilosin A production (~g/ml)
Without
1 .0 x 108
1.0 x 10⁴
<0.01
0.0
Oecoyinine
With
1.2 x 10⁹
4.0 x 10⁸
33
0.0
a Values were expressed as numbers per ml of culture.
Table IX. Effects of decoyinine on production of subtilosin A and sporulation.
Cells were grown as described in the legend to Fig. 23. Subtilosin A production was follwed hourly as described in the legend to Fig. 21. The numbers of spores and viable cell were determined at la h after the addi= tion of the drug as described in the legend to Fi~. 21.
- 72 -
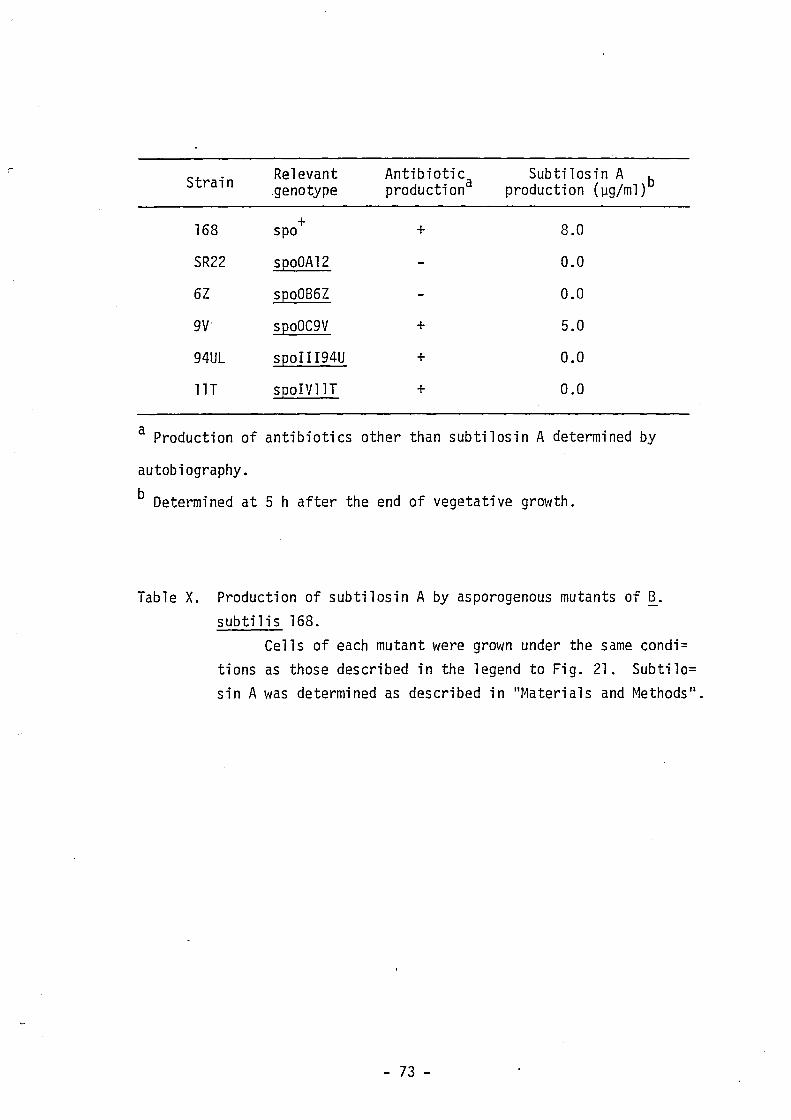
Strain Relevant Antibiotic Subtil os i n A genotype productiona production (~g/ml)b
168 + 8.0 spo +
SR22 s~oOA12 0.0
6Z s~oOB6Z 0.0
9V· s200C9V + 5.0
94UL s~oII I94U + 0.0
llT s~oIVllT + 0.0
a Production of antibiotics other than subtilosin A determined by
autobiography.
b Determined at 5 h after the end of vegetative growth.
Table X. Production of subtilosin A by asporogenous mutants of ~. subtilis 168.
Cells of each mutant were grown under the same condi= tions as those described in the legend to Fig. 21. Subtilo= sin A was determined as described in IIMaterials and Methods".
- 73 -
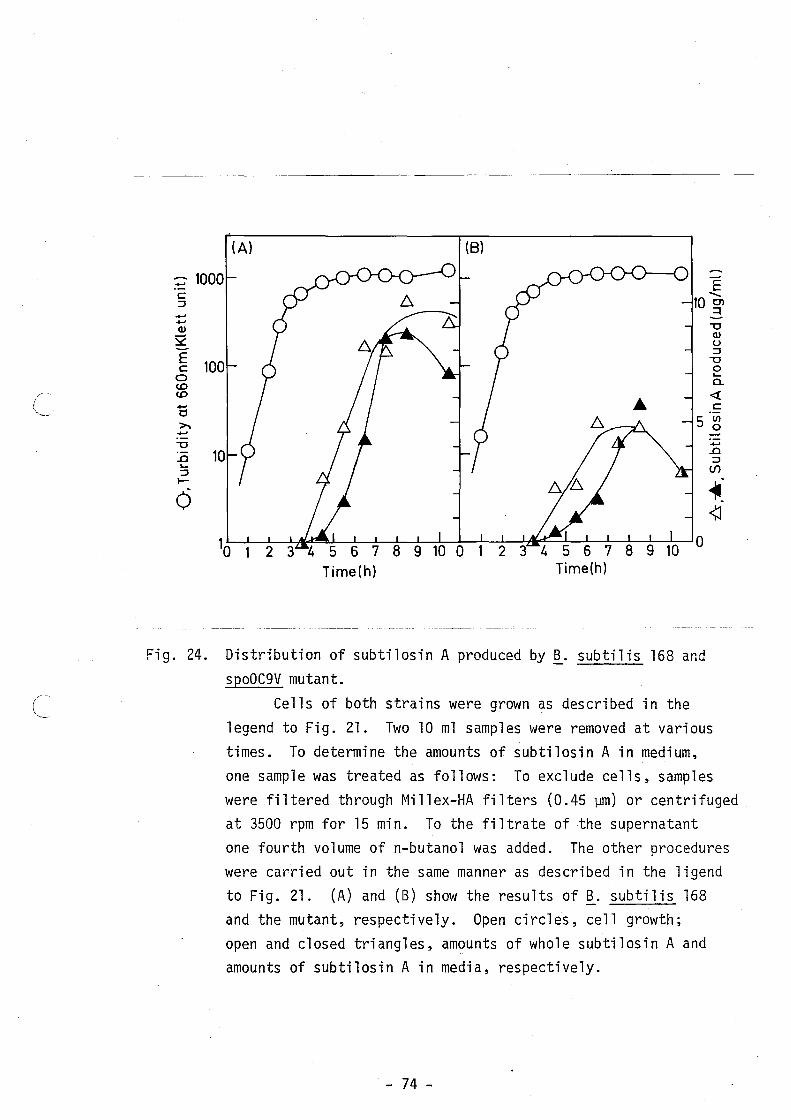
r~'
( "--
C~
::; 1000 c ::3
...... ...... Q)
~
E 100 c
a CD CD ...... t:I >-. ...... "0
(A) (8)
E -1O0l ~
"0 Q) U ::3 "0 o ~
0-
4: c
5 :g
..0 10 ~
::3 ~
(5
Time(h)
Fig. 24. Distribution of subtilosin A produced by ~. subtilis 168 and spoOC9V mutant.
Cells of both strains were grown as described in the legend to Fig. 21. Two 10 ml samples were removed at various times. To determine the amounts of subtilosin A in medium, one sample was treated as follows: To exclude cells, samples were filtered through Millex-HA filters (0.45 ~m) or centrifuged at 3500 rpm for 15 min. To the filtrate of the supernatant one fourth volume of n-butanol was added. The other procedures were carried out in the same manner as described in the ligend to Fig. 2l. (A) and (B) show the results of ~. subtilis 168 and the mutant, respectively. Open circles, cell growth; open and closed triangles, amounts of whole subtilosin A and amounts of subtilosin A in media, respectively.
- 74 -
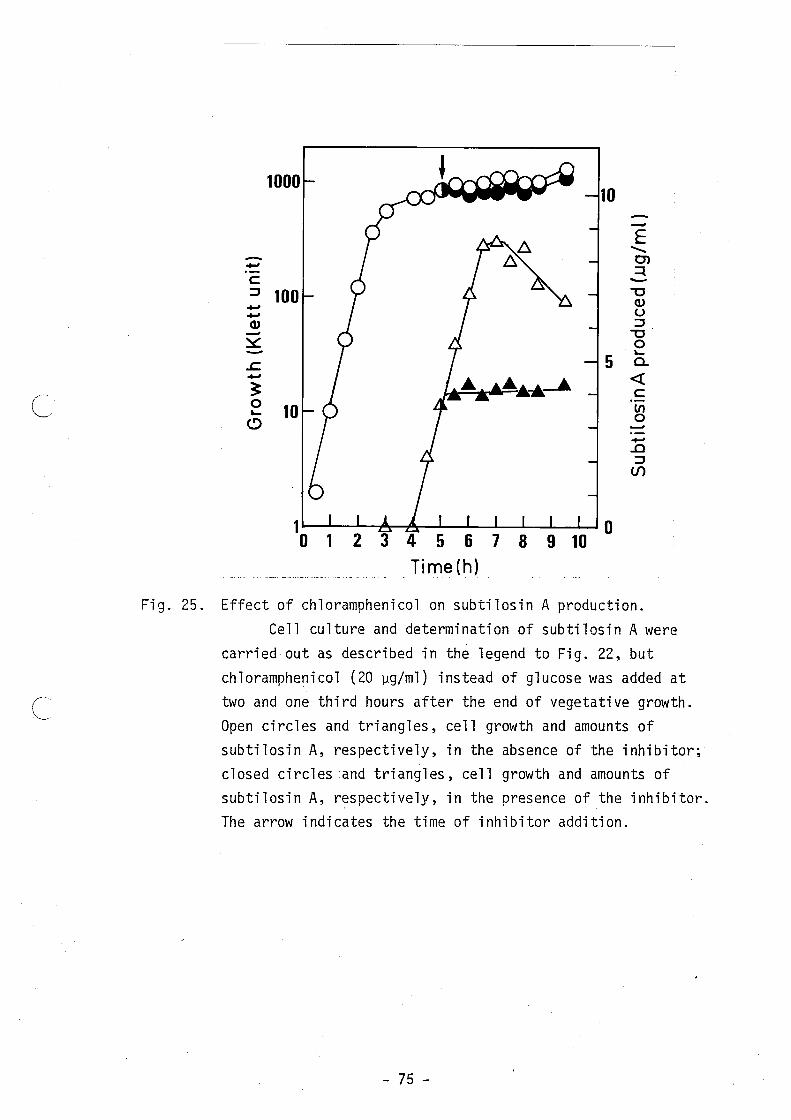
,-
L
c
1000 10
E " ..... en
~ ~ c ----~ 100 10 ~
~ u ~
~ ~ ..... 10 ~ 0
~
~ 5 OL ~ ~ ~ c 0 10 ~ ~
~ 0
~
~ ~ ~
1--~~~~~--~~~~~~0
o 1 234 5 678 9 10 Tirne(h)
Fig. 25. Effect of chloramphenicol on subtilosin A production. Cell culture and determination of subtilosin A were
carried out as described in the legend to Fig. 22, but chloramphenicol (20 ~g/ml) instead of glucose was added at two and one third hours after the end of vegetative growth. Open circles and triangles, cell growth and amounts of subtilosin A, respectively, in the absence of the inhibitor; closed circles :and triangles, cell growth and amounts of subtilosin A, respectively, in the presence of the inhibitor. The arrow indicates the time of inhibitor addition.
- 75 -
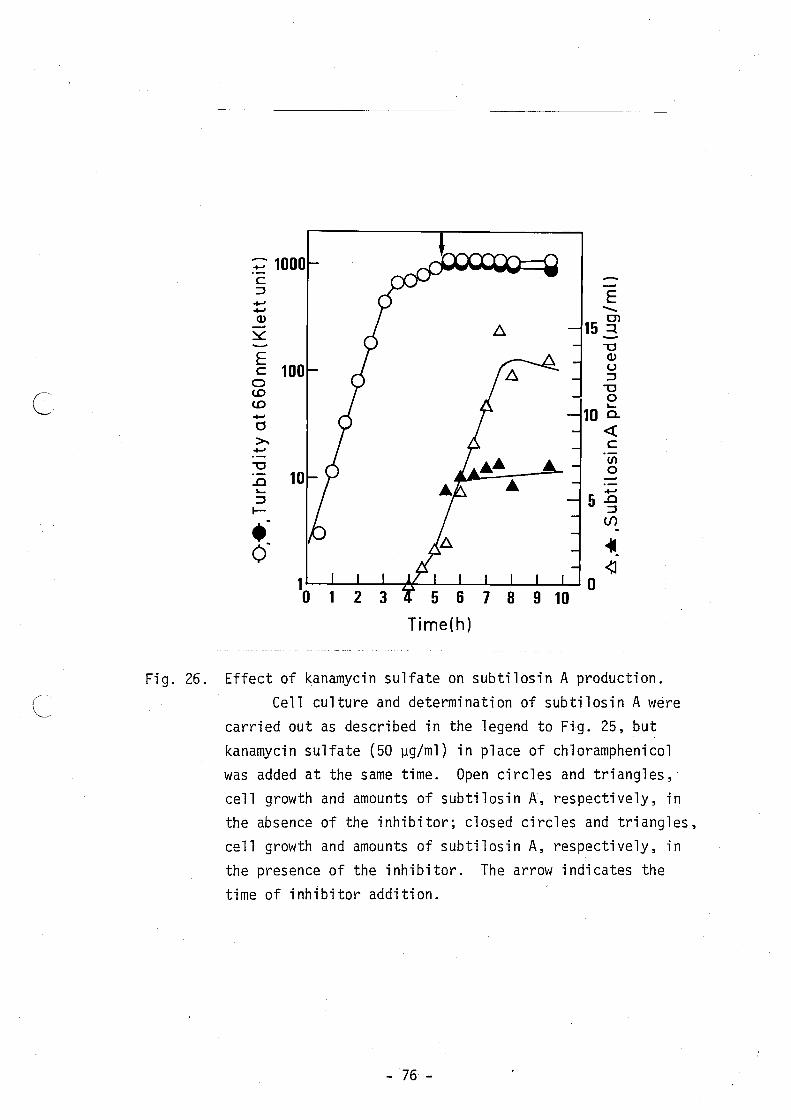
c
::- 1000 c :J --Q) -~ E c 100
a CD CD -o
-
7 8 9 10
Time(h)
E -.. 15 ~ -""0
Q)
U :J
""0 o ~
100-« c U'I o
-5.0 :J (/)
Fig. 26. Effect of kanamycin sulfate on subtilosin A production. ~ Cell culture and determination of subtilosin A were
carried out as described in the legend to Fig. 25, but kanamycin sulfate (50 ~g/ml) in place of chloramphenicol was added at the same time. Open circles and triangles, cell growth and amounts of subtilosin A, respectively, in the absence of the inhibitor; closed circles and triangles, cell growth and amounts of subtilosin A, respectively, in the presence of the inhibitor. The arrow indicates the time of inhibitor addition.
- 76 -
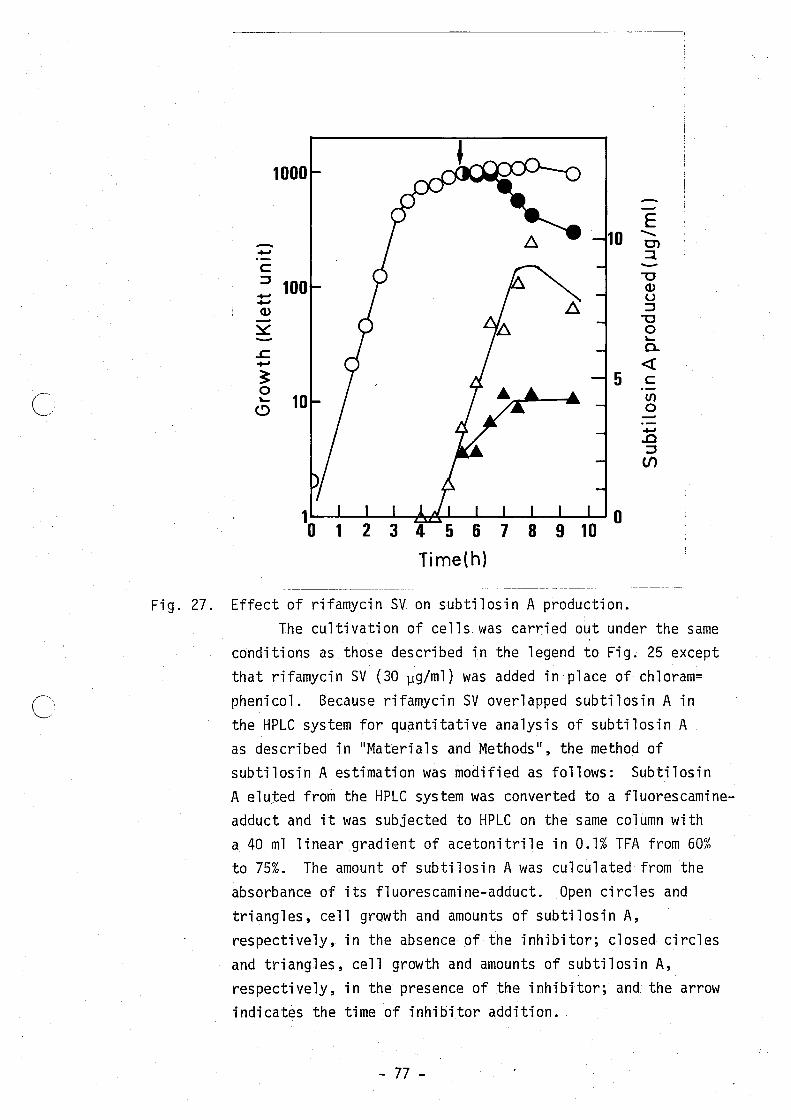
C'
c
1000
E 10 ........ - Ol ... ~
C :::J "U
Q.) ... u ... <L> :::J - "U ~ 0
~
.c n ... « ~ 5 c 0 .-L... 10 Ul ~ 0 ...
.c :::J (/)
1 234 5 6 7 8 9 10 0
Time(h)
Fig. 27. Effect of rifamycin SV on subtilosin A production. The cultivation of cells was carried out under the same
conditions as those described in the legend to Fig. 25 except that rifamycin SV (30 ~g/ml) was added in place of chloram= phenicol. Because rifamycin SV overlapped subtilosin A in the HPLC system for quantitative analysis of subtilosin A as described in "Materials and Methods", the method of subtilosin A estimation was modified as follows: Subtilosin A eluted from the HPLC system was converted to a fluorescamineadduct and it was subjected to HPLC on the same column with a 40 ml linear gradient of acetonitrile in 0.1% TFA from 60% to 75%. The amount of subtilosin A was culculated from the absorbance of its fluorescamine-adduct. Open circles and triangles, cell growth and amounts of subtilosin A, respectively, in the absence of the inhibitor; closed circles and triangles, cell growth and amounts of subtilosin A, respectively, in the presence of the inhibitor; and the arrow indicates the time of inhibitor addition.
- 77 -
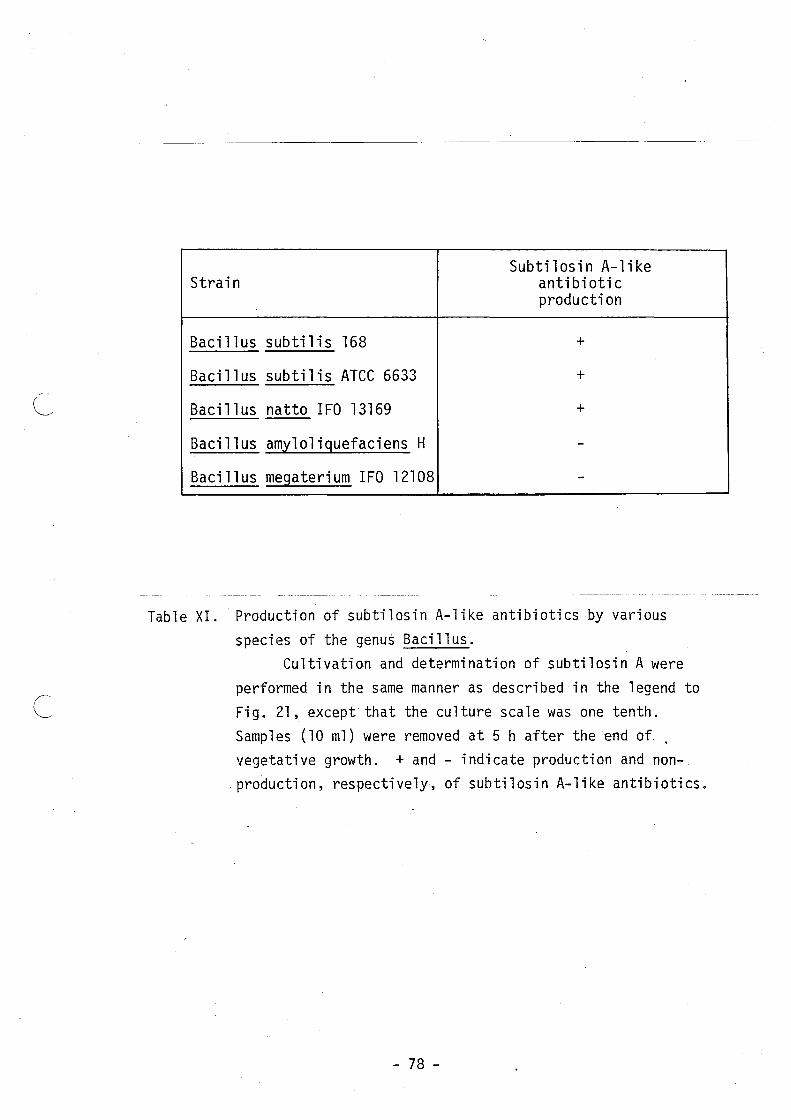
c
Subtilosin A-like Strain antibiotic
production
Baci 11 us subtilis 168 +
Baci 11 us subtil is ATCC 6633 +
Bacillus natto IFO 13169 +
Bacillus amyloliguefaciens H -Baci 11 us megaterium IFO 12108 -
Table XI .. Production of subtilosin A-like antibiotics by various species of the genus Bacillus.
Cultivation and determination of subtilosin A were performed in the same manner as described in the legend to Fig. 21, except that the culture scale was one tenth. Samples (10 ml) were removed at 5 h after the end of .. vegetative growth. + and - indicate production and non-
. production, respectively, of subtilosin A-like antibiotics.
- 78 -
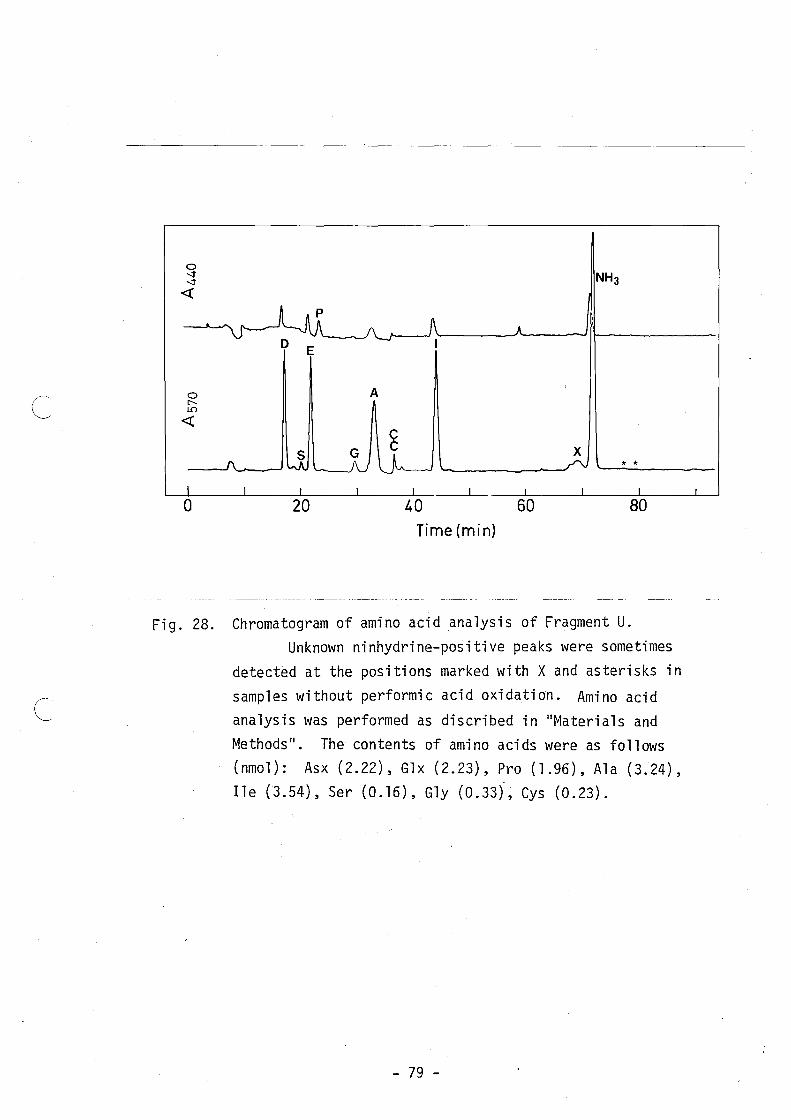
c o r-II)
<t
Time (min)
NH3
x * *
Fig. 28. Chromatogram of amino acid analysis of Fragment U. Unknown ninhydrine-positive peaks were sometimes
detected at the positions marked with X and asterisks in
samples without performic acid oxidation. Amino acid
analysis was performed as discribed in lI~laterials and Methods ll
• The contents of amino acids were as follows (nmol): Asx (2.22), Glx (2.23), Pro (1.96), Ala (3.24), Ile (3.54), Ser (0.16), Gly (0.33), Cys (0.23).
- 79 -
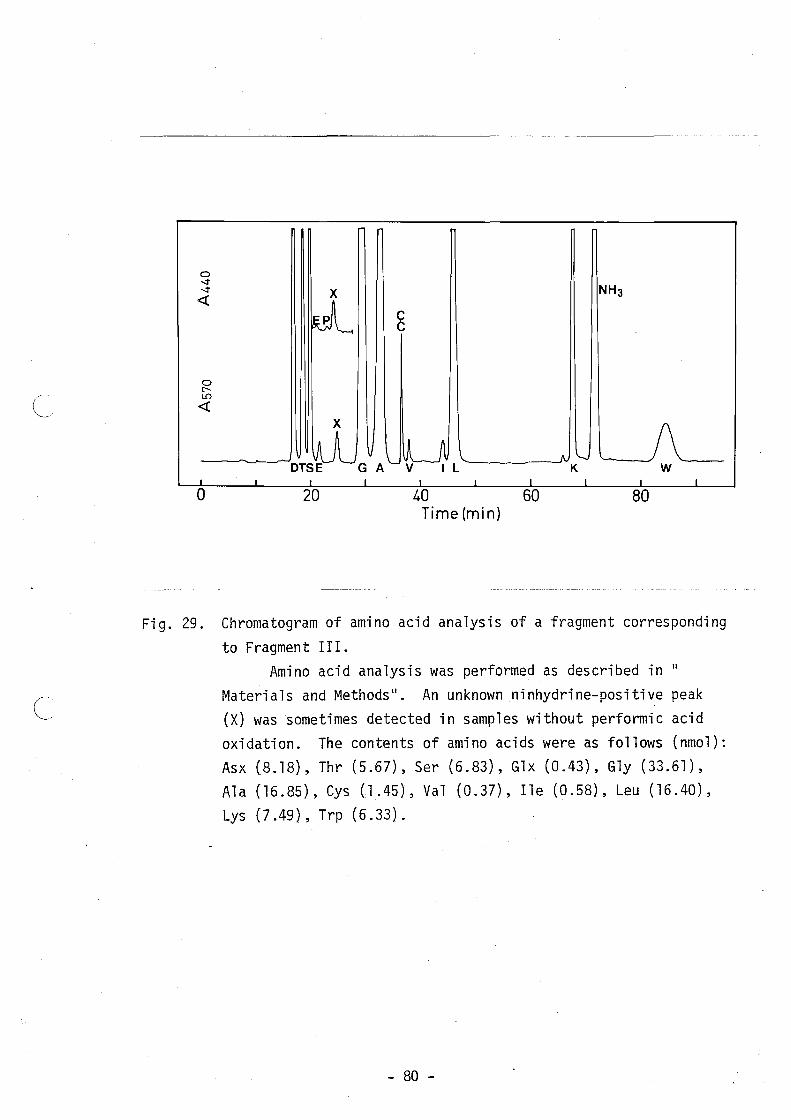
c X
--~~-.lDTS~GV A'-W L'-----~-JflvK'-J w
Fig. 29. Chromatogram of amino acid analysis of a fragment corresponding
to Fragment II I. Amino acid analysis was performed as described in II
Materials and Methods ll• An unknown ninhydrine-positive peak
(X) was sometimes detected in samples without performic acid oxidation. The contents of amino acids were as follows (nmo1): Asx (8.18), Thr (5.67), Ser (6.83), G1x (0.43), G1y (33.61), Ala (16.85), Cys (1.45), Val (0.37), Ile (0.58), Leu (16.40), Lys (7.49), Trp (6.33).
- 80 -
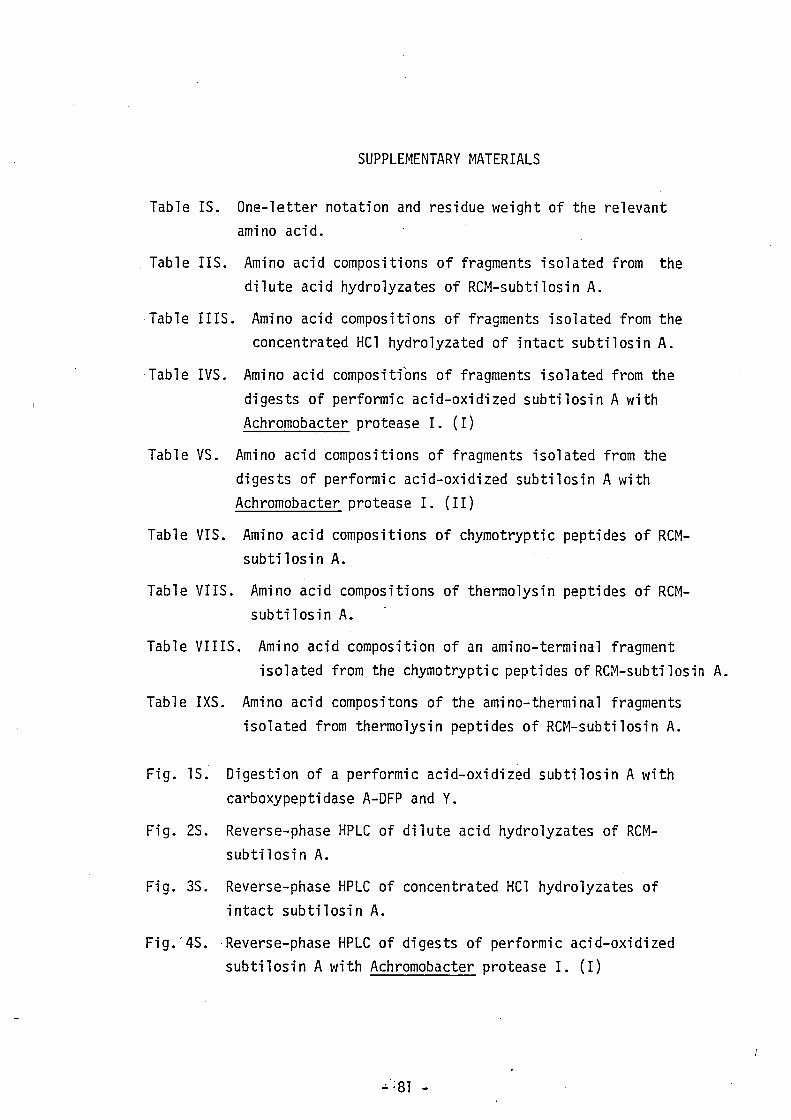
SUPPLEMENTARY MATERIALS
Table IS. One-letter notation and residue weight of the relevant amino acid.
Table lIS. Amino acid compositions of fragments isolated from the dilute acid hydrolyzates of RCM-subtilosin A.
Table IllS. Amino acid compositions of fragments isolated from the concentrated HCl hydrolyzated of intact subtilosin A.
Table IVS. Amino acid compositions of fragments isolated from the digests of performic acid-oxidized subtilosin A with Achromobacter protease I. (I)
Table VS. Amino acid compositions of fragments isolated from the digests of performic acid-oxidized subtilosin A with Achromobacter protease I. (11)
Table VIS. Amino acid compositions of chymotryptic peptides of RCMsubtilosin A.
Table VIIS. Amino acid compositions of thermolysin peptides of RCMsubtilosin A.
Table VIIIS. Amino acid composition of an amino-terminal fragment isolated from the chymotryptic peptides of RCM-subtilosin A.
Table IXS. Amino acid compositons of the amino-therminal fragments isolated from thermolysin peptides of RCM-subtilosin A.
Fig. lS. Digestion of a performic acid-oxidized subtilosin A with carboxypeptidase A-DFP and Y.
Fig. 2S. Reverse-phase HPLC of dilute acid hydrolyzates of RCMsubtilosin A.
Fig. 3S. Reverse-phase HPLC of concentrated HCl hydrolyzates of intact subtilosin A.
Fig.'4S.Reverse-phase HPLC of digests of performic acid-oxidized subtilosin A with Achromobacter protease I. (I)
Fig. 55. Reverse-phase HPLC of digests of performic acid-oxidized subtilosin A with Achromobacter protease I. (11)
Fig. 65. Reverse-phase HPLC of chymotryptic peptides of RCM-subtilosin A.
Fig. 75. Reverse-phase HPLC of thermolysin peptides of RCM-subtilosin A.
Fig. 85. Isolation of amino-terminal fragments from chymotryptic peptides of RCM-subtilosin A by reverse-phase HPLC.
Fig. 95. Isolation of amino-terminal fragments from thermolysin peptides of RCM-subtilosin A by reverse-phase HPLC.
Fig. 105. Amino acid sequences of fragments other than those shown in Fig. 9.
Figures 25-95 show the first chromatographies for isolation of fragments used for amino acid sequencing of subtilosin A. Fractions pooled were further chromatographed on the same column with more shallow gradients.
- 82 -
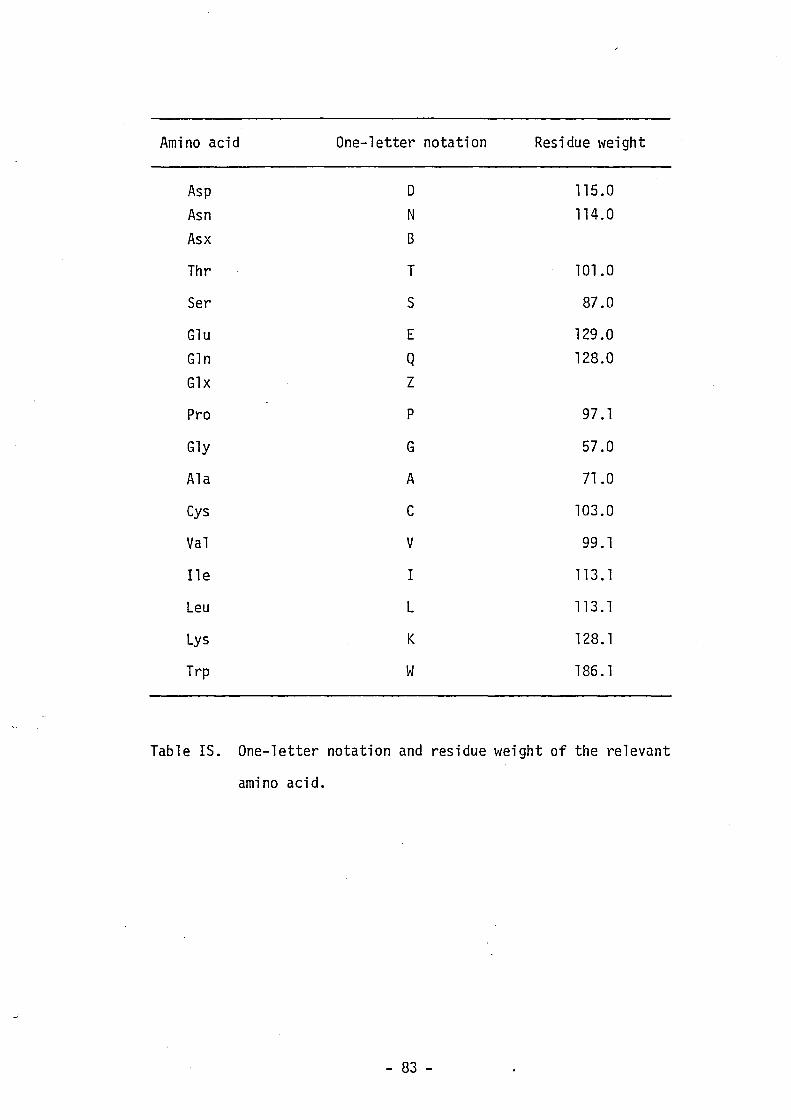
Amino acid One-letter notation Residue weight
Asp D 115.0 Asn N 114.0 Asx B
Thr T 101.0
Ser S 87.0
G1u E 129.0 G1n Q 128.0 G1x Z
Pro P 97.1
G1y G 57.0
Ala A 7l.0
Cys C 103.0
Va1 V 99.1
Ile I 113. 1
Leu L 113.1
Lys K 128.1
Trp W 186.1
Table IS. One-letter notation and residue weight of the relevant
amino acid.
- 83 -
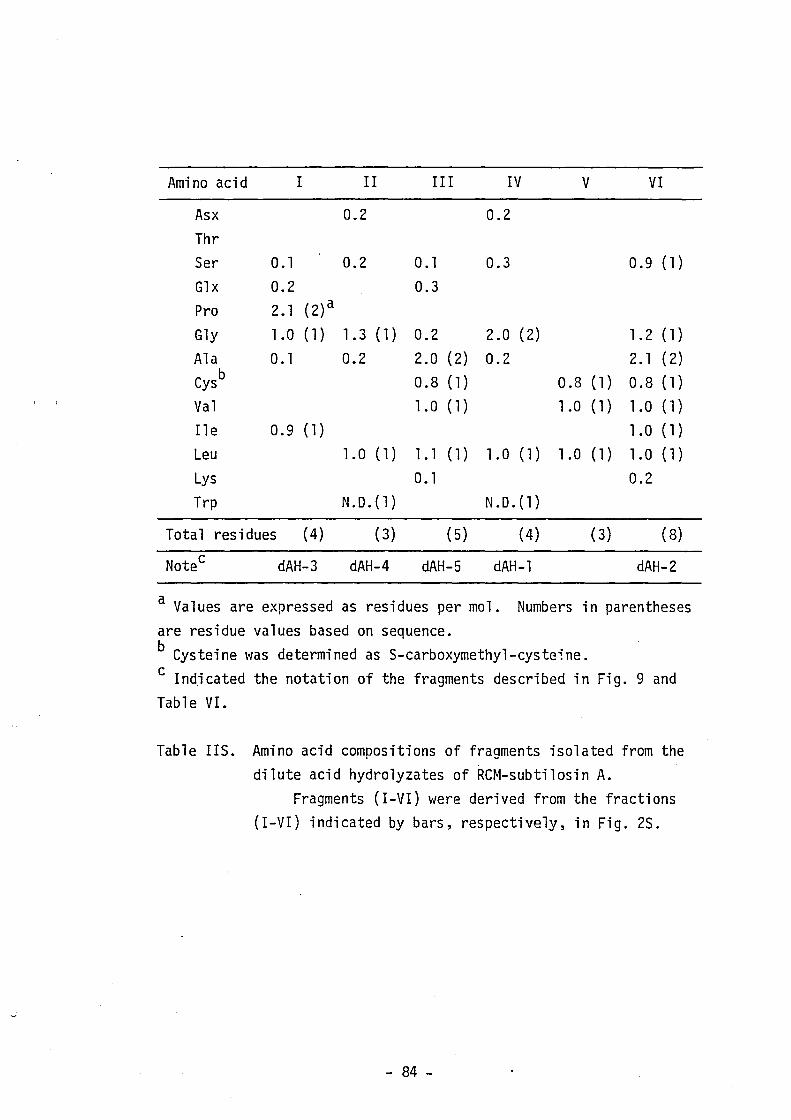
Amino acid
Asx Thr Ser Glx Pro Gly Ala CYSb
Val Ile
Leu Lys Trp
I
0.1 0.2 2.1 (2)a
1.0 ( 1 )
0.1
0.9 (1)
Total residues (4)
dAH-3
Il
0.2
0.2
1.3 (1) 0.2
1.0 (1)
N.D.(l)
( 3)
dAH-4
III IV V VI
0.2
0.1 0.3 0.9 (1)
0.3
0.2 2.0 ( 2) 1.2 (1) 2.0 ( 2) 0.2 2.1 (2) 0.8 (1) 0.8 (1) 0.8 (1) 1.0 (1) 1.0 (1) 1.0 (1)
1.0 (1) 1.1 (1) 1.0 (1) 1.0 (1) 1.0 (1) 0.1 0.2
N.D.(1)
(5) ( 4) ( 3) ( 8)
dAH-5 dAH-l dAH-2
a Values are expressed as residues per mol. Numbers in parentheses are residue values based on sequence. b Cysteine was determined as S-carboxymethyl-cysteine. c Indicated the notation of the fragments described in Fig. 9 and Table VI.
Table lIS. Amino acid compositions of fragments isolated from the dilute acid hydrolyzates of RCM-subtilosin A.
Fragments (I-VI) were derived from the fractions (I-VI) indicated by bars, respectively, in Fig. 25.
- 84 -
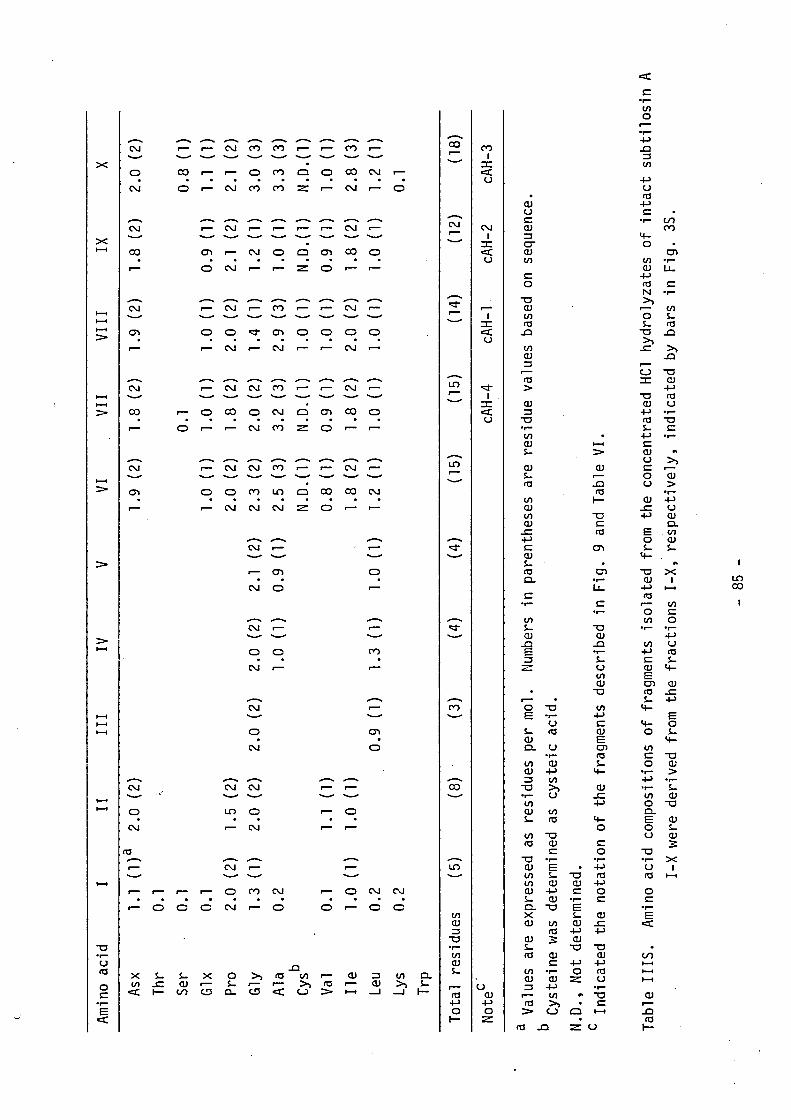
Am
ino
acid
I
11
III
IV
V
VI
VII
VII
I IX
X
Asx
1.
1 (1
)a
2.0
(2)
1.9
(2)
1.8
(2)
1.9
(2)
1.8
(2)
2.0
(2)
Thr
0.1
Ser
0.1
0.1
0.8
(1)
Glx
O.
1
1.0
(1)
1.0
(1)
1.0
(1)
0.9
(1)
1.1
(1)
Pro
2.0
(2)
1.5
(2)
2.0
(2)
1.8
(2)
2.0
(2)
2.1
(2)
2.1
(2)
Gly
1.
3 (1
) 2.
0 (2
) 2.
0 (2
) 2.
0 (2
) 2.
1 {2
} 2.
3 (2
) 2.
0 (2
) 1.
4 (1
) 1.
2 (1
) 3.
0 (3
) A
la
0.2
1.0
(l)
0.9
(l)
2.5
(3)
3.2
(3)
2.9
(3)
1.0
(l)
3.3
(3)
Cysb
N
.D.(
l)
N.D
.(1)
1.0
(1)
N.D
.(1)
N.D
.(1)
Val
O. 1
1.
1 (1
) 0.
8 (1
) 0.
9 (l
) 1.
0 (1
) 0.
9 (1
) 1.
0 (1
) Il
e 1.
0 (1
) 1.
0 (1
) 1.
8 (2
) 1.
8 (2
) 2.
0 (2
) 1.
8 (2
) 2.
8 (3
) Le
u 0.
2 0.
9 (l
) 1.
3 (l
) 1.
0 (l
) 1.
2 (1
) 1.
0 (1
) 1.
0 (1
) 1.
0 (1
) 1.
2 (1
) Ly
s 0.
2 0.
1 Tr
p
Tot
al
resi
dues
(5
) ( 8
) (3
) (4
) (4
) (1
5)
(15)
(1
4 )
(12
) ( 1
8)
Not
ec·
cAH
-4
cAH
-l cA
H-2
cA
H-3
a V
alue
s ar
e ex
pres
sed
as
resi
dues
pe
r m
ol.
Num
bers
in
par
enth
eses
are
res
idue
val
ues
base
d on
seq
uenc
e.
b C
yste
ine
was
de
term
ined
as
cyst
eic
acid
. N
.D.,
Not
det
erm
ined
. c
Indi
cate
d th
e no
tati
on o
f th
e fr
agm
ents
de
scri
bed
in F
ig.
9 an
d T
able
VI.
Tab
le
IllS
. A
min
o ac
id c
ompo
sitio
ns o
f fr
agm
ents
is
olat
ed f
rom
th
e co
ncen
trat
ed H
Cl
hydr
olyz
ates
of
in
tact
sub
tilo
sin
A
I-X w
ere
deri
ved
from
th
e fr
acti
ons
I-X
, re
spec
tive
ly,
indi
cate
d by
bar
s in
Fig
. 3S
.
-85
-
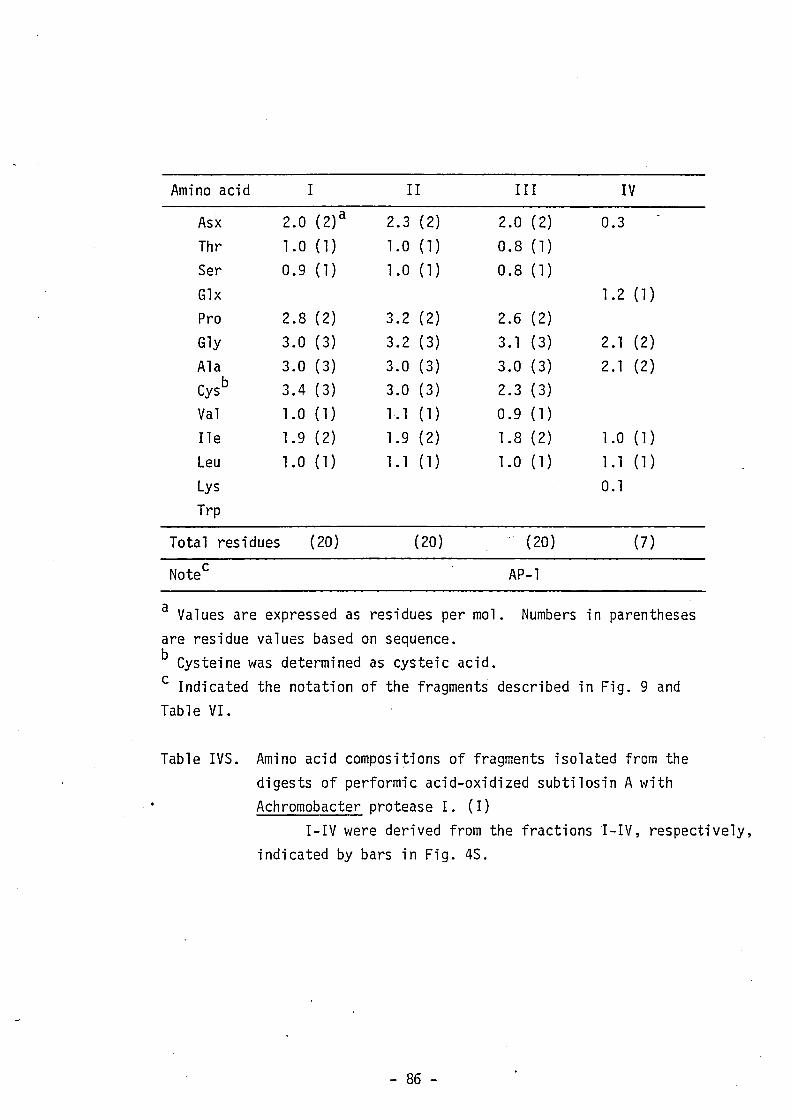
Amino acid I Il III IV
Asx 2.0 (2)a 2.3 ( 2) 2.0 (2) 0.3 Thr 1.0 (1) 1.0 (1) 0.8 (1) 5er 0.9 (1) 1.0 (1) 0.8 (1) Glx 1.2 (1)
Pro 2.8 (2) 3.2 ( 2) 2.6 (2) Gly 3.0 ( 3) 3.2 (3) 3.1 (3) 2.1 (2) Ala 3.0 (3) 3.0 (3) 3.0 ( 3) 2.1 (2) Cysb 3.4 (3) 3.0 (3) 2.3 ( 3) Val 1.0 (1) 1.1 (1) 0.9 (1) !le 1.9 ( 2) 1.9 ( 2) 1.8 (2) 1.0 (1)
Leu 1.0 (1) 1.1 (1) 1.0 (1) 1.1 (1)
Lys 0.1 Trp
Total residues (20) (20) (20) (7)
NoteC AP-l
a Values are expressed as residues per mol. Numbers in parentheses are residue values based on sequence. b Cysteine was determined as cysteic acid. c Indicated the notation of the fragments described in Fig. 9 and Table VI.
Table IV5. Amino acid compositions of fragments isolated from the digests of performic acid-oxidized subtilosin A with Achromobacter protease I. (I)
I-IV were derived from the fractions I-IV, respectively, indicated by bars in Fig. 45.
- 86 -
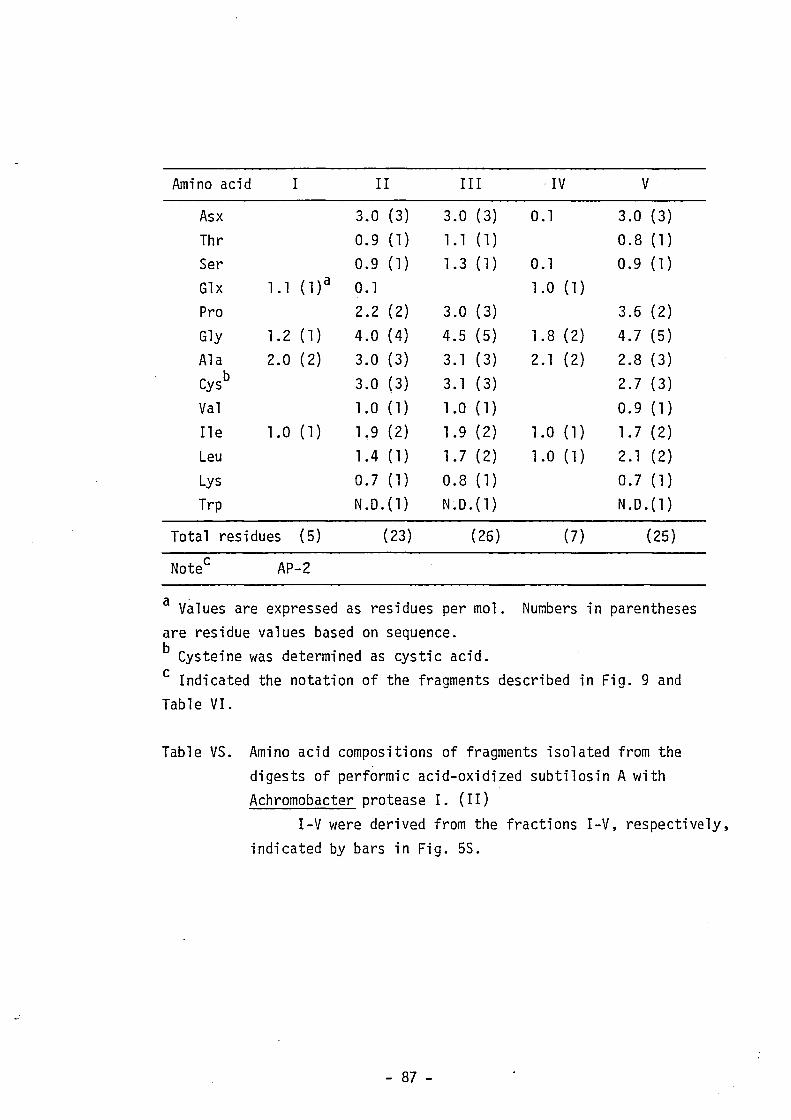
Amino acid I Il III . IV V·
Asx 3.0 (3) 3.0 (3) 0.1 3.0 (3) Thr 0.9 (1) 1.1 (1 ) 0.8 (1)
Ser 0.9 (1) 1.3 (1) 0.1 0.9 (1)
G1x 1.1 ( 1 ) a O. 1 1.0 (1)
Pro 2.2 (2) 3.0 (3) 3.6 ( 2) G1y 1.2 ( 1 ) 4.0 (4) 4.5 (5) 1.8 (2) 4.7 (5) Ala 2.0 ( 2) 3.0 (3) 3. 1 ( 3) 2.1 (2) 2.8 (3) Cysb 3.0 (3) 3.1 ( 3) 2.7 (3) Va1 1.0 (1) 1.0 ( 1 ) 0.9 (1)
Ile 1.0 (1) 1 ~ 9 (2) 1.9 ( 2) 1.0 (1) 1.7 (2) Leu 1.4 (1) 1.7 (2) 1.0 (1) 2.1 (2) Lys 0.7 (1) 0.8 (1) 0.7 (1)
Trp N.D.(l) N.D.(l) N.D.(l )
Total residues ( 5) ( 23) (26) (7) (25)
NoteC AP-2
a Values are expressed as residues per mol. Numbers in parentheses are residue values based on sequence. b Cysteine was determined as cystic acid. c Indicated the notation of the fragments described in Fig. 9 and Table VI.
Table VS. Amino acid compositions of fragments isolated from the digests of performic acid-oxidized subti10sin A with Achromobacter protease I. (11)
I-V were derived from the fractions I-V, respectively, indicated by bars in Fig. 5S.
- 87 -
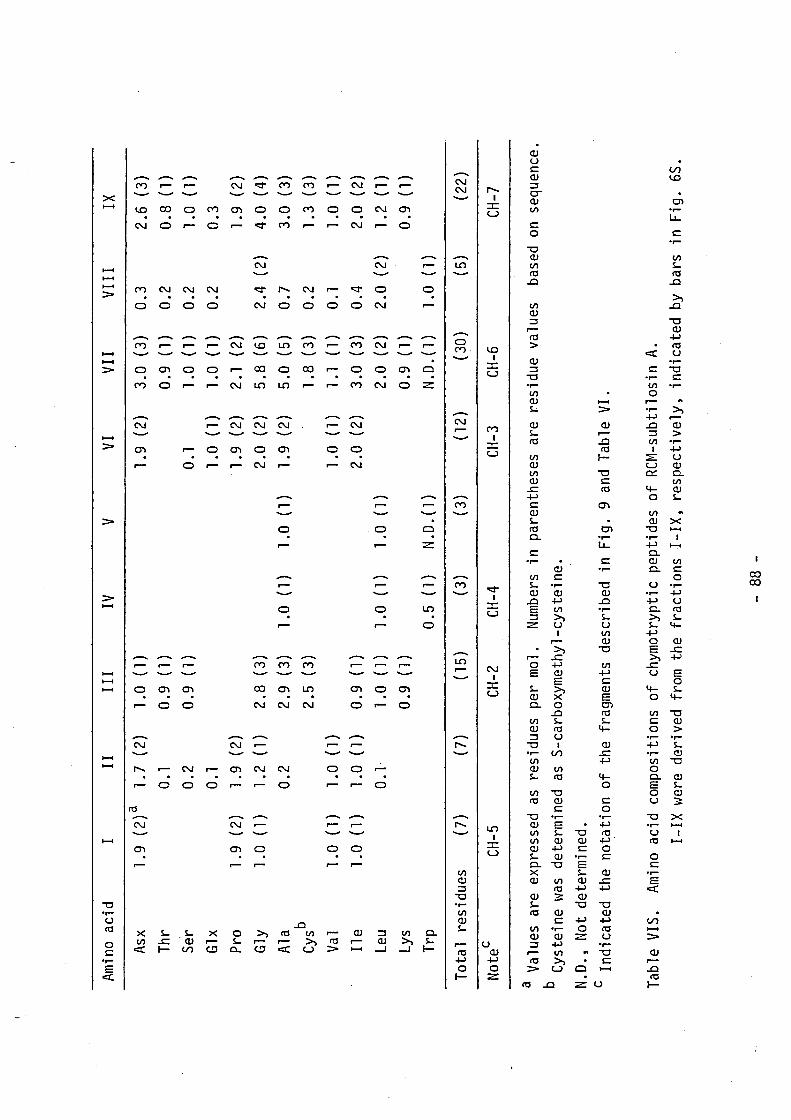
Am
ino
acid
Asx
Th
r Se
'r
Glx
Pr
o G
ly
Ala
Cy
sb
Val
Ile
Leu
Lys
Trp
Tot
al
resi
dues
Not
eC
I II
1.9
(2
)a
1.7
(2
)
0.1
1.9
(2
)
1.0
(1
)
1.0
(1
)
1.0
(1
)
0.2
0.1
1.9
(2
)
1.2
(1
)
0.2
1.0
(1)
1.0
(1)
0.1
(7)
(7)
CH-5
III
1.0
(1
)
0.9
(1
)
0.9
(1
)
2.8
(3
)
2.9
(3
)
2.5
(3
)
0.9
(1
)
1.0
(1
)
0.9
(1
)
(15
)
CH-2
IV
1.0
(1
)
1.0
(1
)
0.5
(1
)
(3)
CH-4
V
1.0
(1
)
1.0
(1
)
N.D
.(1)
(3 )
VI
1.9
(2
)
0.1
1.0
(1
)
1.9
(2
)
2.0
(2)
1.9
(2
)
1.0
(1
)
2.0
(2
)
( 12)
CH-3
VII
3.0
(3)
0.9
(1
)
1.0
(1
)
1.0
(1
)
2.1
(2)
5.8
(6
)
5.0
(5
)
1.8
(3)
1.1
(1)
3.0
(3)
2.0
(2)
0.9
(1
)
N.D
.(1)
(30)
CH-6
VII
I
0.3
0.2
0.2
0.2
2.4
(2)
0.7
0.2
0.1
0.4
2.0
(2
)
1.0
(1
)
(5 )
IX
2.6
(3
)
0.8
(1
)
1.0
(1
)
0.3
1.9
(2
)
4.0
(4)
3.0
(3
)
1.3
(3
)
1.0
(1
)
2.0
(2
)
1.2
(1)
0.9
(1
)
(22)
CH-7
a V
alue
s ar
e ex
pres
sed
as
resi
dues
pe
r m
ol.
Num
bers
in
par
enth
eses
are
res
idue
val
ues
base
d on
seq
uenc
e.
b C
yste
ine
was
de
term
ined
as
S-c
arbo
xym
ethy
l-cy
stei
ne.
N.D
., N
ot d
eter
min
ed.
c In
dica
ted
the
nota
tion
of
the
frag
men
ts
desc
ribe
d in
Fig
. 9
and
Tab
le V
I.
Tab
le V
IS.
Am
ino
acid
com
posi
tions
of
chy
mot
rypt
ic p
epti
des
of R
CM
-sub
tilos
in A
. I-
IX w
ere
deri
ved
from
th
e fr
acti
ons
I-IX
, re
spec
tive
ly,
indi
cate
d by
bar
s in
Fig
. 6S
.
-88
-
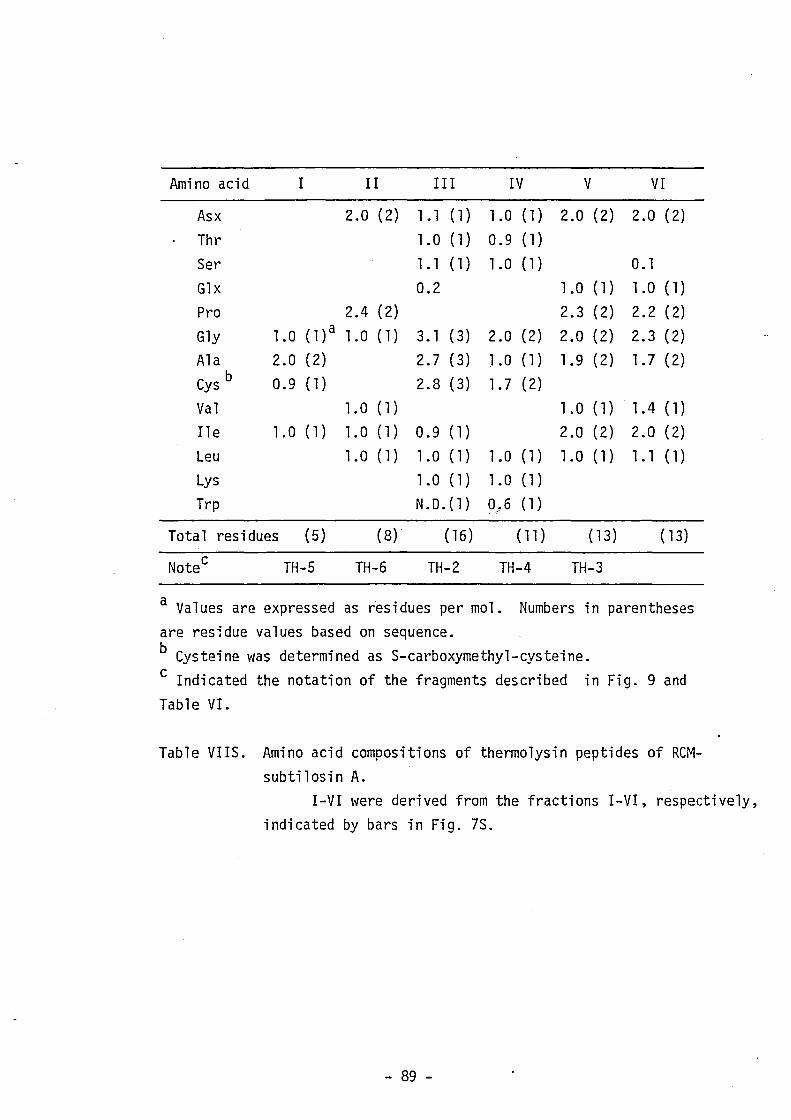
Amino acid I Il III IV V VI
Asx 2.0 (2) 1.1 (1) 1.0 (1) 2.0 (2) 2.0 ( 2) Thr 1.0 (1) 0.9 (1) Ser 1.1 (1) 1.0 (1) 0.1 Glx 0.2 1.0 (1) 1.0 (1)
Pro 2.4 (2) 2.3 (2) 2.2 (2) Gly 1.0 (1)a 1.0 (1) 3.1 (3) 2.0 (2) 2.0 (2) 2.3 (2) Ala 2.0 ( 2) 2.7 (3) ].0 (1) 1.9 (2) 1 .7 (2) Cys b 0.9 (1) 2.8 (3) 1.7 ( 2)
Val 1.0 (1) 1.0 (1) 1.4 (1)
Il e 1.0 (1) 1.0 (1) 0.9 (1) 2.0 (2) 2.0 ( 2) Leu 1.0 (1) 1.0 (1) 1.0 (1) 1.0 (1) 1.1 (1) Lys 1.0 (1) 1.0 (1)
Trp N.D.(1) 0.6 (1) . ;~
Total residues (5) ( 8) (16) (11 ) (13 ) ( 13)
NoteC TH-5 TH-6 TH-2 TH-4 TH-3
a Values are expressed as residues per mol. Numbers in parentheses are residue values based on sequence. b Cysteine was determined as S-carboxymethy1-cysteine. c Indicated the notation of the fragments described in Fig. 9 and Table VI.
Table VIIS. Amino acid compositions of thermolysin peptides of RC Msubtilosin A.
I-VI were derived from the fractions I-VI, respectively, indicated by bars in Fig. 7S.
- 89 -
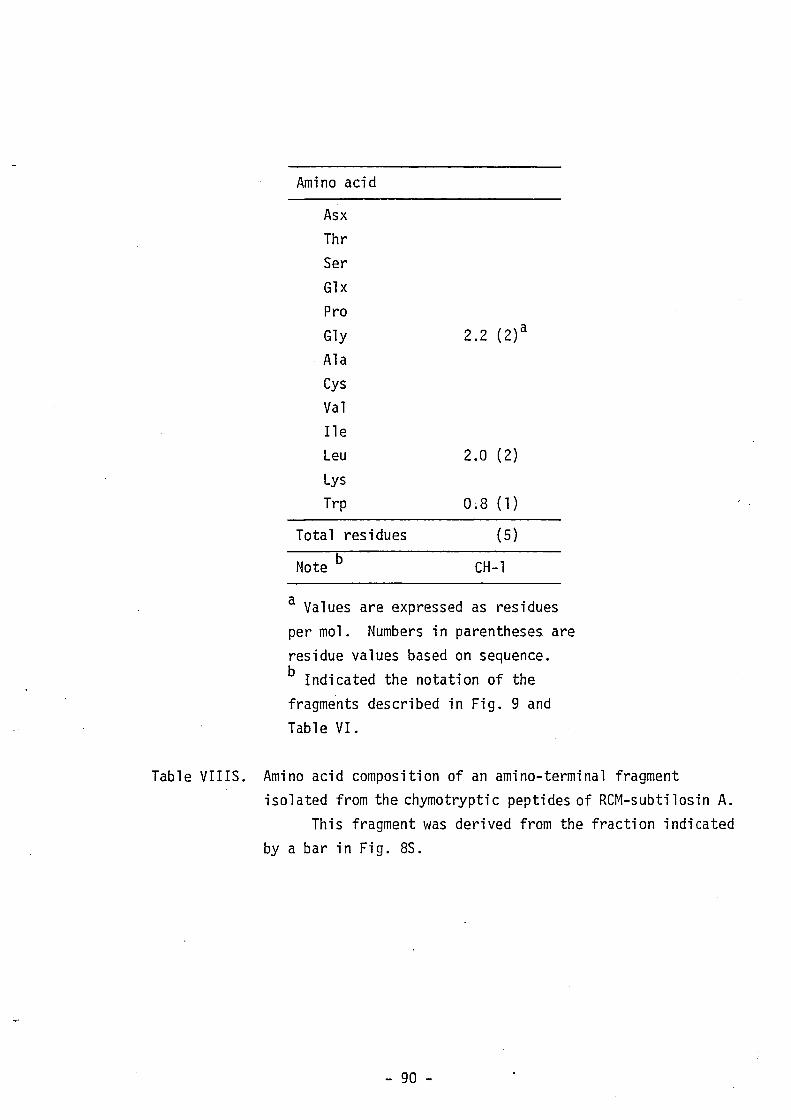
Amino acid
Asx Thr Ser Glx Pro Gly Ala Cys Val !le
Leu Lys Trp
Total residues
Note b
2.2 (2)a
2.0 (2)
0.8 (1)
(5)
CH-l
a Values are expressed as residues per mol. Numbers in parentheses are residue values based on sequence. b Indicated the notation of the fragments described in Fig. 9 and Table VI.
Table VIIIS. Amino acid composition of an amino-terminal fragment isolated from the chymotryptic peptides of RCM-subtilosin A.
This fragment was derived from the fraction indicated by a bar in Fig. 8S.
- 90 -
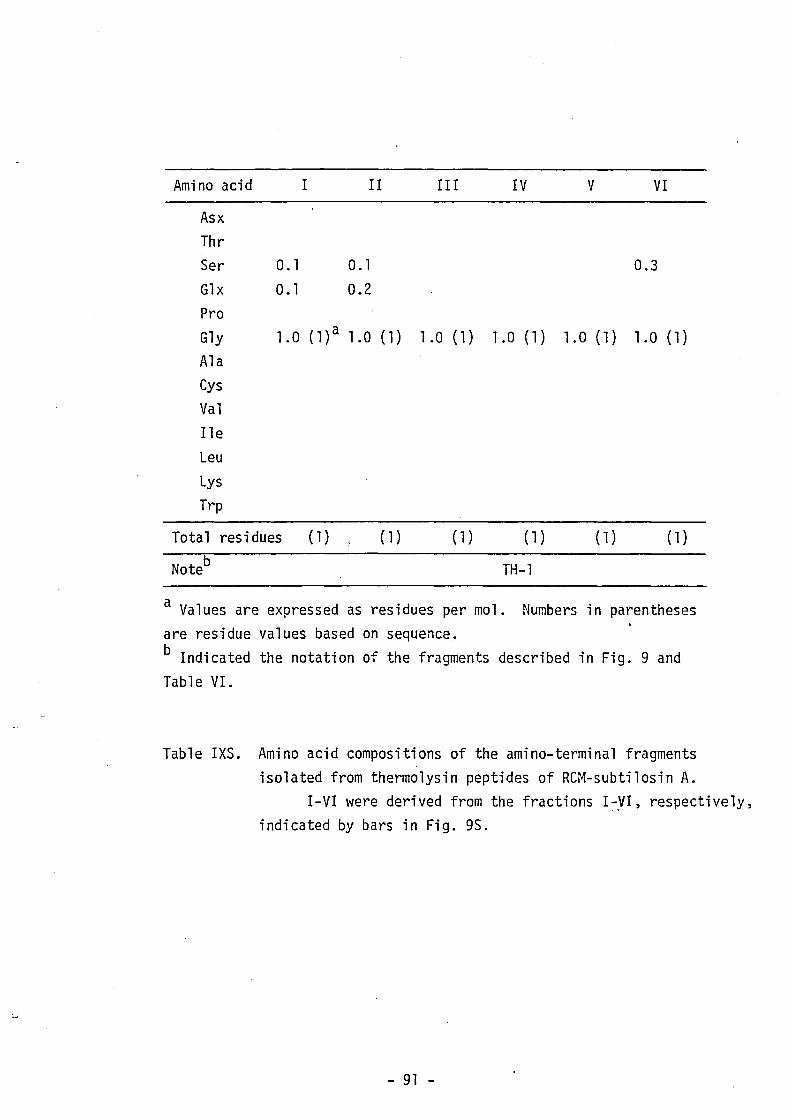
Amino acid
Asx Thr Ser Glx Pro
I
O. 1
0.1
Il III IV V VI
O. 1 0.3
0.2
Gly 1.0 (1)a 1.0 (1) 1.0 (1) 1.0 (1) 1.0 (1) 1.0 (1)
Ala Cys Val Ile
Leu Lys Trp
Total residues (1) (1) (1) ( 1 ) ( 1 ) (1)
TH-l
a Values are expressed as residues per mol. Numbers in parentheses are residue values based on sequence. b Indicated the notation of the fragments described in Fig. 9 and Table VI.
Table IXS. Amino acid compositions of the amino-terminal fragments isolated from thermolysin peptides of RCM-subtilosin A.
I-VI were derived from the fractions I-yI, respectively, indicated by bars in Fig. 9S.
- 91 -
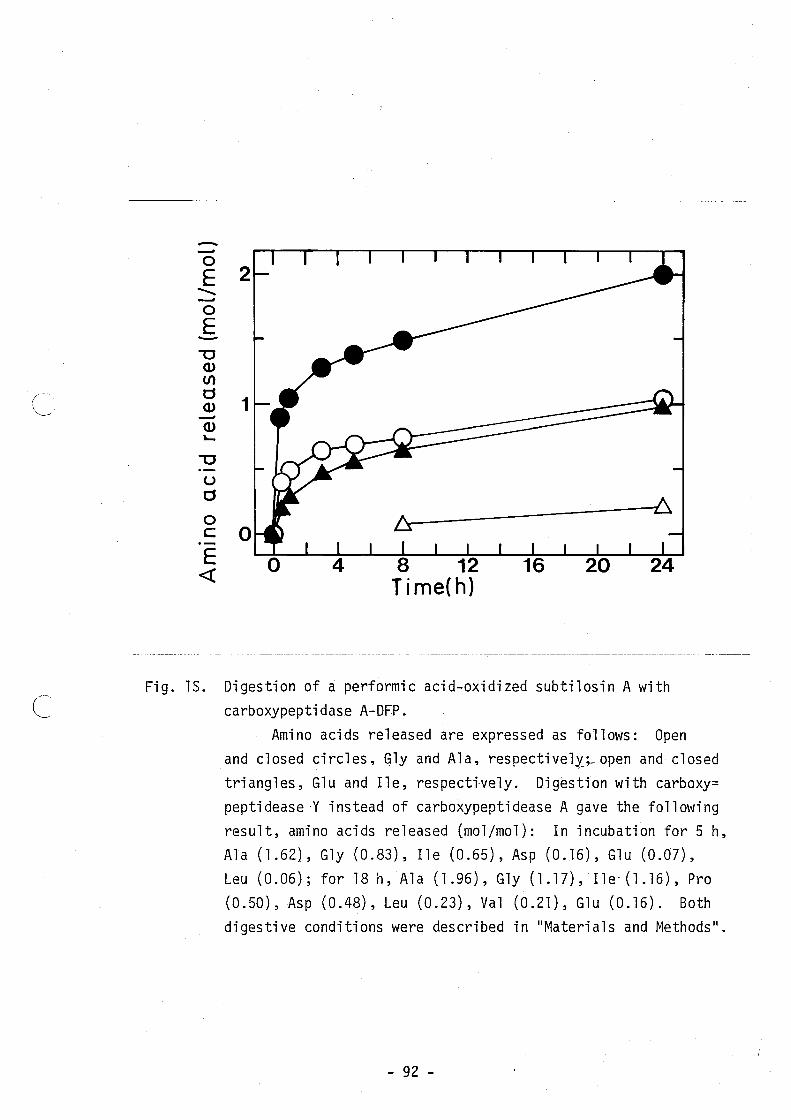
( \~
c
-0
E 2 -... 0
E -"'0 Cl)
til d
1 Cl)
Cl) '-
"'0
U d
0 c: 0 E «
Fig. 15. Digestion of a performic acid-oxidized subti10sin A with carboxypeptidase A-DFP.
Amino acids released are expressed as follows: Open and closed circles, G1y and Ala, respective1l;_open and closed triangles, G1u and !le, respecti·ve1y. Digestion with carboxy= peptidease·Y instead of carboxypeptidease A gave the following result, amino acids released (mol/mol): In incubation for 5 h, Ala (1.62), G1y (0.83), I1e (0.65), Asp (0.16), G1u (0.07), Leu (0.06); for 18 n, Ala (1.96), G1y (1.17), I1e· (1.16), Pro (0.50), Asp (0.48), Leu (0.23), Val (0.21), G1u (0.16). Both digestive conditions were described in "Materia1s and Methods".
- 92 -
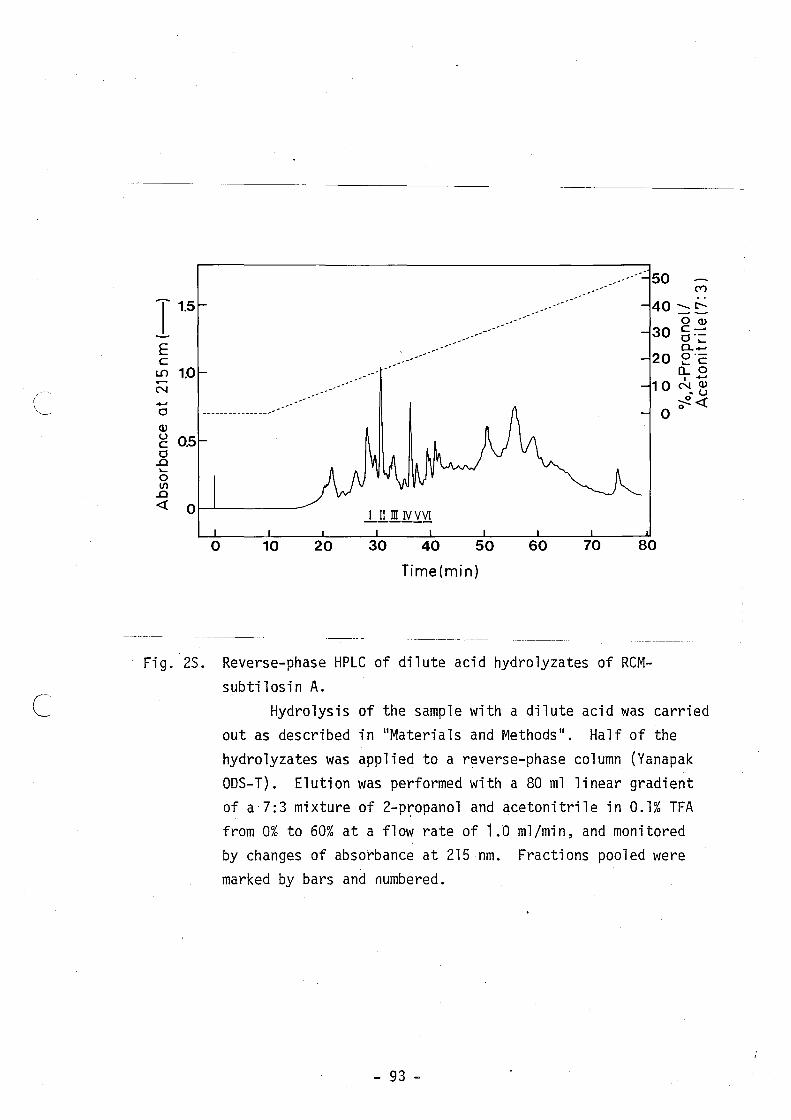
( '-----'
c
50 ('t')
T 1.5 .. '
40 :::: £:: 00)
30 c-.-- d'~
E --' 0. ....... ........... 20 0'-c ~c L.() 1.0 0....0
I .......
N 10 N 0) • u ....... ~« d -- ---- -- -- ----_ .. o 0
0) u 0.5 c d
..Cl ~
0 III
..Cl « 0 1..1L1!L N Y..Yl
0 10 20 40 50 60 70 80
Time(min)
Fig. 2S. Reverse-phase HPLC of dilute acid hydrolyzates of RCMsubtilosin A.
Hydrolysis of the sample with a dilute acid was carried out as described in "Materials and Methods ll
• Half of the hydrolyzates was applied to a reverse-phase column (Yanapak ODS-T). Elution was performed with a 80 ml linear gradient of a7:3 mixture of 2-p~opanol and acetonitrile in 0.1% TFA from 0% to 60% at a flow rate of 1.0 ml/min, and monitored by changes of absorbance at 215 nm. Fractions pooled were marked by bars and numbered.
- 93 -
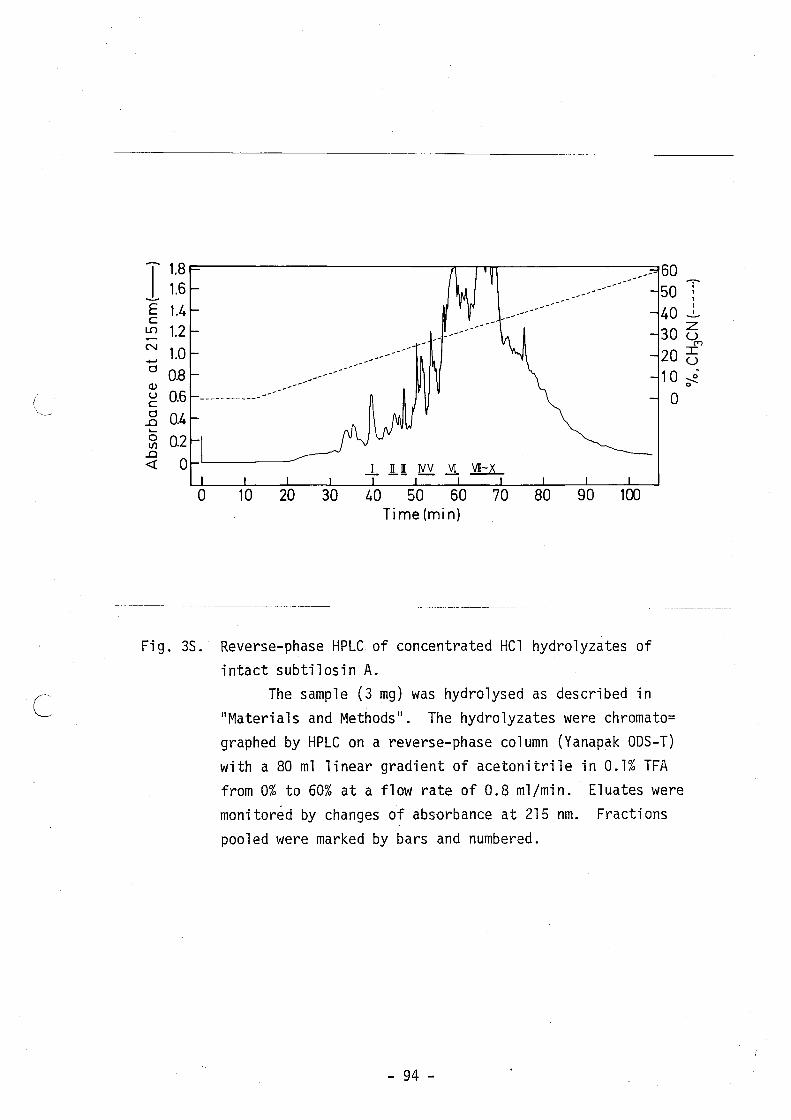
/ '~-
c
T 1.8 _---- 60 1.6 -=-
50 , I I
E 1.4 40 I
C -!...
LO 1.2 30 G N
C")
+oJ 1.0 20 G
0 OB 1 0 --.i Q) 0
u 0.6 ----------- 0 c 0 0.4 .£) .... 0 0.2 Vl
.£)
4: 0
Fi g. 3S.
30 40 50 60 70 80 90 100 Time(min)
Reverse-phase HPLC of concentrated HCl hydrolyzates of intact subtilosin A.
The sample (3 mg) was hydrolysed as described in IIMaterials and Methods ll
• The hydrolyzates were chromato= graphed by HPLC on a reverse-phase column (Yanapak OOS-T) with a 80 ml linear gradient of acetonitrile in 0.1% TFA from 0% to 60% at a flow rate of 0.8 ml/min. Eluates were monitored by changes of absorbance at 215 nm. Fractions pooled were marked by bars and numbered.
- 94 -
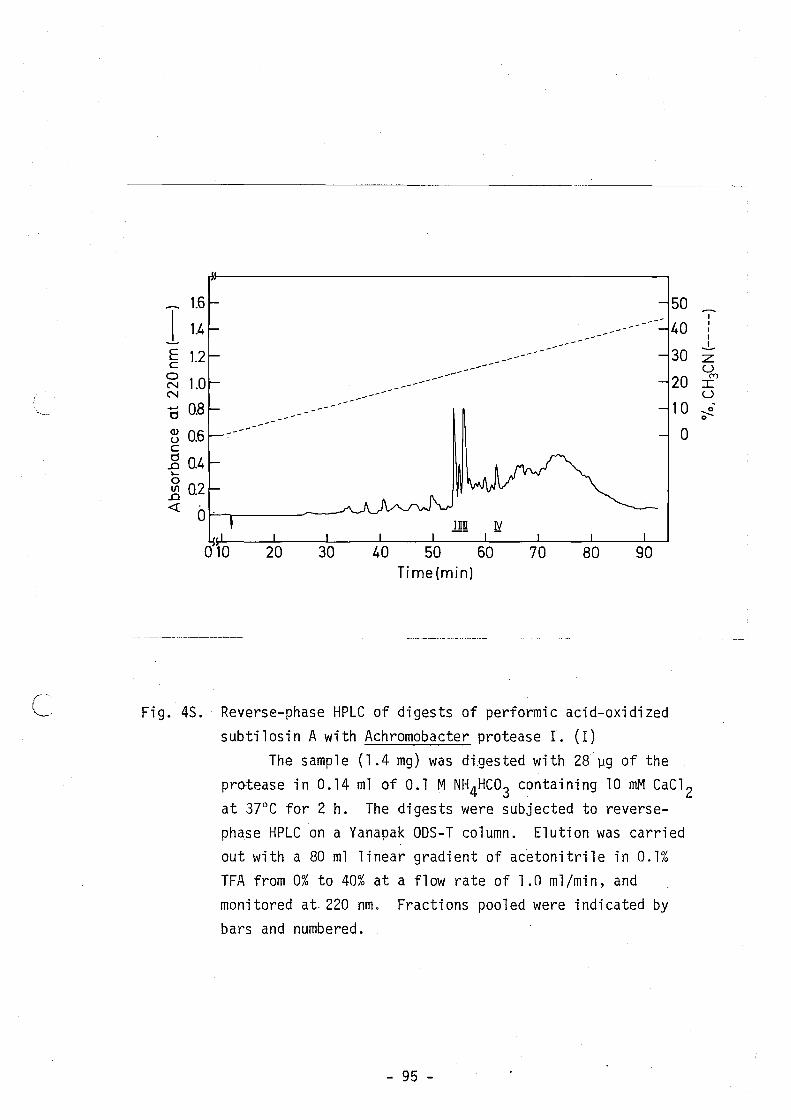
c
T :~ § 1.2 o N 1.0 N
d 0.8
~ 0.6 c .8 0.4 .... o .2 0.2
---
50 --- 40
30 ------- ------
20 ------10
0
« b~' ---"...----------
70 80 Time(min)
Fig. 45. Reverse-phase HPLC of digests of performic acid-oxidized subtilosin A with Achromobacter protease I. (I)
The sample (1.4 mg) was digested with 28 ~g of the I
pr~tease in 0.14 ml of 0.1 M NH4HC03 containing 10 mM CaC1 2 at 37°C for 2 h. The digests were subjected to reversephase HPLC on a Yanapak 005-T column. Elution was carried out with a 80 ml linear gradient of acetonitrile in 0.1% TFA from 0% to 40% at a flow rate of 1.0 ml/min, and monitored at, 220 nm. Fractions pooled were indicated by bars and numbered.
- 95 -
I I I I
..!.-Z u
(Y)
:r: u ~ 0
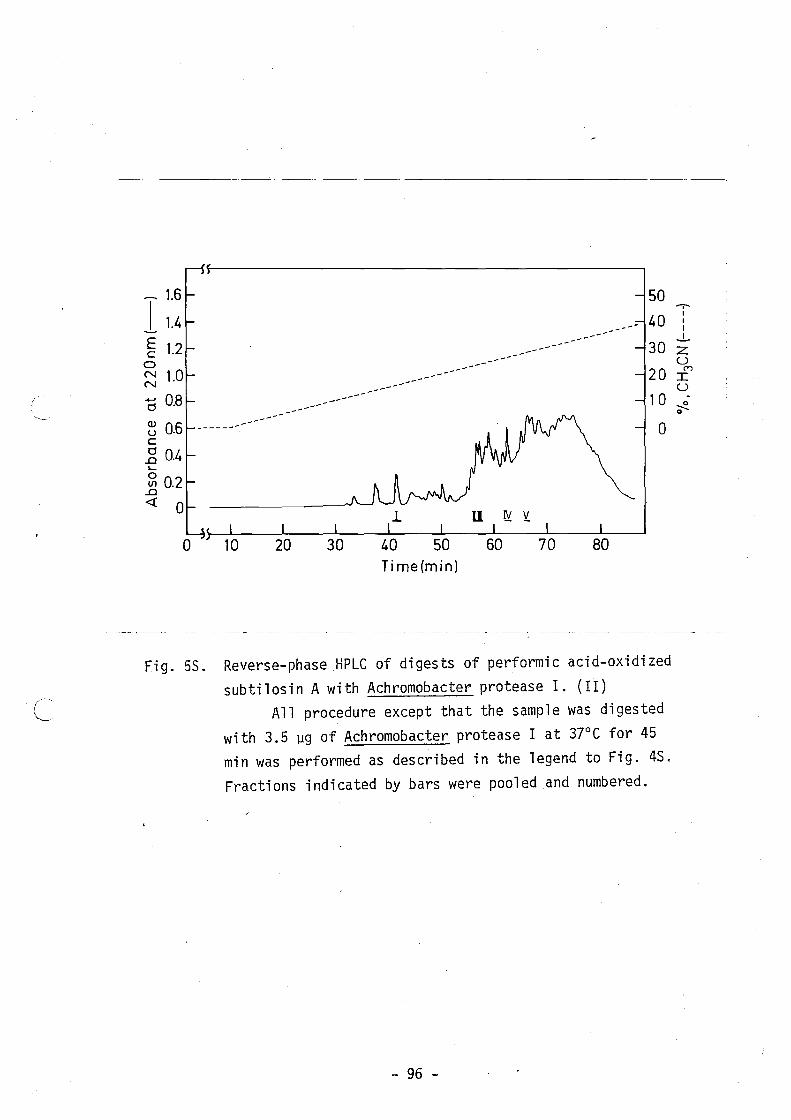
'~
1.6 50
1 1.4 40 ------E 1.2 --- 30 c ---
0 ----1.0
---N ---- 20 N ------ ---
0.8 ------...... 10 0 ------(]) 0.6 ---u ------- 0 c 0 0.4 ..0 .... 0 Ul 0.2
..0 <! 0 .L U IY If..
0 50 60 70 80 Time(min)
Fig. 55. Reverse-phase HPLC of digests of performic acid-oxidized subtilosin A with Achromobacter protease I. (II)
All procedure except that the sample was digested with 3.5 ~g of Achromobacter protease I at 37°C for 45 min was performed as described in the legend to Fig. 45. Fractions indicated by bars were pooled and numbered.
- 96 -
.-,-. I I I
..!... Z u
(Y")
I u -~ 0
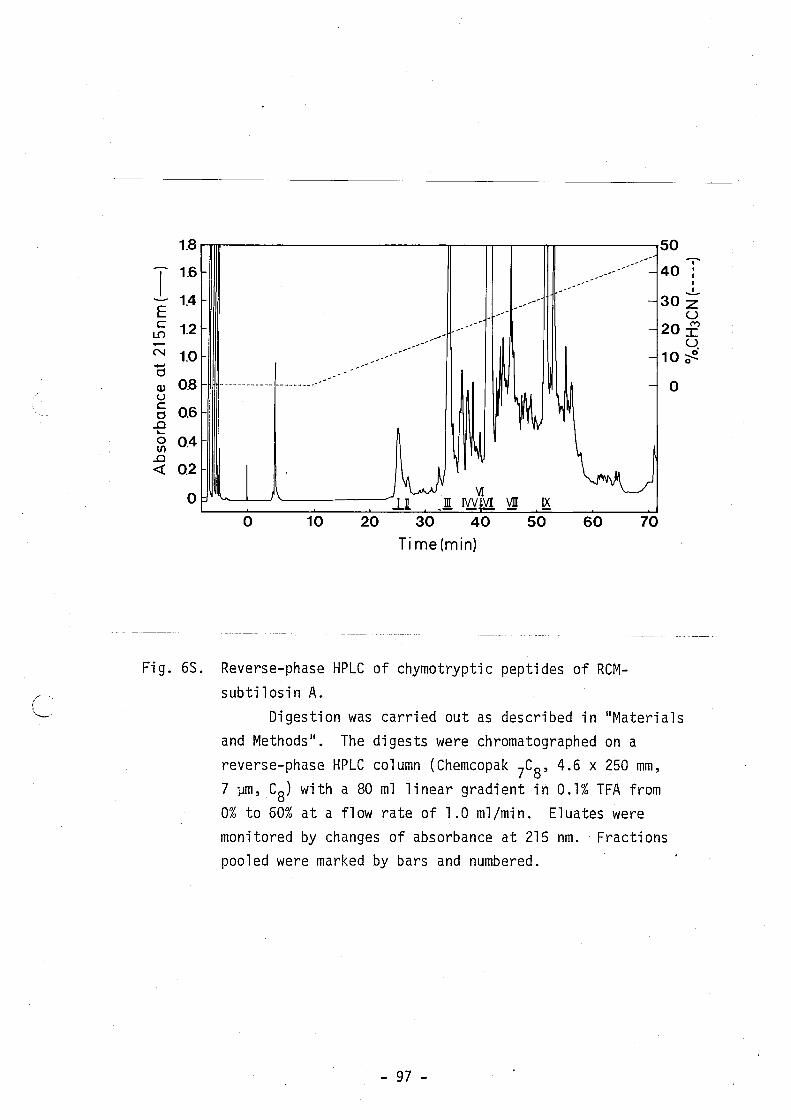
( ,--.
1.8
1.6 I 1.4 E c 1.2 Lf)
N 1.0 +J
d Q) 0.8 u c 0.6 d I .c .... 0 0.4 III
..0 « 0.2
0
Fi g. 65.
50 "
, .,. --, , , 40 I , ........ - - I , ,
I , , ,
" ,
...!-
" ", - 30Z ,
,,' U , , , " 20 :2 , -
,--' " U. _ ........
" - 10 ~ , , " " , , , ,
, , , ------------ ---------
~~ -
~ ~ W I YI VI
NY~ ~ ~ 0 10 20 30 40 50 60
Time(min)
Reverse-phase HPLC of chymotryptic peptides of RCMsubtilosin A.
70
0
Digestion was carried out as described in "Materials and Methods". The digests were chromatographed on a reverse-phase HPLC column (Chemcopak 7CS' 4.6 x 250 mm, 7 ~m, CS) with a SO ml linear gradient in 0.1% TFA from 0% to 60% at a flow rate of 1.0 ml/min. Eluates were monitored by changes of absorbance at 215 nm .. Fractions pooled were marked by bars and numbered.
- 97 -
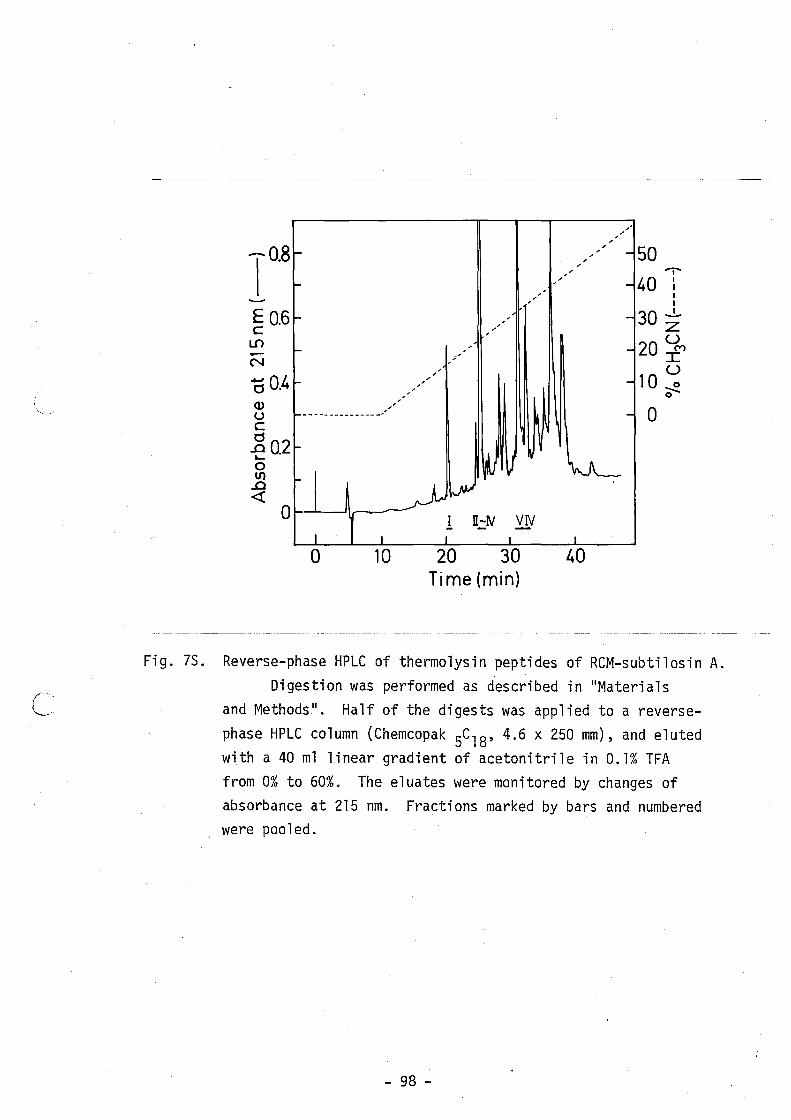
TO.8
E 0.6 c
L.{) -N
-00.4 <U u c .8 02 ,-. o til
..0 «
, , ,
__ - _______ _____ ;1
o ~-'-------' ----,--..-
o 10
, , , , ,
, ,
Ti me (min)
, ,
, ..-
., 50 -.-
40 : , , 30 -!...
Z 20 UC")
I U
10 ~ o
o
Fig. 7S. Reverse-phase HPLC of thermo1ysin peptides of RCM-subti1osin A. Digestion was performed as described in "Materia1s
and Methods". Half of the digests was applied to a reversephase HPLC column (Chemcopak 5C18' 4.6 x 250 mm), and eluted with a 40 m1 linear gradient of acetonitrile in 0.1% TFA from 0% to 60%. The eluates were monitored by changes of absorbance at 215 nm. Fractions marked by bars and numbered were pooled.
- 98 -
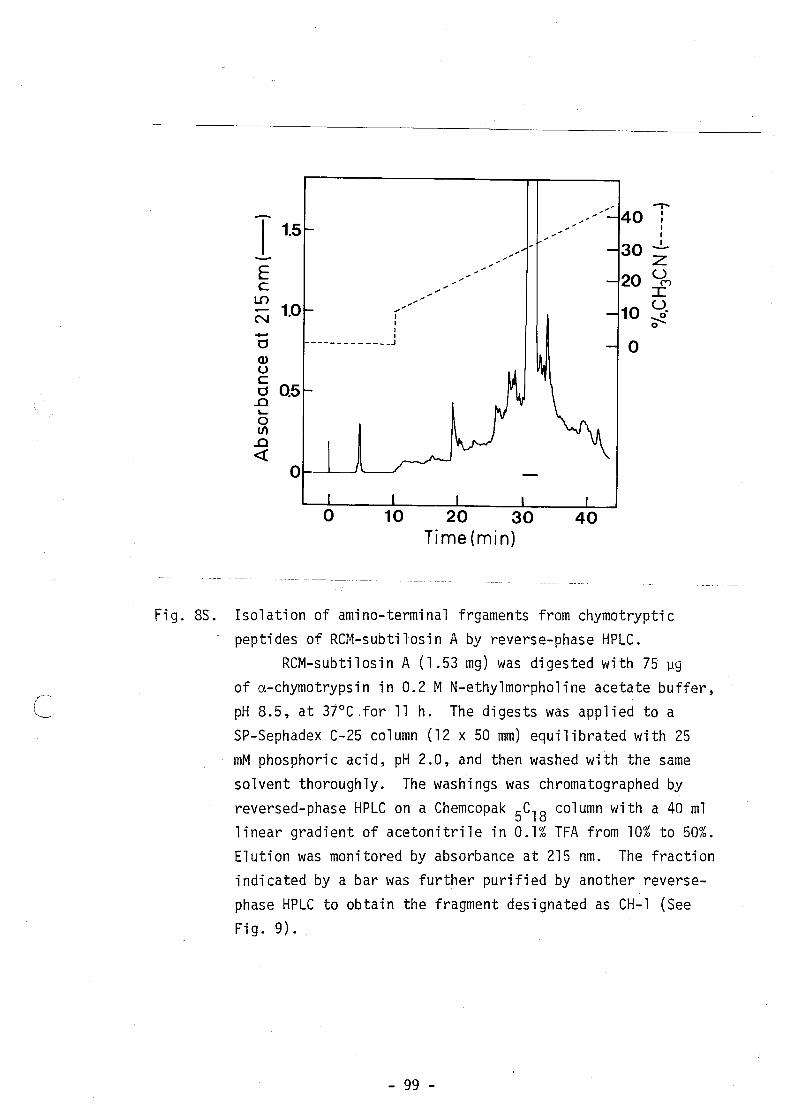
E c
L.{)
N 1.0
-d Q) u c o ..c ~
o III
..c «
,..",,' .... I I I I
----- -- - _____ J
20 30 40 Time (min)
" ......,..... - 40 :
30
20
I I
-!.. z u
C"')
I
10 ~. o
o
Fig. 8S. Isolation of amino-terminal frgaments from chymotryptic peptides of RCM-subtilosin A by reverse-phase HPLC.
RCM-subtilosin A (1.53 mg) was digested with 75 ~g of a-chymotrypsin in 0.2 M N-ethylmorpholine acetate buffer, pH 8.5, at 37°C .for 11 h. The digests was applied to a SP-Sephadex C-25 column (12 x 50 mm) equilibrated with 25 mM phosphoric acid, pH 2.0, and then washed with the same solvent thoroughly. The washings was chromatographed by
reversed-phase HPLC on a Chemcopak 5C18 column with a 40 m1 linear gradient of acetonitrile in 0.1% TFA from 10% to 50%. Elution was monitored by absorbance at 215 nm. The fraction indicated by a bar was further purified by another reversephase HPLC to obtain the fragment designated as CH-l (See Fig. 9).
- 99 -
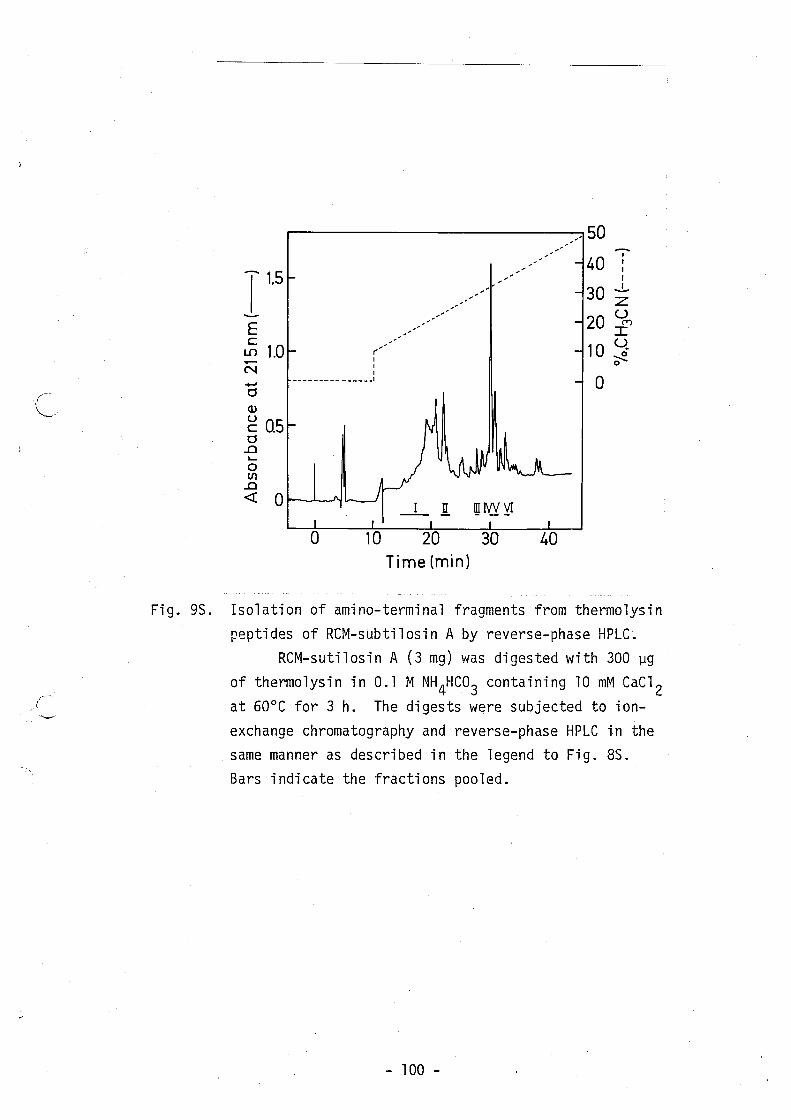
Fig. 9S.
E c
L.{) 1.0 .-N
(//
I I I
"", ....
,
,//,/-"
__ - - - ____ - _____ I +J
o Cll u c 0.5 o
..0 .... o til
..0 <! O~-'--.J'"
Time (min)
/ /
,/50 --40 :
I
30 -!... Z
20 ~ I
10 ~ o
Isolation of amino-terminal fragments from thermolysin peptides of RCM-subtilosin A by reverse-phase HPLC.
RCM-sutilosin A (3 mg) was digested with 300 ~g of thermolysin in 0.1 M NH 4HC03 containing 10 mM CaC1 2 at 60°C for 3 h. The digests were subjected to ionexchange chromatography and reverse-phase HPLC in the same manner as described in the legend to Fig. 8S. Bars indicate the fractions pooled.
- 100 -
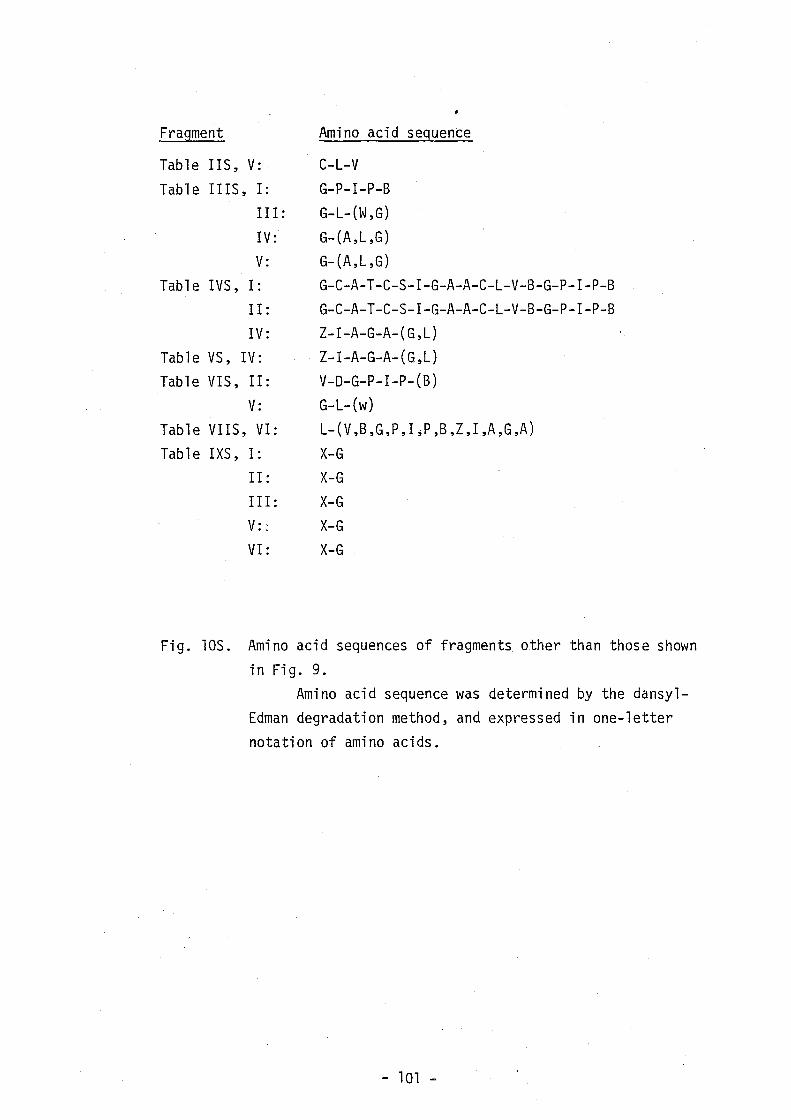
Fragment
Tab 1 e lIS, V: Table IllS, I:
II I:
IV: V:
Table IVS, I: II:
IV: Table VS, IV: Tab 1 e V IS, I I :
V: Tab 1 e VIIS, VI: Tab 1 e IXS, I:
II:
III:
V: :
VI:
Amino acid sequence
C-L-V G-P-I-P-B G-L-(W,G) G-(A,L,G) G-(A,L,G) G-C-A-T-C-S-I-G-A-A-C-L-V-B-G-P-I-P-B G-C-A-T-C-S-I-G-A-A-C-L-V-B-G-P-I-P-B Z-I-A-G-A-(G,L) Z-I-A-G-A-(G,L) V-D-G-P-I-P-(B) G-L-(w) L-(V,B,G,P,I;P,B,Z,I,A,G,A)
X-G X-G X-G X-G X-G
Fig. lOS. Amino acid sequences of fragments other than those shown in Fi g. 9.
Amino acid sequence was determined by the dansylEdman degradation method, and expressed in one-letter notation of amino acids.
- 101 -