Embed Size (px)
Citation preview

A New Narrative for Child Welfare
February 16, 2011
Bryan Samuels, CommissionerAdministration on Children, Youth &
Families

Child Welfare Population, 1998-2009
Data Source: Adoption and Foster Care Reporting and Analysis System, Reports 10-17 (1998-2009). Children’s Bureau, Administration on Children, Youth, and Families (USDHHS, ACF)
300,000
350,000
400,000
450,000
500,000
550,000
600,000
1998 1999 2000 2001 2002 2003 2004 2005 2006 2007 2008 2009
25%
More children are moving out of child welfare; fewer children are being brought into the system
150,000
180,000
210,000
240,000
270,000
300,000
330,000
360,000
2002 2003 2004 2005 2006 2007 2008 2009
Entries
Exits
Data Source: Adoption and Foster Care Reporting and Analysis System, Reports 10-17 (1998-2009). Children’s Bureau, Administration on Children, Youth, and Families (USDHHS, ACF)

Children Adopted from Child Welfare, 1998-2009
Data Source: Adoption and Foster Care Reporting and Analysis System, Reports 10-17 (1998-2009). Children’s Bureau, Administration on Children, Youth, and Families (USDHHS, ACF)
30,000
35,000
40,000
45,000
50,000
55,000
60,000
1998 1999 2000 2001 2002 2003 2004 2005 2006 2007 2008 2009
Nu
mb
er
of
Ch
ildre
n
Data Source: Adoption and Foster Care Reporting and Analysis System, Reports 10-17 (1998-2009). Children’s Bureau, Administration on Children, Youth, and Families (USDHHS, ACF)
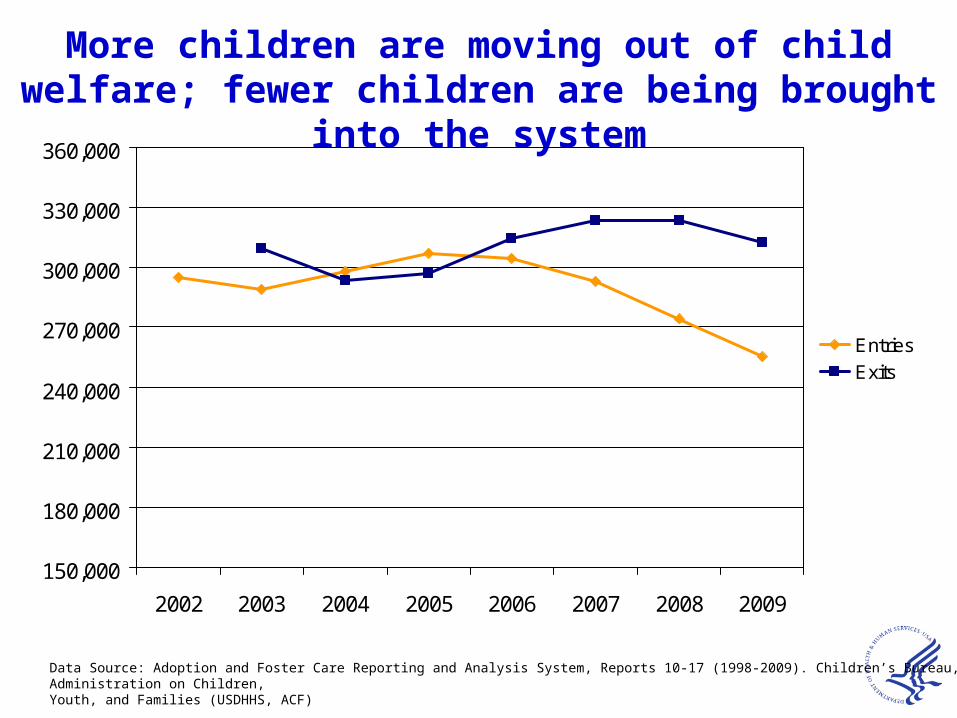
Changes in the racial makeup of the child welfare population over time
0
50,000
100,000
150,000
200,000
250,000
300,000
1998 1999 2000 2001 2002 2003 2004 2005 2006 2007 2008 2009
Black Non-Hispanic
White Non-Hispanic
Hispanic
Other

Mai
neH
awai
iO
hio
Mar
ylan
dFl
orid
aG
eorg
iaD
ist.
of C
ol.
Puer
to R
ico
Cal
ifor
nia
Min
neso
taN
ew J
erse
yN
ew Y
ork
Ver
mon
tIl
linoi
sT
enne
ssee
New
Ham
pshi
reM
isso
uri
Mas
sach
uset
tsW
isco
nsin
Penn
sylv
ania
Con
nect
icut
Vir
gini
aM
ichi
cgan
Mon
tana
Col
orad
oR
hode
Isl
and
Del
awar
eK
ansa
sN
ebra
ska
Ore
gon
Okl
ahom
aL
ouis
iana
Nor
th C
arol
ina
Ken
tuck
yN
orth
Dak
ota
Sout
h C
arol
ina
Was
hing
ton
Ala
ska
Sout
h D
akot
aN
ew M
exic
oId
aho
Ala
bam
aA
rkan
sas
Mis
siss
ippi
Tex
asIo
wa
Wyo
min
gW
est V
irgi
nia
Uta
hIn
dian
a Nev
ada
Ari
zona
-60%
-40%
-20%
0%
20%
40%
60%
80%
Decrease 16% to 47% Change less than 15% Increase 16% to 65%Data Source: Adoption and Foster Care Reporting and Analysis System, Reports 10-17 (1998-2009). Children’s Bureau, Administration on Children, Youth,
and Families (USDHHS, ACF)
Reductions in child welfare caseloads are not evenly distributed across states

Entries into Child Welfare by Age, 1998 & 2009
0
5,000
10,000
15,000
20,000
25,000
30,000
35,000
40,000
<1 1 2 3 4 5 6 7 8 9 10 11 12 13 14 15 16 17
Age
Nu
mb
er o
f C
hil
dre
n
2009
1998
Data Source: Adoption and Foster Care Reporting and Analysis System, Reports 10-17 (1998-2009). Children’s Bureau, Administration on Children, Youth, and Families (USDHHS, ACF)

0
50,000
100,000
150,000
200,000
250,000
300,000
2002 2009
Nu
mb
er o
f C
hild
ren
Other
Emancipation (AgingOut)
Adoption
Reunification, Livingwith Other Relatives,Guardianship
Reasons for discharge among all children exiting child welfare, 2002 & 2009
5%3%
11%
20%
66%
7%
18%
70%
Includes children transferred to another agency, children who have run away, and deaths
Includes children who exit the child welfare system to independence without a permanent connection to an adult
Includes children whose parents’ parental rights have been terminated and are legally adopted
Includes children who return home to their families after removal, live with relatives other than their families of origin after removal, or live with a legal guardian
Data Source: Adoption and Foster Care Reporting and Analysis System, Reports 10-17 (2002-2009). Children’s Bureau, Administration on Children, Youth, and Families (USDHHS, ACF)

0
20,000
40,000
60,000
80,000
100,000
120,000
140,000
160,000
2002 2009
Nu
mb
er o
f C
hild
ren
Other
Emancipation (Aging Out)
Adoption
Reunification, Living withother Relatives, orGuardianship
8%
14%
9%
69%
5%
23%
9%
63%
Reasons for discharge among youth over age 10 exiting child welfare, 2002 & 2009
Includes children transferred to another agency, children who have run away, and deaths
Includes children who exit the child welfare system to independence without a permanent connection to an adult
Includes children whose parents’ parental rights have been terminated and are legally adopted
Includes children who return home to their families after removal, live with relatives other than their families of origin after removal, or live with a legal guardian
Data Source: Adoption and Foster Care Reporting and Analysis System, Reports 10-17 (2002-2009). Children’s Bureau, Administration on Children, Youth, and Families (USDHHS, ACF)

61.9%screened in(3.6 million)
23.9%substantiated
(763,000)
76.2%not
substantiated(2.9 million)
59.9%open for services
(457,000)
40.1% not open for services
(306,000)
34.8% placedout-of-home
(159,000)
65.2%in-home
(298,000)
38.1%screened out(2.4 million)
Cases of children reported to CPS
(6 million)
Source: Child Maltreatment 2009, US Department of Health and Human Services, National Child Abuse and Neglect Data System, 2010
FY 2009
25.8%open for services
(741,000)
74.2% notopen for services
(2.1 million)
13.9% placedout-of-home
(103,000)
86.1%in-home
(638,000)

How can we maintain the gains that have
been made and continue to progress?
How can we target the next 25%?

Make Better Use of Data and Research
• Use data to know sub-populations and target interventions
• Draw on the best science available in selecting and implementing interventions
• Incorporate evaluation and research into service delivery

0% 2% 4% 6% 8% 10% 12% 14% 16%
Mental health of caregiver
Substance abuse
Rejection of parent by child
Rejection of child by parent
Verbal or physical fights
Oth harm (e.g. burns, fractures) through lack of superv.
Child 7-12 yrs old left unsupervised
Child 6 yrs old or younger left unsupervised
Other
Sexual maltreatment
Child witnessed domestic/other violence
Emotional maltreatment
Excessive discipline
Violence to child by caregiver (non-disciplinary)
Other neglect
Educational neglect or truancy
Caregiver neglected medical/health care of child
Abandonment or locking in or out
Homelessness or potential homelessness
Home unsafe or unclean
Child lacked basic needs (food, clothes, hygiene)
Experimental
Control
Physical, Sexual, or Emotional Abuse
Neglect or Abandonment
Poor or damaging adult-child relationship
Lack of Supervision or Proper Care
Other Threats
American Humane Institute of Applied Research Minnesota Consultants (2009). Ohio Alternative Response Pilot Project Evaluation Final Report, Fig 11.2 (adapted).http://www.americanhumane.org/assets/docs/protecting-children/PC-DR-Ohio-Section2-Final-Evaluation-Report.pdf
TYPES OF CHILD SAFETY PROBLEMS IN OHIO’S EXPERIMENTAL AND CONTROL FAMILIES BEFORE OR AT THE TIME OF FIRST CONTACT WITH FAMILIES
Strategy: Differential Response
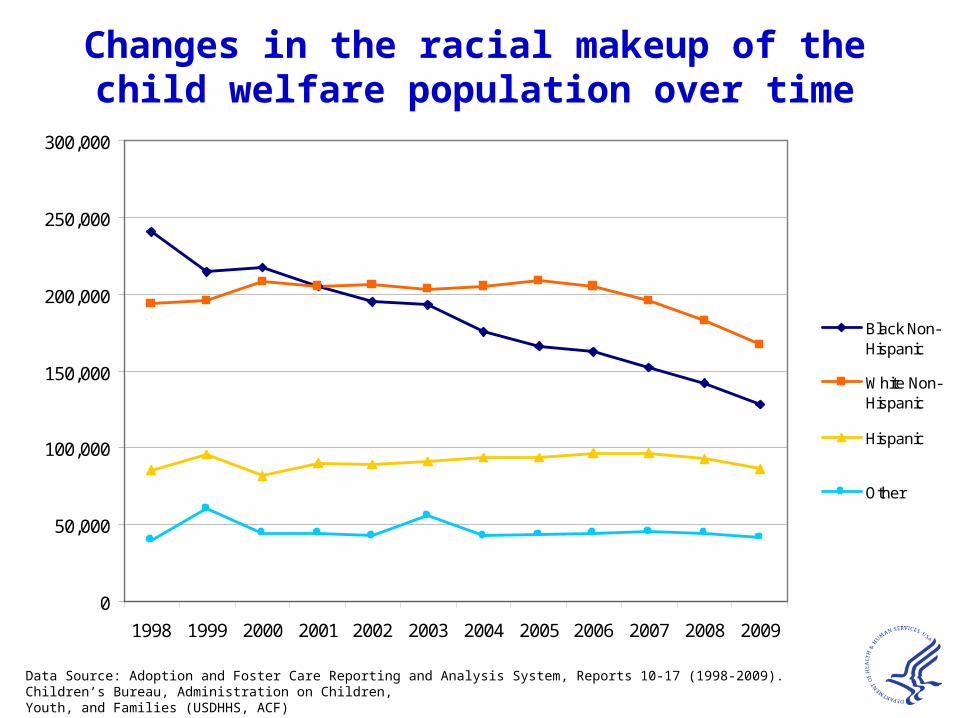
Target Social and Emotional Needs of Children
• Enhance clinical competencies of caseworkers
• Use interventions that improve social and emotional health for children in child welfare, e.g.:– Multidimensional Treatment Foster Care– Cognitive Behavioral Therapy
• Support foster parents in understanding and responding to social and emotional needs of children in their care
Permanency Innovations Initiative

ACYF Initiative to Reduce Long-Term Foster Care
• $100 Million over 5 years– $77 Million to grantees– $23 Million for TA and Evaluation
• To develop innovative intervention strategies for children staying in foster care long-term
• Targeting specific populations, focusing on permanence (exits) AND prevention (entries)
• 6 grantees

Grantees• Illinois Department of Children and Family Services
– Population: Youth 9-12 – Approach: Strengths-based, trauma-focused assessment and evidence-based intervention to expedite permanence for those
in care more than 2 years AND prevent long stays for new entries
• University of Kansas Center for Research, Inc– Population: Youth with severe emotional disorders– Approach: Evidence-based, intensive family reunification services immediately following removal from the home, and
piloting of a new tool for risk assessment
• California Department of Social Services– Population: African American and Native American Youth– Approach: Locally-relevant implementation of EBPs as part of permanency practice model, nested in model for systemic
change to achieve outcomes in permanence, well-being, and reduced disparity
• Los Angeles Gay and Lesbian Community Services Center– Population: LGBTQ youth– Approach: Addressing barriers to permanence and well-being for LGBTQ children and youth in or at-risk of placement in
foster care, juvenile justice involvement, or homelessness by working with youth, parents, and families
• Arizona Department of Economic Security– Population: Youth in out-of-home care for 3+ years, with a special focus on African American and Native American youth– Approach: Delivery of at least one of 3 EBPs as part of systems of care to prepare youth for permanency and recruit,
engage, and prepare prospective parents
• Washoe County Department of Social Services (Nevada)– Population: New families with in-home and out-of-home safety plans at the point of entry– Approach: Implementation of the Safety Intervention Permanency System (SIPS) using comprehensive
assessment and intervention and community-based services

Custom Report Builder allows you to find and compare State child welfare data
http://data.cwo.icfi.com/data/
New Child Welfare Data Tool