Embed Size (px)
Citation preview
A New Methodology for Face Recognitionunder Varying Illumination Conditions
Ing. Heydi Mendez-Vazquez, Dr. C. Edel Garcıa-Reyes
Centro de Investigaciones de Tecnologıas de Avanzada. 7a # 21812 e/ 218 y 222,Rpto. Siboney, Playa, C.P. 12200, Ciudad de la Habana, Cuba.
RT 026 CENATAVFecha del camera ready: 30 de octubre de 2009
Abstract. Variations in illumination are one of major limiting factors for face recognitionsystem performance. Here, a new photometric face normalisation method based on the localDiscrete Cosine Transform is presented. The proposed method is compared with the beststate of the art preprocessing technique producing equally good results. Although the ob-tained error rates in the tested database are very similar, we show that both methods classifythe images different and their fusion improve the results. Based on this, a method whichcombines both preprocessing techniques is presented and it outperforms the results obtainedwith the methods working individually in face recognition under varying lighting conditions.Although the performance is degraded on good quality images, on which the best results areobtained when no preprocessing technique is applied. Then, a method to determine if a faceimage is affected or not by illumination is also presented in this work and it is used in ageneral framework for face recognition, in which the combination of preprocessing methods isonly applied when the image is classified as bad illuminated while is directly classified if not,obtaining in this way very good results for both cases, permitting to apply this frameworkwhen the illumination conditions are variable and unknown.
Keywords: Face Recognition, Illumination Variations, Photometric Normalisation, LocalDCT.
Resumen: Las variaciones de iluminacion es uno de los principales problemas presentes enel reconocimiento automatico de rostros. En este trabajo se presenta un nuevo metodo denormalizacion fotometrica para imagenes de rostros basado en el uso local de la transformadadiscreta del coseno. El metodo propuesto es comparado con en el mejor metodo de preproce-samiento reportado en la literatura, obteniendose resultados igualmente buenos. A pesar deque los porcientos de error son muy similares en la base de datos utilizada para pruebas,se muestra que ambos metodos clasifican las imagenes de manera diferente y la fusion deellos mejora los resultados. Basado en esto, se presenta un nuevo metodo combinando am-bas tecnicas de preprocesamiento que mejora los resultados individuales en el reconocimientode rostros en presencia de variaciones de iluminacion. No obstante los resultados empeorancuando las imagenes no presentan problemas de iluminacion, en cuyo caso los mejores resul-tados son obtenidos cuando no se aplica ninguna tecnica de preprocesamiento. Se presentaentonces en este trabajo un metodo para determinar si una imagen de rostro esta afectada ono por la iluminacion, el cual es incorporado a un esquema general para el reconocimiento derostros en el cual, la combinacion de los metodos de preprocesamiento solo es aplicada cuandose determina que una imagen esta afectada por la iluminacion, mientras que esta es direc-tamente clasificada cuando no presenta afectacion, obteniendose de esta forma los mejoresresultados para ambos casos y permitiendo aplicar este esquema cuando las condiciones deiluminacion son variables y desconocidas.
Palabras clave: reconocimiento de rostros, variaciones de iluminacion, normalizacion fo-tometrica, DCT local.
2 Ing. Heydi Mendez-Vazquez, Dr. C. Edel Garcıa-Reyes
1 Introduction
Face recognition is one of the most used biometric techniques. Although a great number ofalgorithms have been developed, face recognition is still an open and very challenging prob-lem, especially in real outdoor applications where the imaging conditions are too variable.In different face recognition studies it has been shown that variations in lighting is one ofmajor limiting factors for face recognition system performance [1]. To cope the problemof face recognition under illumination variation, several algorithms have been proposed.They can be divided in three main categories: pre-processing, invariant feature extractionand face modeling.
Pre-processing methods normalise the input face image trying to obtain a stable rep-resentation of the face under different lighting conditions. The second approaches attemptto extract facial features invariant to illumination variations. The third ones, also calledgenerative models, try to model the face image under all possible illumination conditions.The pre-processing and face modeling methods are the most popular ones. Nevertheless,the generative models usually require a large number of training images while the first onesare very easy to apply in real scenarios and do not need any comprehensive training data.There are a lot of pre-processing methods proposed in the literature. They include wellknown approaches like Histogram Equalization, Gamma Intensity Correction, Homomor-phic Filtering [2], Multi-scale Retinex [3] and Anisotropic Smoothing proposed by Grossand Brajovic [4]. Most of these kind of methods can be used either in a holistic or localway, however in [5] it is shown that local normalisation methods are more invariant toillumination variations than global ones.
In this work we present a new photometric normalisation method based on the localDiscrete Cosine Transform (DCT) in the logarithm domain. The photometric normalisedface images are obtained subtracting a compensation term to the original image. Thecompensation term is estimated smoothing the image constructed using the low-frequencycoefficients extracted from the local DCT of the original image in the logarithm domain.The proposed method was tested on the XM2VTS face database and compared with someof the state of the art photometric normalisation methods. Our method (LDCT) and theProcessing Sequence(PS) proposed by Tan and Triggs in [6] showing the best performanceup to now achieved very similar error rates. Both methods were analysed in depth anddifferences in their performance were found, so we proposed to use them together to improvethe results for face recognition under varying lighting conditions. The combination methodimproves the results obtained by the individual ones in face images with illuminationproblems, but the results for images with no illumination affectation were degraded whenthe preprocessing method is applied. A quality measure for determine when the face imagesare affected or not by illumination is also presented in this work, which permits to establisha general framework for face recognition with a better overall performance. This frameworkwas presented and evaluated obtaining the best results in both cases: when the images areaffected by illumination variations as well as when they not.
This paper is organized as follows. Section 2 explains the experimental setup thatwas used during this work. Section 3 presents the new photometric normalisation methodproposed and describes the experiments conducted in order to select the best parameters
A New Methodology for Face Recognition under Varying Illumination Conditions 3
for it. Section 4 compares the proposed method with the best state of the art photometricnormalisation method and describes how to combine them to obtain a better performancein front of illumination variations. Section 5 presents the method to determine the qualityof a face image regards to illumination and describes the experiments conducted in orderto select the best parameters for it. Section 6 presents the proposed general framework andreports on the experimental results. Finally, Section 7 concludes the paper.
2 Experimental Setup
The XM2VTS [7] frontal face databases was used to evaluate the performance of thedifferent methods proposed and evaluated in this work. The XM2VTS database contains2360 images of 295 subjects, captured in 4 different sessions. To conduct the experimentsthe Lausanne protocol is used. This protocol splits the database into Training set composedof images of 200 subjects as clients, Evaluation set(Eval) with images of the same subjectsas clients and of 25 additional subjects as imposters, and Test set with 70 subjects asimposters. Training, Evaluation and Test sets are composed by images under controlledillumination conditions, there is an additional Dark Set which contains images of the samesubjects but with varying lighting conditions. There are two configurations of the LausanneProtocol. Here, we use Configuration I, in which the images for training and evaluation arefrom the first three sessions of acquisition, for training, 3 images per person are used, andthe number of accesses or comparisons in each of the rest subsets can be summarized as:
Eval Test DarkClients accesses 600 400 800
Imposters accesses 40000 112000 56000
Total accesses 40600 112400 56800
The Equal Error Rate (EER) is the point in which the False Rejection Rate (FRR)is equal to the False Acceptance Rate (FAR). The value obtained by the classificationmethod in this point for the Evaluation set is used as a threshold for the decision of acceptor reject the face images in the Test and Dark sets. On the other hand, the Total ErrorRate (TER) is the sum of the FRR and the FAR, the lower this value, the better therecognition performance.
In our experiments, all face images were closely cropped to include only the face regionand the extracted face images were geometric normalised by the centres of the two eyeswith the provided positions to be 120× 144 (width × height) pixels in size.
2.1 Face Description and Classification
The Local Binary Pattern (LBP) operator is used for representing and classifying thenormalised face images. The original LBP operator, introduced by Ojala et al. in [8], labelseach pixel of an image with a value called LBP code, which corresponds to a binary numberthat represents its relation with the 3x3-local neighbourhood. Different extensions of theoriginal operator have appeared and used for face recognition afterwards [9].
4 Ing. Heydi Mendez-Vazquez, Dr. C. Edel Garcıa-Reyes
The first and more extended use of the LBP operator for face recognition was presentedin [10]. In this case, a neighbourhood of 8 pixels in a radius of 2 (8, 2) is used to computethe LBP codes, but only those binary codes with at most two bitwise transitions from 0to 1 or vice versa, called uniform patterns, are considered. The face image is divided intorectangular regions and histograms of the uniform LBP codes are calculated over each ofthem. The histograms of the regions are concatenated into a single one which representsthe face image and the χ2 dissimilarity measure in a nearest neighbourhood classifier isused to compare the histograms of two different images.
In this work, the traditional LBP using the uniform patterns and a (8, 2) neighbour-hood with the χ2 dissimilarity measure (LBP+χ2) is used, but the work can be extendedand improved using more recent LBP extensions like the Multi-Scale Local Binary Pat-tern(MLBP) representation with the Linear Discriminant Analysis(LDA) proposed in [11].
3 New Photometric Normalisation Algorithm based on the Local DCT
The DCT has been used in some face recognition works, either in a holistic appearance-based [12] or local appearance-based sense [13], obtaining promising results. The generalidea is to extract the DCT coefficients. Once they are obtained, the top-left one is removedsince it corresponds to the average value of pixel intensities. Of the remaining coefficients,the ones containing the highest information, usually associated to the low-frequency band,are extracted via zig-zag scan to form the feature vector which is used by a classifier.
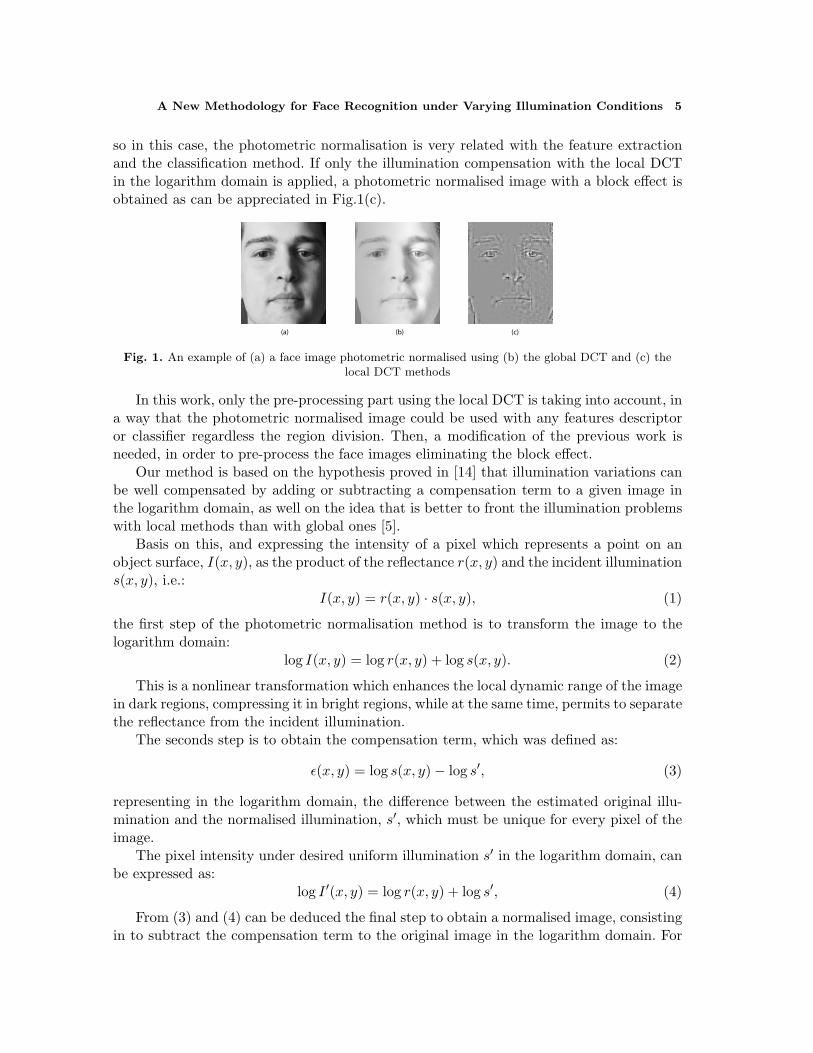
In [14], a different way of using DCT to compensate for illumination variations is pre-sented. They show that illumination variations can be well compensated by adding or sub-tracting a compensation term to a given image in the logarithm domain. Considering thatillumination variations mainly lie in the low-frequency band, they used the low-frequencyDCT coefficients of an image in the logarithm domain as an approximation of the compen-sation term, setting them to zero and reconstructing a normalised image in that way. Thismethod outperformed most of the existing methods dealing with illumination variations.An example of a photometric normalised face image using this method is shown in Fig.1(b).
When the different methods are analyzed it can be deduced that illumination variationsand facial features are not perfectly separated with respect to frequency components. Someillumination variations and facial features lie in the same frequency bands, so when usinglow-frequency components to compensate for illumination variations, some facial informa-tion is lost. However, taking into account that illumination variation affect less in a regionthan in the complete image, if this process is realized in a local way instead of using thefrequency information of the complete face image, less frequency components are using ineach region to estimate the illumination and less facial information is sacrificed.
In [15], a method discarding low-frequency DCT coefficients in the logarithm domain ina local way was presented and it improves the results obtained using the global DCT. In thismethod, the face image is divided in regular regions and low-frequency DCT coefficients ofeach region are discarded, then, uniform Local Binary Pattern (LBP) histograms [10] arecomputed for each region and used for classification. Note that the same region divisionis used for the normalisation with the DCT and for the classification step using the LBP,
A New Methodology for Face Recognition under Varying Illumination Conditions 5
so in this case, the photometric normalisation is very related with the feature extractionand the classification method. If only the illumination compensation with the local DCTin the logarithm domain is applied, a photometric normalised image with a block effect isobtained as can be appreciated in Fig.1(c).
(a) (b) (c)
Fig. 1. An example of (a) a face image photometric normalised using (b) the global DCT and (c) thelocal DCT methods
In this work, only the pre-processing part using the local DCT is taking into account, ina way that the photometric normalised image could be used with any features descriptoror classifier regardless the region division. Then, a modification of the previous work isneeded, in order to pre-process the face images eliminating the block effect.
Our method is based on the hypothesis proved in [14] that illumination variations canbe well compensated by adding or subtracting a compensation term to a given image inthe logarithm domain, as well on the idea that is better to front the illumination problemswith local methods than with global ones [5].
Basis on this, and expressing the intensity of a pixel which represents a point on anobject surface, I(x, y), as the product of the reflectance r(x, y) and the incident illuminations(x, y), i.e.:
I(x, y) = r(x, y) · s(x, y), (1)
the first step of the photometric normalisation method is to transform the image to thelogarithm domain:
log I(x, y) = log r(x, y) + log s(x, y). (2)
This is a nonlinear transformation which enhances the local dynamic range of the imagein dark regions, compressing it in bright regions, while at the same time, permits to separatethe reflectance from the incident illumination.
The seconds step is to obtain the compensation term, which was defined as:
ε(x, y) = log s(x, y)− log s′, (3)
representing in the logarithm domain, the difference between the estimated original illu-mination and the normalised illumination, s′, which must be unique for every pixel of theimage.
The pixel intensity under desired uniform illumination s′ in the logarithm domain, canbe expressed as:
log I ′(x, y) = log r(x, y) + log s′, (4)
From (3) and (4) can be deduced the final step to obtain a normalised image, consistingin to subtract the compensation term to the original image in the logarithm domain. For
6 Ing. Heydi Mendez-Vazquez, Dr. C. Edel Garcıa-Reyes
a given pixel this can be written as:
log I ′(x, y) = log I(x, y)− ε(x, y). (5)
As can be appreciated, the second step consisting in to obtain the compensation term,is the fundamental one to deal with the illumination variations. Consequently is in thisstep when we have to make use of the local information of the face image. This step willbe detailed for its importance in the photometric normalisation algorithm.
3.1 Obtaining the compensation term
From equation (3), the compensation term can be seen as the spare lighting in the faceimage, then to obtain the compensation term, it is necessary to estimate the incidentillumination. Most of the incident illumination represented in an image change slowly, thatis why illumination variations are usually associated to the low-frequency components.
There are different filtering methods in the frequency domain. In [14] it was explainedthe advantages of the use of the DCT to separate the low-frequency components from thehigh ones and to estimate illumination variations.
The DCT-II of an M×N image, is defined as:
C(u, v) = α(u)α(v)M−1∑
x=0
N−1∑
y=0
I(x, y) cos[π(2x + 1)u
2M
]cos
[π(2y + 1)v
2N
](6)
where,
α(u) =
1√M
, u = 0√
2M , u = 1, . . . , M − 1,
(7)
and
α(v) =
1√N
, v = 0√
2N , v = 1, . . . , N − 1
(8)
Since we want to make use of the local information instead of the global one, the faceimage is divided into rectangular regions and the DCT is computed over them. Afterward,using only the low-frequency coefficients of each block -the ones associated to the illumina-tion variations- and setting to zero the remaining ones, a new image, which must representsthe illumination, is obtained by applying the inverse DCT. However, as was told before, itis not so easy to separate the illumination from the facial features in the frequency domain,so the obtained reconstructed image still have facial features information. In this work weanalyse how to modify the low frequency components of each block before applying theinverse DCT, to obtain an image that better represents the compensation term.
Specially, for the first DCT coefficient it is easy to detect that contains informationabout the illumination as well as the facial features. From (6),(7) and (8), this coefficientcan be expressed as:
C(0, 0) =1√
M√
N·
M−1∑
x=0
N−1∑
y=0
I(x, y), (9)
A New Methodology for Face Recognition under Varying Illumination Conditions 7
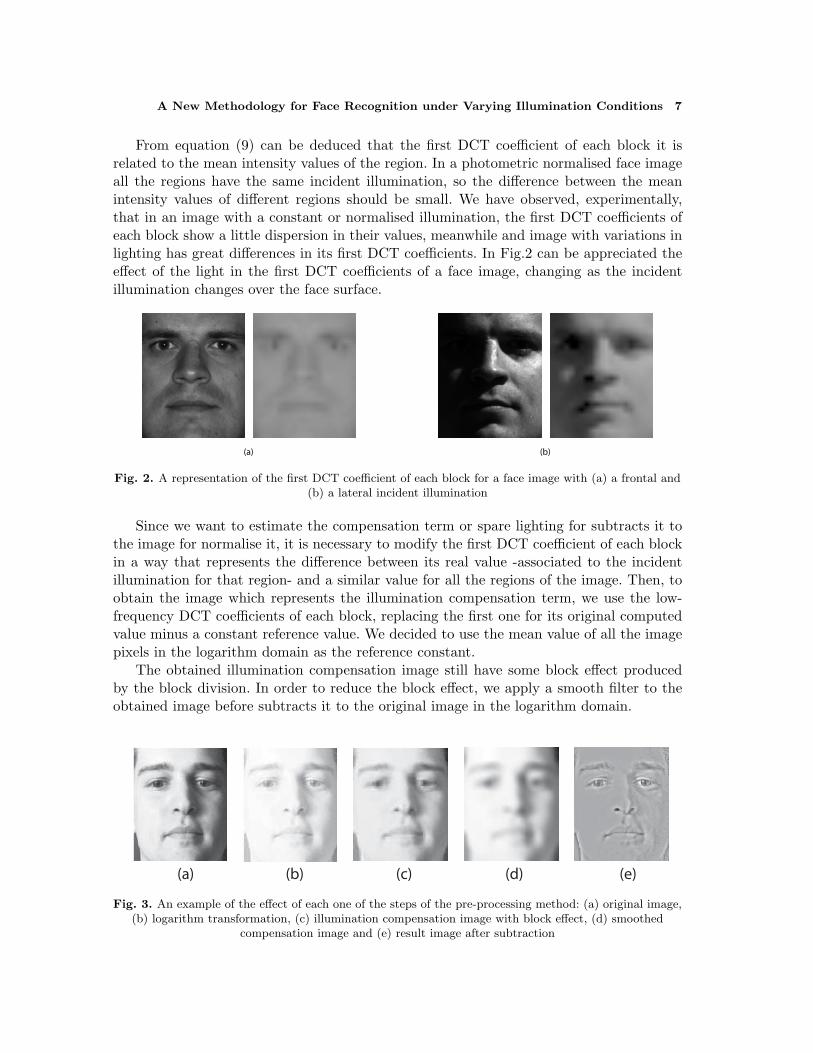
From equation (9) can be deduced that the first DCT coefficient of each block it isrelated to the mean intensity values of the region. In a photometric normalised face imageall the regions have the same incident illumination, so the difference between the meanintensity values of different regions should be small. We have observed, experimentally,that in an image with a constant or normalised illumination, the first DCT coefficients ofeach block show a little dispersion in their values, meanwhile and image with variations inlighting has great differences in its first DCT coefficients. In Fig.2 can be appreciated theeffect of the light in the first DCT coefficients of a face image, changing as the incidentillumination changes over the face surface.
(a) (b)
Fig. 2. A representation of the first DCT coefficient of each block for a face image with (a) a frontal and(b) a lateral incident illumination
Since we want to estimate the compensation term or spare lighting for subtracts it tothe image for normalise it, it is necessary to modify the first DCT coefficient of each blockin a way that represents the difference between its real value -associated to the incidentillumination for that region- and a similar value for all the regions of the image. Then, toobtain the image which represents the illumination compensation term, we use the low-frequency DCT coefficients of each block, replacing the first one for its original computedvalue minus a constant reference value. We decided to use the mean value of all the imagepixels in the logarithm domain as the reference constant.
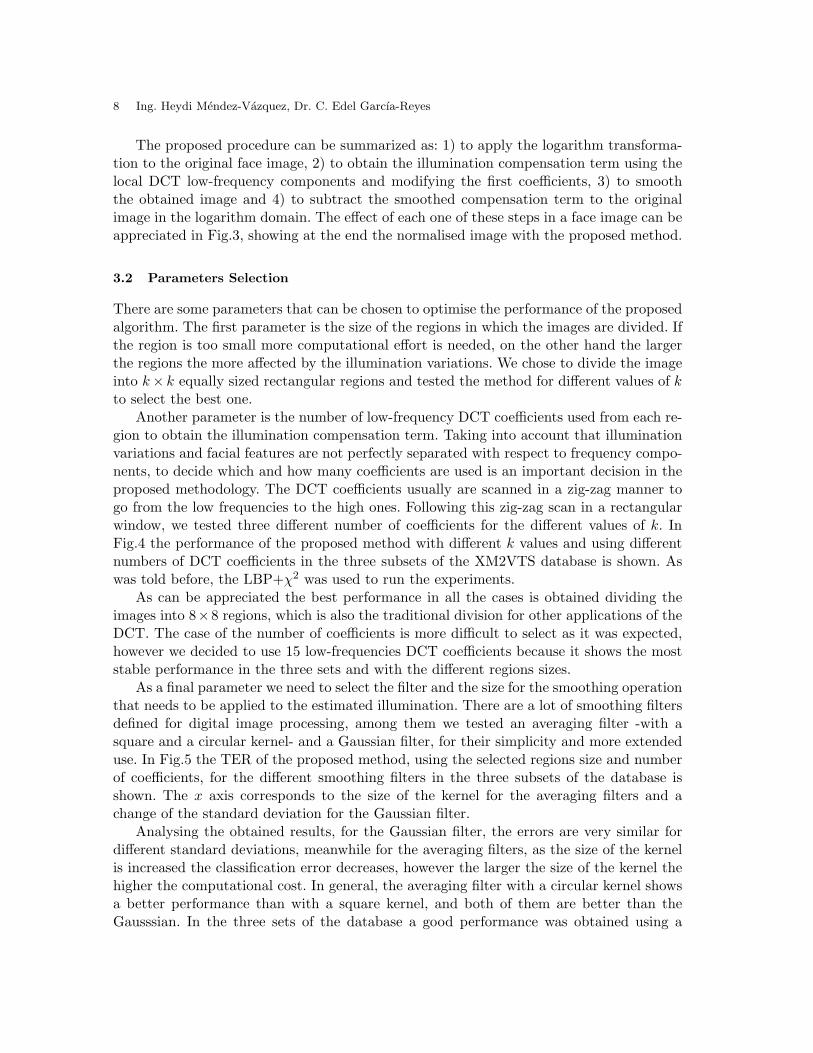
The obtained illumination compensation image still have some block effect producedby the block division. In order to reduce the block effect, we apply a smooth filter to theobtained image before subtracts it to the original image in the logarithm domain.
(a) (b) (c) (d) (e)
Fig. 3. An example of the effect of each one of the steps of the pre-processing method: (a) original image,(b) logarithm transformation, (c) illumination compensation image with block effect, (d) smoothed
compensation image and (e) result image after subtraction
8 Ing. Heydi Mendez-Vazquez, Dr. C. Edel Garcıa-Reyes
The proposed procedure can be summarized as: 1) to apply the logarithm transforma-tion to the original face image, 2) to obtain the illumination compensation term using thelocal DCT low-frequency components and modifying the first coefficients, 3) to smooththe obtained image and 4) to subtract the smoothed compensation term to the originalimage in the logarithm domain. The effect of each one of these steps in a face image can beappreciated in Fig.3, showing at the end the normalised image with the proposed method.
3.2 Parameters Selection
There are some parameters that can be chosen to optimise the performance of the proposedalgorithm. The first parameter is the size of the regions in which the images are divided. Ifthe region is too small more computational effort is needed, on the other hand the largerthe regions the more affected by the illumination variations. We chose to divide the imageinto k× k equally sized rectangular regions and tested the method for different values of kto select the best one.
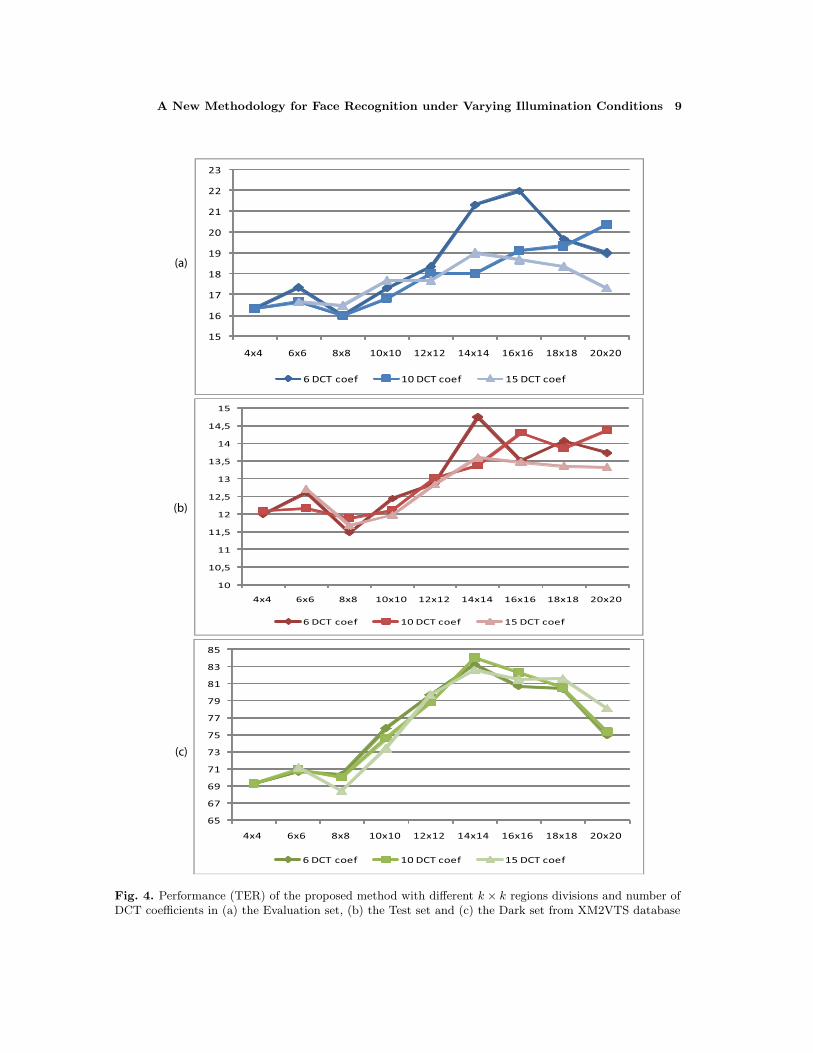
Another parameter is the number of low-frequency DCT coefficients used from each re-gion to obtain the illumination compensation term. Taking into account that illuminationvariations and facial features are not perfectly separated with respect to frequency compo-nents, to decide which and how many coefficients are used is an important decision in theproposed methodology. The DCT coefficients usually are scanned in a zig-zag manner togo from the low frequencies to the high ones. Following this zig-zag scan in a rectangularwindow, we tested three different number of coefficients for the different values of k. InFig.4 the performance of the proposed method with different k values and using differentnumbers of DCT coefficients in the three subsets of the XM2VTS database is shown. Aswas told before, the LBP+χ2 was used to run the experiments.
As can be appreciated the best performance in all the cases is obtained dividing theimages into 8×8 regions, which is also the traditional division for other applications of theDCT. The case of the number of coefficients is more difficult to select as it was expected,however we decided to use 15 low-frequencies DCT coefficients because it shows the moststable performance in the three sets and with the different regions sizes.
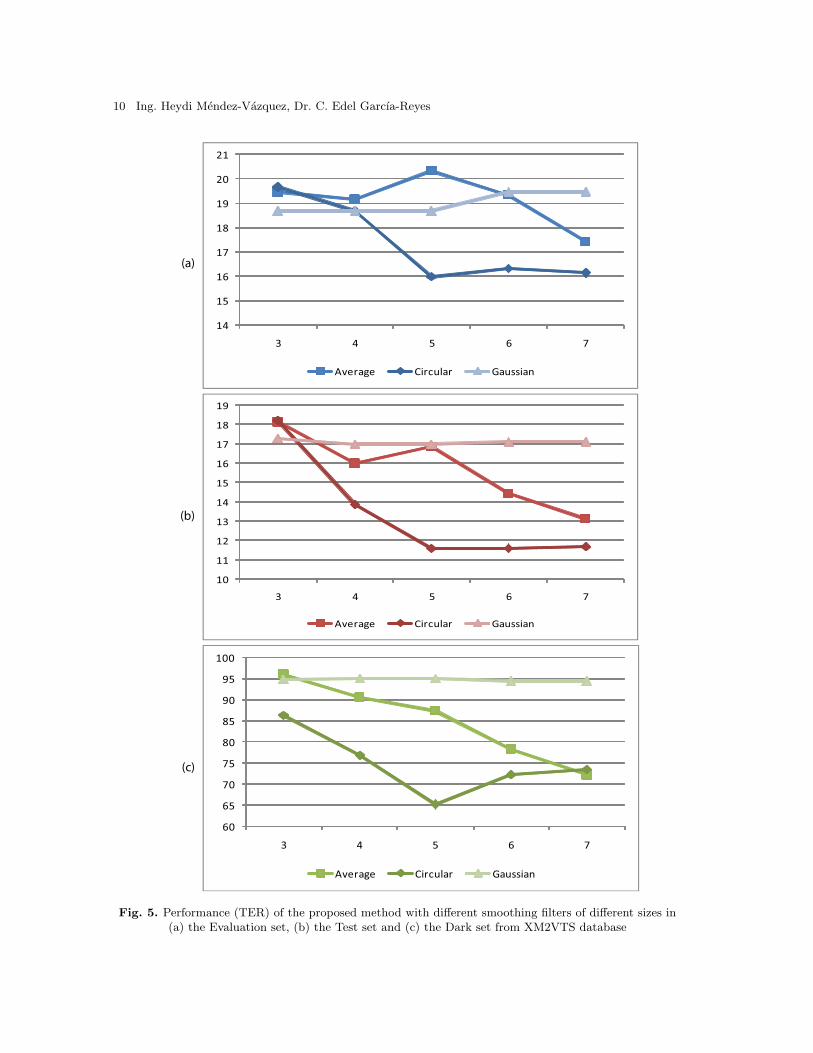
As a final parameter we need to select the filter and the size for the smoothing operationthat needs to be applied to the estimated illumination. There are a lot of smoothing filtersdefined for digital image processing, among them we tested an averaging filter -with asquare and a circular kernel- and a Gaussian filter, for their simplicity and more extendeduse. In Fig.5 the TER of the proposed method, using the selected regions size and numberof coefficients, for the different smoothing filters in the three subsets of the database isshown. The x axis corresponds to the size of the kernel for the averaging filters and achange of the standard deviation for the Gaussian filter.
Analysing the obtained results, for the Gaussian filter, the errors are very similar fordifferent standard deviations, meanwhile for the averaging filters, as the size of the kernelis increased the classification error decreases, however the larger the size of the kernel thehigher the computational cost. In general, the averaging filter with a circular kernel showsa better performance than with a square kernel, and both of them are better than theGausssian. In the three sets of the database a good performance was obtained using a
A New Methodology for Face Recognition under Varying Illumination Conditions 9
15
16
17
18
19
20
21
22
23
4x4 6x6 8x8 10x10 12x12 14x14 16x16 18x18 20x20
6 DCT coef 10 DCT coef 15 DCT coef
10
10,5
11
11,5
12
12,5
13
13,5
14
14,5
15
4x4 6x6 8x8 10x10 12x12 14x14 16x16 18x18 20x20
6 DCT coef 10 DCT coef 15 DCT coef
65
67
69
71
73
75
77
79
81
83
85
4x4 6x6 8x8 10x10 12x12 14x14 16x16 18x18 20x20
6 DCT coef 10 DCT coef 15 DCT coef
(a)
(b)
(c)
Fig. 4. Performance (TER) of the proposed method with different k × k regions divisions and number ofDCT coefficients in (a) the Evaluation set, (b) the Test set and (c) the Dark set from XM2VTS database
10 Ing. Heydi Mendez-Vazquez, Dr. C. Edel Garcıa-Reyes
(a)
(b)
(c)
14
15
16
17
18
19
20
21
3 4 5 6 7
Average Circular Gaussian
10
11
12
13
14
15
16
17
18
19
3 4 5 6 7
Average Circular Gaussian
60
65
70
75
80
85
90
95
100
3 4 5 6 7
Average Circular Gaussian
Fig. 5. Performance (TER) of the proposed method with different smoothing filters of different sizes in(a) the Evaluation set, (b) the Test set and (c) the Dark set from XM2VTS database
A New Methodology for Face Recognition under Varying Illumination Conditions 11
circular averaging of radius 5, which is also a good value for the trade-off of the size of thekernel, so we select this filter to smooth the illumination images.
4 Combining preprocessing methods
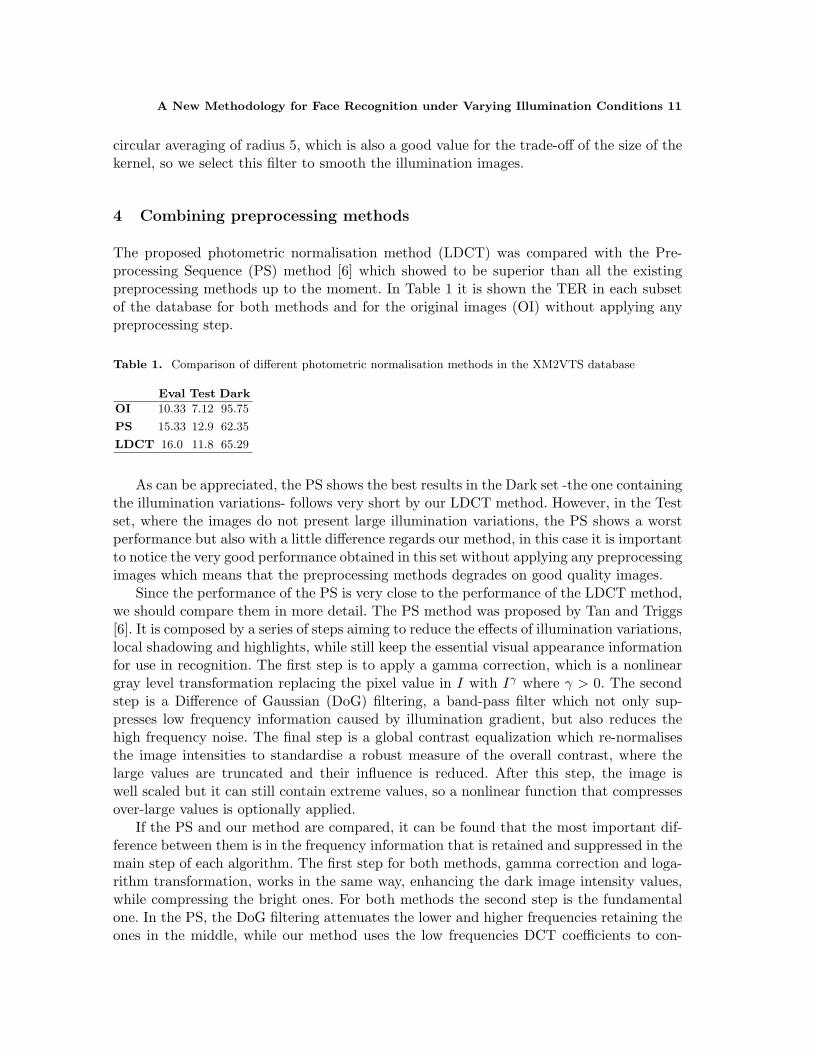
The proposed photometric normalisation method (LDCT) was compared with the Pre-processing Sequence (PS) method [6] which showed to be superior than all the existingpreprocessing methods up to the moment. In Table 1 it is shown the TER in each subsetof the database for both methods and for the original images (OI) without applying anypreprocessing step.
Table 1. Comparison of different photometric normalisation methods in the XM2VTS database
Eval Test Dark
OI 10.33 7.12 95.75
PS 15.33 12.9 62.35
LDCT 16.0 11.8 65.29
As can be appreciated, the PS shows the best results in the Dark set -the one containingthe illumination variations- follows very short by our LDCT method. However, in the Testset, where the images do not present large illumination variations, the PS shows a worstperformance but also with a little difference regards our method, in this case it is importantto notice the very good performance obtained in this set without applying any preprocessingimages which means that the preprocessing methods degrades on good quality images.
Since the performance of the PS is very close to the performance of the LDCT method,we should compare them in more detail. The PS method was proposed by Tan and Triggs[6]. It is composed by a series of steps aiming to reduce the effects of illumination variations,local shadowing and highlights, while still keep the essential visual appearance informationfor use in recognition. The first step is to apply a gamma correction, which is a nonlineargray level transformation replacing the pixel value in I with Iγ where γ > 0. The secondstep is a Difference of Gaussian (DoG) filtering, a band-pass filter which not only sup-presses low frequency information caused by illumination gradient, but also reduces thehigh frequency noise. The final step is a global contrast equalization which re-normalisesthe image intensities to standardise a robust measure of the overall contrast, where thelarge values are truncated and their influence is reduced. After this step, the image iswell scaled but it can still contain extreme values, so a nonlinear function that compressesover-large values is optionally applied.
If the PS and our method are compared, it can be found that the most important dif-ference between them is in the frequency information that is retained and suppressed in themain step of each algorithm. The first step for both methods, gamma correction and loga-rithm transformation, works in the same way, enhancing the dark image intensity values,while compressing the bright ones. For both methods the second step is the fundamentalone. In the PS, the DoG filtering attenuates the lower and higher frequencies retaining theones in the middle, while our method uses the low frequencies DCT coefficients to con-

12 Ing. Heydi Mendez-Vazquez, Dr. C. Edel Garcıa-Reyes
struct the compensation term which is subtracted to the images, so mainly low frequencyinformation is suppressed. The high frequencies attenuation in the PS could be the causefor a worst result when the images are not affected by illumination variations, since theimportant facial features mainly lie in the high frequency bands. The subsequent steps ineach method have different purposes, in the PS case, the filtered image is re-normalisedto improve its overall contrast, while in the LDCT the image constructed with the lowfrequencies is filtered for smoothing and subtracted from the original image, so basicallythey work different and different outputs are obtained in each case.
Taking into account that the PS and the LDCT work different but the total errorrates perceived by them in the XM2VTS database are very similar, it was necessary toanalysed the specifical misclassifications committed for each method. In [16] a statisticaltest to determine the probability of incorrectly detecting a difference between classifierperformance when no difference exists is described. Using this statistic measure we canprobe if the PS and the LDCT methods have or not the same error.
Let:n00 = number of samples misclassified by both PS and LDCTn01 = number of samples misclassified by PS but not by LDCTn10 = number of samples misclassified by LDCT but not by PSn11 = number of samples misclassified by neither PS nor LDCT
From [16], the z statistics is defined as:
z =|n01 − n10| − 1√
n10 + n01
and if |z| > 1.96 we can say that the two methods do not have the same error (with a 0.05probability of incorrect decision).
To compare both methods, the number of samples misclassified for each of them canbe represented in a confusion matrix for a better understanding, where the first columnand row represent the misclassified images by LDCT and PS respectively and the secondones the well classified images:
LDCTP n00 n01
S n10 n11
In Table 2 it is shown the confusion matrix for each set of the XM2VTS database andin Table 3 the z statistic computed using these values.

A New Methodology for Face Recognition under Varying Illumination Conditions 13
Table 2. Comparison of the number of images misclassified by PS and LDCT methods in each set of theXM2VTS database
a) Eval b) Test c) Dark
LDCT
P 581 1042 1623S 699 38278 38977
1280 39320 40600
LDCT
P 1724 3028 4752S 1950 105698 107648
3674 108726 112400
LDCT
P 353 640 993S 968 54839 55807
1321 55479 56800
Table 3. The z statistics computed in each set of the XM2VTS database
Eval Test Dark
|z| 8.19 15.26 8.15
Considering the statistical test in all cases is higher than 1.96, it can be said thatboth methods misclassified the images in a different way. Also if the coincidences in themisclassification (n00) are analysed, it is easy to note that for both method they are lessthan the half of the total of misclassified images. This can be confirmed in Table 4 wherethe percent that represents the coincidences with respect to the total of images misclassifiedfor each method in each subset of the database is shown.
Table 4. Percent that represents the coincidences with respect to the total of images misclassified for eachmethod
Eval Test Dark
PS 35.80% 36.28% 35.55%
LDCT 45.39% 46.92% 26.72%
As was told before, it is appreciated a difference in the behaviour of the methods.Although the TER for both methods in the XM2VTS are very similar, in more than thehalf of the cases, one image which is misclassified with one method is well classified by theother, so this two methods can provide complementary information and their fusion canproduce a superior result.
4.1 The proposed method
Taking into account the obtained experimental results, we decided to combine the PS andthe LDCT methods aiming to improve the performance of face recognition in front ofillumination variations.
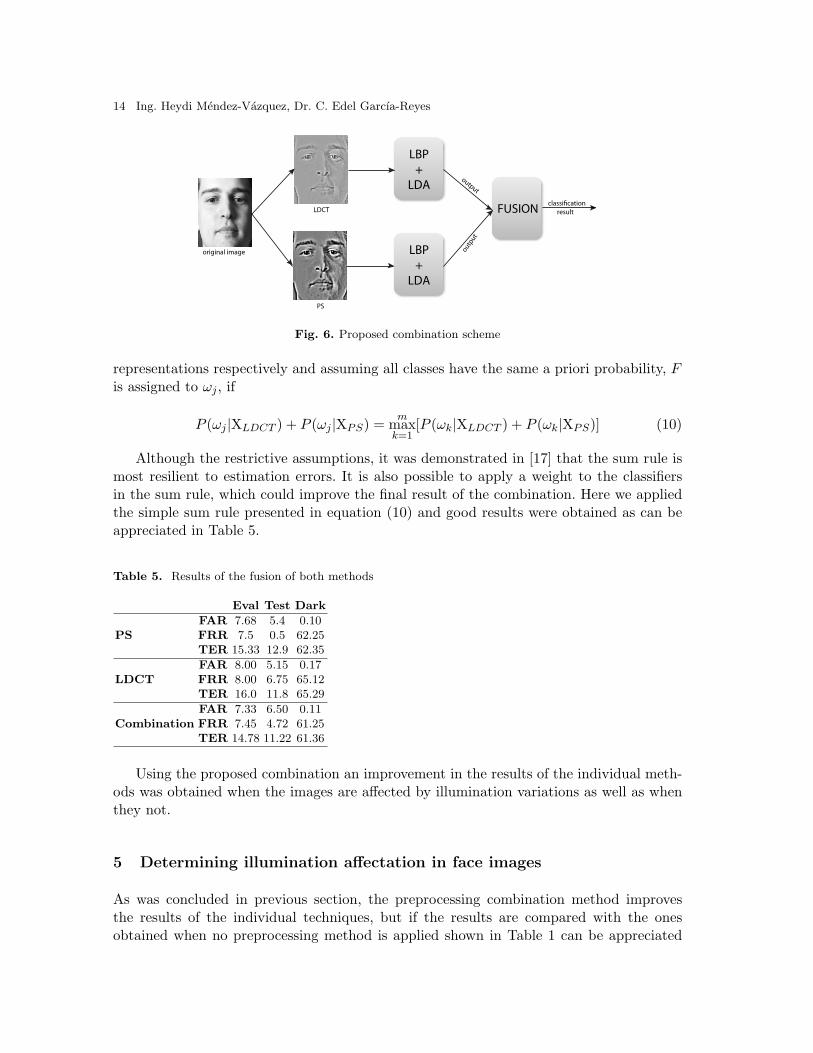
Various classifier combination schemes have been proposed. In our case we have thesame classifier using two different representations for each pattern or image and we wantto combine the outputs of the individual classification as can be appreciated in Fig.6. In[17] it was shown that the sum rule under certain assumptions outperforms other classifiercombinations schemes in this scenario.
Let F be a face image that needs to be assigned to one of the m possible classes of facesω1, ..., ωm, XLDCT and XPS the input vector used by the classifier with the LDCT and PS
14 Ing. Heydi Mendez-Vazquez, Dr. C. Edel Garcıa-Reyes
original image
LDCT
PS
LBP
+
LDA
LBP
+
LDA
FUSION
output
ou
tpu
t
classi!cation
result
Fig. 6. Proposed combination scheme
representations respectively and assuming all classes have the same a priori probability, Fis assigned to ωj , if
P (ωj |XLDCT ) + P (ωj |XPS) =m
maxk=1
[P (ωk|XLDCT ) + P (ωk|XPS)] (10)
Although the restrictive assumptions, it was demonstrated in [17] that the sum rule ismost resilient to estimation errors. It is also possible to apply a weight to the classifiersin the sum rule, which could improve the final result of the combination. Here we appliedthe simple sum rule presented in equation (10) and good results were obtained as can beappreciated in Table 5.
Table 5. Results of the fusion of both methods
Eval Test Dark
FAR 7.68 5.4 0.10PS FRR 7.5 0.5 62.25
TER 15.33 12.9 62.35
FAR 8.00 5.15 0.17LDCT FRR 8.00 6.75 65.12
TER 16.0 11.8 65.29
FAR 7.33 6.50 0.11Combination FRR 7.45 4.72 61.25
TER 14.78 11.22 61.36
Using the proposed combination an improvement in the results of the individual meth-ods was obtained when the images are affected by illumination variations as well as whenthey not.
5 Determining illumination affectation in face images
As was concluded in previous section, the preprocessing combination method improvesthe results of the individual techniques, but if the results are compared with the onesobtained when no preprocessing method is applied shown in Table 1 can be appreciated
A New Methodology for Face Recognition under Varying Illumination Conditions 15
that although the improve achieved when dealing with illumination problems(Dark set),it is degraded on good quality images(Evaluation and Test sets). A method which canautomatically detects if a face image is of good quality or not, regards to illumination,permits to determine if a preprocessing method is needed or not.
Different image quality metrics have been proposed for a number of tasks: to monitorand adjust image quality, to optimize algorithms and parameter settings of image pro-cessing systems and to benchmark image processing systems and algorithms [18]. Qualityassessment methods can be classified according to the availability of the prior informationof what a good image is, into full-reference, reduced-reference and no-reference. Most ex-isting approaches are known as full-reference, meaning that a complete reference imageis assumed to be known. In many practical applications however, the reference image isnot available, and a no-reference or reduced-reference approach is needed. In biometrics, areference image with a high quality is usually not available, but the information availablefrom the biometric images or models helps to evaluate the quality of the distorted imagesin a kind of reduced-reference approach.
For the face recognition case, there are some image quality assessment methods, butmost of them measure the distortion present in the face images cause by the image acqui-sition process, the compression methods and the blur [19][20]. There are other works [21][22] aiming to evaluate the face images according to ICAO definitions [23]. But to the bestof our knowledge no method to determine the illumination affectation in a face image hasbeen reported in the literature.
5.1 The proposed method
First of all, the face image is converted from RGB to HSL color space in order to obtainthe luminance L(x, y) of each pixel from the image, using:
L(x, y) =maxcolor + mincolor
2(11)
where,
maxcolor(x, y) = max[R(x, y), G(x, y), B(x, y)] (12)
mincolor(x, y) = min[R(x, y), G(x, y), B(x, y)] (13)
and R(x, y),G(x, y),B(x, y) are the Red, Green and Blue values of the (x, y) pixel.The luminance refers to the amount of visible light that comes from a surface [24], so
it is associated with the reflectance of the surface and the amount of incident light. Thevariations in a face surface are not so great, then if two regions of the face are perceivedwith a very different luminance is because the incident light in those regions are verydifferent. We then divide the face image in N regular regions and the luminance mean isdetermined in each of them: Lr
m, where r represents the specific region. A low Lrm value
corresponds to a dark region, while a high value corresponds to a bright region. If there isa markable variation between the different Lr
m values of a face image, it can be classified
16 Ing. Heydi Mendez-Vazquez, Dr. C. Edel Garcıa-Reyes
as a bad illuminated face image. Also if all the Lrm values are very low means that the
complete image is dark, while if all are very high the complete image is bright.Following the above criterions and being:
maxR =N
maxr=1
[Lrm]
minR =N
minr=1
[Lrm]
dR = maxR−minR
a face image is classified as well illuminated if the following expression is satisfied:
Q = (maxR > α) and (minR < β) and (dR < γ) (14)
where α,β and γ are user defined thresholds. The Lrm values, as well as the parameters are
normalized between 0 and 1.
5.2 Parameters selection
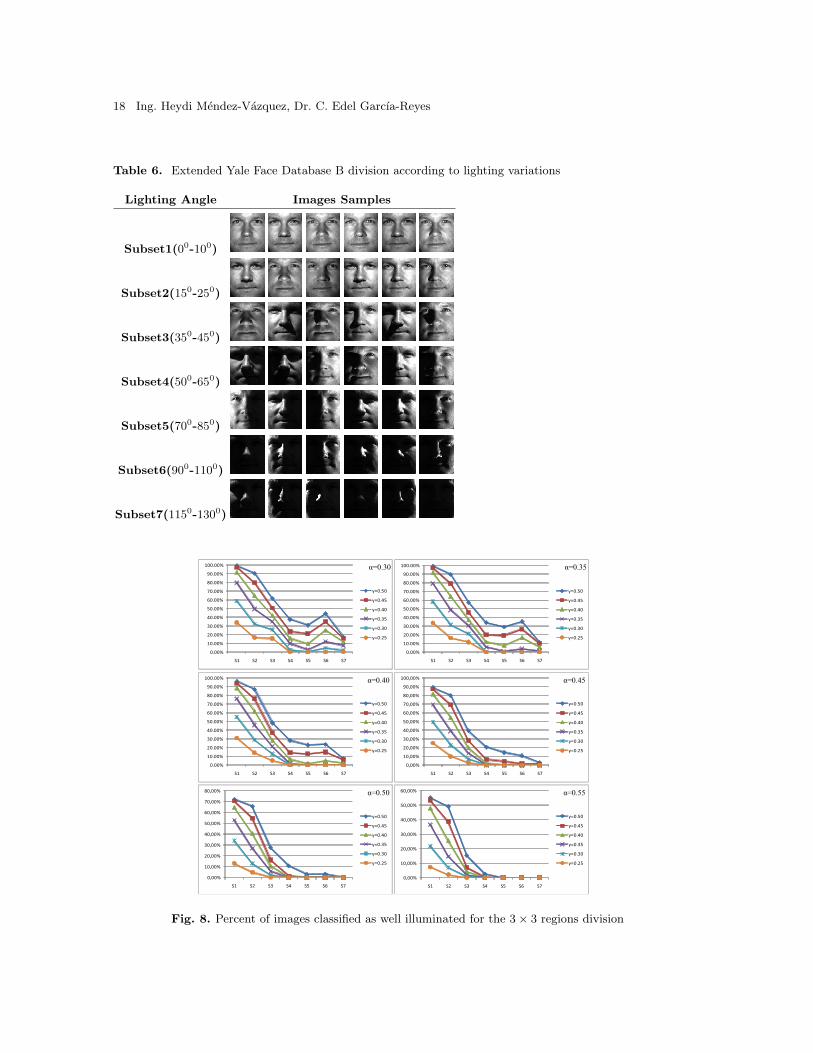
To a better performance of the proposed method it is necessary to establish the thresholdsvalues according to the specific application at hand. Besides, it is necessary to determinethe size of the regions in which the face image will be divided. In our case, the ExtendedYale Face Database B [25] was used to experimentally determine these values. The databaseis composed by face images under 64 varying, but controlled, illumination conditions. Theface images were divided in seven groups according the variation angle of the incident light.In Table 6 sample images from one subject corresponding to each division are shown.
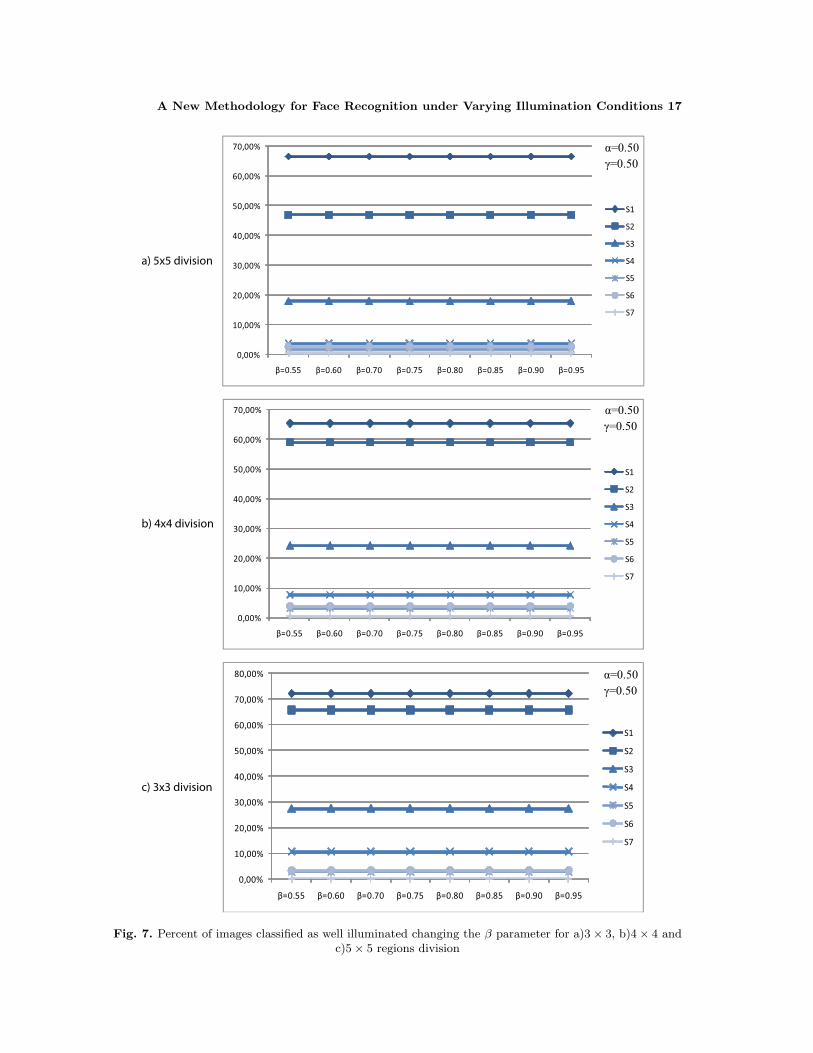
From (14), the β parameter aims to discard those face images which are completelybright. As can be seen in Table 6 we do not have this problem in the database we choosefor test, anyway we run an experiment fixing the α and γ parameters and changing theβ each time with different divisions of the face image. In Figure 7 the percent of imagesclassified as well illuminated in each case is shown. As was expected, for the Extended YaleFace Database B, this parameter has no influence in the images classified as good or badilluminated.
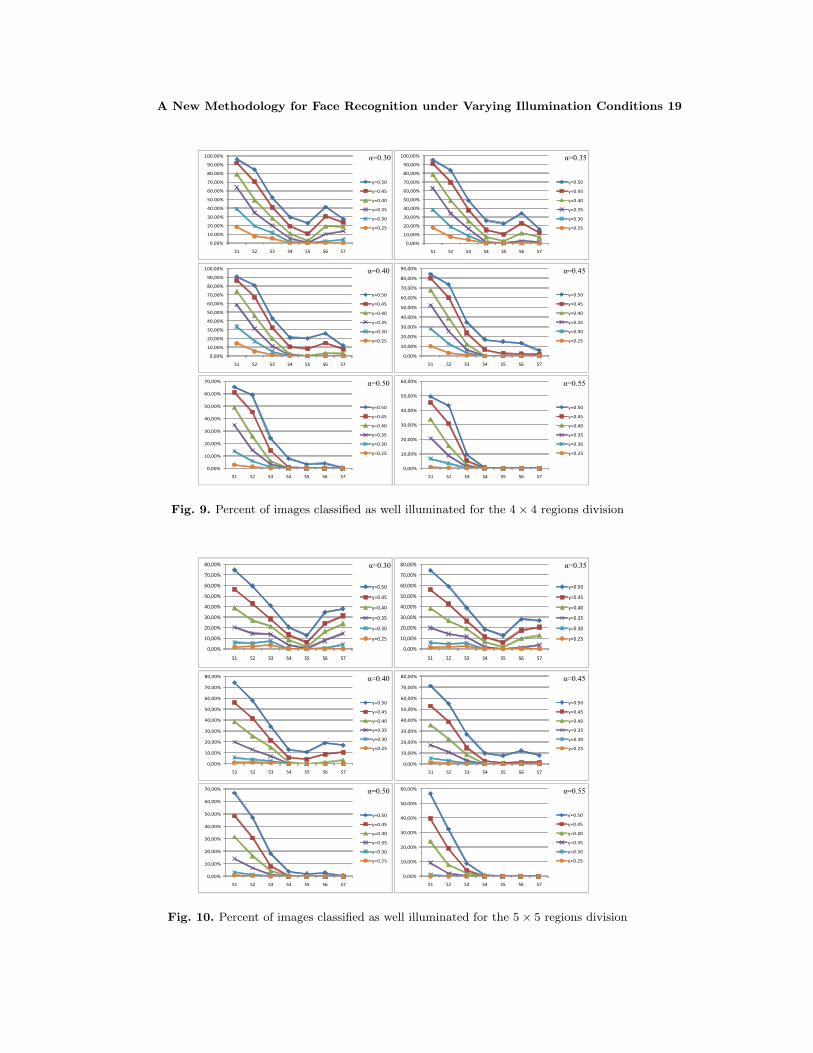
Fixing the β parameter, different experiments were run in order to determine the α,γ and the regions division more suitable. In Figures 8, 9 and 10, the percent of imagesclassified as well illuminated is shown for 3 × 3, 4 × 4 and 5 × 5 division respectively,changing α and γ each time.
As can be appreciated, different configurations produce different results, so the param-eters need to be chosen in depends on the specific applications at hand. In our case, wewant to classify all the images with lighting variations as bad illuminated, then we need tochoose a combination of parameters that produce 0% of well illuminated images in subsets4, 5, 6 and 7. Among the different combinations of parameters that produce 0% of wellilluminated images in subsets 4, 5, 6 and 7, we decided to use the 3×3 division with α = 45and γ = 35 due to is the one which obtains a higher percent of well illuminated images insubset 1.
A New Methodology for Face Recognition under Varying Illumination Conditions 17
0,00%
10,00%
20,00%
30,00%
40,00%
50,00%
60,00%
70,00%
β=0.55 β=0.60 β=0.70 β=0.75 β=0.80 β=0.85 β=0.90 β=0.95
S1
S2
S3
S4
S5
S6
S7
γ=0.50
α=0.50
0,00%
10,00%
20,00%
30,00%
40,00%
50,00%
60,00%
70,00%
β=0.55 β=0.60 β=0.70 β=0.75 β=0.80 β=0.85 β=0.90 β=0.95
S1
S2
S3
S4
S5
S6
S7
0,00%
10,00%
20,00%
30,00%
40,00%
50,00%
60,00%
70,00%
80,00%
β=0.55 β=0.60 β=0.70 β=0.75 β=0.80 β=0.85 β=0.90 β=0.95
S1
S2
S3
S4
S5
S6
S7
γ=0.50
α=0.50
γ=0.50
α=0.50
a) 5x5 division
b) 4x4 division
c) 3x3 division
Fig. 7. Percent of images classified as well illuminated changing the β parameter for a)3× 3, b)4× 4 andc)5× 5 regions division
18 Ing. Heydi Mendez-Vazquez, Dr. C. Edel Garcıa-Reyes
Table 6. Extended Yale Face Database B division according to lighting variations
Lighting Angle Images Samples
Subset1(00-100)
Subset2(150-250)
Subset3(350-450)
Subset4(500-650)
Subset5(700-850)
Subset6(900-1100)
Subset7(1150-1300)
0.00%
10.00%
20.00%
30.00%
40.00%
50.00%
60.00%
70.00%
80.00%
90.00%
100.00%
S1 S2 S3 S4 S5 S6 S7
γ=0.50
γ=0.45
γ=0.40
γ=0.35
γ=0.30
γ=0.25
0.00%
10.00%
20.00%
30.00%
40.00%
50.00%
60.00%
70.00%
80.00%
90.00%
100.00%
S1 S2 S3 S4 S5 S6 S7
γ=0.50
γ=0.45
γ=0.40
γ=0.35
γ=0.30
γ=0.25
0.00%
10.00%
20.00%
30.00%
40.00%
50.00%
60.00%
70.00%
80.00%
90.00%
100.00%
S1 S2 S3 S4 S5 S6 S7
γ=0.50
γ=0.45
γ=0.40
γ=0.35
γ=0.30
γ=0.25
0,00%
10,00%
20,00%
30,00%
40,00%
50,00%
60,00%
S1 S2 S3 S4 S5 S6 S7
γ=0.50
γ=0.45
γ=0.40
γ=0.35
γ=0.30
γ=0.25
0,00%
10,00%
20,00%
30,00%
40,00%
50,00%
60,00%
70,00%
80,00%
S1 S2 S3 S4 S5 S6 S7
γ=0.50
γ=0.45
γ=0.40
γ=0.35
γ=0.30
γ=0.25
0,00%
10,00%
20,00%
30,00%
40,00%
50,00%
60,00%
70,00%
80,00%
90,00%
100,00%
S1 S2 S3 S4 S5 S6 S7
γ=0.50
γ=0.45
γ=0.40
γ=0.35
γ=0.30
γ=0.25
α=0.30 α=0.35
α=0.40 α=0.45
α=0.50 α=0.55
Fig. 8. Percent of images classified as well illuminated for the 3× 3 regions division
A New Methodology for Face Recognition under Varying Illumination Conditions 19
0.00%
10.00%
20.00%
30.00%
40.00%
50.00%
60.00%
70.00%
80.00%
90.00%
100.00%
S1 S2 S3 S4 S5 S6 S7
γ=0.50
γ=0.45
γ=0.40
γ=0.35
γ=0.30
γ=0.25
0,00%
10,00%
20,00%
30,00%
40,00%
50,00%
60,00%
S1 S2 S3 S4 S5 S6 S7
γ=0.50
γ=0.45
γ=0.40
γ=0.35
γ=0.30
γ=0.25
0,00%
10,00%
20,00%
30,00%
40,00%
50,00%
60,00%
70,00%
S1 S2 S3 S4 S5 S6 S7
γ=0.50
γ=0.45
γ=0.40
γ=0.35
γ=0.30
γ=0.25
0,00%
10,00%
20,00%
30,00%
40,00%
50,00%
60,00%
70,00%
80,00%
90,00%
S1 S2 S3 S4 S5 S6 S7
γ=0.50
γ=0.45
γ=0.40
γ=0.35
γ=0.30
γ=0.25
0,00%
10,00%
20,00%
30,00%
40,00%
50,00%
60,00%
70,00%
80,00%
90,00%
100,00%
S1 S2 S3 S4 S5 S6 S7
γ=0.50
γ=0.45
γ=0.40
γ=0.35
γ=0.30
γ=0.25
0,00%
10,00%
20,00%
30,00%
40,00%
50,00%
60,00%
70,00%
80,00%
90,00%
100,00%
S1 S2 S3 S4 S5 S6 S7
γ=0.50
γ=0.45
γ=0.40
γ=0.35
γ=0.30
γ=0.25
α=0.30 α=0.35
α=0.40 α=0.45
α=0.50 α=0.55
Fig. 9. Percent of images classified as well illuminated for the 4× 4 regions division
0,00%
10,00%
20,00%
30,00%
40,00%
50,00%
60,00%
70,00%
80,00%
S1 S2 S3 S4 S5 S6 S7
γ=0.50
γ=0.45
γ=0.40
γ=0.35
γ=0.30
γ=0.25
α=0.30
0,00%
10,00%
20,00%
30,00%
40,00%
50,00%
60,00%
70,00%
80,00%
S1 S2 S3 S4 S5 S6 S7
γ=0.50
γ=0.45
γ=0.40
γ=0.35
γ=0.30
γ=0.25
α=0.35
0,00%
10,00%
20,00%
30,00%
40,00%
50,00%
60,00%
70,00%
80,00%
S1 S2 S3 S4 S5 S6 S7
γ=0.50
γ=0.45
γ=0.40
γ=0.35
γ=0.30
γ=0.25
0,00%
10,00%
20,00%
30,00%
40,00%
50,00%
60,00%
70,00%
80,00%
S1 S2 S3 S4 S5 S6 S7
γ=0.50
γ=0.45
γ=0.40
γ=0.35
γ=0.30
γ=0.25
α=0.40 α=0.45
0,00%
10,00%
20,00%
30,00%
40,00%
50,00%
60,00%
70,00%
S1 S2 S3 S4 S5 S6 S7
γ=0.50
γ=0.45
γ=0.40
γ=0.35
γ=0.30
γ=0.25
0,00%
10,00%
20,00%
30,00%
40,00%
50,00%
60,00%
S1 S2 S3 S4 S5 S6 S7
γ=0.50
γ=0.45
γ=0.40
γ=0.35
γ=0.30
γ=0.25
α=0.50 α=0.55
Fig. 10. Percent of images classified as well illuminated for the 5× 5 regions division
20 Ing. Heydi Mendez-Vazquez, Dr. C. Edel Garcıa-Reyes
6 Experimental Evaluation
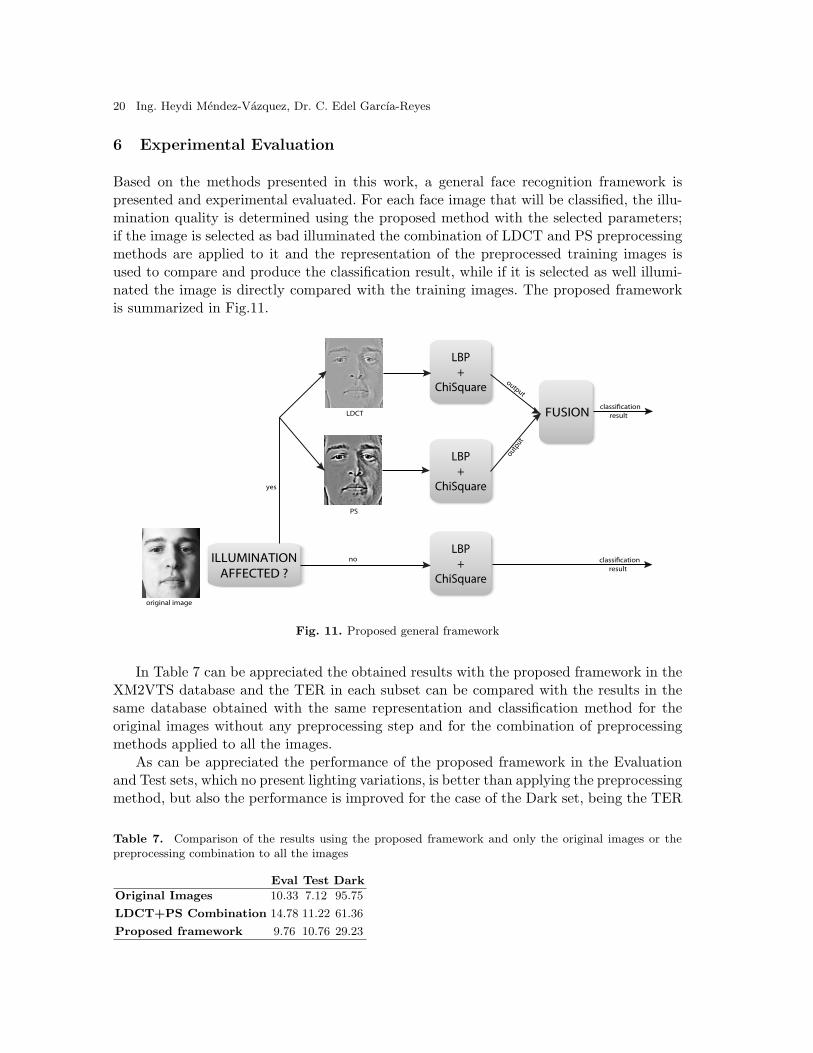
Based on the methods presented in this work, a general face recognition framework ispresented and experimental evaluated. For each face image that will be classified, the illu-mination quality is determined using the proposed method with the selected parameters;if the image is selected as bad illuminated the combination of LDCT and PS preprocessingmethods are applied to it and the representation of the preprocessed training images isused to compare and produce the classification result, while if it is selected as well illumi-nated the image is directly compared with the training images. The proposed frameworkis summarized in Fig.11.
LBP
+
ChiSquare
LBP
+
ChiSquare
original image
LDCT
PS
LBP
+
ChiSquare
FUSION
output
output
classi!cation
result
ILLUMINATION
AFFECTED ?
yes
no classi!cation
result
Fig. 11. Proposed general framework
In Table 7 can be appreciated the obtained results with the proposed framework in theXM2VTS database and the TER in each subset can be compared with the results in thesame database obtained with the same representation and classification method for theoriginal images without any preprocessing step and for the combination of preprocessingmethods applied to all the images.
As can be appreciated the performance of the proposed framework in the Evaluationand Test sets, which no present lighting variations, is better than applying the preprocessingmethod, but also the performance is improved for the case of the Dark set, being the TER
Table 7. Comparison of the results using the proposed framework and only the original images or thepreprocessing combination to all the images
Eval Test Dark
Original Images 10.33 7.12 95.75
LDCT+PS Combination 14.78 11.22 61.36
Proposed framework 9.76 10.76 29.23
A New Methodology for Face Recognition under Varying Illumination Conditions 21
lower than both, for the original images and the preprocessing combination, which meansthat the threshold choose in the Evaluation set is more suitable.
If the results in Table 7 are analyzed, can be appreciated that the performance of theproposed method in the Evaluation set are better even than when the original imagesare used. This can be motivated by the fact that some of the images in this set presentlittle lighting variations. With the combination of parameters selected, these images areclassified as bad illuminated and although the lighting variations are not so great, they arephotometric normalized and better classified.
7 Conclusions
In this work, a new photometric normalisation method for face images based on the localDCT in the logarithm domain was proposed. An image which represents a compensationterm is subtracted to the original face image in the logarithm domain to compensate forillumination variations. To obtain the illumination compensation image, the local DCT isapplied to the original image in the logarithm domain and the low-frequency coefficientsmodifying the first one are used to reconstruct an image applying the inverse DCT.
The proposed LDCT photometric normalisation process was tested on the XM2VTSface database and compared with the best state of the art preprocessing technique achievinga very similar performance. The images misclassified by the LDCT and the PS methodswere analysed in depth, conducing to a new method for classify face images under varyinglighting conditions combining both of them. The propose combination strategy improvesthe results obtained by the individual methods.
Although the good performance of the combination method classifying face imageswith illumination variations, we showed that the result is not so good on good qualityimages, where the best results are obtained when no preprocessing method is applied. Wethen proposed here a method to automatically detects if a face image is affected or notby illumination variations which is inserted in a general framework for face recognitionto determine if a face image needs to be photometric normalised or not. The proposedframework was tested in the XM2VTS database and outperformed the previous resultsin both cases: when the images are affected by illumination variations as well as whenthey not. With the obtained results we can concluded that the proposed framework can beused when we have a face recognition application with variable and unknown illuminationconditions.
References
1. J.P. Phillips, T.W. Scruggs, A.J. O’toole, P.J. Flynn, K.W. Bowyer, C.L. Schott, and M. Sharpe, “Frvt2006 and ice 2006 large-scale results,” Tech. Rep., National Institute of Standards and Technology,March 2007.
2. T.G. Stockham, “Image processing in the context of a visual model,” PIEEE, vol. 60, no. 7, pp.828–842, July 1972.
3. Z.U. Rahman, D.J. Jobson, and G.A. Woodell, “Multi-scale retinex for color image enhancement,” inICIP96, 1996, vol. III, pp. 1003–1006.

22 Ing. Heydi Mendez-Vazquez, Dr. C. Edel Garcıa-Reyes
4. R. Gross and V. Brajovic, “An image preprocessing algorithm for illumination invariant face recogni-tion,” in AVBPA03, 2003, pp. 10–18.
5. M. Villegas and R. Paredes, “Comparison of illumination normalization methods for face recognition,”in Third COST 275 Workshop- Biometric on the Internet, 2005, pp. 27–30.
6. Xiaoyang Tan and Bill Triggs, “Enhanced local texture feature sets for face recognition under difficultlighting conditions,” in AMFG, 2007, pp. 168–182.
7. K. Messer, J. Matas, J. Kittler, and K. Jonsson, “Xm2vtsdb: The extended m2vts database,” in SecondInternational Conference on Audio and Video-based Biometric Person Authentication, 1999, pp. 72–77.
8. T. Ojala, M. Pietikainen, and D. Harwood, “A comparative study of texture measures with classificationbased on feature distributions,” Pattern recognition, vol. 29, no. 1, pp. 51 – 59, 1996.
9. Sebastien Marcel, Yann Rodriguez, and Guillaume Heusch, “On the recent use of local binary patternsfor face authentication,” International Journal on Image and Video Processing Special Issue on FacialImage Processing, 2007, IDIAP-RR 06-34.
10. T. Ahonen, A. Hadid, and M. Pietikainen, “Face recognition with local binary patterns,” Lecture Notesin Computer Science : Computer Vision - ECCV 2004, pp. 469–481, 2004.
11. C.H. Chan, J. Kittler, and K. Messer, “Multi-scale local binary pattern histograms for face recognition,”Advances in Biometrics, vol. 4642/2007, pp. 809 – 818, 2007.
12. Ziad M. Hafed and Martin D. Levine, “Face recognition using the discrete cosine transform,” Int. J.Comput. Vision, vol. 43, no. 3, pp. 167–188, 2001.
13. H. K. Ekenel and R. Stiefelhagen, “Local appearance based face recognition using discrete cosinetransform,” in 13th European Signal Processing Conference (EUSIPCO), 2005, pp. 27–30.
14. W. Chen, Meng J. Er, and Shiqian Wu, “Illumination compensation and normalization for robust facerecognition using discrete cosine transform in logarithm domain,” Systems, Man and Cybernetics, PartB, IEEE Transactions on, vol. 36, no. 2, pp. 458–466, 2006.
15. H. Mendez-Vazquez, E. Garcia-Reyes, and Y. Condes-Molleda, “A new combination of local appearancebased methods for face recognition under varying lighting conditions,” in CIARP08, 2008, pp. 535–542.
16. A. R. Webb, Statistical Pattern Recognition, chapter 8.3, pp. 266 – 271, John Wiley and Sons Ltd, 2dnedition, 2002.
17. Josef Kittler, Mohamad Hatef, Robert P. W. Duin, and Jiri Matas, “On combining classifiers,” IEEETransactions on Pattern Analysis and Machine Intelligence, vol. 20, pp. 226–239, 1998.
18. Zhou Wang, Alan C. Bovik, Hamid R. Sheikh, Student Member, Eero P. Simoncelli, and Senior Member,“Image quality assessment: From error visibility to structural similarity,” IEEE Transactions on ImageProcessing, vol. 13, pp. 600–612, 2004.
19. H. Fronthaler, K. Kollreider, and J. Bigun, “Automatic image quality assessment with application inbiometrics,” Computer Vision and Pattern Recognition Workshop, vol. 0, 2006.
20. Ahmad Nazri Zamani, Mat Kamil Awang, Nazaruddin Omar, and Shahrin Azuan Nazeer, “Imagequality assessments and restoration for face detection and recognition system images,” in AMS ’08:Proceedings of the 2008 Second Asia International Conference on Modelling & Simulation (AMS),Washington, DC, USA, 2008, pp. 505–510, IEEE Computer Society.
21. M. Subasic, S. Loncaric, T. Petkovic, H. Bogunovic, and V. Krivec, “Face image validation system,”in Proceedings of the 4th International Symposium on Image and Signal Processing and Analysis, 2005(ISPA 2005), Washington, DC, USA, 2005, pp. 30–33, IEEE Computer Society.
22. Markus Storer, Martin Urschler, Horst Bischof, and Josef A. Birchbauer, “Face image normalizationand expression/pose validation for the analysis of machine readable travel documents,” in Proceedings32nd OAGM/AAPR Conference, Arjan Kuijper, Bettina Heise, and Leila Muresan, Eds., May 2008,vol. 232, pp. 29–39.
23. InterNational Committee for Information Technology Standards (INCITS), Face Reconition FormatData Interchange, Version 2.0, INCITS Secretariat, Information Technology Industry Council, 2006.
24. Edward H. Adelson, Lightness Perception and Lightness Illusions, chapter 24, pp. 339–351, Cambridge,MA: MIT Press, 2dn edition, 2000.
25. A.S. Georghiades, P.N. Belhumeur, and D.J. Kriegman, “From few to many: Illumination cone modelsfor face recognition under variable lighting and pose,” IEEE Trans. Pattern Anal. Mach. Intelligence,vol. 23, no. 6, pp. 643–660, 2001.

RT_026, marzo 2010
Aprobado por el Consejo Científico CENATAV
Derechos Reservados © CENATAV 2010
Editor: Lic. Lucía González Bayona
Diseño de Portada: DCG Matilde Galindo Sánchez
RNPS No. 2142
ISSN 2072-6287
Indicaciones para los Autores:
Seguir la plantilla que aparece en www.cenatav.co.cu
C E N A T A V
7ma. No. 21812 e/218 y 222, Rpto. Siboney, Playa;
Ciudad de La Habana. Cuba. C.P. 12200
Impreso en Cuba