Embed Size (px)
Citation preview

A NEW METHOD FOR ASSESSING CO2-FOOTPRINTS OF CONTAINER TERMINALS IN
PORT AREAS;
Deltalinqsontbijt – 18th of April 2012
Drs. Ron van Duin – University of Technology DelftProf. dr. Harry Geerlings – Erasmus Smart Port Rotterdam

Introduction
• Ron van Duin and Harry Geerlings- affiliated to PRC (Delft) and ESPR (Rotterdam)
• Presentation of new methodology- present new insides- published and presented in journals and conferences
- academic interest: potential to become a standard- business perspective: optimization of operations- interest from China, Malaysia and Germany (EU-project)
• Structure of presentation

The Context
• At present considerable attention is given to climate change and global warming
• Transport systems have significant impacts on climate change, accounting for between 20 and 25 per cent of world energy consumption and CO2-emissions (in Europe 35%)
• There is increasing pressure on governments and industries to come forward with (more) climate-friendly strategies
• Rotterdam joined the RCI (voluntary) - 50% CO2 reduction in 2025 compared to situation 1990

Expected Trends
• Due to the rapidly growing flow of containers from Asia, mainly from China, it is expected that this growth will accelerate:
- International shipping grew 60% between 1990 and 2006,- It is expected that the number of container handlings will rise from 11 million per year in 2008 to 33 million per year in 2033;
• There is increasing attention for Corporate Social and Environmental Responsibility
• Customers demand is reflected in the logistic chain: Procter & Gamble, IKEA a.o. are interested to know how much CO2is involved in their container handling (source: Maersk lines)
• Synchromodality will introduce new rules of the game

Objective of this meeting
The main purpose of this presentation is to present a well based bottom-up methodology to analyze the CO2-emissions from container terminals in the Netherlands.
- provides new insight on terminal planning and operations- anticipates on logistic requirements- reduce the energy bill of terminals- option to become more green and lean- good to have a general accepted standardized method

Observation
• There is a strong pressure on the sector to become (more) sustainable:
- many research projects and related and activities, lot of data, etc.
However:
• There are many studies on multi-modality, the environmental perspective on the terminal is not taken into consideration
• there is no standardized method and a lack of proposed policies how to reduce the CO2-emissions in this sector

The model:
Since CO2-emissions are the direct consequence of energy used by the transshipment process, it is important to obtain an idea of the factors in the transshipment processes that consume energy.
These factors include:• the equipment used by each sub-process, • the energy-consumption pattern of various types of
equipment, • the deployment of the equipment in each sub-process,• the average distance within a sub-process.

Click to add textThe conceptual model for calculating CO2 emissions at terminals:
Number container moves
[moves/jaar]
+
Container througput
[containermoves/year]
Modal splitj[%]
Terminal Configuration
[move/containermove]
Average distance [m/move]
Variable average diesel
consumption[l/km]
Fixed diesel consumption
[l/move]
Total Consumption[l/year] / [kWh/
year]+
+
+
+
++
Fixed electricity consumption[kWh/move]
CO2-emission[kg/year]
CO2-factor diesel[kg/l]
CO2-factor electricity[kg/kWh]
+
+
++
DIESEL
ELECTRICITY

Click to add textInput variables:
• The overall transshipment performance by means of the total container throughput at a terminal in one year
• Modal split: the breakdown of the transshipment to the various forms of pre-and post –transport
• Terminal configuration: deployment of equipment per sub-process • Quay cranes (QCs) • Barge cranes (BCs) • Rail cranes (RCs) or gantry cranes• Automated Stacking Cranes (ASCs)• rail-mounted Stacking Cranes (RSCs) or gantry cranes• Automated guided vehicles (AGVs) • ReachStackers (RS)
• Terminal layout: average distances of equipment to sub-processes

Energy Type of equipment Fixedconsumptionpercontainermove
Variable consumption Terminals Source
ELECTRIC QC: Quay Crane 6.00 kWh ECT-D, ECT-Ho, ECT-Ha, APM, RST, UNP
(TNO,2006)*
BC: Barge Crane 4.00 kWh ECT-D, APM, BCT,CTN, WIT
(TNO,2006)*
RC: Rail Crane 5.00 kWh ECT-D, APM (TNO,2006)*
ASC: AutomatedStacking Crane
5.00 kWh ECT-D (TNO,2006)*
RSC: RailmountedStacking Crane
7.25 kWh ECT-Ha, RST, UNP ASC**
P: Platform 5.00 kWh RST ASC**
DIESEL AGV: AutomatedGuided Vehicle
1.10 l 1.80 l/km ECT-D (TNO,2006)*
SC: Straddle Carrier 0.80 l 3.50 l/km ECT-D, ECT-Ho, APM,RST
(TNO,2006)*
TT: Terminal Tractors 4.00 l/km ECT-D, ECT-Ho, ECT-Ha, RST, UNP
(TNO,2006)*
MTS: Multi TrailerSystem
4.20 l/km ECT-D, ECT-Ho, APM,UNP
(TNO,2006)*
RS: Reach Stacker /Top Lifter
5.00 l/km ECT-D, ECT-Ho, ECT-Ha, APM, RST, UNP,BCT, CTN, WIT
(TNO,2006)*
* Based on op TNO project by Oonk (TNO Built Environment and Geosciences, 2006)** Based om a comparision with the ASC on the ECT Delta terminal, in which the reach of the equipment (stack length) is taken intoconsderation.


Formalisation
( )( )∑∑==
×+×=5
1,,
11
1)(
jEjiDji
iX fPfvW
where:Wx = Total weight of CO2-emission produced at terminal xVi,j = Yearly consumption of diesel in litres with equipment i to modality jfD = Emission factor in kilogrammes of CO2-emission per lit diesel (= 2.65)Pi,j = Yearly power consumption of electricity in kWh for equipment i to modality jFE = Emission factor in kilogrammes of CO2-emission per kWh (= 0.52),
combined with:Vi,j = ni,j * (Ci,j+ci,j*Xi,j) Tji ∈∀ ,
Pi,j = ni,j * (pi,j) Tji ∈∀ ,
where:ni,j = Number of rides with equipment i to modality j Ci,j = Fixed usage (for example lifting operations) per ride in litresci,j = Variable usage per km in litres (see Table 1)Xi,j = Distance travelled according Manhattan-metric for equipment i to modality jpi,j = Fixed usage per ride in KWh Table 1 for equipment i to modality j
The total CO2-emissions of ‘Terminal x’ can be calculated as: the total sum of emissions by equipment (i) and thesub-processes to tranship to another modality (j). This leads to the next formula:

The case of the Delta terminal• The Delta terminal is currently the largest and most automated
container terminal in the Port of Rotterdam.
• The terminal covers an area of 293 hectares and has an annual cargo of 4.5 million TEUs.
• In 2006 the Delta terminal achieved a throughput of around 4.3 million TEUs. Of these, 3,096,129 were destined for or, originating from the hinterland with the following breakdown on the modalities:
• Road 49% • Inland 34% • Rail 17%

• The terminal is characterized by the fully-automated handling of containers from sea by means of the use of AGVs and ASCs.
• Depending on the modality, the use of terminal equipment varies.
• At the Delta terminal, the following sub-processes can be distinguished:
- Throughput from the sea to stack, vice versa: QC> AGV> ASC;
- Transshipment of inland waterways to stack, vice versa: QC> AGV> ASC or BC> MTS> SC> ASC;
- Throughput on the way to stack, vice versa: SC> ASC; - Transshipment of rail to stack, vice versa: RC> MTS>
SC> ASC;- Inter-terminal transport (Stack - Stack): (ASC> SC>) MTS> SC> ASC.

SEA BARGE ROAD RAIL ITTQC 1 0.71 0 0 0BC 0 0.29 0 0 0RC 0 0 0 1 0ASC 1 0 1 1 1RSC 0 0 0 0 0P 0 0 0 0 0AGV 1 0.71 0 0 0SC 0 0.29 1 1 0.9TT 0.02 0.01 0 0.02 0.1MTS 0 0.06 0 0.2 0.18RS 0.02 0.01 0.02 0.02 0.1
Equipment contribution per type of modality

CO2-emissions per type of equipment

CO2-emissions per mode

Application of the model to all terminalsTerminal Model Estimates Real consumption
l/year l/TEU l/cont l/year l/TEU l/contdifference
%D
iese
lECT Delta
15,005,338 3.52 5.81 17,654,322 4.14 6.83 -15.0ECT Home
4,577,564 4.40 7.27 4,190,952 4.03 6.65 9.2ECT Hanno
324,718 5.62 9.28 684.000 11.84 19.54 -52.5APM
11,827,265 5.38 8.87 UnknownRST
2,285,928 2.29 3.78 1.900.000 1.65 2.72 20.3UNIPORT
1,366,188 3.87 5.73 1.100.000 2.91 4.32 24.2BCT 90,222 0.38 0.58 99,788 0.42 0.64 -9.6CTN 69,099 0.41 0.69 61,429 0.36 0.61 12.5WIT 140,731 0.76 1.35 154,390 0.83 1.48 -8.8
Terminal Model Estimates Real consumption
kWh/year kWh/TEU kWh/cont kWh/year kWh/TEU kWh/contdifference
%
Ele
ctric
ity
ECT Delta45.503,821 10.67 17.61 47,142,857 11.06 18.25 -3.5
ECT Home4.691,736 4.51 7.45 7,500,000 7.22 11.90 -37.4
ECT Hanno640,544 11.09 18.30 1,250,000 21.65 35.71 -48.8
APM10,489,636 4.77 7.87 Unknown
RST9,498,600 8.24 13.59 11,000,000 9.54 15.74 -13.6
UNIPORT6,313,260 16.70 24.78 6,960,000 18.41 27.31 -9.3
BCT 480,401 2.03 3.10 505,976 2.13 3.25 -4.7CTN 301,276 1.78 2.99 315,501 1.87 3.13 -4.5WIT 232,628 1.26 2.23 219,788 1.19 2.11 5.8

Yearly CO2 production per terminal
Terminal CO2 Kton/year (actual)
CO2 Kton/year (model)
CO2 kg/TEU based on diesel
CO2 kg/TEU based on electricity
ECT Delta 71.3 63.4 9.33 14.88
ECT Home 15 14.6 11.67 14.02
ECT Hanno 11.9 24.6 14.90 20.67
APM 35.9 14.03 16.34
RST 10.9 10.7 5.25 9.54
UNIPORT 6.9 6.5 9.58 18.26
BCT 0.53 0.52 1.1 1.1
CTN 0.33 0.32 1.0 1.0
WIT 0.46 0.52 2.2 0.7
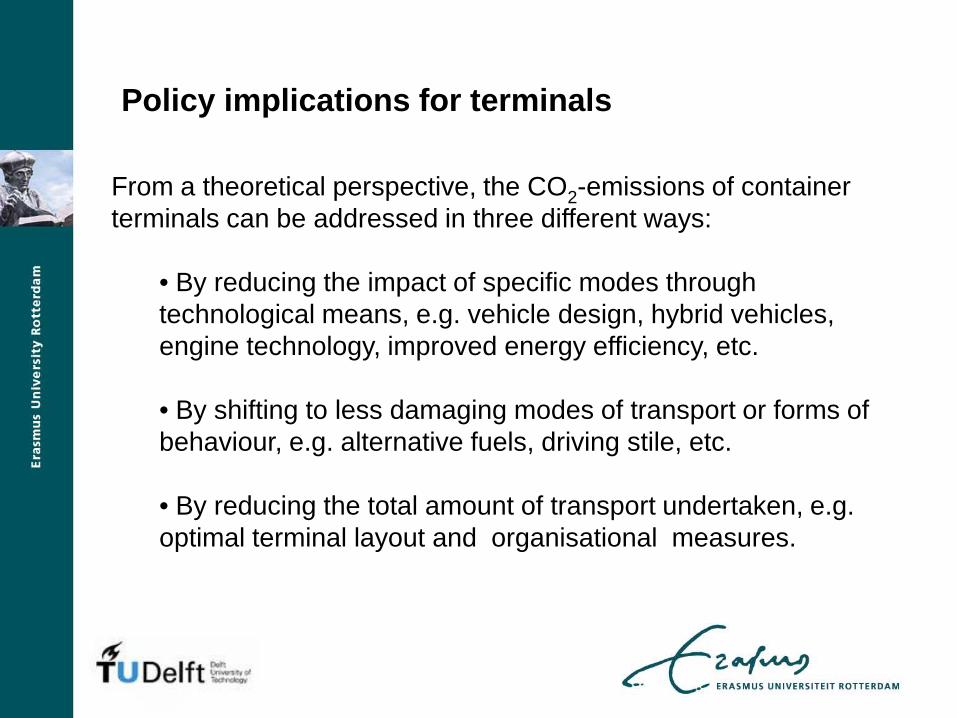
Policy implications for terminals
From a theoretical perspective, the CO2-emissions of container terminals can be addressed in three different ways:
• By reducing the impact of specific modes through technological means, e.g. vehicle design, hybrid vehicles, engine technology, improved energy efficiency, etc.
• By shifting to less damaging modes of transport or forms of behaviour, e.g. alternative fuels, driving stile, etc.
• By reducing the total amount of transport undertaken, e.g. optimal terminal layout and organisational measures.

RecommendationsThe most effective measure for CO2 reduction is undoubtedly the adaptation of the terminal layout. This would make it possible to reduce the CO2-emissions of the current terminals by nearly 70 per cent.
The other two policy proposals to reduce CO2-emissions from the existing terminals may be simpler, but their impacts are far less.
• The first perspective is the establishment of policies which aim at replacing obsolete equipment by new (state-of-the-art) equipment, which can achieve a 20 per cent reduction in CO2-emissions if all diesel-powered equipment is replaced by equipment that operates 20 per cent more efficiency.
•The second perspective is the shift to less damaging modes of transport or alternative fuels, etc.
Observations (1)
• The proposed model has the potential to become a standardas the proposed methodology delivers realistic outcomes
• The outcomes are suitable for the development of a benchmark system for terminals and terminal operation
• There are significant difference between terminals in their CO2-performance;
• The outcomes of the modal offer more opportunities for performance improvements
• A standardized benchmark will lead in the first instance to awareness raising; actions can follow

Observations (2)
• What we like is to do is:
V4 - Approach
- Vergroten: database uitbreiden en valideren,- Verrijken: sea/vessels, gebouwen, wagenpark, etc.- Verfijnen: Iso 14064, ruststand equipment, etc.- Vernieuwen: what if scenarios, interest to
become connected to green award?
• Support for the Rotterdam port community
• Is there a basis for cooperation to come to 1 standardized method?

after the Rotterdam Rules…
Now the Rotterdam Standards?

The End