Embed Size (px)
Citation preview

1
NCSL Task Force on Energy Supply
December 5, 2012
David W. Cash
Commissioner
Massachusetts Department of
Public Utilities
A New Market for Energy Regulation:
Advancing the Clean Energy
Revolution

The Energy Landscape in
Massachusetts, or
The Case for an Aggressive
Clean Energy Agenda
2
3
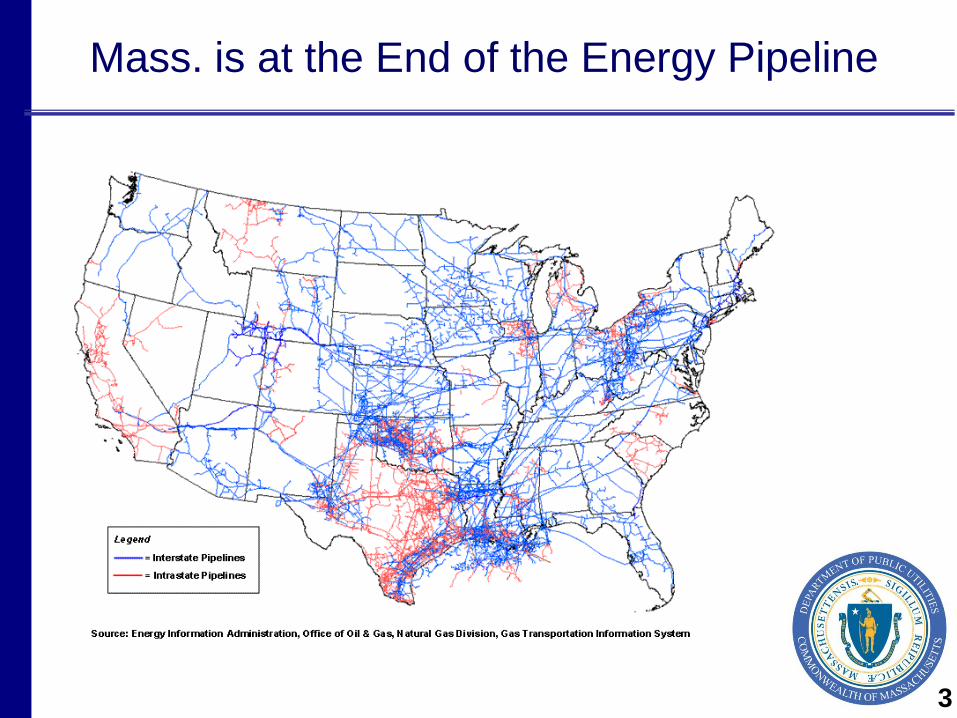
Mass. is at the End of the Energy Pipeline

Energy Dollars Flow Out of MAWe spend $22B per year on energy; 80% leaves MA -- $18B
Oil & Natural Gas
- Canada
Oil - Venezuela
Oil & Natural Gas
- Middle East
Coal – Colombia
MA Energy Imports 2008
$B
Fuel Oil (heating, diesel) $5.0
Gasoline $9.2
Jet Fuel $1.4
Other Petroleum $0.9
Natural Gas $5.2
Coal $0.3
Total $22 B
Per Household Average ~ $4,600 Natural Gas
- Caribbean
Natural Gas
- U.S. Gulf Coast
4
Natural Gas
- PA,NY
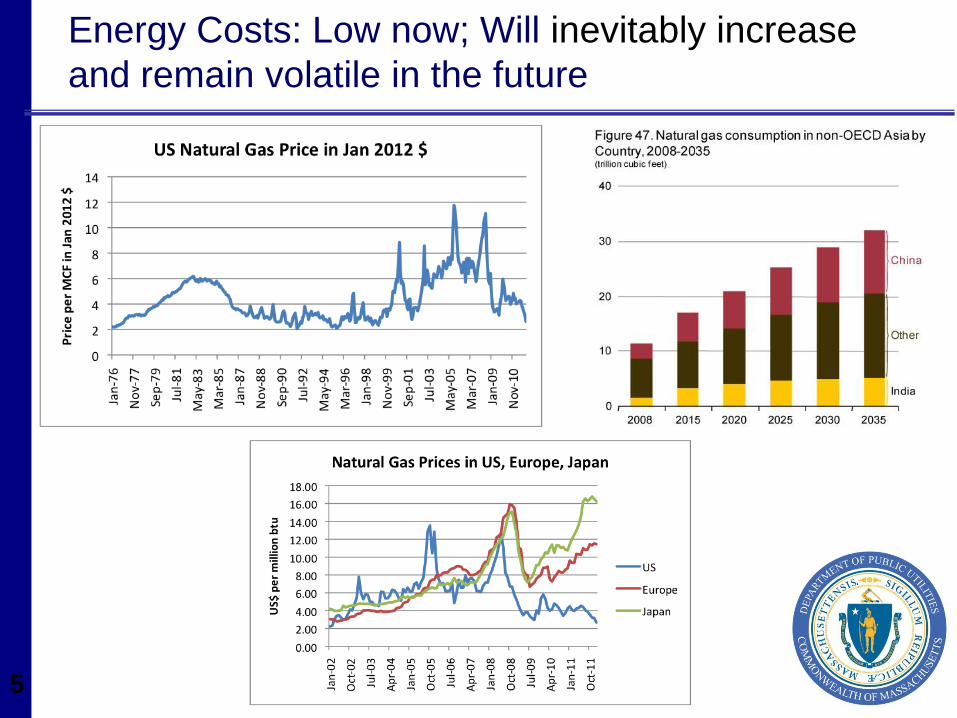
Energy Costs: Low now; Will inevitably increase
and remain volatile in the future
5

Concerns about Fuel Diversity
ISO-NE 6
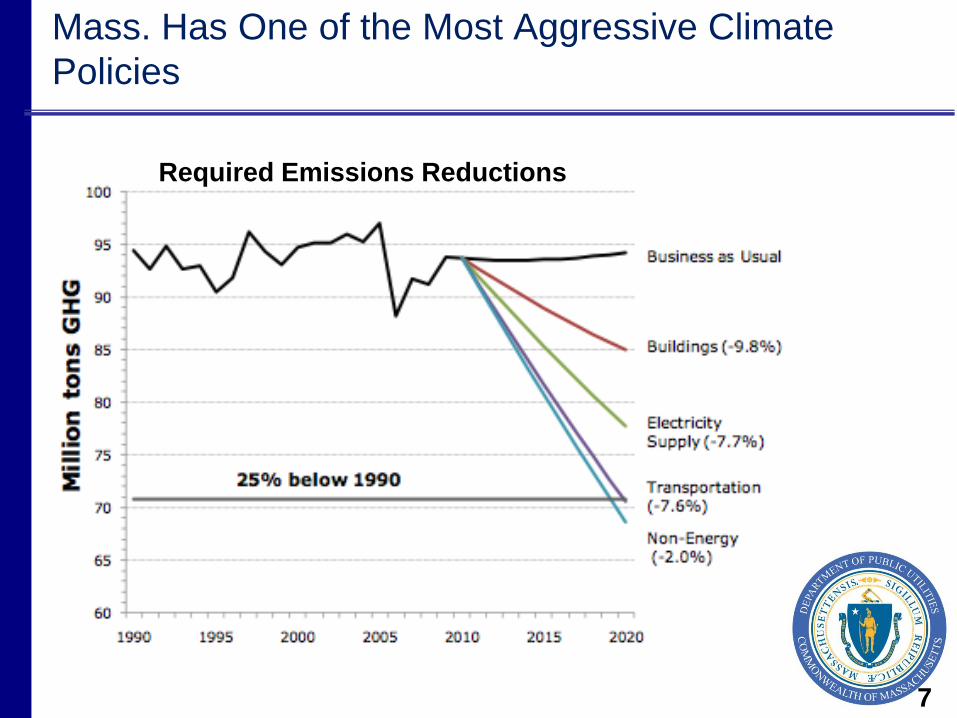
Mass. Has One of the Most Aggressive Climate
Policies
7
Required Emissions Reductions

Seizing the Window of
Opportunity
8
A Clean Energy Policy Revolution Since
2007
9
An integrated approach in legislation,
regulation and investment to:
• Lower energy costs
• Mitigate volatility
• Grow clean energy sector
• Become more energy independent
• Improve the environment

A Clean Energy Policy Revolution Since
2007
10
New Tools:
• All cost-effective Energy Efficiency
must be procured by distribution
utilities
• De-coupling to align incentives for
utilities
• Renewable Portfolio Standard to
send the right market signals
A Clean Energy Policy Revolution Since
2007
11
New Tools:
• Requirement of long-term contracts
to provide certainty for the
development community
• Incentivize and remove regulatory
barriers to net-metering to expand
distributed generation
• Remove regulatory barriers to
expedited interconnection
A Clean Energy Policy Revolution Since
2007
12
New Tools:
• Create a level playing field for demand
resources and renewable energy in
Regional Markets
• Open proceeding to explore the right
regulatory path for grid modernization
and dynamic pricing.
• Create innovation center and state
funding to help fund clean energy
development and job growth
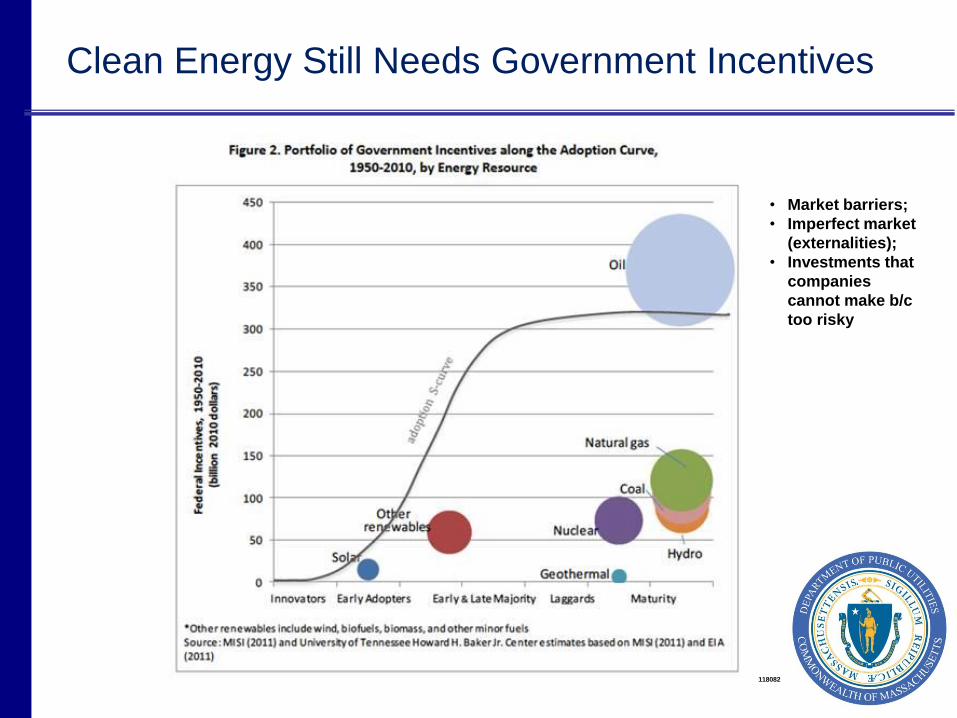
Clean Energy Still Needs Government Incentives
“…Without the current
capital provisions in place, we
would not have been able to
fail over and over again,
which is what it took to
advance the technology
needed…”
13
Clean Energy Still Needs Government Incentives
"The development of
horizontal drilling took trial
and error. Without the current
capital provisions in place, we
would not have been able to
fail over and over again,
which is what it took to
advance the technology
needed to produce the
Bakken and numerous other
resource plays across
America.”
Harold Hamm, the CEO of Continental Resources at the
June 12 Senate Finance Committee hearing on the
relationship between the tax code and energy policy
14
The Results
15

Solar PV in MA (through Sept, 2012)C
um
ula
tive
Ca
pa
cit
y (
MW
)
-
20
40
60
80
100
120
140
160
180
200 Non-RET Funded
Commonwealth Solar II
Commonwealth Solar
Stimulus
Small Renewables Initiative
GAHI
Solar to Market Initiative
Utility Scale Renewable Grants
Utility Congestion Relief
16

Land-Based Wind
0
20
40
60
80
100
120
Cap
acit
y (M
W)
Year
Total Yearly Capacity
Pipeline Yearly Capacity
Cumulative CapacitykW
Yearly and Cumulative Wind Capacity (Installed and Pipeline)
17

Adding Renewables to the Mix Can Lower
Prices
18
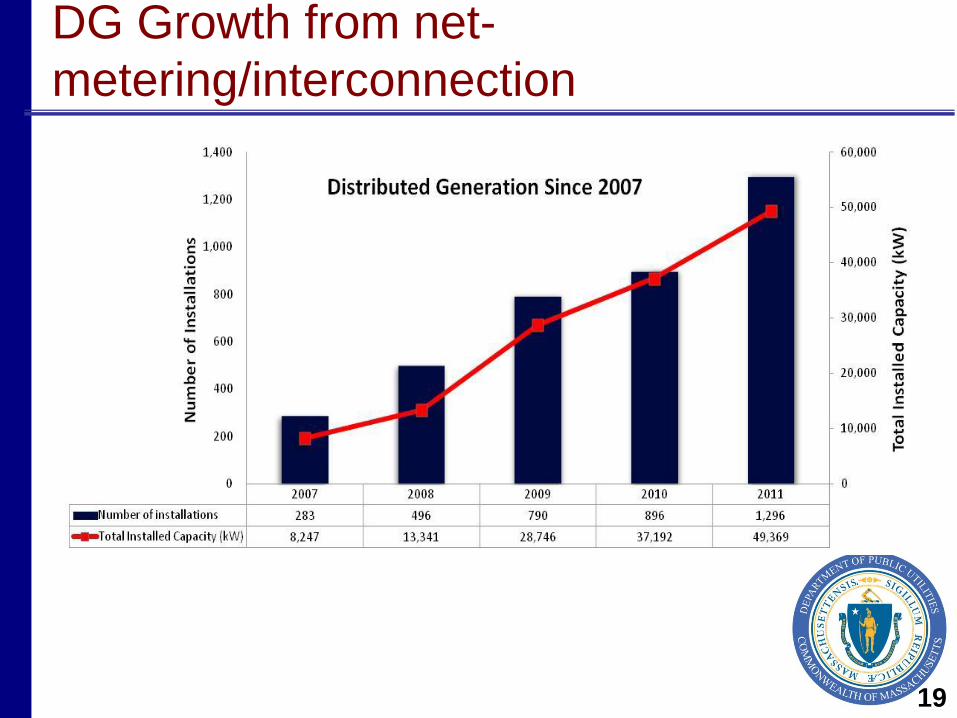
DG Growth from net-
metering/interconnection
19

C&I MWhs Saved (annual)
20

New Resources, including NTAs, in the
Capacity Market Since 2010
* Renewables include wood waste solids, municipal solid waste, wind, landfill gas, tire-
related, biomass, and solar. 21
22
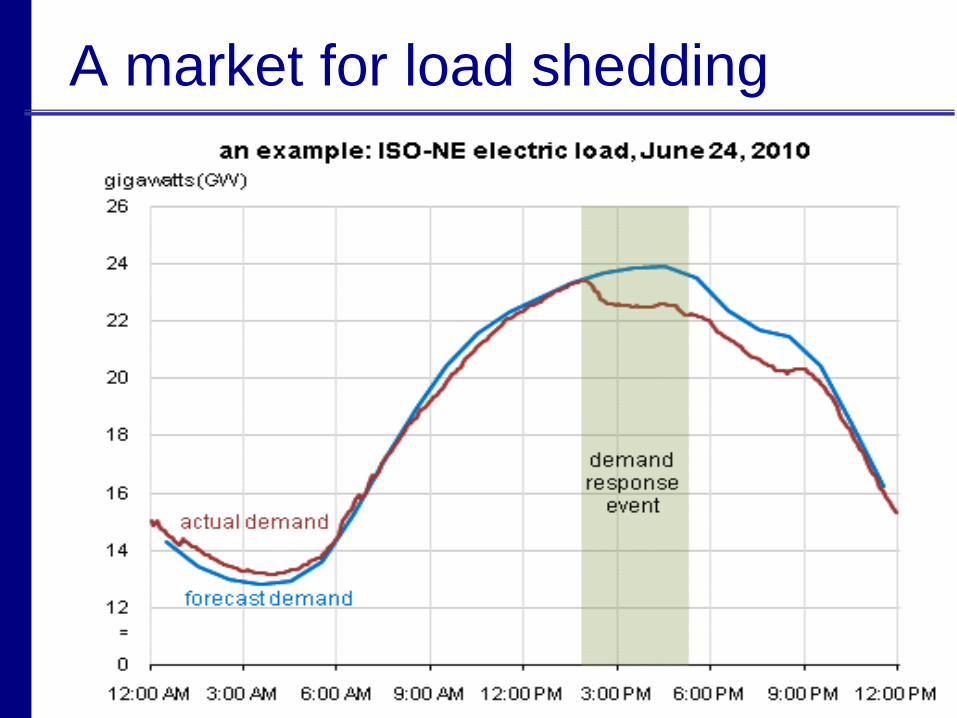
A market for load shedding

2006The Massachusetts Clean Energy Revolution
o Solar
o Wind
o Other Renewables

2007The Massachusetts Clean Energy Revolution
o Solar
o Wind
o Other Renewables
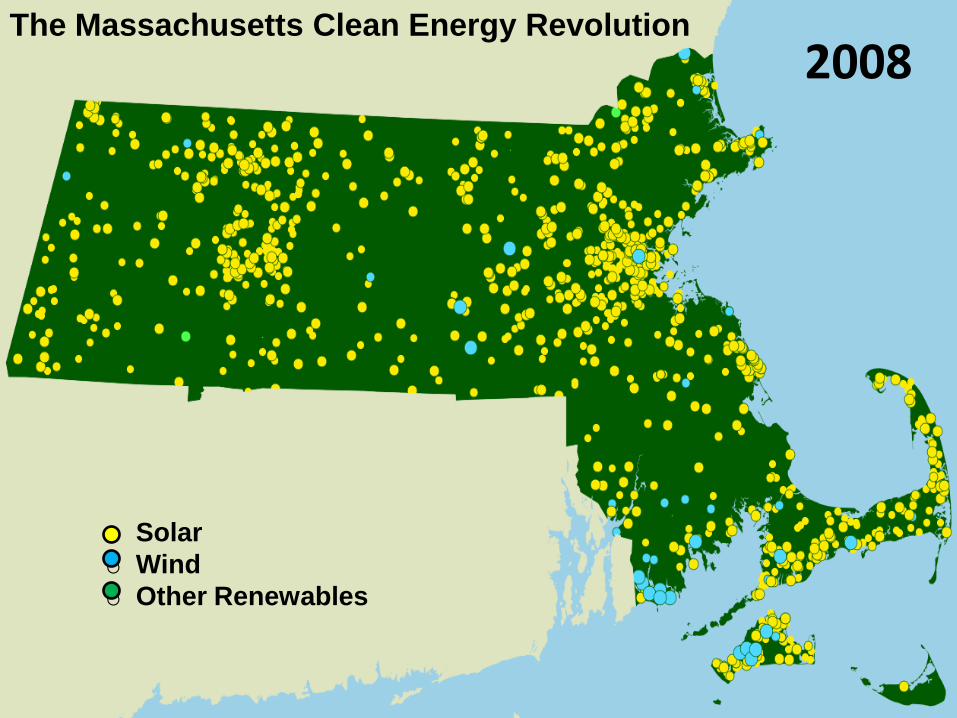
2008The Massachusetts Clean Energy Revolution
o Solar
o Wind
o Other Renewables
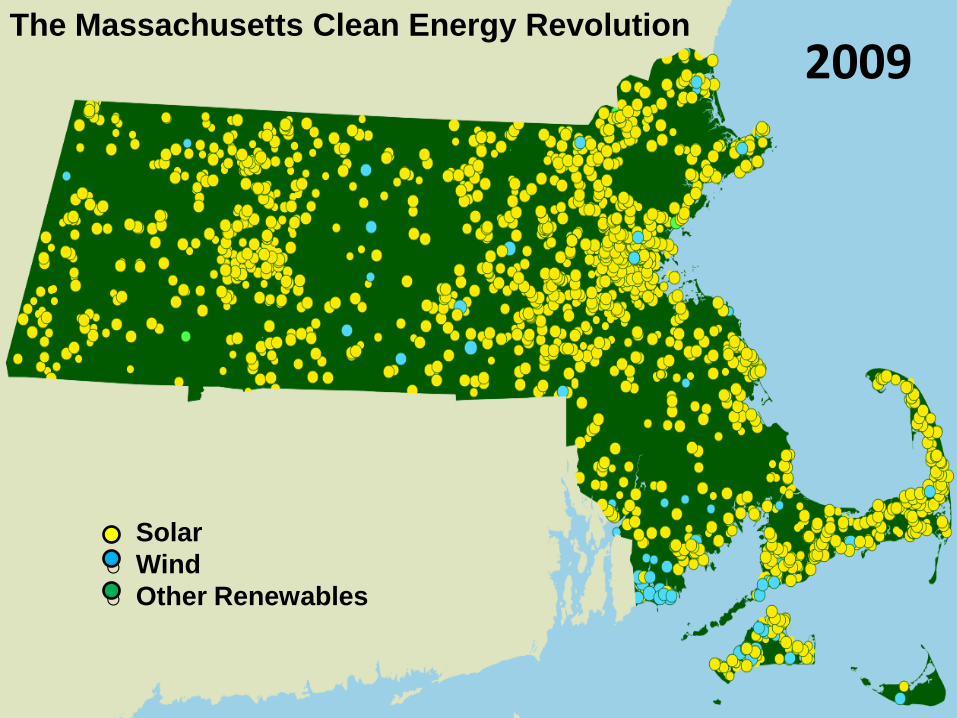
2009The Massachusetts Clean Energy Revolution
o Solar
o Wind
o Other Renewables
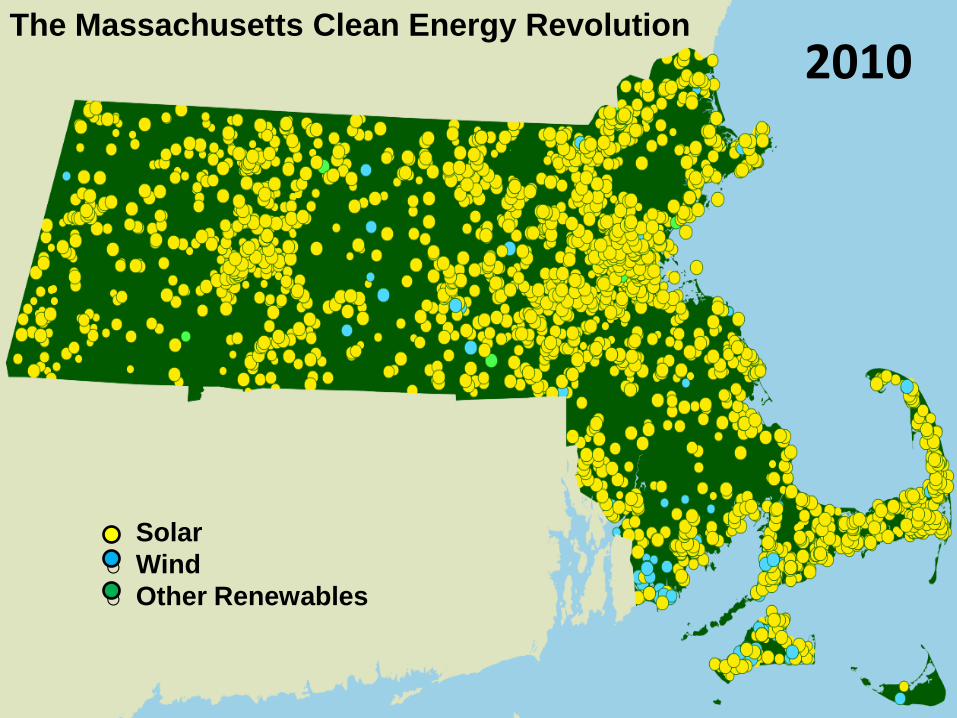
2010The Massachusetts Clean Energy Revolution
o Solar
o Wind
o Other Renewables

2011The Massachusetts Clean Energy Revolution
o Solar
o Wind
o Other Renewables

Clean Energy Sector Growth
2012 Massachusetts Clean Energy Industry Report
http://www.masscec.com/index.cfm/page/2012-Massachusetts-Clean-Energy-
Industry-Report/cdid/13909/pid/11170 29
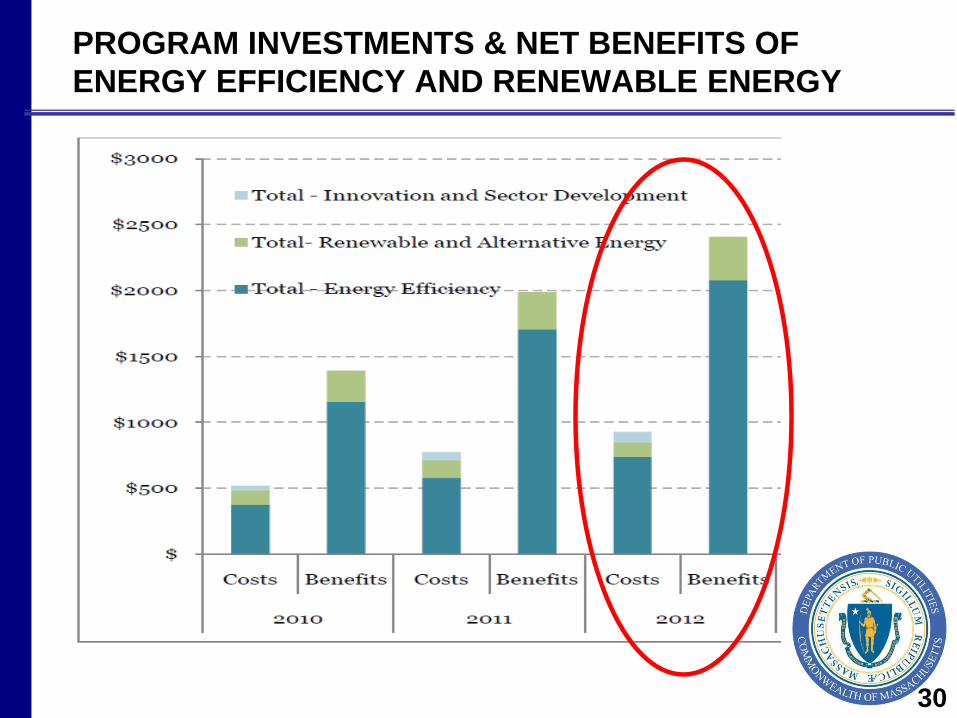
PROGRAM INVESTMENTS & NET BENEFITS OF
ENERGY EFFICIENCY AND RENEWABLE ENERGY
30

• Siting
• Maintaining grid reliability and
stability
• Cost allocation
• New Pricing Regimes
• Grid modernization/Smart Grid
Challenges/Opportunities
31

CONCLUSIONConventional fossil-based market:The more it changes, the more it stays the same
• Regional to global demand will increase prices
• Gas prices will stay volatile
• NE is congested
• Lack of fuel diversity is a challenge
• Subsidies still needed
• Clean energy sector creates economic opportunities
• Need to address air emissions/climate
Window of opportunity is now
• Lowest energy prices in years
• Investments in clean energy are relatively small and result in
significant savings for customers and greater reliability
• 5 years experience of ramping up the most aggressive EE and
RE programs in the country

Demand Resources Growing in New
EnglandCapacity Market has stimulated DR growth
FCM
2010/11–2014/16: Total DR cleared in FCAs #1 – #6; real-time emergency generation capped at 600 MW
Enrollment in ISO programs before the start of
FCM
Demand Resource Participation in Region
3
4
Passiv
e (EE)
Activ
e
Real-
Time
EG
Active
Real-
Time
DR
We have a perfect window
right now to make clean
energy investments.
- Governor Deval Patrick, May 30, 2012

Mass. Has High Electricity Prices
36
2
4
6
8
10
12
14
16
18
20
22
24
26
HI
CT
N
Y
AK
N
H
NJ
MA
R
I C
A
DC
V
T
ME
M
D
DE
F
L
PA
M
I U
S
NV
W
I A
Z
TX
C
O
OH
IL
A
L
GA
V
A
NC
T
N
MS
S
C
NM
M
N
KS
M
O
MT
L
A
SD
IN
IA
O
R
OK
N
E
WV
A
R
ND
U
T
KY
W
A
ID
WY
2010 Average Retail Electricity Price c/kWh
Mass. is
7th
U.S
Source: EIA Form 826
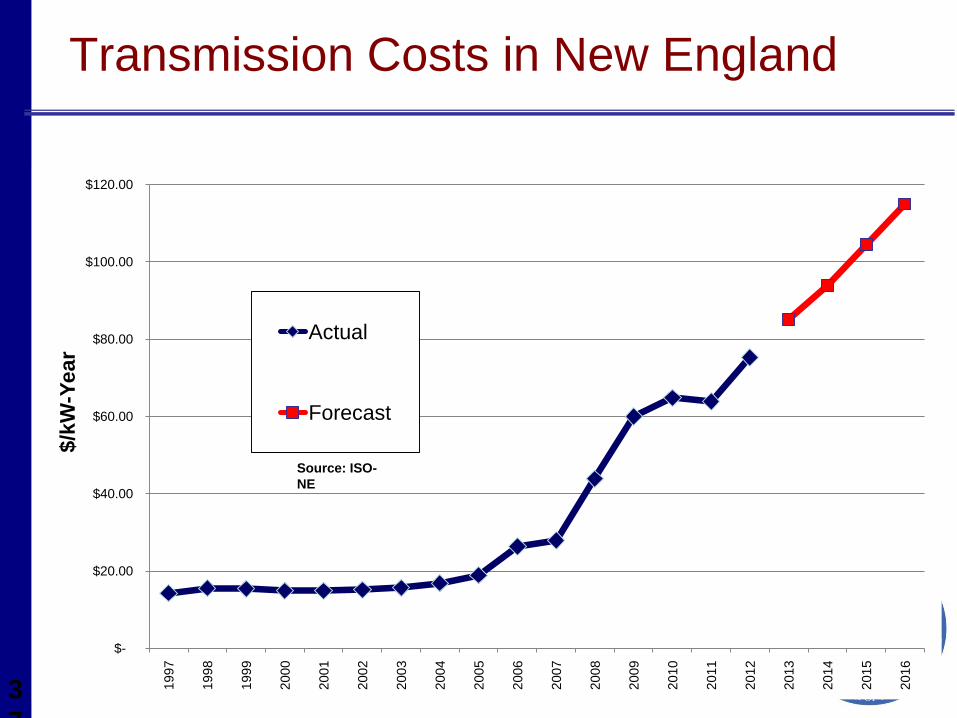
Transmission Costs in New England
3
7
$-
$20.00
$40.00
$60.00
$80.00
$100.00
$120.00
1997
1998
1999
2000
2001
2002
2003
2004
2005
2006
2007
2008
2009
2010
2011
2012
2013
2014
2015
2016
$/k
W-Y
ear
Actual
Forecast
Source: ISO-
NE

Demand Resources Growing in New EnglandCapacity Market has stimulated DR growth
38
FCM
2010/11–2014/16: Total DR cleared in FCAs #1 – #6; real-time emergency generation capped at 600 MW
Enrollment in ISO programs before the start of
FCM
Demand Resource Participation in Region
Passive
(EE)
Active
Real-
Time
EG
Active
Real-
Time
DR

Changes in rates over time

From and Industry Group:“D&T Costs Are Increasing Rapidly”
-50%
0%
50%
100%
150%
200%
250%
Dec-05 Dec-06 Dec-07 Dec-08 Dec-09 Dec-10
% Change in commodity unit cost vs. Dec '05
% Change in D & T unit cost vs. Dec. '05 40
Perc
en
t C
han
ge s
ince 2
005

Previous data, partially corrected
41
Pe
rce
nt
of
To
tal B
ill

Costs and Benefits
Incremental impact of GCA on
rates

Components of total rate, NSTAR residential

45
Components of total rate, NSTAR Commercial
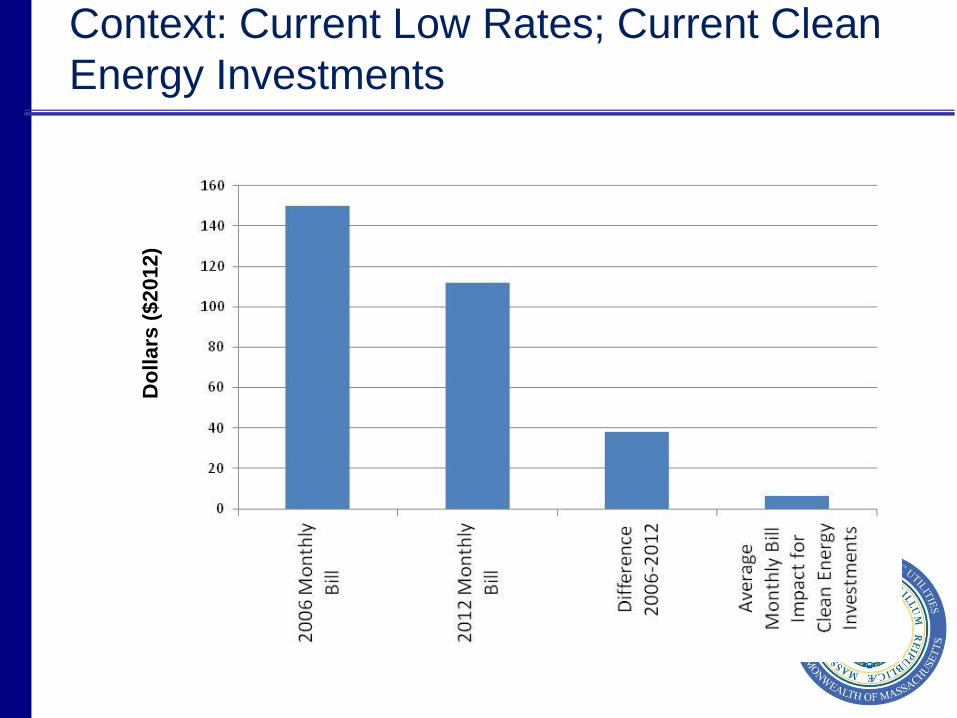
Context: Current Low Rates; Current Clean
Energy Investments
Do
llars
($2012)
Clean Energy Subsidies

Clean Energy Still Needs Government Incentives
“…Without the current
capital provisions in place, we
would not have been able to
fail over and over again,
which is what it took to
advance the technology
needed…”
48

Clean Energy Still Needs Government Incentives
"The development of
horizontal drilling took trial
and error. Without the current
capital provisions in place, we
would not have been able to
fail over and over again,
which is what it took to
advance the technology
needed to produce the
Bakken and numerous other
resource plays across
America.”
Harold Hamm, the CEO of Continental Resources at the
June 12 Senate Finance Committee hearing on the
relationship between the tax code and energy policy
49

Clean Energy Still Needs Government Incentives
Source: Congressional Research Service 2011. Some figures may include expenditures related to transportation fuels. To
more accurately reflect the value of tax incentives supporting renewable electricity, the “renewables” category does not
include expenditures related to alcohol fuels and biodiesel.
0
5
10
15
20
25
30
35
40
45
50
1981 1985 1989 1993 1997 2001 2005 2007 2009 2010
Billio
ns (
2010$)
Cumulative Expenditures for Fossil Fuels and Renewables(2010 Dollars, Billions)
Fossil Fuels
Renewables
50
http://www.forexpros.com/analysis/why-us-natural-gas-prices-are-so-low---are-changes-needed%20-118082
Clean Energy Still Needs Government Incentives
• Market barriers;
• Imperfect market
(externalities);
• Investments that
companies
cannot make b/c
too risky

Climate Change is Still Real and We are Still Required to Act
52
Required Emissions Reductions
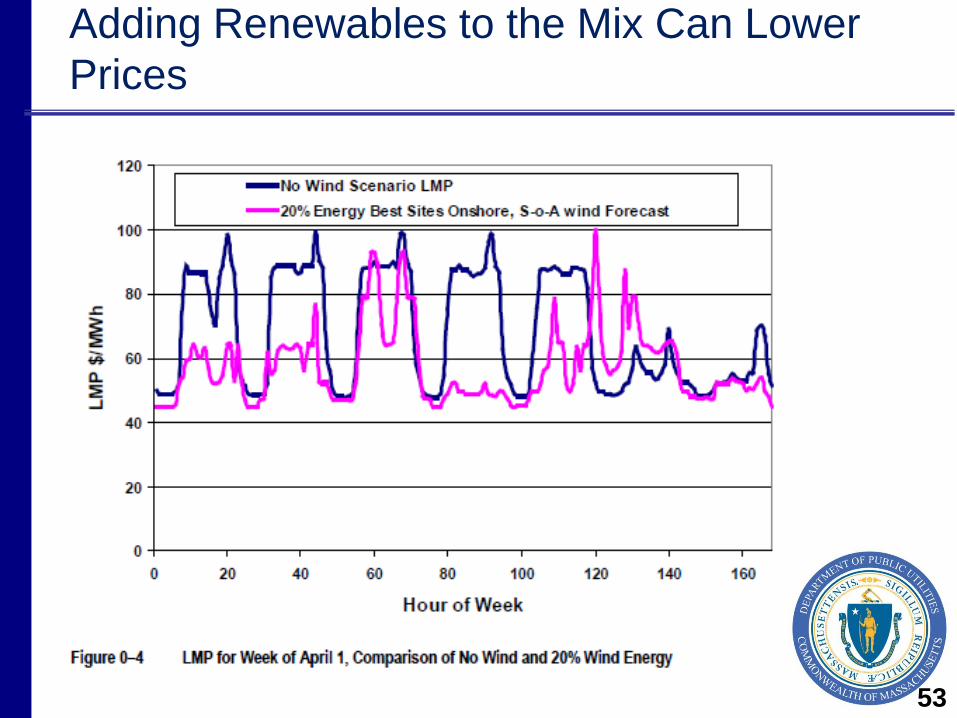
Adding Renewables to the Mix Can Lower
Prices
53

Context: Current Low Rates; Current Clean
Energy InvestmentsD
ollars
($2012)
54
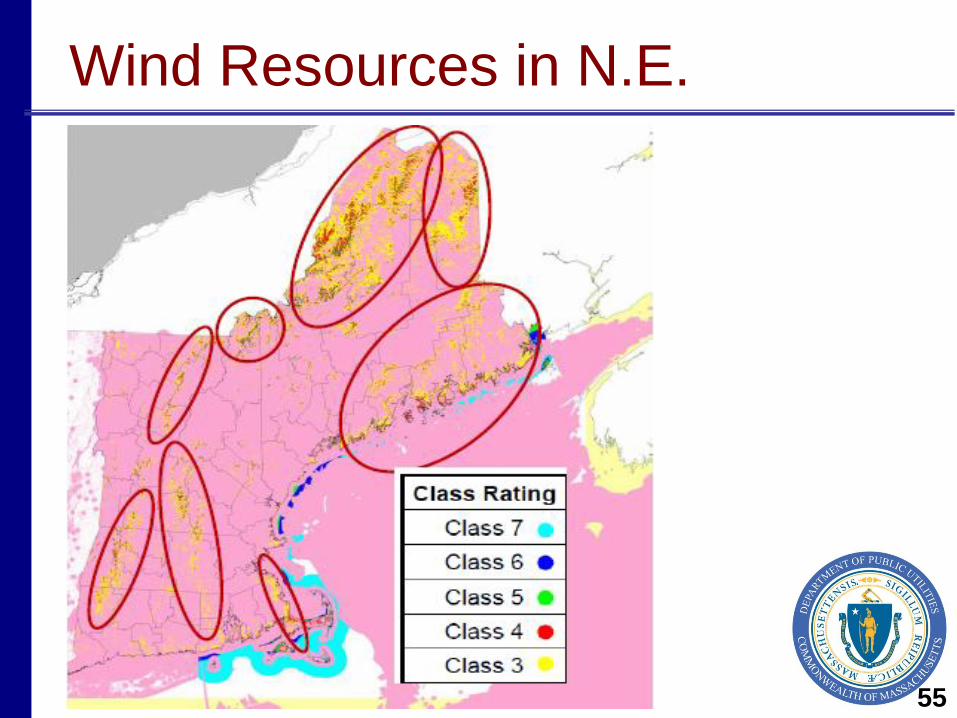
Wind Resources in N.E.
55

Mass. Governor Spearheads the 'Costco' of
Wind Energy DevelopmentA first-of-its-kind program will allow New England states to buy
wind projects in bulk, slashing costs and speeding up
development.http://insideclimatenews.org
New England Governors Plan Massive
Renewable Energy Procurement for
End of 2013At the New England Governors’ Conference (NEGC) on
July 30th, 2012…all six governors signed a resolution
stating their intent to launch a coordinated regional
procurement by the end of 2013.
http://www.solsystemscompany.com/blog/2012/08/20/new-england-governors-plan-massive-
renewable-energy-procurement-for-end-of-2013/
Regional Procurement Opportunities
56
57
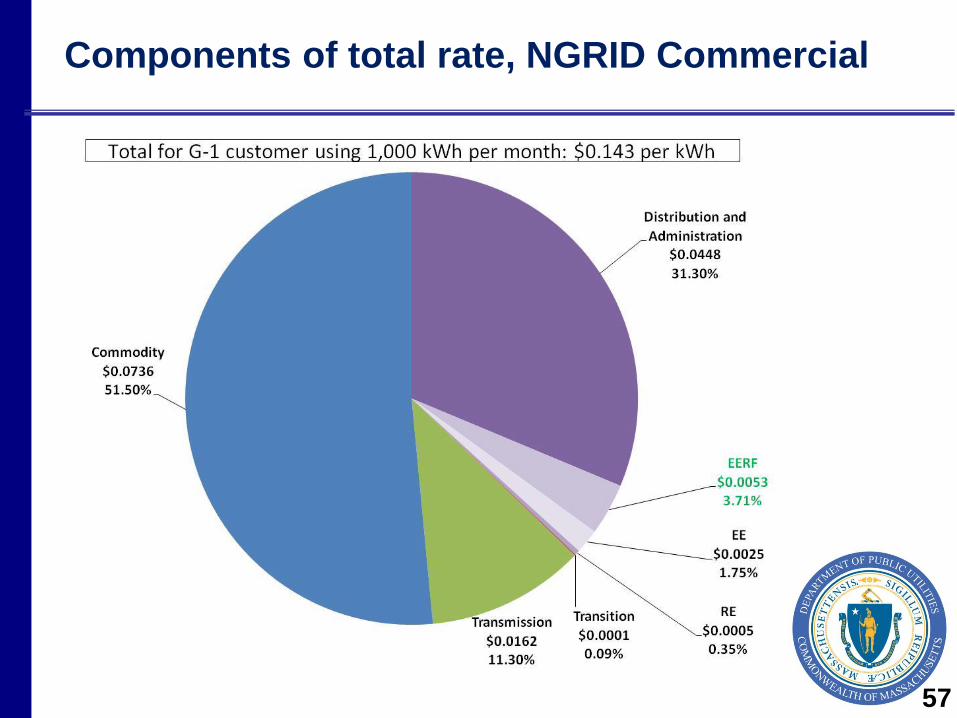
Components of total rate, NGRID Commercial

DPU’s Next Hot Topic
58
Grid Modernization
• Enhancing reliability
• Lowering system costs
• Aligning costs and price
• Giving customers greater control
of energy use
• Preparing for a future of
innovation
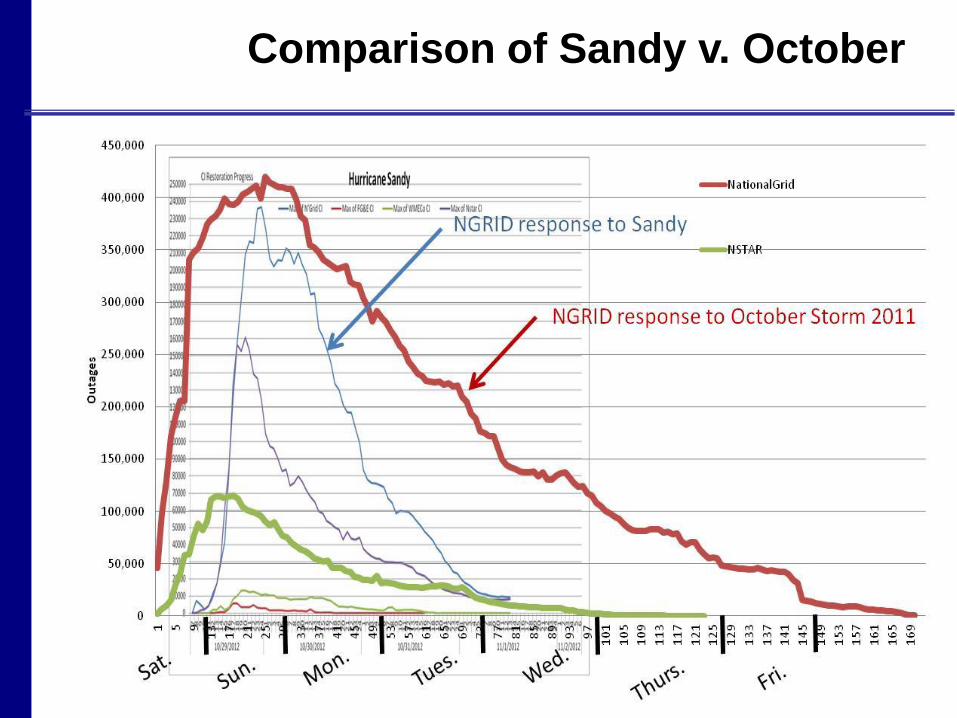
Comparison of Sandy v. October
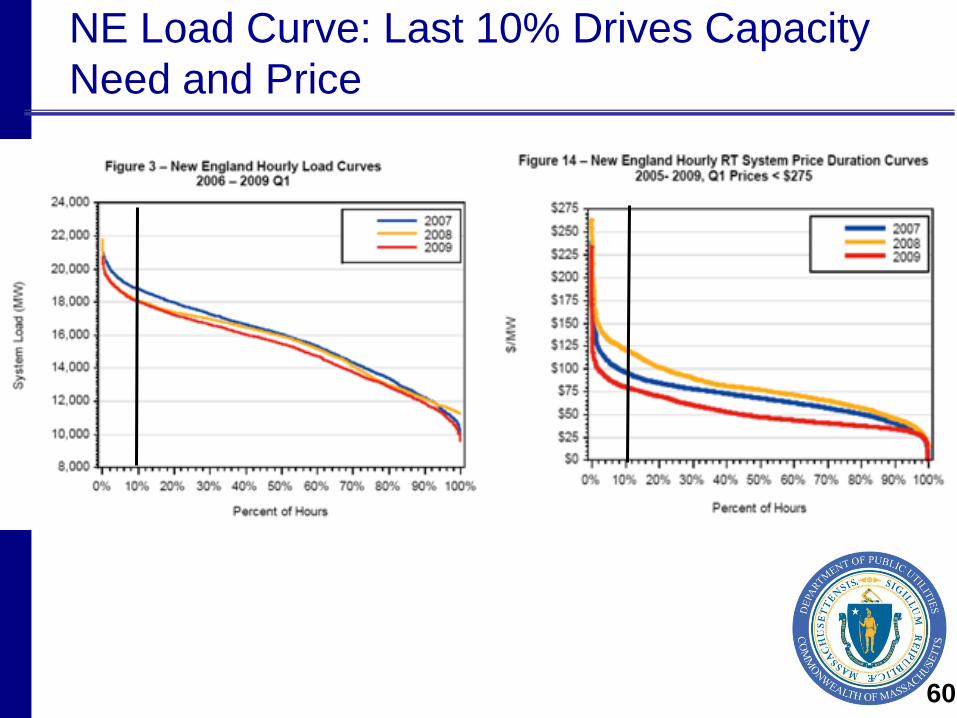
NE Load Curve: Last 10% Drives Capacity
Need and Price
60

Is Price Responsiveness Real
The Brattle Group
The Arc of Price Responsiveness,
Price-Only (n=43), Enabling Technology (n=33), Super Enabling Technology (n=8)
Peak to Off-Peak Price Ratio
Pe
ak
Re
du
cti
on
1 2 3 4 5 6 7 8 9 10 11 12 13 14 15 16
0%
10%
20%
30%
40%
50%
60%
Price-Only
Tech
Super Tech

Grid Modernization Process
6
2
• Kick off meeting – 11/14/2012
• Working Group through June
2013
• Report and Recommendations to
DPU June, 2013
• 2013-2014 DPU Actions
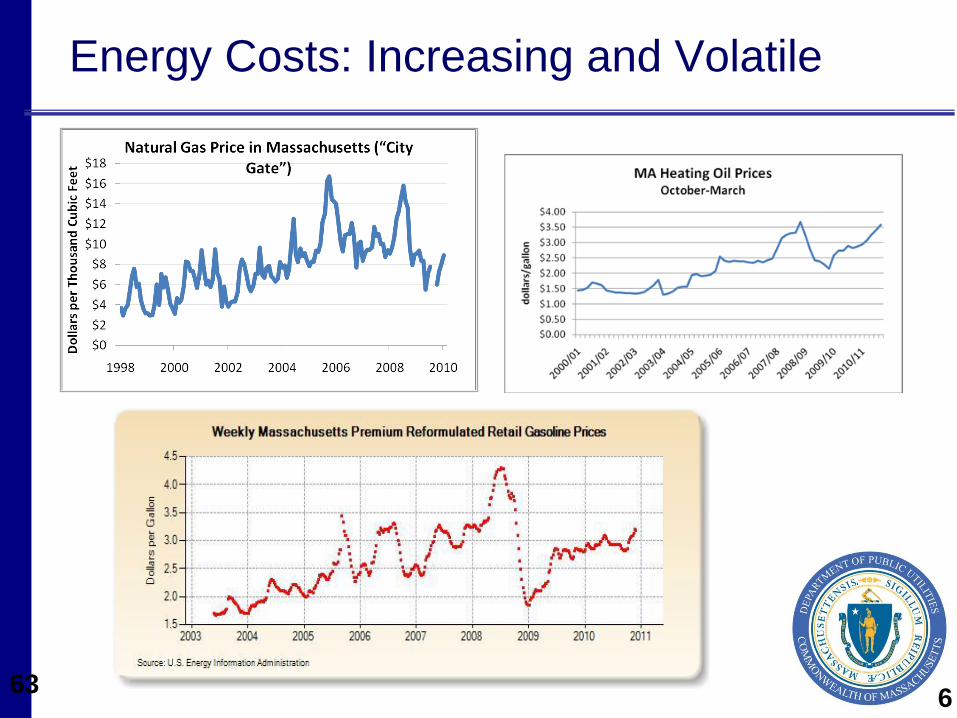
Energy Costs: Increasing and Volatile
636
3