Embed Size (px)
Citation preview
A New Look at Anthropogenic Atmospheric Carbon Dioxide
David Hofmann and Pieter TansNOAA Earth System Research Laboratory
Global Monitoring Annual ConferenceBoulder, Colorado
May 14-15, 2008
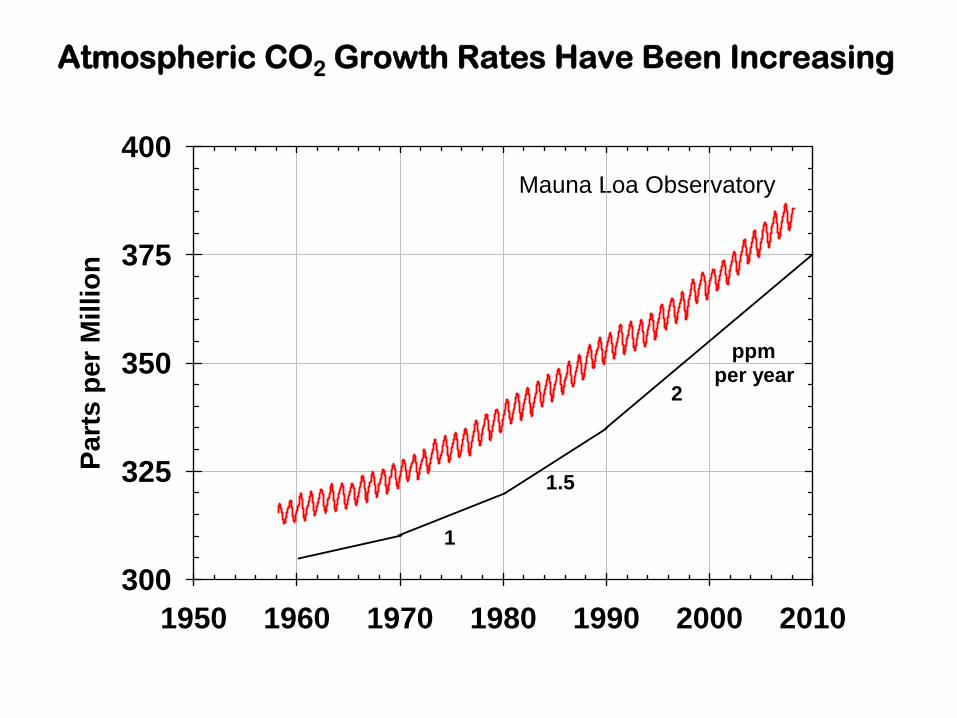
Mauna Loa Observatory
Atmospheric CO2
Growth Rates Have Been Increasing
1950 1960 1970 1980 1990 2000 2010
Part
s pe
r Mill
ion
300
325
350
375
400
1
ppm per year
2
1.5
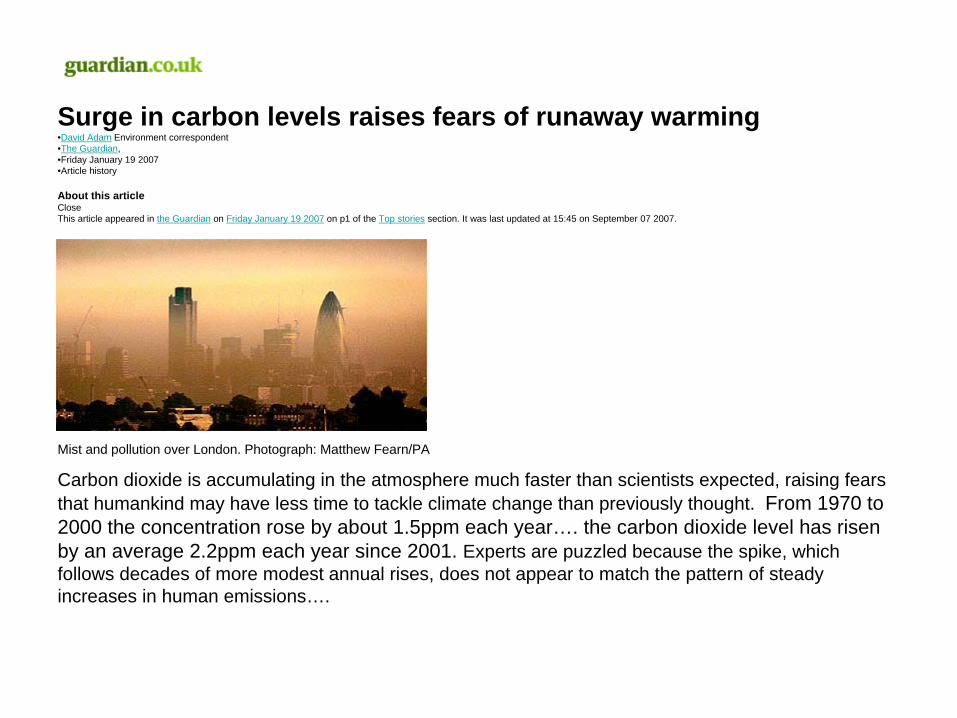
Surge in carbon levels raises fears of runaway warming•David Adam Environment correspondent •The Guardian, •Friday January 19 2007 •Article history
About this articleClose This article appeared in the Guardian on Friday January 19 2007 on p1 of the Top stories section. It was last updated at 15:45 on September 07 2007.
Mist and pollution over London. Photograph: Matthew Fearn/PA
Carbon dioxide is accumulating in the atmosphere much faster than scientists expected, raising fears that humankind may have less time to tackle climate change than previously thought. From 1970 to 2000 the concentration rose by about 1.5ppm each year…. the carbon dioxide level has risen by an average 2.2ppm each year since 2001. Experts are puzzled because the spike, which follows decades of more modest annual rises, does not appear to match the pattern of steady increases in human emissions….

Processing the Mauna Loa and Global CO2 Records:
• Remove the seasonal variation (technique for filtering data to remove the seasonal variation first described by Thoning et al., J. Geophys. Res. 94, 8549-8565, 1989).
• Remove the pre-industrial component. Reduce the CO2 concentration to that which is changing, the anthropogenic component.

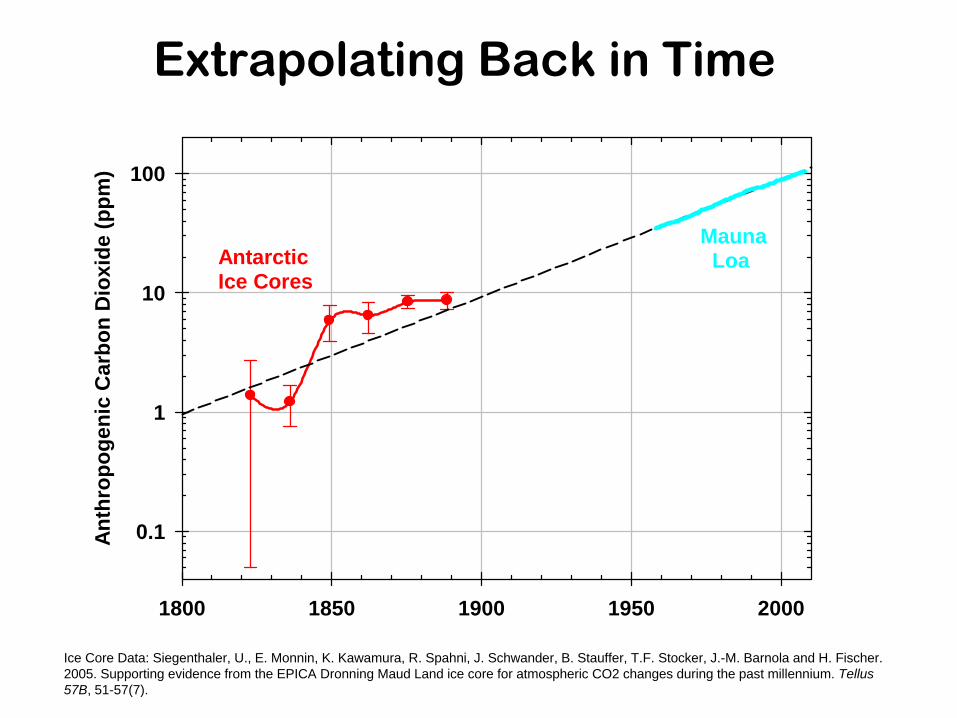
Ice Core Data: Siegenthaler, U., E. Monnin, K. Kawamura, R. Spahni, J. Schwander, B. Stauffer, T.F. Stocker, J.-M. Barnola and H. Fischer. 2005. Supporting evidence from the EPICA Dronning Maud Land ice core for atmospheric CO2 changes during the past millennium. Tellus 57B, 51-57(7).
1000 1200 1400 1600 1800
Car
bon
Dio
xide
(ppm
)
270
275
280
285
290
295
AVERAGE = 280 ± 2 ppm
Antarctic Ice Cores –
Preindustrial Carbon Dioxide
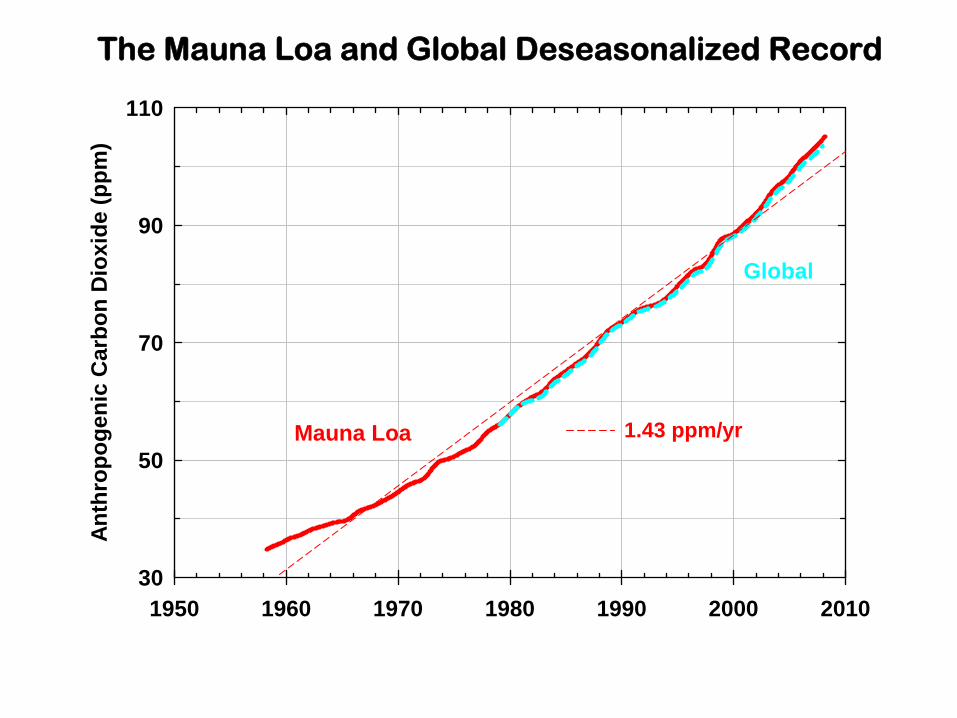
1950 1960 1970 1980 1990 2000 2010
Anth
ropo
geni
c C
arbo
n D
ioxi
de (p
pm)
30
50
70
90
110
Mauna Loa
Global
1.43 ppm/yr
The Mauna Loa and Global Deseasonalized
Record

Semi-logarithmic Presentation of the Data(exponential functions are straight lines)
1950 1960 1970 1980 1990 2000 2010
Anth
ropo
geni
c C
arbo
n D
ioxi
de (p
pm) 100
Mauna Loa
Global
50
30
dC/dt = 0.86[exp ( ln2(YR-1958)/31)] ppm/yr Car
bon
Dio
xide
Gro
wth
Rat
e (p
pm/y
r)
1C = 280 + 34.5[exp ( ln2(YR-1958)/31)] ppm
0.75
2.75
2
τd = 31 yr
dC/dt ~ C ~ e t/τ
Ice Core Data: Siegenthaler, U., E. Monnin, K. Kawamura, R. Spahni, J. Schwander, B. Stauffer, T.F. Stocker, J.-M. Barnola and H. Fischer. 2005. Supporting evidence from the EPICA Dronning Maud Land ice core for atmospheric CO2 changes during the past millennium. Tellus 57B, 51-57(7).
1800 1850 1900 1950 2000
Anth
ropo
geni
c C
arbo
n D
ioxi
de (p
pm)
0.1
1
10
100
Mauna LoaAntarctic
Ice Cores
Extrapolating Back in Time
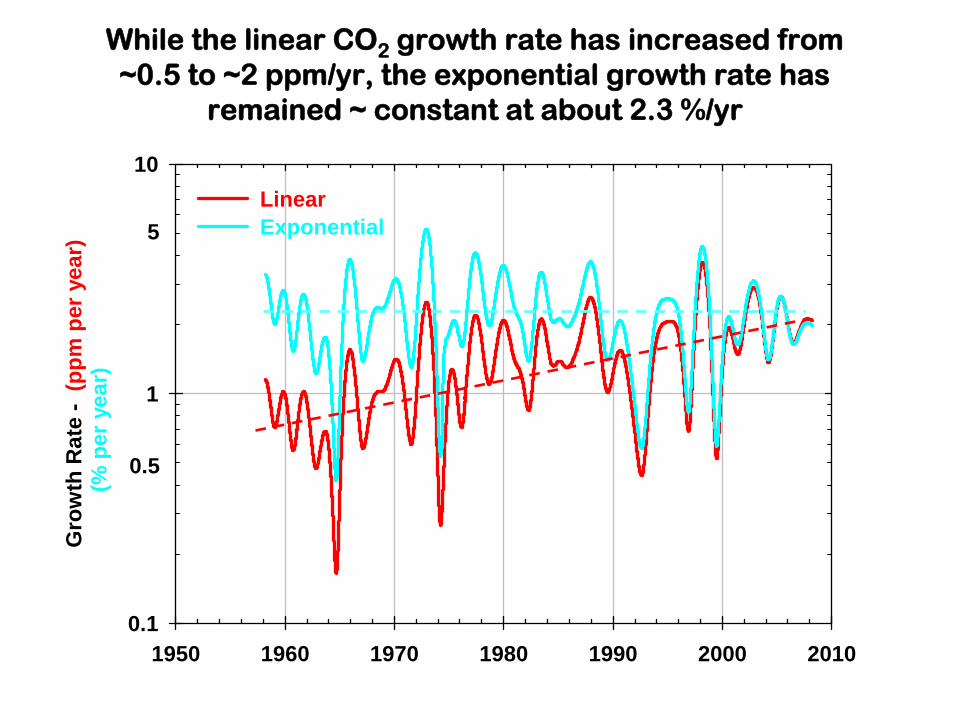
1950 1960 1970 1980 1990 2000 2010
Gro
wth
Rat
e -
(ppm
per
yea
r)
(% p
er y
ear)
0.1
1
10LinearExponential
0.5
5
While the linear CO2
growth rate has increased from ~0.5 to ~2 ppm/yr, the exponential growth rate has
remained ~ constant at about 2.3 %/yr
Anth
ropo
geni
c C
arbo
n D
ioxi
de (p
pm)
30
40
50
60
70
80
90100
1950 1960 1970 1980 1990 2000 2010
Res
idua
l (%
)
-5
0
5
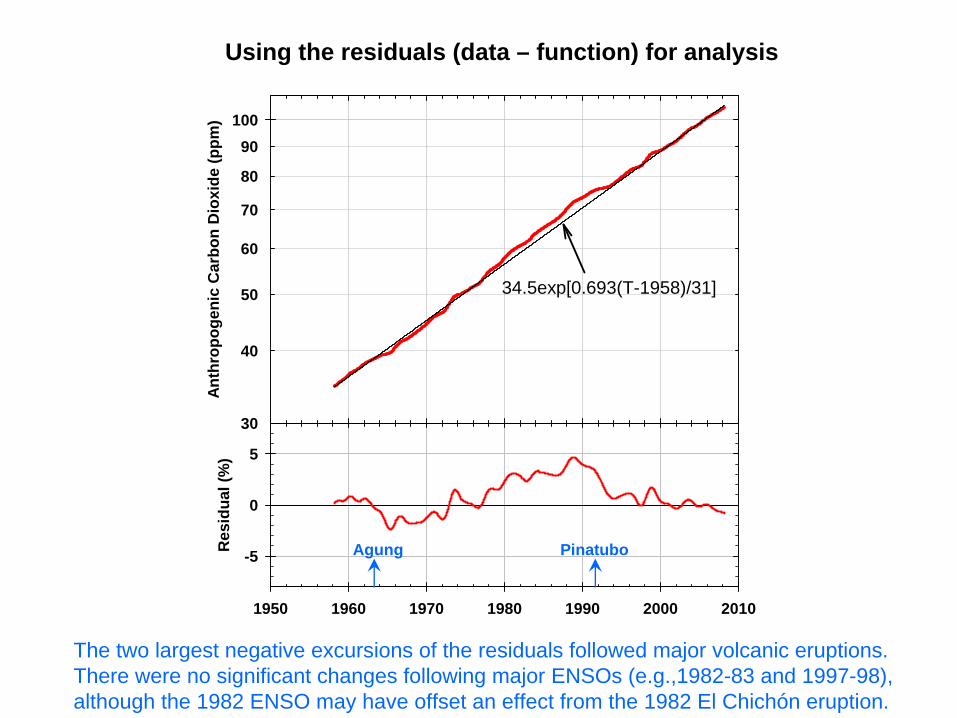
34.5exp[0.693(T-1958)/31]
Using the residuals (data – function) for analysis
Agung Pinatubo
The two largest negative excursions of the residuals followed major volcanic eruptions. There were no significant changes following major ENSOs (e.g.,1982-83 and 1997-98), although the 1982 ENSO may have offset an effect from the 1982 El Chichón eruption.
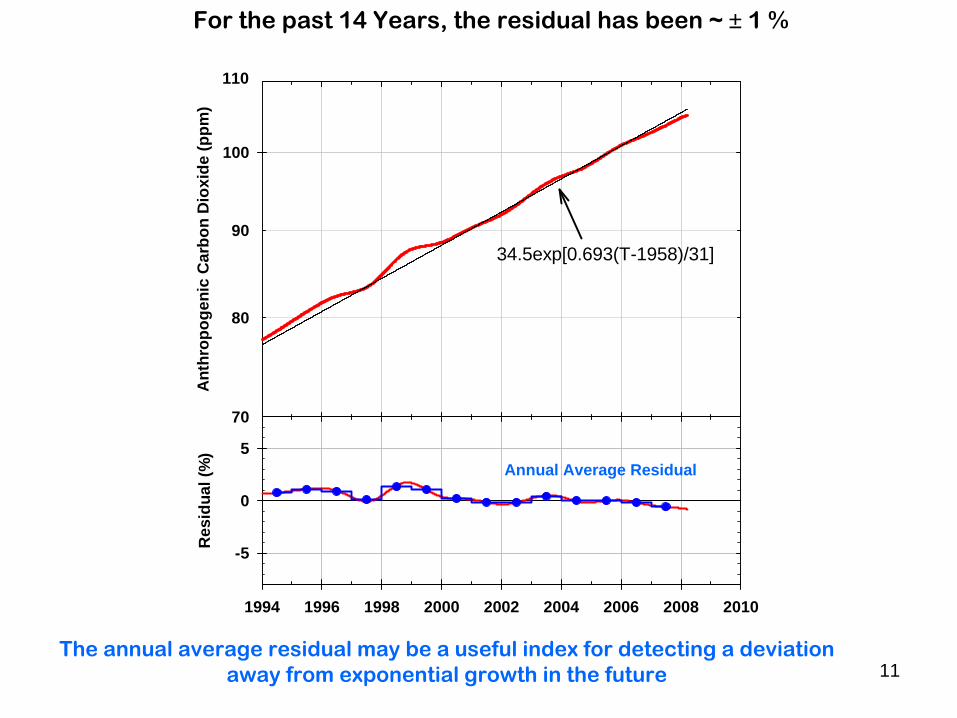
For the past 14 Years, the residual has been ~ ± 1 %
The annual average residual may be a useful index for detecting a deviation away from exponential growth in the future
Ant
hrop
ogen
ic C
arbo
n D
ioxi
de (p
pm)
70
80
90
100
1994 1996 1998 2000 2002 2004 2006 2008 2010
Res
idua
l (%
)
-5
0
5
34.5exp[0.693(T-1958)/31]
110
Annual Average Residual
11
1950 1960 1970 1980 1990 2000 2010
Foss
il Fu
el E
mis
sion
s (b
illio
n to
nnes
CO
2 pe
r yea
r)
GD
P (tr
illio
n U
S do
llars
), Po
pula
tion
(bill
ions
)
10
100
24
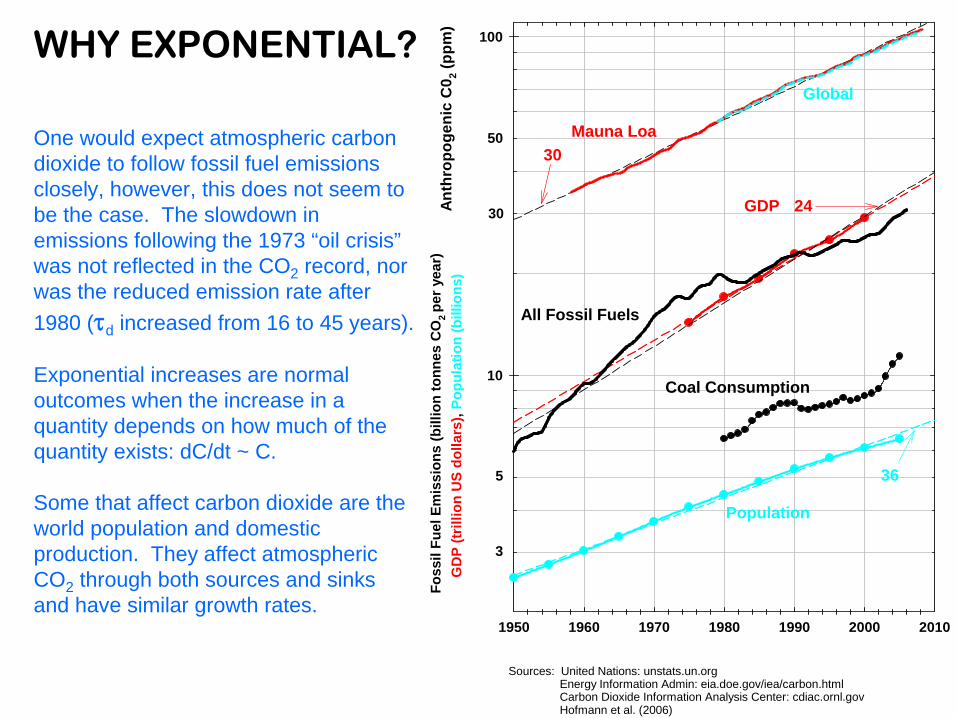
Sources: United Nations: unstats.un.org Energy Information Admin: eia.doe.gov/iea/carbon.html Carbon Dioxide Information Analysis Center: cdiac.ornl.gov Hofmann et al. (2006)
36
3
5
Population
GDP
All Fossil Fuels
Uptake by Oceans and Terretrial Biosphere
Mauna Loa
Global
Coal Consumption
50
30Anth
ropo
geni
c C
0 2 (pp
m)
30
WHY EXPONENTIAL?
One would expect atmospheric carbon dioxide to follow fossil fuel emissions closely, however, this does not seem to be the case. The slowdown in emissions following the 1973 “oil crisis” was not reflected in the CO2 record, nor was the reduced emission rate after 1980 (τd increased from 16 to 45 years).
Exponential increases are normal outcomes when the increase in a quantity depends on how much of the quantity exists: dC/dt ~ C.
Some that affect carbon dioxide are the world population and domestic production. They affect atmospheric CO2 through both sources and sinks and have similar growth rates.
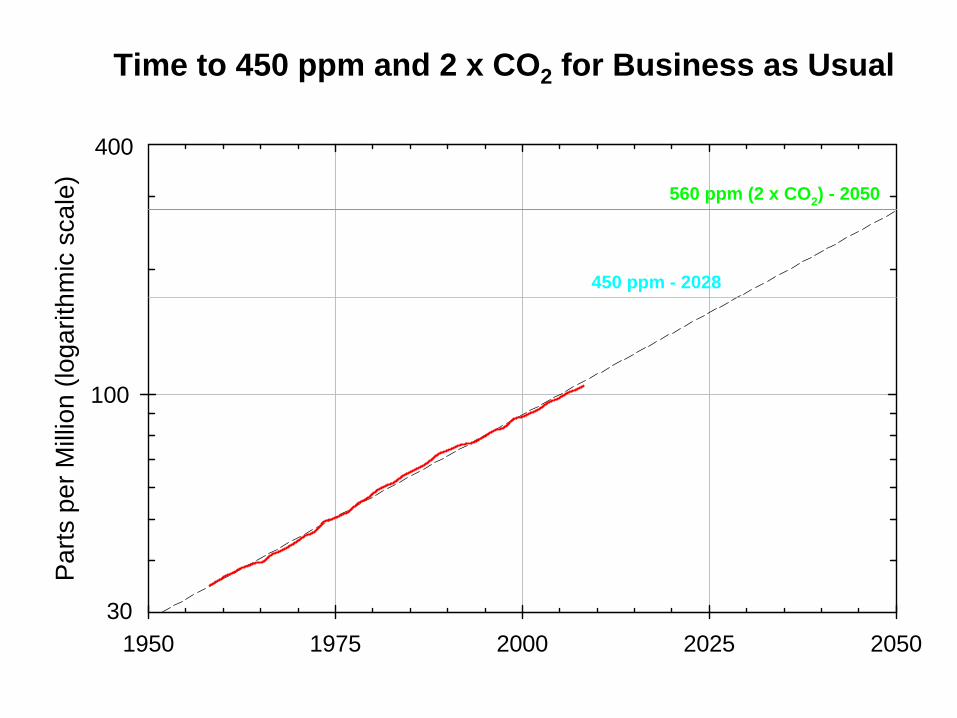
1950 1975 2000 2025 2050
Par
ts p
er M
illio
n (lo
garit
hmic
sca
le)
100
450 ppm - 2028
560 ppm (2 x CO2) - 2050
400
30
Time to 450 ppm and 2 x CO2 for Business as Usual
SUMMARYThe deseasonalized anthropogenic component of atmospheric carbon dioxide has increased exponentially even before atmospheric measurements began. This explains why the linear growth rates have been increasing with time.
The reduction in fossil fuel emissions following the “oil crisis” of 1973 did not appreciably affect the exponential growth in the CO2 level at Mauna Loa, nor has the recent upturn in coal consumption, a lesson for the future. Volcanic eruptions, on the other hand, seem to cause a near instantaneous response, reducing the growth rate.
The exponential behavior of CO2 is expected considering that both Global Domestic Product and population are increasing exponentially with similar rates of growth. For these components, the exponential relation, dC/dt ~ C, is clearly expected (people and wealth beget more people and wealth). It is likely that exponential growth in CO2 will continue until the close tie to GDP and population is broken through alternate energy sources, CO2 sequestration and regulation.
Acknowledgements: Thanks to the ESRL/GMD Carbon Cycle Greenhouse Gases group, in particular Ken Masarie and Kirk Thoning for data analysis.


![Carbon Dioxide Biogenic vs Anthropogenic Sectoral ...reports and estimates. Examples of these are Salt Lake City [3], Houston [4], Paris [5], Los Angeles [6] and Indianapolis (INFLUX;](https://img.pdfslide.us/doc/110x75/60fe10c0a6f95f16ac397d42/carbon-dioxide-biogenic-vs-anthropogenic-sectoral-reports-and-estimates-examples.jpg)