Embed Size (px)
Citation preview
January 25, 2019
A new experimental approach to probeQCD axion dark matter in the massrange above 40µeV
The MADMAX collaboration:P. Brun,h A. Caldwella L. Chevalier,h G. Dvalia P. Freired
E. Garuttic S. Heyminckd J. Jochumg S. Knircka M. Kramerd
C. Kriegerc T. Lasserre,h C. Leea X. Lia A. Lindnerb
B. Majorovitsa S. Martensc M. Matysekc A. Millara,∗ G. Raffelta
J. Redondoe,a O. Reimanna A. Ringwaldb K. Saikawaa
J. Schaffranb A. Schmidtf J. Schutte-Engelc F. Steffena
C. Strandhageng G. Wiechingd
aMax-Planck-Institut fur Physik, Munich, GermanybDeutsches Elektronen Synchrotron, DESY, Hamburg, GermanycUniversity of Hamburg, Hamburg, GermanydMax-Planck-Institut fur Radioastronomie, Bonn, GermanyeDepartamento de Fısica Teorica, University of Zaragoza, SpainfRWTH Aachen, GermanygUniversitat Tubingen, GermanyhCEA-IRFU, Saclay, France∗now at Stockholm University, Sweden
Abstract. The axion emerges in extensions of the Standard Model that explain the absenceof CP violation in the strong interactions. Simultaneously, it can provide naturally the colddark matter in our universe. Several searches for axions and axion-like particles (ALPs) haveconstrained the corresponding parameter space over the last decades but no unambiguous hintsof their existence have been found. The axion mass range below 1 meV remains highly attractiveand a well motivated region for dark matter axions. In this White Paper we present a descriptionof a new experiment based on the concept of a dielectric haloscope for the direct search of darkmatter axions in the mass range of 40 to 400µeV. This MAgnetized Disk and Mirror AxioneXperiment (MADMAX) will consist of several parallel dielectric disks, which are placed in astrong magnetic field and with adjustable separations. This setting is expected to allow foran observable emission of axion induced electromagnetic waves at a frequency between 10 to100 GHz corresponding to the axion mass.
arX
iv:1
901.
0740
1v2
[ph
ysic
s.in
s-de
t] 2
4 Ja
n 20
19
Contents
1 Introduction 1
2 Theoretical motivation 2
2.1 Strong CP problem 2
2.2 Axions 3
2.3 Landscape and constraints 3
2.4 Axion dark matter 4
3 Foundations of the experimental approach 6
4 Proposed experimental setup for the search of dark matter axions 8
4.1 Design sensitivity and constraints from technology 8
4.2 The receiver 9
4.3 The magnet 10
4.4 The booster 11
4.5 Expected sensitivity and measurement strategy 13
5 Proof of principle measurements with first test setup 15
5.1 The proof of principle detection system 16
5.2 The proof of principle booster 16
6 Towards realization of MADMAX 19
6.1 Prototype 19
6.2 Experimental site 20
6.3 Timeline 20
7 Conclusions 21
8 Acknowledgments 21
1 Introduction
Axions are hypothetical low-mass bosons predicted by the Peccei–Quinn (PQ) mechanism, whichexplains the absence of CP-violating effects in quantum chromodynamics (QCD) [1–4]. Axionscould also provide the cold dark matter (DM) of the universe [5–7] and as such are among thefew particle candidates that simultaneously resolve two major problems in physics.
Assuming axions make up most of the DM in the universe, their mass ma is expected to be lessthan ∼meV (cf. [8, 9] and references therein). Mass values higher than ∼ 20 meV are excludeddue to astrophysical constraints, see [10] for a review and [11–13] for updates and descriptions of
– 1 –
recent anomalies. The existing experimental efforts for DM axion searches focus on an ma rangebelow ∼ 40µeV. This is motivated by the realignment mechanism of the axion field providingthe right amount of DM in scenarios in which the PQ symmetry is broken before inflation andnever restored thereafter. Among these experimental efforts are microwave cavity searches [14]such as ADMX [15, 16], ORGAN [17], HAYSTAC [18–20] or CULTASK [21], which have begunto probe part of the axion parameter space.
In scenarios in which the PQ symmetry is broken after inflation, the realignment mechanismnow along with decaying topological defects provides a cold DM axion density that matches theobserved value if the axion mass ma is of the order of 100µeV [22–27]. One recent attempt toimprove the numerical simulations points to a more concrete mass value of ma ∼ 26µeV [28]but still faces large theoretical uncertainties [29].
We propose to search for QCD axion DM in the mass range around 100 µeV, using a dielectrichaloscope [30]. This concept makes use of the “dish antenna” idea [31] and of additional signalenhancements possible by having multiple dielectric layers [32]. The proposed MAgnetized Diskand Mirror Axion eXperiment (MADMAX) will consist of a mirror and about 100 dielectricdisks each about 1 m2 large with adjustable separations placed inside a homogeneous 10 Tstrong magnetic dipole field.
This White Paper gives a summary of the principles upon which dielectric haloscopes arebased, followed by a description of the first baseline design that could be used for the search ofaxions with mass in the range of 40 to 400µeV. The results of measurements at a test setupare presented, which lead us to the conclusion that it should be realistic to build an experimentthat can cover a large fraction of the parameter space including the unexplored one predictedfor DM axions in the post inflationary PQ symmetry breaking scenario.
2 Theoretical motivation
2.1 Strong CP problem
In the standard model (SM) of particle physics, violation of CP in the strong interactions iscontrolled by just one parameter, the θ angle. This angle appears as the sum of two contributionswith a-priori unrelated origins: the angle defining the vacuum of QCD, θQCD, and the commonphase of the quark mass matrix, Arg DetMq, related to the Yukawa couplings of the Higgssector. Observable effects derive only from this combination. When we redefine quark fields tomake their masses real, the phase appears as the coupling constant of the topological chargedensity operator of QCD, i.e., the SM Lagrangian contains a term
αs8πθ Gµνa Gµνa ≡
αs2πθEa ·Ba (2.1)
which violates parity, time-reversal and thus CP. In (2.1) Gµνa denotes the QCD field-strength
tensor with Gµνa ≡ 12εµναβGαβa being its dual, color index a = 1, ..., 8, and Ea and Ba the
illustrative chromo electric and chromo magnetic fields, respectively. Non-zero values of θ implyCP violating observables such as nuclear electric dipole moments but none of these effects havebeen observed to date. As a key example, the electric dipole of the neutron is predicted tobe dn = 2.4 × 10⁻¹⁶θe cm [33] but the most recent experiment [34] concluded that |dn| <2.9×10⁻²⁶e cm, so θ must be extremely tiny, θ < 1.3×10⁻¹⁰. This is an amazingly small upperlimit, especially if we consider that the only other CP violating phase in the SM, the CKM angleδ13 = 1.2± 0.08, is not particularly small and also comes from the quark mass matrix. Indeed,
– 2 –
the smallness of CP violation gives us a hint that some dynamical mechanism could be at workto suppress the effects of the θ term in equation (2.1).
2.2 Axions
In the year 1977 Peccei and Quinn proposed a mechanism to solve the strong CP problem, oftenconsidered to be the most elegant to date [1, 2]. The vacuum energy density of QCD depends onθ, i.e., VQCD = VQCD(θ), and its absolute minimum lies1 at θ = 0 [36], which is CP conserving.If θ is interpreted to be a dynamical field, VQCD(θ) becomes the potential energy of that fieldso that the expectation value 〈θ〉 will be dynamically driven to zero, explaining the absence ofCP violation.
This mechanism relies on a global U(1)PQ symmetry that breaks spontaneously at the PQscale fa. A model-independent consequence is that excitations of θ(x) around the minimum ofthe potential represent a new particle, the axion [3, 4]. The dynamical θ(x) field needs a kineticterm f2a (∂µθ)(∂
µθ)/2. The axion field is the canonically normalized version of θ, a(x) = θ(x)fa.Values of fa . 108 GeV are excluded experimentally and astrophysically, so the axion offers awindow to discover physics at ultra-high energies not testable by current accelerator techniques.
The cancellation of 〈θ〉 is dynamical, leading to residual oscillations of θ around the minimum,which are expected for generic initial conditions. As the age of the universe is finite, theseoscillations are quasi-classical field oscillations that could constitute today’s cold DM referredto at the realignment mechanism [5–7].
The axion mass is given by
ma = 5.70(6)(4)µeV
(1012 GeV
fa
), (2.2)
where the numbers in brackets denote the uncertainty in the last digit, dominated by theuncertainty in the up-down quark mass ratio (first bracket) and higher order effects (secondbracket) [37]. The interaction of the axion with electric fields E and magnetic fields B is givenby the Lagrangian density
Laγ =α
2πCaγ
a
faE ·B with Caγ = 1.92(4)− E
N, (2.3)
the fine structure constant α, and the model-dependent ratio of the electromagnetic and colouranomalies E/N of the PQ symmetry. Again the number in brackets refers to the uncertainty inthe last digit [37]. These numbers are quoted as recently obtained at NLO in chiral perturbationtheory [37]. The topological susceptibility entering in equation (2.2) has also been calculatedfrom first principles exploiting lattice QCD, with a similar uncertainty (see reference [26]). Oneshould however note that Caγ might vary by up to two orders of magnitude in somewhat moreexotic axion models [38, 39].
2.3 Landscape and constraints
The constraints on axion models are usually quoted on a specific coupling, e.g., Caγ as a functionof ma. A broad picture is shown in figure 1. A combination of stellar evolution and cosmo-logical arguments together with experimental searches rule out axions with fa < 3 × 10⁸ GeV
1Strictly speaking, this would only happen if δ13 = 0 but CP violation is transmitted by quantum correctionsto the QCD sector and the minimum gets shifted from θ = 0 by a small amount. See [35] for a review.
– 3 –
���-�� / ��� / ���
������������ �������� ��
���������������� (��γ)(��� )
����� ������ (���)
����� �������� ��� (��γ)(���)
���� ���� �������������
����
������
��������������� �������
������ �����������
�����������-��
������������-��
��-� ��-� ��-� ��-� ��-� ��-� ��-� � �� ��� ��� ��� ��� ���
���� ���� ���� ���� ���� ��� ��� ��� ��� ��� ��� ��� ��� ���
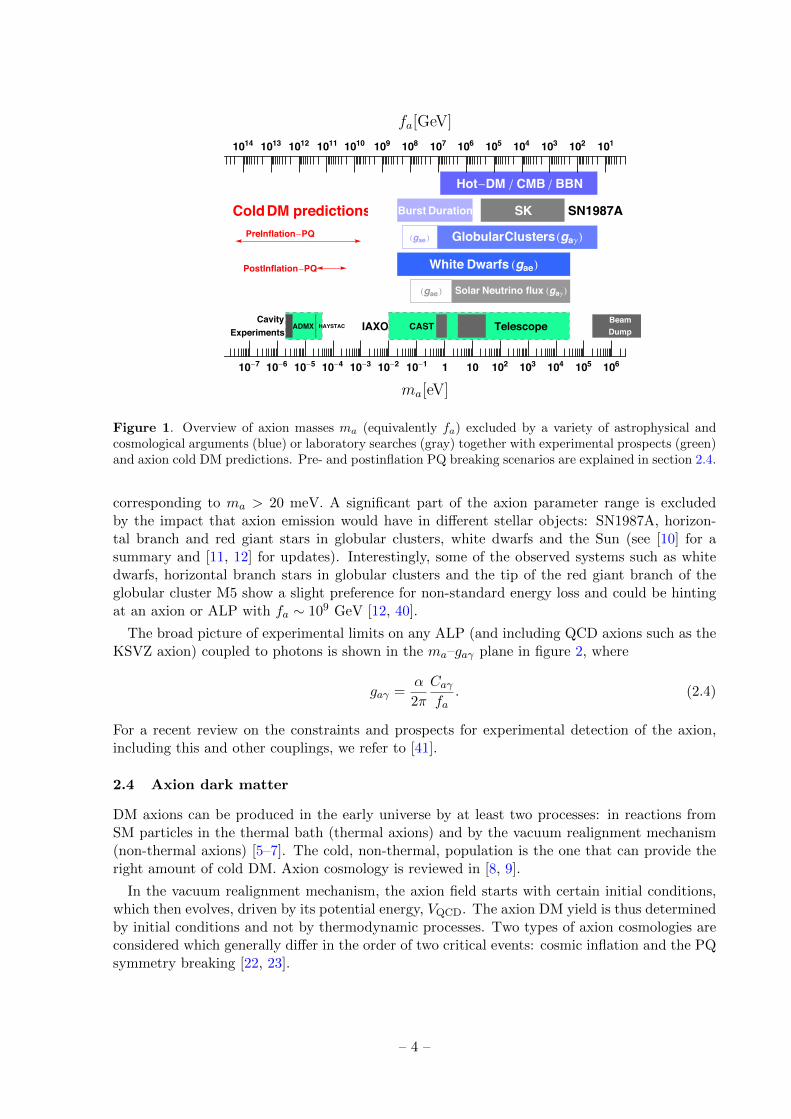
Figure 1. Overview of axion masses ma (equivalently fa) excluded by a variety of astrophysical andcosmological arguments (blue) or laboratory searches (gray) together with experimental prospects (green)and axion cold DM predictions. Pre- and postinflation PQ breaking scenarios are explained in section 2.4.
corresponding to ma > 20 meV. A significant part of the axion parameter range is excludedby the impact that axion emission would have in different stellar objects: SN1987A, horizon-tal branch and red giant stars in globular clusters, white dwarfs and the Sun (see [10] for asummary and [11, 12] for updates). Interestingly, some of the observed systems such as whitedwarfs, horizontal branch stars in globular clusters and the tip of the red giant branch of theglobular cluster M5 show a slight preference for non-standard energy loss and could be hintingat an axion or ALP with fa ∼ 109 GeV [12, 40].
The broad picture of experimental limits on any ALP (and including QCD axions such as theKSVZ axion) coupled to photons is shown in the ma–gaγ plane in figure 2, where
gaγ =α
2π
Caγfa
. (2.4)
For a recent review on the constraints and prospects for experimental detection of the axion,including this and other couplings, we refer to [41].
2.4 Axion dark matter
DM axions can be produced in the early universe by at least two processes: in reactions fromSM particles in the thermal bath (thermal axions) and by the vacuum realignment mechanism(non-thermal axions) [5–7]. The cold, non-thermal, population is the one that can provide theright amount of cold DM. Axion cosmology is reviewed in [8, 9].
In the vacuum realignment mechanism, the axion field starts with certain initial conditions,which then evolves, driven by its potential energy, VQCD. The axion DM yield is thus determinedby initial conditions and not by thermodynamic processes. Two types of axion cosmologies areconsidered which generally differ in the order of two critical events: cosmic inflation and the PQsymmetry breaking [22, 23].
– 4 –
�������
�� γ-�����
����� ����
���
���
�-����
����������
���
����
������ ������ ���
����
���������
���
Υ(��)
����
����
��� �/�γ
���
���
�����
����-�� ����
����
��/�
��
�������
������
�����������
-�� -� � � ��
-��
-��
-�
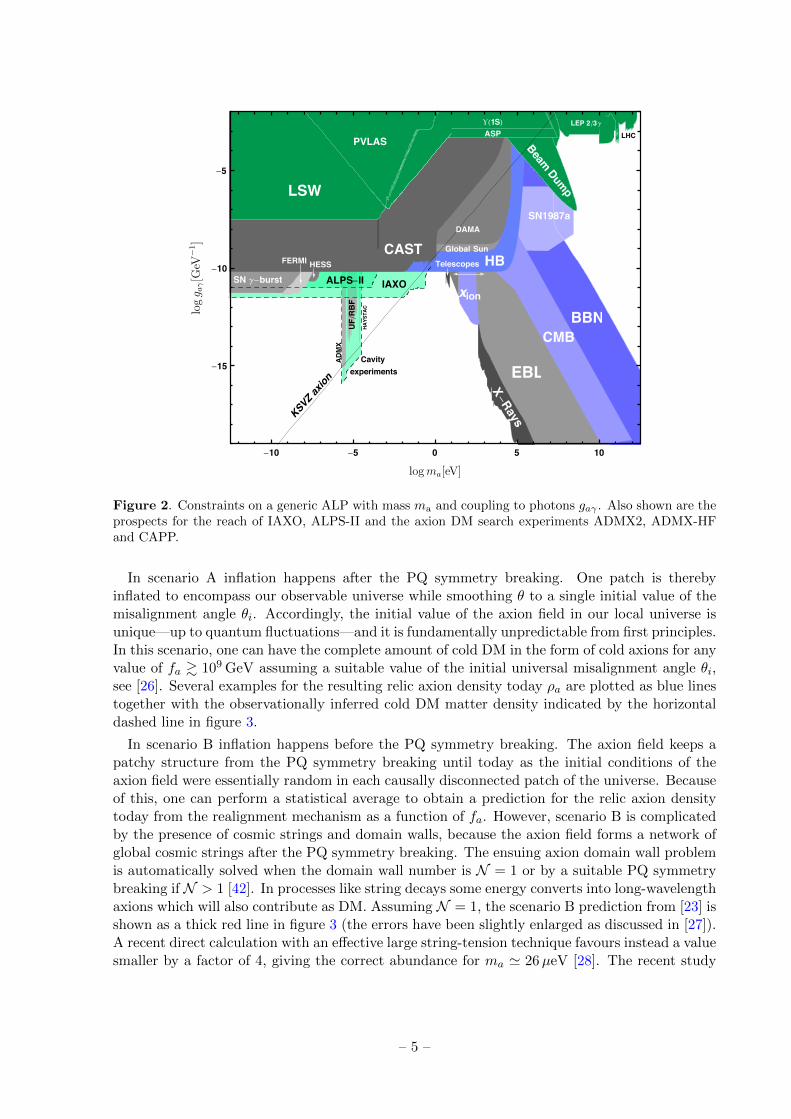
Figure 2. Constraints on a generic ALP with mass ma and coupling to photons gaγ . Also shown are theprospects for the reach of IAXO, ALPS-II and the axion DM search experiments ADMX2, ADMX-HFand CAPP.
In scenario A inflation happens after the PQ symmetry breaking. One patch is therebyinflated to encompass our observable universe while smoothing θ to a single initial value of themisalignment angle θi. Accordingly, the initial value of the axion field in our local universe isunique—up to quantum fluctuations—and it is fundamentally unpredictable from first principles.In this scenario, one can have the complete amount of cold DM in the form of cold axions for anyvalue of fa & 109 GeV assuming a suitable value of the initial universal misalignment angle θi,see [26]. Several examples for the resulting relic axion density today ρa are plotted as blue linestogether with the observationally inferred cold DM matter density indicated by the horizontaldashed line in figure 3.
In scenario B inflation happens before the PQ symmetry breaking. The axion field keeps apatchy structure from the PQ symmetry breaking until today as the initial conditions of theaxion field were essentially random in each causally disconnected patch of the universe. Becauseof this, one can perform a statistical average to obtain a prediction for the relic axion densitytoday from the realignment mechanism as a function of fa. However, scenario B is complicatedby the presence of cosmic strings and domain walls, because the axion field forms a network ofglobal cosmic strings after the PQ symmetry breaking. The ensuing axion domain wall problemis automatically solved when the domain wall number is N = 1 or by a suitable PQ symmetrybreaking if N > 1 [42]. In processes like string decays some energy converts into long-wavelengthaxions which will also contribute as DM. Assuming N = 1, the scenario B prediction from [23] isshown as a thick red line in figure 3 (the errors have been slightly enlarged as discussed in [27]).A recent direct calculation with an effective large string-tension technique favours instead a valuesmaller by a factor of 4, giving the correct abundance for ma ' 26µeV [28]. The recent study
– 5 –
Obs. DM density
Scenario A
θi =1
θi =0.1
θi =0.01
ScenarioB
Thermalaxions
��-� ��-� ��-� ��-� ��-� ��-� ��-� ��-� � �� ���
��-�
��-�
��-�
��-�
��-�
�
��
���� ���� ���� ���� ���� ��� ��� ��� ��� ���
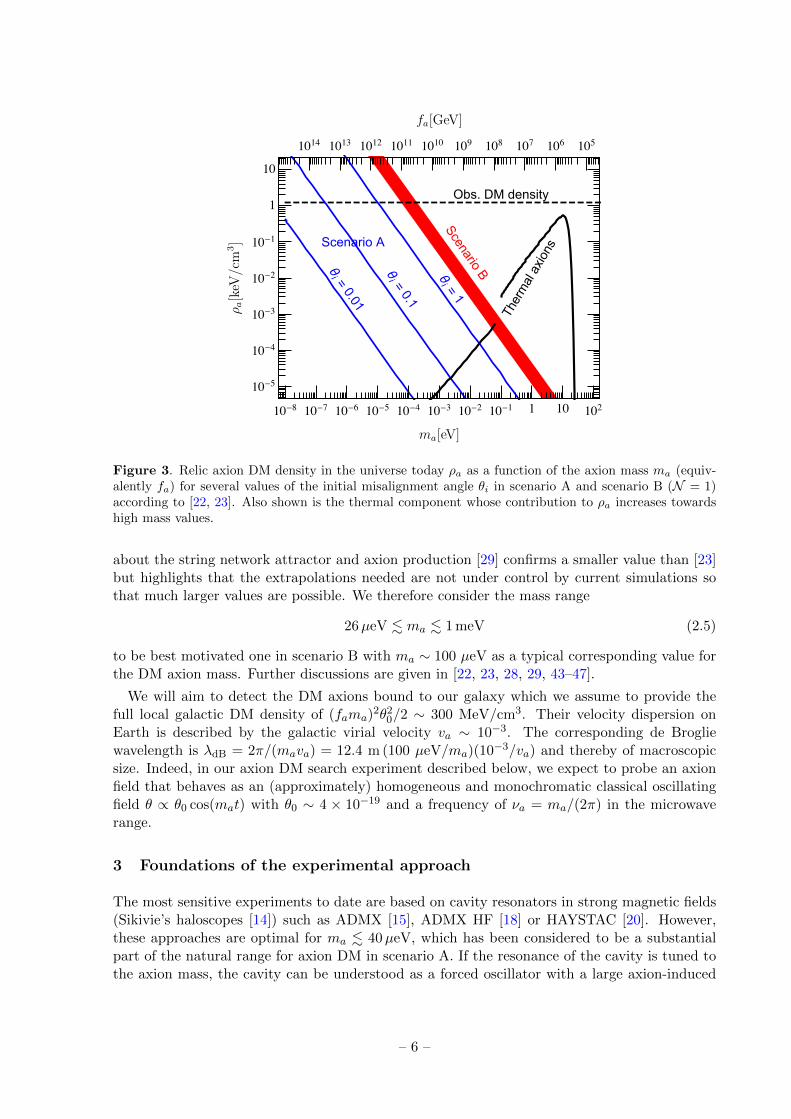
Figure 3. Relic axion DM density in the universe today ρa as a function of the axion mass ma (equiv-alently fa) for several values of the initial misalignment angle θi in scenario A and scenario B (N = 1)according to [22, 23]. Also shown is the thermal component whose contribution to ρa increases towardshigh mass values.
about the string network attractor and axion production [29] confirms a smaller value than [23]but highlights that the extrapolations needed are not under control by current simulations sothat much larger values are possible. We therefore consider the mass range
26µeV . ma . 1 meV (2.5)
to be best motivated one in scenario B with ma ∼ 100 µeV as a typical corresponding value forthe DM axion mass. Further discussions are given in [22, 23, 28, 29, 43–47].
We will aim to detect the DM axions bound to our galaxy which we assume to provide thefull local galactic DM density of (fama)
2θ20/2 ∼ 300 MeV/cm3. Their velocity dispersion onEarth is described by the galactic virial velocity va ∼ 10−3. The corresponding de Brogliewavelength is λdB = 2π/(mava) = 12.4 m (100 µeV/ma)(10−3/va) and thereby of macroscopicsize. Indeed, in our axion DM search experiment described below, we expect to probe an axionfield that behaves as an (approximately) homogeneous and monochromatic classical oscillatingfield θ ∝ θ0 cos(mat) with θ0 ∼ 4 × 10⁻¹⁹ and a frequency of νa = ma/(2π) in the microwaverange.
3 Foundations of the experimental approach
The most sensitive experiments to date are based on cavity resonators in strong magnetic fields(Sikivie’s haloscopes [14]) such as ADMX [15], ADMX HF [18] or HAYSTAC [20]. However,these approaches are optimal for ma . 40µeV, which has been considered to be a substantialpart of the natural range for axion DM in scenario A. If the resonance of the cavity is tuned tothe axion mass, the cavity can be understood as a forced oscillator with a large axion-induced
– 6 –
Mirror Dielectric Disks Receiver
Be
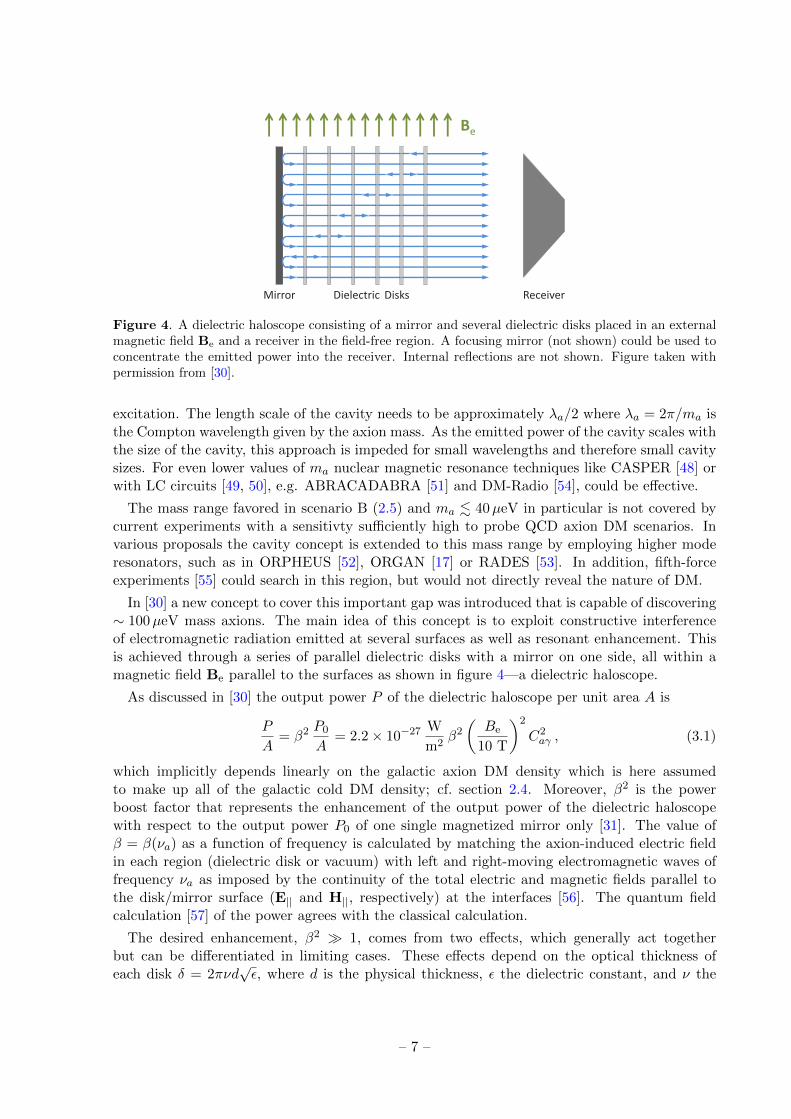
Figure 4. A dielectric haloscope consisting of a mirror and several dielectric disks placed in an externalmagnetic field Be and a receiver in the field-free region. A focusing mirror (not shown) could be used toconcentrate the emitted power into the receiver. Internal reflections are not shown. Figure taken withpermission from [30].
excitation. The length scale of the cavity needs to be approximately λa/2 where λa = 2π/ma isthe Compton wavelength given by the axion mass. As the emitted power of the cavity scales withthe size of the cavity, this approach is impeded for small wavelengths and therefore small cavitysizes. For even lower values of ma nuclear magnetic resonance techniques like CASPER [48] orwith LC circuits [49, 50], e.g. ABRACADABRA [51] and DM-Radio [54], could be effective.
The mass range favored in scenario B (2.5) and ma . 40µeV in particular is not covered bycurrent experiments with a sensitivty sufficiently high to probe QCD axion DM scenarios. Invarious proposals the cavity concept is extended to this mass range by employing higher moderesonators, such as in ORPHEUS [52], ORGAN [17] or RADES [53]. In addition, fifth-forceexperiments [55] could search in this region, but would not directly reveal the nature of DM.
In [30] a new concept to cover this important gap was introduced that is capable of discovering∼ 100µeV mass axions. The main idea of this concept is to exploit constructive interferenceof electromagnetic radiation emitted at several surfaces as well as resonant enhancement. Thisis achieved through a series of parallel dielectric disks with a mirror on one side, all within amagnetic field Be parallel to the surfaces as shown in figure 4—a dielectric haloscope.
As discussed in [30] the output power P of the dielectric haloscope per unit area A is
P
A= β2
P0
A= 2.2× 10⁻²⁷
W
m2β2(Be
10 T
)2
C2aγ , (3.1)
which implicitly depends linearly on the galactic axion DM density which is here assumedto make up all of the galactic cold DM density; cf. section 2.4. Moreover, β2 is the powerboost factor that represents the enhancement of the output power of the dielectric haloscopewith respect to the output power P0 of one single magnetized mirror only [31]. The value ofβ = β(νa) as a function of frequency is calculated by matching the axion-induced electric fieldin each region (dielectric disk or vacuum) with left and right-moving electromagnetic waves offrequency νa as imposed by the continuity of the total electric and magnetic fields parallel tothe disk/mirror surface (E|| and H||, respectively) at the interfaces [56]. The quantum fieldcalculation [57] of the power agrees with the classical calculation.
The desired enhancement, β2 � 1, comes from two effects, which generally act togetherbut can be differentiated in limiting cases. These effects depend on the optical thickness ofeach disk δ = 2πνd
√ε, where d is the physical thickness, ε the dielectric constant, and ν the
– 7 –
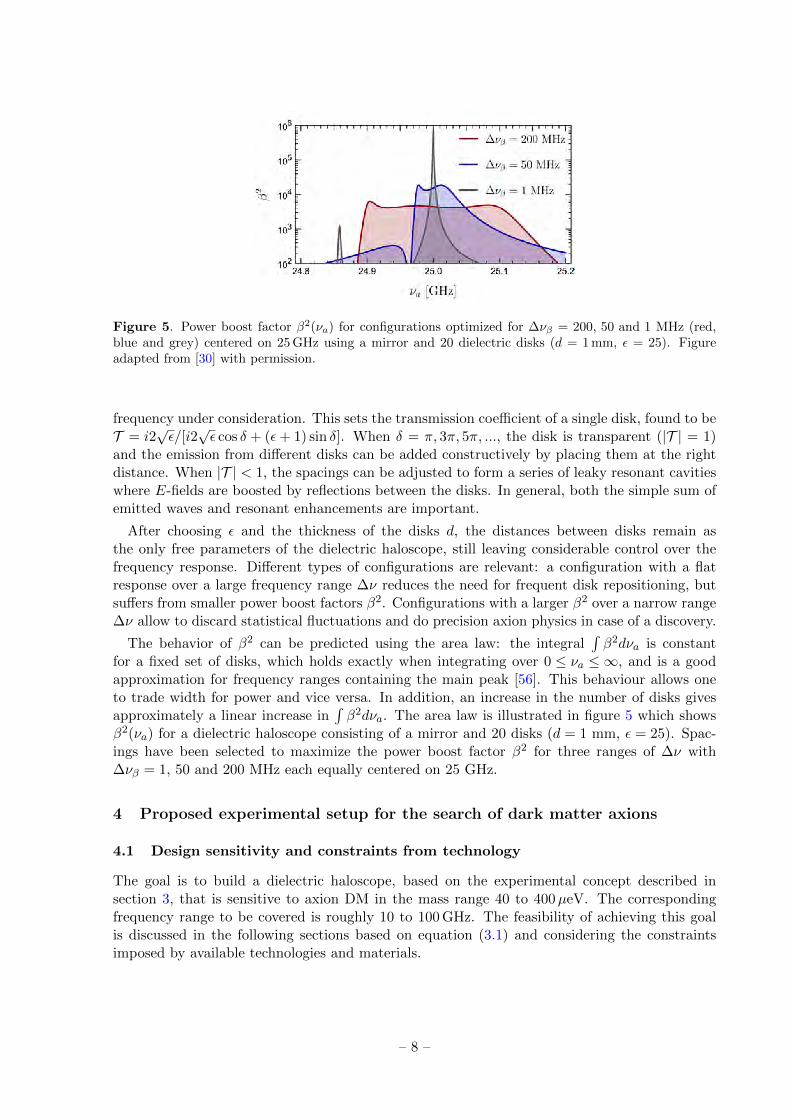
Figure 5. Power boost factor β2(νa) for configurations optimized for ∆νβ = 200, 50 and 1 MHz (red,blue and grey) centered on 25 GHz using a mirror and 20 dielectric disks (d = 1 mm, ε = 25). Figureadapted from [30] with permission.
frequency under consideration. This sets the transmission coefficient of a single disk, found to beT = i2
√ε/[i2
√ε cos δ + (ε+ 1) sin δ]. When δ = π, 3π, 5π, ..., the disk is transparent (|T | = 1)
and the emission from different disks can be added constructively by placing them at the rightdistance. When |T | < 1, the spacings can be adjusted to form a series of leaky resonant cavitieswhere E-fields are boosted by reflections between the disks. In general, both the simple sum ofemitted waves and resonant enhancements are important.
After choosing ε and the thickness of the disks d, the distances between disks remain asthe only free parameters of the dielectric haloscope, still leaving considerable control over thefrequency response. Different types of configurations are relevant: a configuration with a flatresponse over a large frequency range ∆ν reduces the need for frequent disk repositioning, butsuffers from smaller power boost factors β2. Configurations with a larger β2 over a narrow range∆ν allow to discard statistical fluctuations and do precision axion physics in case of a discovery.
The behavior of β2 can be predicted using the area law: the integral∫β2dνa is constant
for a fixed set of disks, which holds exactly when integrating over 0 ≤ νa ≤ ∞, and is a goodapproximation for frequency ranges containing the main peak [56]. This behaviour allows oneto trade width for power and vice versa. In addition, an increase in the number of disks givesapproximately a linear increase in
∫β2dνa. The area law is illustrated in figure 5 which shows
β2(νa) for a dielectric haloscope consisting of a mirror and 20 disks (d = 1 mm, ε = 25). Spac-ings have been selected to maximize the power boost factor β2 for three ranges of ∆ν with∆νβ = 1, 50 and 200 MHz each equally centered on 25 GHz.
4 Proposed experimental setup for the search of dark matter axions
4.1 Design sensitivity and constraints from technology
The goal is to build a dielectric haloscope, based on the experimental concept described insection 3, that is sensitive to axion DM in the mass range 40 to 400µeV. The correspondingfrequency range to be covered is roughly 10 to 100 GHz. The feasibility of achieving this goalis discussed in the following sections based on equation (3.1) and considering the constraintsimposed by available technologies and materials.
– 8 –
G
LO
Signal analyzer
Local oscillator
FFTRF IF
LO Bandpass
Mixer
Signal
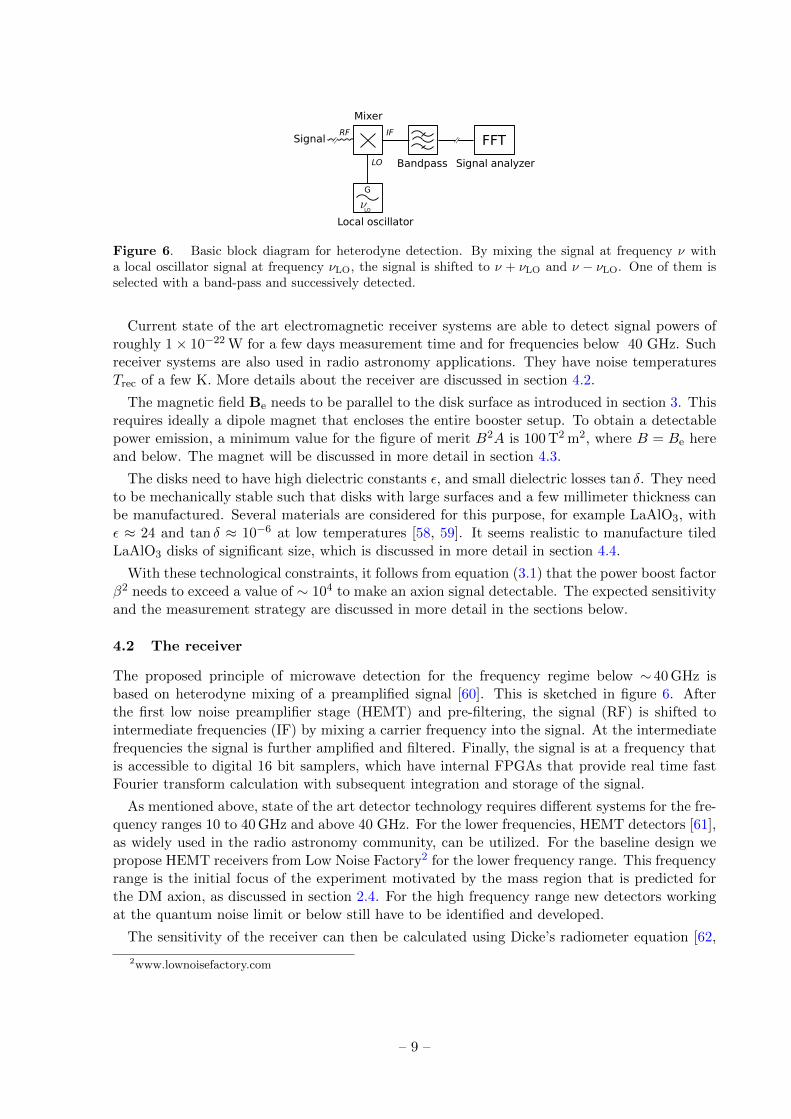
Figure 6. Basic block diagram for heterodyne detection. By mixing the signal at frequency ν witha local oscillator signal at frequency νLO, the signal is shifted to ν + νLO and ν − νLO. One of them isselected with a band-pass and successively detected.
Current state of the art electromagnetic receiver systems are able to detect signal powers ofroughly 1× 10⁻²² W for a few days measurement time and for frequencies below 40 GHz. Suchreceiver systems are also used in radio astronomy applications. They have noise temperaturesTrec of a few K. More details about the receiver are discussed in section 4.2.
The magnetic field Be needs to be parallel to the disk surface as introduced in section 3. Thisrequires ideally a dipole magnet that encloses the entire booster setup. To obtain a detectablepower emission, a minimum value for the figure of merit B2A is 100 T2 m2, where B = Be hereand below. The magnet will be discussed in more detail in section 4.3.
The disks need to have high dielectric constants ε, and small dielectric losses tan δ. They needto be mechanically stable such that disks with large surfaces and a few millimeter thickness canbe manufactured. Several materials are considered for this purpose, for example LaAlO3, withε ≈ 24 and tan δ ≈ 10−6 at low temperatures [58, 59]. It seems realistic to manufacture tiledLaAlO3 disks of significant size, which is discussed in more detail in section 4.4.
With these technological constraints, it follows from equation (3.1) that the power boost factorβ2 needs to exceed a value of ∼ 104 to make an axion signal detectable. The expected sensitivityand the measurement strategy are discussed in more detail in the sections below.
4.2 The receiver
The proposed principle of microwave detection for the frequency regime below ∼ 40 GHz isbased on heterodyne mixing of a preamplified signal [60]. This is sketched in figure 6. Afterthe first low noise preamplifier stage (HEMT) and pre-filtering, the signal (RF) is shifted tointermediate frequencies (IF) by mixing a carrier frequency into the signal. At the intermediatefrequencies the signal is further amplified and filtered. Finally, the signal is at a frequency thatis accessible to digital 16 bit samplers, which have internal FPGAs that provide real time fastFourier transform calculation with subsequent integration and storage of the signal.
As mentioned above, state of the art detector technology requires different systems for the fre-quency ranges 10 to 40 GHz and above 40 GHz. For the lower frequencies, HEMT detectors [61],as widely used in the radio astronomy community, can be utilized. For the baseline design wepropose HEMT receivers from Low Noise Factory2 for the lower frequency range. This frequencyrange is the initial focus of the experiment motivated by the mass region that is predicted forthe DM axion, as discussed in section 2.4. For the high frequency range new detectors workingat the quantum noise limit or below still have to be identified and developed.
The sensitivity of the receiver can then be calculated using Dicke’s radiometer equation [62,
2www.lownoisefactory.com
– 9 –
63],
S
N=
Psig
kBTsys
√tscan∆ν
(4.1)
where kB is the Boltzmann constant. Tsys is the total system noise temperature which consists ofthe receiver noise temperature Trec and the additional noise from the booster and its surroundingsTbooster, such that Tsys = Trec +Tbooster. Psig is the expected photon signal power (3.1) correctedby the experimental efficiency, tscan is the scanning time for an individual measurement of agiven bandwidth, and ∆ν = 10−6ν is the predicted axion line width at given frequency ν.
Given the state of the art receiver noise temperature of Trec ≈ 6 K the noise of the remainingsystem, in particular the booster, should not exceed a few K. For the discussion in the followingsections a value for the booster noise of Tbooster ≈ 2 K will be used. The noise of the booster iscalculated from the actual physical temperature multiplied by its emissivity, i.e., its effectivenessin emitting thermal radiation. The emissivity equals the absorption coefficient. A perfect mirrorwould have no absorption and therefore a noise temperature of zero. Realistic systems with lossydisks will have finite emissivity and will therefore need cooling. Furthermore, the antenna andsupporting structures thermally radiate. This can be suppressed by cooling the whole setup.These requirements can only be achieved with the booster being enclosed in a cryostat. Withthese boundary conditions the benchmark power of 1× 10⁻²² W can be detected by the receiverwithin a few days measurement time.
4.3 The magnet
According to equation (3.1), the emitted power is proportional to the square of the magneticfield component B parallel to the surface and the area A of the surface. Together with thenecessity to collect the generated power by antennas facing the surfaces of the disks, this impliesthat a dipole field is preferred. When designing a magnet for the haloscope, the quantity B2Ais to be maximized. At the same time, the maximum length and width of the setup imposed bythe coherence requirement, signal attenuation in the disks, and mechanical constraints need tobe considered.
Taking the discussion in section 4.4 into account, a dipole magnet suitable for the experimentshould reach a B2A value of 100 T2 m2. This could be realized with a magnetic field strength of10 T, with a bore of 1 m2 allowing to host disks of similar size. As discussed in section 4.4 thisfield should extend over a length of up to 200 cm.
Two independent conceptual design studies are presently being finished. They are performedin the framework of an innovation partnership [64].
Both innovation partners have investigated several different dipole-magnet concepts: cosine-theta [65], canted cosine-theta [66], racetrack [67] and block designs [68]. They independentlycame to the conclusion that it is technologically feasible to produce a dipole magnet compatiblewith the required B2A value of 100 T2 m2 and a field homogeneity of 5% within the geometricalboundary conditions set by the experiment and the infrastructure at the planned experimentalsite at DESY, Hamburg. Such a magnet would be built according to the block design using NbTisuperconductor at 1.9 K. In order to respect the maximum peak field inside the coils consistentwith NbTi superconductor, the magnetic field would be 9 T, while the disk diameter would be1.25 m.
As a first step a demonstrator coil for verification of the feasibility of the proposed conceptualdesign will be built. First estimates of the time schedule indicate the possibility for a deliveryof the full scale magnet to the experimental site around 2025.
– 10 –
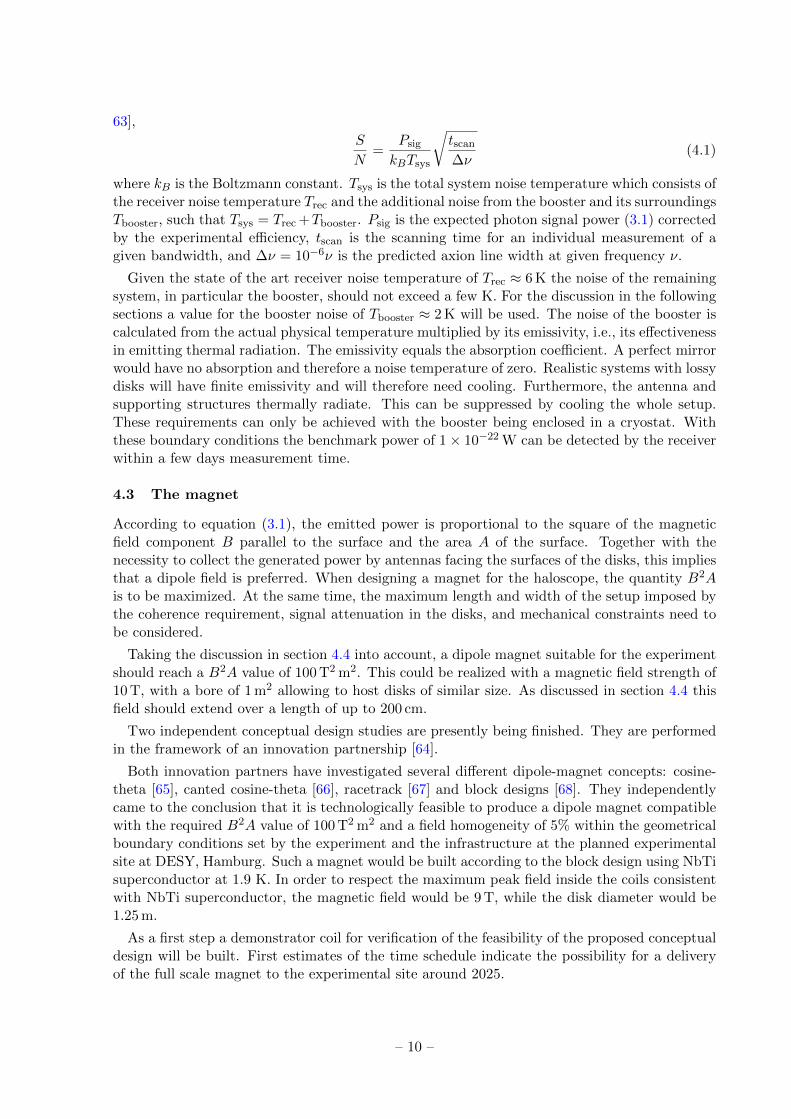
Figure 7. Calculations of the power boost factor β2 with 20 LaAlO3 disks (ε=24) for six different diskspacing configurations. For each configuration β2 > 2.5×10³ is achieved over a range of ∆νβ ∼ 250 MHz.The 250 simulations performed with random Gaussian variations of the disks spacings with a precisionof σ=15µm are plotted on top of each other.
4.4 The booster
The requirements for the booster follow from the design sensitivity and the constraints fromreceiver and magnet technologies which were discussed in the sections above. The signal powerof the booster needs to be of the order of & 1× 10⁻²² W to be detectable by state of the artradiometers. According to equation (3.1), the factor β2 needs to exceed four orders of magnitudewith a B2A value of 100 T2 m2, for example with a disk size of 1 m2 and magnetic field of 10 T.
Following the calculations outlined in section 3, the power boost factor β2 is determinedusing an idealized scenario with planar disks and without diffraction. Figure 7 shows the powerboost factor β2 as a function of frequency resulting from these calculations using 20 disks madefrom LaAlO3 (ε = 24). Six different configurations of disk spacings have been used. For eachconfiguration the disk spacings are chosen such that the boost factor exceeds β2 > 2.5×10³ withina frequency range of ∆νβ ∼ 250 MHz. For each configuration the calculation was repeated 250times with Gaussian variations of the disks spacings with a precision of σ = 15µm. This indicatesthat position uncertainties of 15µm are well acceptable in this frequency range, changing β2
typically less than ∼ 5 %.
The frequency at which sizable β2 values occur in the range ∆νβ can be seamlessly shiftedby changing the spacings between the disks. The area law then implies that for a narrower ∆νβsetting a higher power boost β2 can be achieved. Further idealized simulations showed that thepower boost β2 can easily exceed ∼ 5× 10⁴ for a setup with 80 disks [69]. Given the axionmass range to be covered, the distances between the disks range from ∼ 1.5 mm at 100 GHz to∼ 20 mm at 10 GHz. The number of 80 disks would necessitate a length of the system of up to200 cm (low frequency setup).
– 11 –
The booster could consist of movable disks connected to precision rails on which they canbe positioned by precision motors via pistons. While the precision of the pistons of motorsthemselves can be easily controlled to the sub µm level, the mechanical transmission frommotors to disks in a high magnetic field and cryogenic environment as well as gravity can leadto sizable uncertainties in the exact disk positioning. Technology to ensure in-situ adjustabledisk spacing with high enough precision in the experimental surrounding with 10 T magneticfield and cryogenic ambient temperature is currently being investigated and developed.
The material used for the dielectric disks has to fulfill the following criteria:
• High dielectric constant ε & 10: As discussed in [56] the output power can be increasedwith a higher dielectric constant ε, as the discontinuity of the axion-induced field on adisk surface increases. In addition, a higher ε can enhance the boost factor by making thesystem more resonant. Moreover, the disks are more difficult to manufacture for high ε asthey need to be thinner for a given optical thickness δ and their placement more precise.The optimal ε is therefore a trade off between various effects.
• Low dielectric loss tan δ . 10−5: Similar calculations as in section 3 and [56] have shownthat up to 50% of the total output power in a 80 disk booster is lost for tan δ = 10−6 inthe most resonant configurations. For more broadband configurations, higher losses withup to tan δ ∼ 10−5 are acceptable.
• Mechanically stable.
• Appropriate cryogenic properties down to 4 K.
• Affordable.
Presently lanthanum aluminate (LaAlO3) is envisioned as the baseline candidate for its highpermittivity (ε ≈ 24) and small loss (tan δ ≈ 10−6) also at low temperatures [58, 59]. Analternative material could be sapphire (Al2O3) [70, 71] which has a permittivity of ε ≈ 11.5 anda loss angle tan δ ≈ 10−4. Other materials are under investigation.
The technology to produce sufficiently large disks with high enough precision (surface rough-ness of ∼ µm) needs to be developed. The concept of disk tiling is currently under investigation.Tiled disks are made from several smaller pieces of dielectric material that are glued or connectedotherwise to form a single, stable large disk. Preliminary results from 3D simulations show thatthe emitted power of a tiled disk with gaps of λa/10 is not significantly reduced compared to theone emitted by a monolithic disk. Indeed, the emitted power is only reduced according to thesmaller area of the tiled disk within the uncertainties of the simulation. Also first transmissionmeasurements with a tiled ceramic disk showed no measurable effect.
An important task is to suppress contributions to the noise temperature Tsys from the boosterand its surrounding. As discussed in section 4.2, the added system noise needs to be lessthan ∼ 2 K. The main noise component is expected from thermal radiation of the disks with thesupport system, the walls surrounding the booster and the antenna. Therefore the booster needsto be enclosed in a cryogenic environment that allows to operate the booster at a temperatureof 4 K.
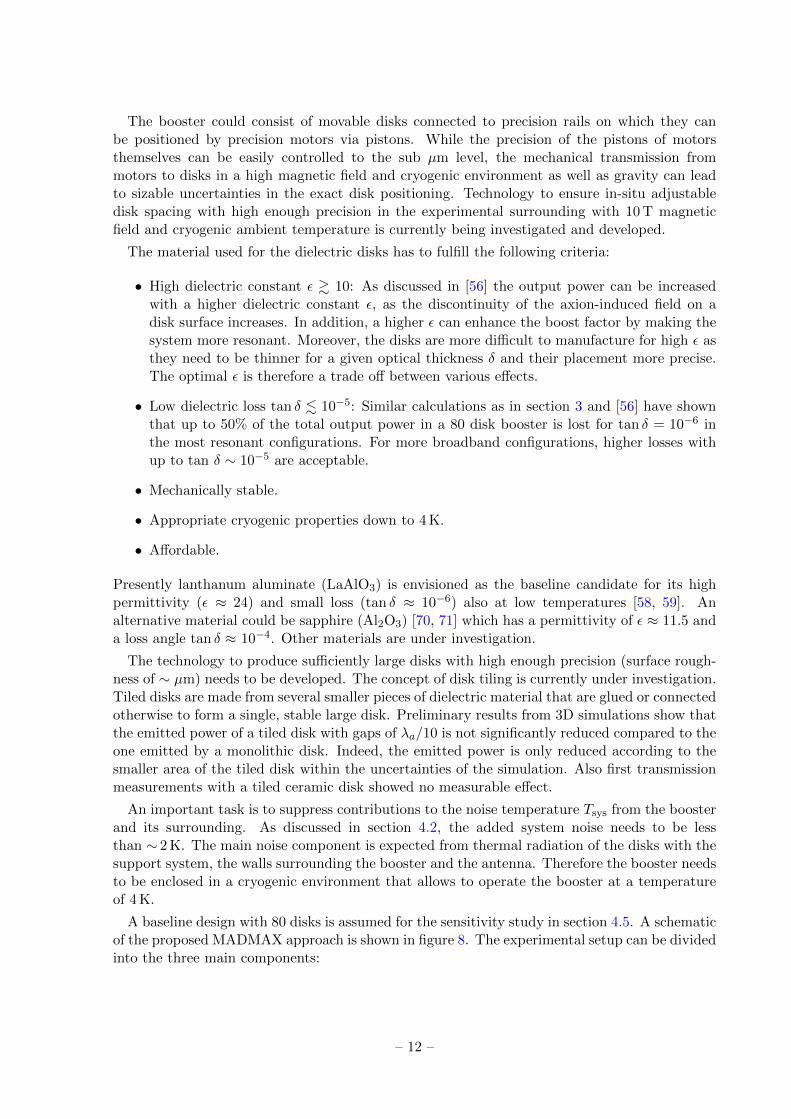
A baseline design with 80 disks is assumed for the sensitivity study in section 4.5. A schematicof the proposed MADMAX approach is shown in figure 8. The experimental setup can be dividedinto the three main components:
– 12 –
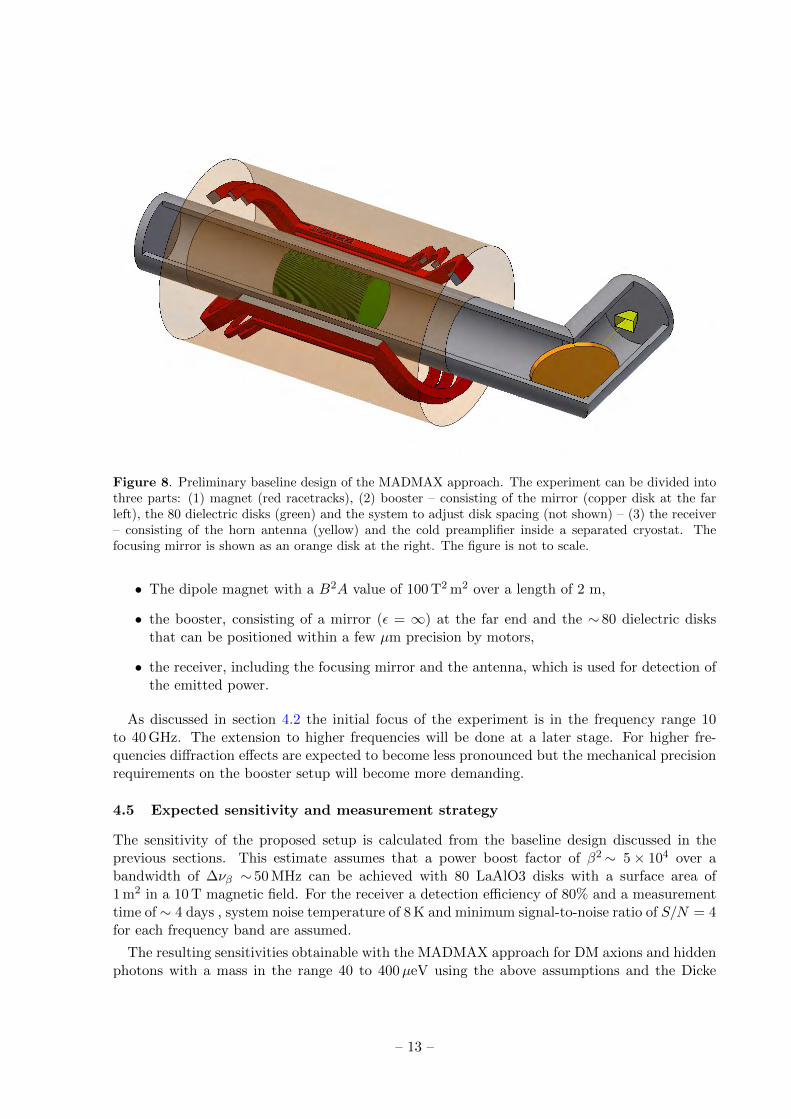
Figure 8. Preliminary baseline design of the MADMAX approach. The experiment can be divided intothree parts: (1) magnet (red racetracks), (2) booster – consisting of the mirror (copper disk at the farleft), the 80 dielectric disks (green) and the system to adjust disk spacing (not shown) – (3) the receiver– consisting of the horn antenna (yellow) and the cold preamplifier inside a separated cryostat. Thefocusing mirror is shown as an orange disk at the right. The figure is not to scale.
• The dipole magnet with a B2A value of 100 T2 m2 over a length of 2 m,
• the booster, consisting of a mirror (ε = ∞) at the far end and the ∼ 80 dielectric disksthat can be positioned within a few µm precision by motors,
• the receiver, including the focusing mirror and the antenna, which is used for detection ofthe emitted power.
As discussed in section 4.2 the initial focus of the experiment is in the frequency range 10to 40 GHz. The extension to higher frequencies will be done at a later stage. For higher fre-quencies diffraction effects are expected to become less pronounced but the mechanical precisionrequirements on the booster setup will become more demanding.
4.5 Expected sensitivity and measurement strategy
The sensitivity of the proposed setup is calculated from the baseline design discussed in theprevious sections. This estimate assumes that a power boost factor of β2∼ 5× 10⁴ over abandwidth of ∆νβ ∼ 50 MHz can be achieved with 80 LaAlO3 disks with a surface area of1 m2 in a 10 T magnetic field. For the receiver a detection efficiency of 80% and a measurementtime of ∼ 4 days , system noise temperature of 8 K and minimum signal-to-noise ratio of S/N = 4for each frequency band are assumed.
The resulting sensitivities obtainable with the MADMAX approach for DM axions and hiddenphotons with a mass in the range 40 to 400µeV using the above assumptions and the Dicke
– 13 –
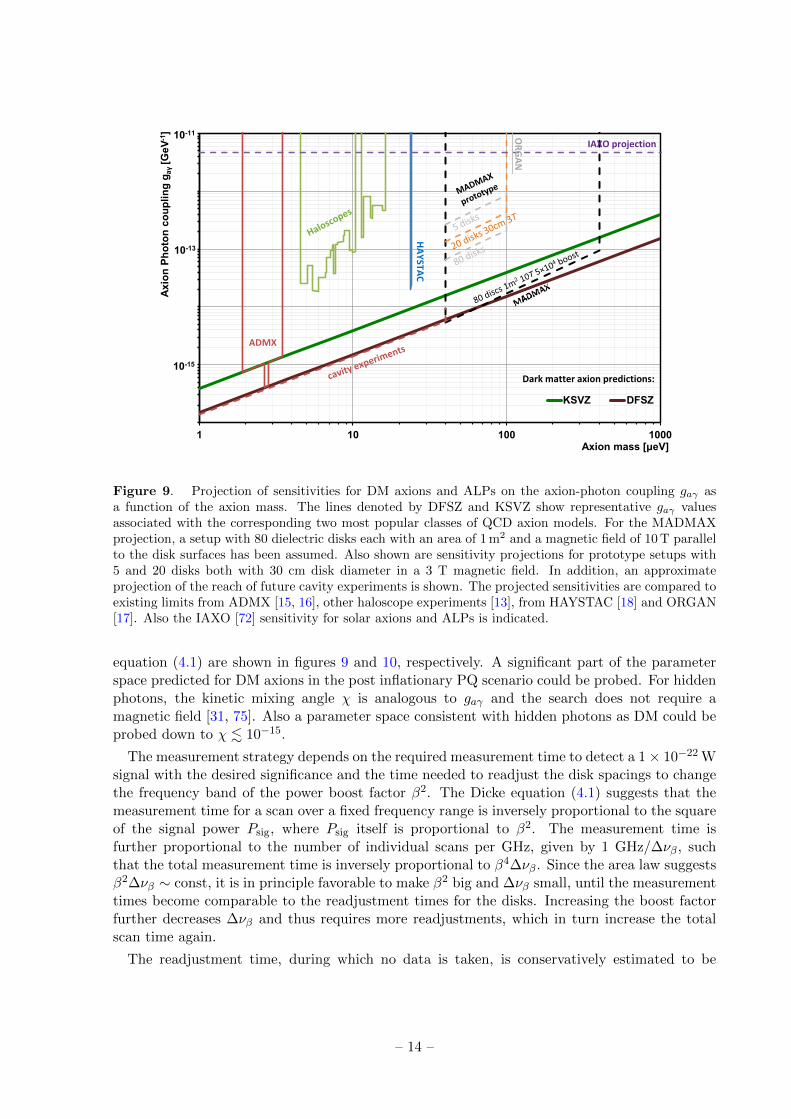
Figure 9. Projection of sensitivities for DM axions and ALPs on the axion-photon coupling gaγ asa function of the axion mass. The lines denoted by DFSZ and KSVZ show representative gaγ valuesassociated with the corresponding two most popular classes of QCD axion models. For the MADMAXprojection, a setup with 80 dielectric disks each with an area of 1 m2 and a magnetic field of 10 T parallelto the disk surfaces has been assumed. Also shown are sensitivity projections for prototype setups with5 and 20 disks both with 30 cm disk diameter in a 3 T magnetic field. In addition, an approximateprojection of the reach of future cavity experiments is shown. The projected sensitivities are compared toexisting limits from ADMX [15, 16], other haloscope experiments [13], from HAYSTAC [18] and ORGAN[17]. Also the IAXO [72] sensitivity for solar axions and ALPs is indicated.
equation (4.1) are shown in figures 9 and 10, respectively. A significant part of the parameterspace predicted for DM axions in the post inflationary PQ scenario could be probed. For hiddenphotons, the kinetic mixing angle χ is analogous to gaγ and the search does not require amagnetic field [31, 75]. Also a parameter space consistent with hidden photons as DM could beprobed down to χ . 10−15.
The measurement strategy depends on the required measurement time to detect a 1× 10⁻²² Wsignal with the desired significance and the time needed to readjust the disk spacings to changethe frequency band of the power boost factor β2. The Dicke equation (4.1) suggests that themeasurement time for a scan over a fixed frequency range is inversely proportional to the squareof the signal power Psig, where Psig itself is proportional to β2. The measurement time isfurther proportional to the number of individual scans per GHz, given by 1 GHz/∆νβ, suchthat the total measurement time is inversely proportional to β4∆νβ. Since the area law suggestsβ2∆νβ ∼ const, it is in principle favorable to make β2 big and ∆νβ small, until the measurementtimes become comparable to the readjustment times for the disks. Increasing the boost factorfurther decreases ∆νβ and thus requires more readjustments, which in turn increase the totalscan time again.
The readjustment time, during which no data is taken, is conservatively estimated to be
– 14 –
Figure 10. Projection of sensitivities for hidden photons on the kinetic mixing parameter χ as a functionof the hidden photon mass. For the MADMAX projection, a setup using 80 lanthanum aluminate diskseach with an 1 m2 area have been assumed. Also shown are sensitivity projections for prototype setupswith 5 and 20 disks with 30 cm disk diameter. The projected sensitivities are compared to existing limitsfrom ADMX and other haloscope experiments for hidden photon searches from [73], from ADMX-HF [18]and from the latest Tokyo results [74]. The area above the black line represents the parameter spacewhere hidden photons are not a good DM candidate [73].
around a day. The measurement time further depends on the system noise which is assumed tobe Tsys = 8 K and the detection efficiency, for which we assume ∼ 80%. Note that the numbersstated in the above considerations are preliminary estimates with respective uncertainties. Underthe stated assumptions one finds that the mass range between 40 and 120 µeV could be scannedwithin ∼ 5 years [56], showing the experimental feasibility of this approach. The mass rangeabove 120 µeV requires additional R&D especially for the detection technique and could becovered with detectors working at or below the quantum limit for the required frequency range.
5 Proof of principle measurements with first test setup
First proof of principle systems for the booster and the receiver have been assembled and tested.A receiver system based on a HEMT preamplifier and heterodyne mixing as described in sec-tion 4.2 has been set up. Additionally, a first proof of principle booster with up to 5 sapphiredisks has been built and the electromagnetic response was tested for different cases of equidistantdisk positions.
The setups were used for first proof of principle measurements, and are described in moredetail in the following subsections. These measurements indicate that the assumptions on 10 –30 GHz receiver sensitivity and disk placement precision, necessary to estimate the sensitivityof the MADMAX approach, are realistic.
– 15 –
7.25–7.75 GHz
G
LO1
G
LO3
1.555-1.605 GHz Signal analyzer33 dBTN=5-6 K
-10 dB
1. Local oscillator 3. Local oscillator
50 MHz10 GHz33 dB=75 K
G
LO2
2. Local oscillator
-10 dB -10 dB
LHe-Bath Room temperature
FFT
TN
10–20 GHz
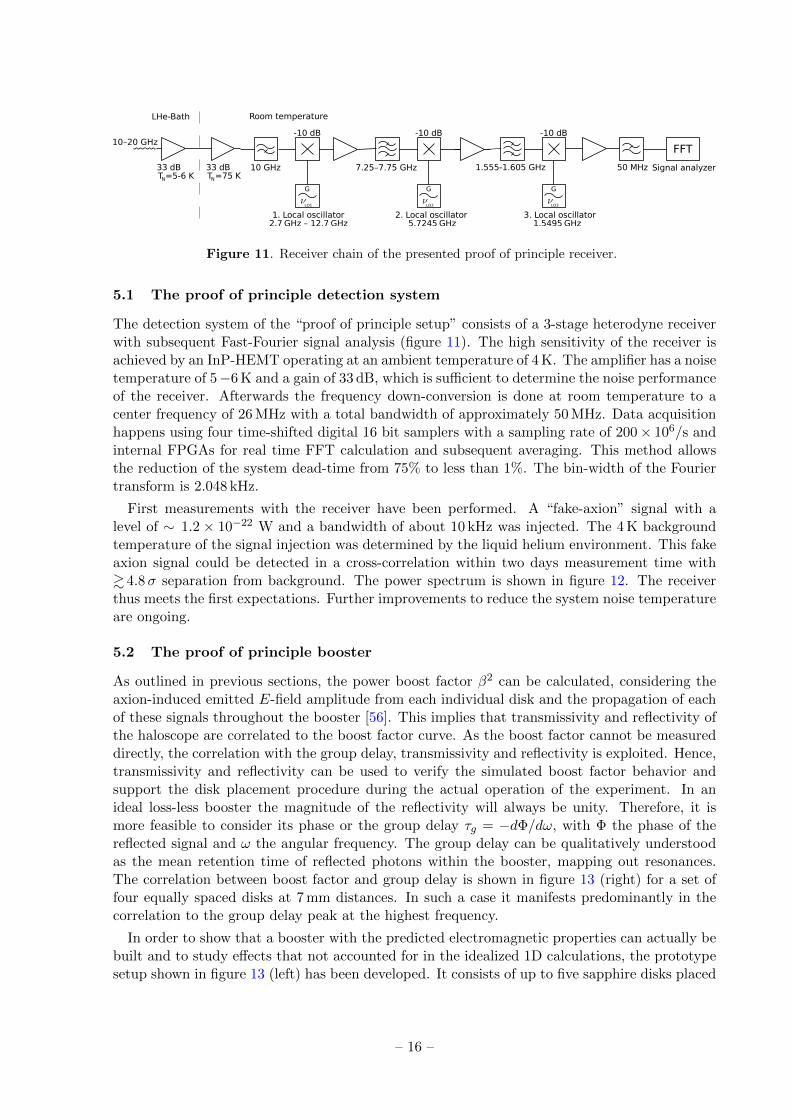
Figure 11. Receiver chain of the presented proof of principle receiver.
5.1 The proof of principle detection system
The detection system of the “proof of principle setup” consists of a 3-stage heterodyne receiverwith subsequent Fast-Fourier signal analysis (figure 11). The high sensitivity of the receiver isachieved by an InP-HEMT operating at an ambient temperature of 4 K. The amplifier has a noisetemperature of 5−6 K and a gain of 33 dB, which is sufficient to determine the noise performanceof the receiver. Afterwards the frequency down-conversion is done at room temperature to acenter frequency of 26 MHz with a total bandwidth of approximately 50 MHz. Data acquisitionhappens using four time-shifted digital 16 bit samplers with a sampling rate of 200× 106/s andinternal FPGAs for real time FFT calculation and subsequent averaging. This method allowsthe reduction of the system dead-time from 75% to less than 1%. The bin-width of the Fouriertransform is 2.048 kHz.
First measurements with the receiver have been performed. A “fake-axion” signal with alevel of ∼ 1.2 × 10⁻²² W and a bandwidth of about 10 kHz was injected. The 4 K backgroundtemperature of the signal injection was determined by the liquid helium environment. This fakeaxion signal could be detected in a cross-correlation within two days measurement time with& 4.8σ separation from background. The power spectrum is shown in figure 12. The receiverthus meets the first expectations. Further improvements to reduce the system noise temperatureare ongoing.
5.2 The proof of principle booster
As outlined in previous sections, the power boost factor β2 can be calculated, considering theaxion-induced emitted E-field amplitude from each individual disk and the propagation of eachof these signals throughout the booster [56]. This implies that transmissivity and reflectivity ofthe haloscope are correlated to the boost factor curve. As the boost factor cannot be measureddirectly, the correlation with the group delay, transmissivity and reflectivity is exploited. Hence,transmissivity and reflectivity can be used to verify the simulated boost factor behavior andsupport the disk placement procedure during the actual operation of the experiment. In anideal loss-less booster the magnitude of the reflectivity will always be unity. Therefore, it ismore feasible to consider its phase or the group delay τg = −dΦ/dω, with Φ the phase of thereflected signal and ω the angular frequency. The group delay can be qualitatively understoodas the mean retention time of reflected photons within the booster, mapping out resonances.The correlation between boost factor and group delay is shown in figure 13 (right) for a set offour equally spaced disks at 7 mm distances. In such a case it manifests predominantly in thecorrelation to the group delay peak at the highest frequency.
In order to show that a booster with the predicted electromagnetic properties can actually bebuilt and to study effects that not accounted for in the idealized 1D calculations, the prototypesetup shown in figure 13 (left) has been developed. It consists of up to five sapphire disks placed
– 16 –
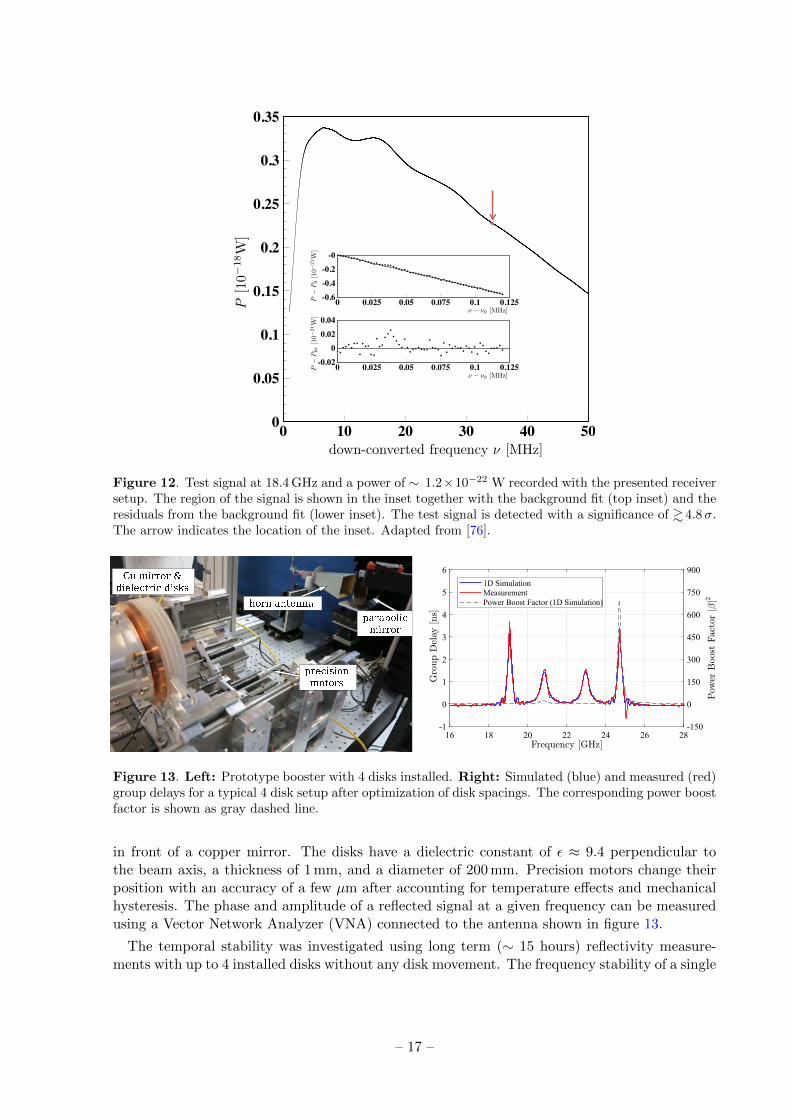
Figure 12. Test signal at 18.4 GHz and a power of ∼ 1.2×10⁻²² W recorded with the presented receiversetup. The region of the signal is shown in the inset together with the background fit (top inset) and theresiduals from the background fit (lower inset). The test signal is detected with a significance of & 4.8σ.The arrow indicates the location of the inset. Adapted from [76].
horn antenna
precisionmotors
parabolicmirror
Cu mirror &dielectric disks
Figure 13. Left: Prototype booster with 4 disks installed. Right: Simulated (blue) and measured (red)group delays for a typical 4 disk setup after optimization of disk spacings. The corresponding power boostfactor is shown as gray dashed line.
in front of a copper mirror. The disks have a dielectric constant of ε ≈ 9.4 perpendicular tothe beam axis, a thickness of 1 mm, and a diameter of 200 mm. Precision motors change theirposition with an accuracy of a few µm after accounting for temperature effects and mechanicalhysteresis. The phase and amplitude of a reflected signal at a given frequency can be measuredusing a Vector Network Analyzer (VNA) connected to the antenna shown in figure 13.
The temporal stability was investigated using long term (∼ 15 hours) reflectivity measure-ments with up to 4 installed disks without any disk movement. The frequency stability of a single
– 17 –
Disk Spacings Repeatability
(Fitting Physical Disk Positions)
Boost FactorRepeatability
(Fitting Modelto Measurements)
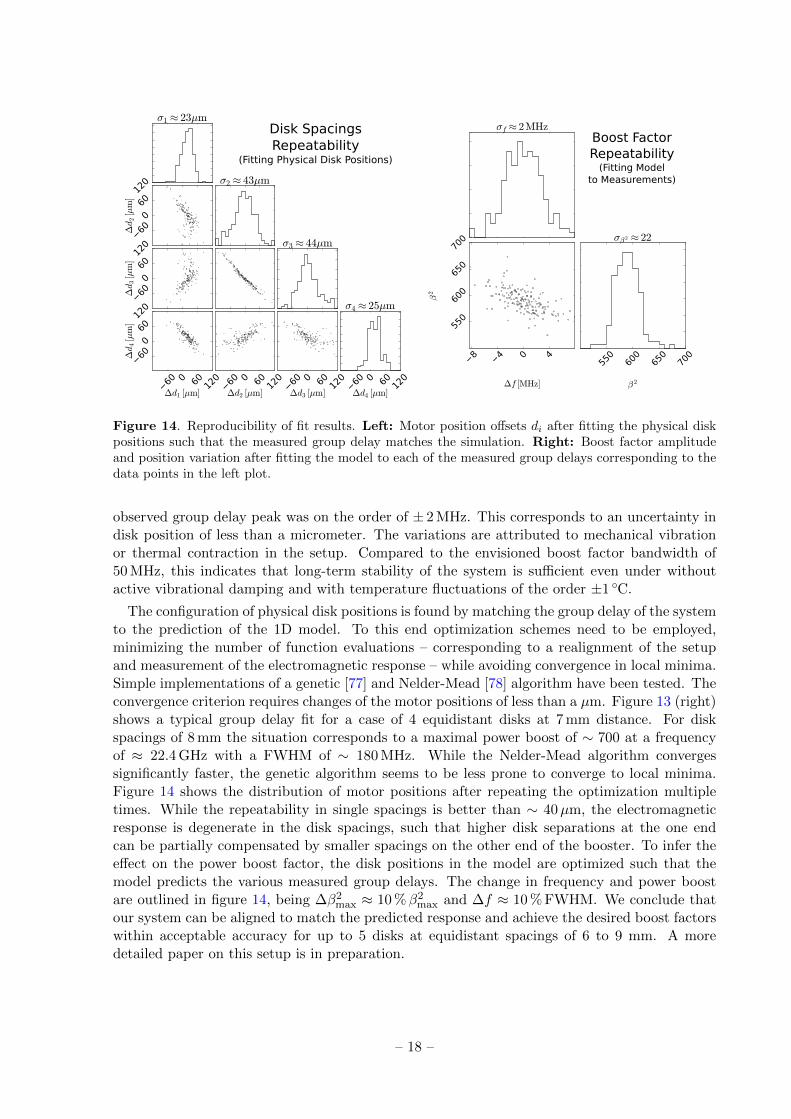
Figure 14. Reproducibility of fit results. Left: Motor position offsets di after fitting the physical diskpositions such that the measured group delay matches the simulation. Right: Boost factor amplitudeand position variation after fitting the model to each of the measured group delays corresponding to thedata points in the left plot.
observed group delay peak was on the order of ± 2 MHz. This corresponds to an uncertainty indisk position of less than a micrometer. The variations are attributed to mechanical vibrationor thermal contraction in the setup. Compared to the envisioned boost factor bandwidth of50 MHz, this indicates that long-term stability of the system is sufficient even under withoutactive vibrational damping and with temperature fluctuations of the order ±1 ◦C.
The configuration of physical disk positions is found by matching the group delay of the systemto the prediction of the 1D model. To this end optimization schemes need to be employed,minimizing the number of function evaluations – corresponding to a realignment of the setupand measurement of the electromagnetic response – while avoiding convergence in local minima.Simple implementations of a genetic [77] and Nelder-Mead [78] algorithm have been tested. Theconvergence criterion requires changes of the motor positions of less than a µm. Figure 13 (right)shows a typical group delay fit for a case of 4 equidistant disks at 7 mm distance. For diskspacings of 8 mm the situation corresponds to a maximal power boost of ∼ 700 at a frequencyof ≈ 22.4 GHz with a FWHM of ∼ 180 MHz. While the Nelder-Mead algorithm convergessignificantly faster, the genetic algorithm seems to be less prone to converge to local minima.Figure 14 shows the distribution of motor positions after repeating the optimization multipletimes. While the repeatability in single spacings is better than ∼ 40µm, the electromagneticresponse is degenerate in the disk spacings, such that higher disk separations at the one endcan be partially compensated by smaller spacings on the other end of the booster. To infer theeffect on the power boost factor, the disk positions in the model are optimized such that themodel predicts the various measured group delays. The change in frequency and power boostare outlined in figure 14, being ∆β2max ≈ 10 %β2max and ∆f ≈ 10 % FWHM. We conclude thatour system can be aligned to match the predicted response and achieve the desired boost factorswithin acceptable accuracy for up to 5 disks at equidistant spacings of 6 to 9 mm. A moredetailed paper on this setup is in preparation.
– 18 –
6 Towards realization of MADMAX
6.1 Prototype
The receiver sensitivity has been verified experimentally as discussed in section 5.1, while a basictest of the precision of disk placement has been performed for a setup with four disks of 20 cmdiameter and a mirror as discussed in section 5.2. Before a full scale experiment can be built,many components still need to be investigated and developed. The full R&D programme of thecoming years is beyond the scope of this paper. Some of the ongoing investigations include thefollowing:
• All proposed components have to be tested for their performance in a strong magneticfield of up to 10 T and at cryogenic temperatures of 4 K.
• For the final size of the experiment the required accuracy of relevant parameters (precisionof disk positioning, disk thickness, surface roughness, loss mechanisms) need to be testedagainst available technology.
• A technology to produce thin dielectric disks with plane surfaces with areas up to 1 m2
has to be developed and tested, e.g., disk tiling.
• Procedures to measure the properties of dielectric disks such as permittivity and loss factorneed to be adapted.
• A concept to position the disks inside a strong magnetic field in vacuum and at cryogenictemperatures down to 4 K has to be developed.
• The system noise behavior has to be studied down to temperatures around 4 K, includingthe noise behaviour of the booster itself and its surroundings (tube, holding structure).
• The simulation of the experiment needs to be tested for realism up to the full scale of theexperimental device. The preliminary 1D calculations need to be extended to realistic full3D simulations.
• The scaling behavior of the power boost factor β2 with the number of disks and theirarea has to be studied further. The area law (section 3) holds in 1D, while effects such asdiffraction, dielectric loss and others may modify the behavior.
• The beam shape of the system needs to be studied, and a suitably matched antenna systemneeds to be devised.
• The receiver technology for low frequencies, based on heterodyne mixing needs to beoptimized, while new technologies for high frequencies need to be explored.
• The feasibility of manufacturing a dipole magnet fulfilling the requirements of the experi-ment needs to be studied in terms of cost and availability of technology.
The central component towards accomplishing these goals and to obtain a better understand-ing of the fundamental concept of the experiment will be a prototype system with smallerdimensions. The prototype setup will have a smaller number of disks (≈ 20) each with a smallerdiameter (≈ 30 cm) than in the full scale experiment.
– 19 –
This prototype booster will be used to study adjustment of disk positions for a defined fre-quency and bandwidth. The cryogenic performance of the mechanical parts will be studied ina dedicated cryostat that allows the components to be cooled down to 4 K. It is also foreseento test the protoype booster inside magnetic fields of a few T. It is presently being investigatedwhether a suitable magnet could be available.
The prototype represents a stepping stone towards the development of technologies to be usedin the full experiment. Beyond that, the prototype will also provide competitive physics results,covering regions in the axion DM phase space that have not been probed experimentally before,if a suitable magnet can be found.
As shown in figure 9, with a setup consisting of 5 disks with 30 cm diameter in front of amirror inside a 3 T magnetic field, a sensitivity could be achieved that can probe uncoveredregions of DM parameter space, and which exceeds the projected sensitivity of the proposedIAXO experiment for solar axions [72], which does not depend on cosmological assumptions. Asetup with 20 disks improves the sensitivity on gaγ a factor of two compared to a 5 disk setup.
As shown in figure 10, even without a magnet, a prototype setup could considerably improvethe existing limits in the search for DM hidden photons and probe into unexplored territoryin the allowed parameter space. Even a five disk setup would improve the limit obtained inreference [74] for ∼ 50µeV hidden photons by more than two orders of magnitude.
6.2 Experimental site
DESY Hamburg has offered the MADMAX collaboration to host the experiment at the HERAnorth hall. It has been verified to be a suitable site for the experiment: It fulfills the spaceand infrastructural requirements and is ∼ 20 m below the surface. It has enough overburden tosufficiently shield electromagnetic radiation present at the surface. First background measure-ments at the site in the frequency range between few kHz and ∼ 20 GHz have been performed.Above 1 GHz the measured background consistently had a level < −100 dBm; no signal could bedetected. Between 100 MHz and 1 GHz some signals from radio stations, telecommunication andemergency communication transmitters are present, but also in this frequency range the generalnoise was consistently less than −100 dBm. No correlations with RF activities of the PETRAand FLASH RF infrastructure—ongoing during the measurements—were found. The cryogenicinfrastructure necessary for the magnet and booster operation already exists and needs to beadapted. Furthermore, the iron yoke of the H1 detector is still in the hall and could be used asyoke for the MADMAX magnet.
6.3 Timeline
As first steps it is planned to answer scientific and strategically important questions that havethe potential to influence the design of the experiment. They will be addressed within the next3–4 years using the prototype setup described above. Also a demonstrator magnet is plannedthat will prove the feasibility of the technology. Already during this time, physics results willbe achieved using the prototype cryogenic booster.
Based on the results from the prototype studies a final design will be devised. It is envisionedto start building the final experiment once results from the magnet demonstrator setup andMADMAX prototype experiment are available, approximately in the year ∼ 2022. The timescale to start data taking is mainly driven by the production of the magnet.
The plan outlined in this paper would allow to probe the axion DM mass range between ∼ 40and 120µeV. Until then new detection techniques with quantum limited detectors would be
– 20 –
developed to allow the sensitivity range of the experiment to be extended up to an axion massof ∼ 400µeV.
7 Conclusions
Axions are very well motivated particle candidates that can explain both the strong CP problemand the DM problem simultaneously. Their coupling to photons through the Primakoff effectmakes them detectable in principle in the laboratory. This has been and is being exploited inexperiments relying on the concept of resonant axion to photon conversion in cavities. Theseexperiments are sensitive enough to probe axions as DM candidates in the axion mass rangebelow ∼ 40µeV. The axion mass range above 40µeV, which is predicted by theoretical modelswhere the PQ symmetry breaking occurs after inflation, is not yet experimentally explored.
We propose a new experiment, MADMAX, a dielectric haloscope. We have shown that sim-ulations and first experimental tests of the concept are very promising. This lead us to theconclusion that this approach is experimentally scalable. We introduced the baseline design ofthe MADMAX experiment. This experiment consists of three main components:
1. A booster with ∼80 disks with area ∼ 1 m2 made from a material with high dielectricconstant and low dielectric loss in front of a mirror. The distances between the disks needto be adjustable in a range from 2− 20 mm with a precision of a few µm.
2. A magnet with an aperture to host the booster. The magnetic field parallel to the disksalong with the size of the disk area needs to achieve a B2A value of 100 T2 m2.
3. Receivers that can detect microwaves with a power of ∼ 10−22 W in a few days of mea-surement time in the range 10− 100 GHz.
The whole setup needs to be installed in an environment with low electromagnetic noise.Presently the HERA hall north at DESY, Hamburg has been identified as a site.
In the next 2–3 years a smaller prototype with disk diameters of ∼ 30 cm will be designed andproduced. This will allow to verify the scalability of the technologies investigated so far. Sucha setup would probe uncovered parameter spcace and provide competitive results in the searchfor hidden photons and also for ALPs if a suitable magnet can be identified.
Once the prototype is commissioned, the construction of the final experiment will be envisaged,taking the experience with the prototype into account. In case of a smooth implementation,first measurements with a sensitivity high enough to probe DM QCD axions could be takenstarting from ∼ 2025. It would need roughly ten years to probe the whole mass range between40 and 400 µeV predicted for axion DM in the case of PQ symmetry breaking after inflation.This proposal presents the so far only known approach to cover this very well motivated massrange for axions and is complementary to other axion DM searches discussed in the literature.
8 Acknowledgments
The prototype setup used for first measurements was partly funded as a seed project by the DFGExcellence Cluster Universe (Grant No. EXC 153). Chang Lee is supported by DFG throughSFB 1258.
– 21 –
References
[1] R. D. Peccei and H. R. Quinn, Phys. Rev. Lett. 38 (1977) 1440.
[2] R. D. Peccei and H. R. Quinn, Phys. Rev. D 16 (1977) 1791.
[3] S. Weinberg, Phys. Rev. Lett. 40 (1978) 223.
[4] F. Wilczek, Phys. Rev. Lett. 40 (1978) 279.
[5] J. Preskill, M. B. Wise and F. Wilczek, Phys. Lett. B 120 (1983) 127.
[6] L. F. Abbott and P. Sikivie, Phys. Lett. B 120 (1983) 133.
[7] M. Dine and W. Fischler, Phys. Lett. B 120 (1983) 137.
[8] P. Sikivie, Lect. Notes Phys. 741 (2008) 19 [astro-ph/0610440].
[9] D. J. E. Marsh, Phys. Rept. 643 (2016) 1 [arXiv:1510.07633].
[10] G. Raffelt, Lecture Notes Phys. 741 (2008) 51
[11] J. H. Chang, R. Essig and S. D. McDermott, JHEP 1809 (2018) 051. [arXiv:1803.00993].
[12] M. Giannotti, I. G. Irastorza, J. Redondo, A. Ringwald and K. Saikawa, JCAP 1710 (2017) no.10,010 [arXiv:1708.02111].
[13] A. Ringwald, L. Rosenberg and G. Rybka, M. Tanabashi et al. [Particle Data Group], Phys. Rev.D 98 (2018) no.3, 030001.
[14] P. Sikivie, Phys. Rev. Lett. 51 (1983) 1415; Erratum ibid. 51 (1983) 695.
[15] S. Asztalos et al., Phys. Rev. D 69 (2004) 011101.
[16] N. Du et al. [ADMX Collaboration], Phys. Rev. Lett. 120, no. 15, 151301 (2018)[arXiv:1804.05750].
[17] B. T. McAllister, G. Flower, E. N. Ivanov, M. Goryachev, J. Bourhill and M. E. Tobar, Phys. DarkUniv. 18 (2017) 67 [arXiv:1706.00209].
[18] B. M. Brubaker et al., Phys. Rev. Lett. 118 (2017) no.6, 061302 [arXiv:1610.02580].
[19] S. Al Kenany et al., Nucl. Instrum. Meth. A 854 (2017) 11 [arXiv:1611.07123].
[20] L. Zhong et al. [HAYSTAC Collaboration], Phys. Rev. D 97 (2018) no.9, 092001[arXiv:1803.03690].
[21] W. Chung, Launching axion experiment at CAPP/IBS in Korea, in Proceedings of the 12th PatrasWorkshop on Axions, WIMPs and WISPs, Jeju, Korea (2016).
[22] M. Kawasaki, K. Saikawa and T. Sekiguchi, Phys. Rev. D 91 (2015) no.6, 065014[arXiv:1412.0789].
[23] T. Hiramatsu, M. Kawasaki, K. Saikawa and T. Sekiguchi, Phys. Rev. D 85 (2012) 105020,Erratum ibid. 86 (2012) 089902.
[24] E. W. Kolb and I. I. Tkachev, Phys. Rev. D 49 (1994) 5040.
[25] K. M. Zurek, C. J. Hogan and T. R. Quinn, Phys. Rev. D 75 (2007) 043511.
[26] S. Borsanyi et al., Nature 539 (2016) 69.
[27] G. Ballesteros, J. Redondo, A. Ringwald and C. Tamarit, JCAP 1708 (2017) no.08, 001[arXiv:1610.01639].
[28] V. B. Klaer and G. D. Moore, JCAP 1711 (2017) no.11, 049 [arXiv:1708.07521].
[29] M. Gorghetto, E. Hardy and G. Villadoro, JHEP 1807 (2018) 151 [arXiv:1806.04677].
[30] A. Caldwell et al. [MADMAX Working Group], Phys. Rev. Lett. 118 (2017) no.9, 091801[arXiv:1611.05865].
– 22 –
[31] D. Horns, J. Jaeckel, A. Lindner, A. Lobanov, J. Redondo and A. Ringwald, JCAP 1304(2013)016[arXiv:1212.2970].
[32] J. Jaeckel and J. Redondo, Phys. Rev. D 88 (2013) 115002 [arXiv:1308.1103].
[33] M. Pospelov and A. Ritz, Nucl. Phys. B 573 (2000) 177 [hep-ph/9908508].
[34] C. A. Baker et al., Phys. Rev. Lett. 97 (2006) 131801 [hep-ex/0602020].
[35] M. Pospelov and A. Ritz, Annals Phys. 318 (2005) 119 [hep-ph/0504231].
[36] C. Vafa and E. Witten, Phys. Rev. Lett. 53 (1984) 535.
[37] G. Grilli di Cortona, E. Hardy, J. Pardo Vega and G. Villadoro, JHEP 1601 (2016) 034[arXiv:1511.02867].
[38] L. Di Luzio, F. Mescia and E. Nardi, Phys. Rev. Lett. 118 (2017) no.3, 031801doi:10.1103/PhysRevLett.118.031801 [arXiv:1610.07593 [hep-ph]].
[39] P. Agrawal, J. Fan, M. Reece and L. T. Wang, JHEP 1802 (2018) 006doi:10.1007/JHEP02(2018)006 [arXiv:1709.06085 [hep-ph]].
[40] M. Giannotti, I. Irastorza, J. Redondo and A. Ringwald, JCAP 1605 (2016) no.05, 057[arXiv:1512.08108].
[41] I. G. Irastorza and J. Redondo, Prog. Part. Nucl. Phys. 102 (2018) 89 [arXiv:1801.08127].
[42] P. Sikivie, Phys. Rev. Lett. 48 (1982) 1156.
[43] R. Daido, F. Takahashi and W. Yin, arXiv:1702.03284.
[44] A. Ringwald and K. Saikawa, Phys. Rev. D 93, 085031 (2016); Addendum ibid. 94, 049908 (2016)[arXiv:1512.06436].
[45] L. Fleury and G. D. Moore, JCAP 1601 (2016) 004 [arXiv:1509.00026].
[46] L. M. Fleury and G. D. Moore, JCAP 1605 (2016) 005 [arXiv:1602.04818].
[47] G. D. Moore, arXiv:1604.02356.
[48] D. Budker, P. W. Graham, M. Ledbetter, S. Rajendran and A. Sushkov, Phys. Rev. X 4, (2014)021030 [arXiv:1306.6089].
[49] P. Sikivie, N. Sullivan and D. B. Tanner, Phys. Rev. Lett. 112, (2014) 131301 [arXiv:1310.8545].
[50] Y. Kahn, B. R. Safdi and J. Thaler, Phys. Rev. Lett. 117, (2016) 141801 [arXiv:1602.01086].
[51] J. L. Ouellet et al., arXiv:1810.1225.
[52] G. Rybka, A. Wagner, A. Brill, K. Ramos, R. Percival and K. Patel, Phys. Rev. D 91 (2015) no.1,011701 [arXiv:1403.3121].
[53] A. A. Melcon et al., JCAP 1805 (2018) no.05, 040 [arXiv:1803.01243].
[54] M. Silva-Feaver et al., IEEE Trans. Appl. Supercond. 27 (2017) no.4, 1400204 [arXiv:1610.09344].
[55] A. Arvanitaki and A. A. Geraci, Phys. Rev. Lett. 113, (2014) 161801 [arXiv:1403.1290].
[56] A. J. Millar, G. G. Raffelt, J. Redondo and F. D. Steffen, JCAP 1701 (2017) no.01, 061[arXiv:1612.07057].
[57] A. N. Ioannisian, N. Kazarian, A. J. Millar and G. G. Raffelt, JCAP 1709 (2017) no.09, 005[arXiv:1707.00701].
[58] J. Krupka et al., IEEE Transactions on Microwave Theory and Techniques, 42 (10) 1994 .
[59] T. Shimada et al., IEEE Transactions on Ultrasonics, Ferroelectrics, and Frequency Control, 57(10) 2010.
[60] T. Oxley, IEEE Trans. Microwave Theo. and Techn., 50 (3) (2002) 867.
[61] T. Mimura, IEEE Trans. Microwave theory and techn. 50 (3) (2002) 780.
– 23 –
[62] T. Hunter and R. Kimberk, [arXiv:1507.04280].
[63] J. Kraus, ”Antennas and wave propagation”, Mc Graw Hill, (2010), ISBN0070671559.
[64] https://ec.europa.eu/growth/content/8699-innovation-partnerships-keep-public-services-date en
[65] L. Rossi, IEEE Trans. Appl. Supercond., vol. 14, no. 2, pp. 153, Jun 2004.
[66] S. Caspi et al., IEEE Transactions on Applied Superconductivity 24 (3) (2014) 4001804.
[67] E. Rochepault, P. Vedrine and F. Bouillault. IEEE Transactions on Applied Superconductivity 22(3) (2012) 4900804.
[68] E. Rochepault, P. Vedrine, and F. Bouillault, IEEE TRANSACTIONS ON APPLIEDSUPERCONDUCTIVITY, VOL. 22, NO. 3, JUNE 2012.
[69] A. J. Millar, J. Redondo and F. D. Steffen, JCAP 1710 (2017) no.10, 006 Erratum: [JCAP 1805(2018) no.05, E02] [arXiv:1707.04266].
[70] J. Krupka et al 1999 Meas. Sci. Technol. 10 387.
[71] X. Aupi et al., J. Appl. Phys 95 (5) (2004) 2639.
[72] E. Armengaud et al., JINST 9 (2014) T05002.
[73] P. Arias et al, JCAP 06 (2012) 013.
[74] J. Suzuki, Y. Inoue, T. Horie, M. Minowa, Proceedings contribution to the 11th Patras Workshopon Axions, WIMPs and WISPs, Zaragoza, June 22 to 26, 2015, [arXiv:1509.00785].
[75] J. Jaeckel, Frascati Phys. Ser. 56 (2012) 172 [arXiv:1303.1821].
[76] F. Beaujean, A. Caldwell and O. Reimann, Eur. Phys. J. C 78 (2018) no.9, 793 [arXiv:1710.06642].
[77] D. Whitley, Stat Comput (1994) 4: 65.
[78] J. C. Lagarias, J. A. Reeds, M. H. Wright, and P. E. Wright, SIAM J. Optim., 9(1), 112a€“147.
– 24 –


![First Searches for Axions and Axion-Like Particles with ...3 Axion and ALP searches rely on the so-called axio-electric e ect [29{31] ˙ Ae= ˙ pe(E A) g2 Ae A 3E2 A 16ˇ emm2 e 1](https://img.pdfslide.us/doc/110x75/5f3e695e66ce2c4255743a73/first-searches-for-axions-and-axion-like-particles-with-3-axion-and-alp-searches.jpg)