Embed Size (px)
Citation preview

1
A new combined inorganic-organic flocculant (CIOF) as a
performance enhancer for aerated submerged membrane bioreactor
Tien Thanh Nguyen, Wenshan Guo, Huu Hao Ngo, Saravanamuthu
Vigneswaran*
School of Civil and Environmental Engineering, University of Technology Sydney,
Broadway, NSW 2007, Australia
* Corresponding author, Tel: +61-2-9514-2641, Fax: + 61-2-9514-2633,
E-mail: [email protected]
Abstract
In this study, a new combined inorganic-organic flocculant (CIOF) of FeCl3 and
membrane performance enhancer (MPE50) was prepared and added to an aerated
submerged membrane bioreactor (SMBR). The effects of CIOF on the performance of
an aerated submerged membrane bioreactor (SMBR) were evaluated. The results
indicated that the SMBR with CIOF addition could remove almost 100% total
phosphate while eliminating over 90% ammonia (NH4-N) and dissolved organic carbon
(DOC) during an 80-day of operation. The respiration tests revealed that the specific
oxygen uptake rate (SOUR) was stable around 1.5-2.0 mg O2/g MLVSS.h. The sludge
volume index (SVI) of less than 100 mL/g during the operation showed the importance
of CIOF on the improvement of settling properties of the sludge. Soluble carbohydrate
concentration was also well correlated with DOC of the supernatant. CIOF was

2
successful in the reduction of fouling of membrane as the membrane was only
chemically cleaned after 53 days of operation.
Keywords: Submerged membrane bioreactor, ferric chloride, membrane
performance enhancer (MPE50), organic and nutrient removals
1. Introduction
Among membrane processes, membrane bioreactor (MBR) technology is an
innovative and promising option for wastewater treatment and reuse. It has been
considered as one of the most favourable processes for water reclamation with many
outstanding advantages over the conventional activated sludge systems. However, MBR
has some drawbacks, in particular membrane fouling. Membrane fouling deteriorates
the permeability of the membrane and consequently increases the energy consumption
in MBR. In addition, due to this problem, operational and maintenance cost of the MBR
are high. Therefore, it is necessary to develop an effective and economical method of
preventing or reducing membrane fouling [1].
The coagulant addition to minimise membrane fouling has been developed by
several researchers. Coagulants are generally added during water and wastewater
treatment to remove colloidal and suspended solids through their aggregation to larger
flocs [2]. It has been reported that coagulants such as FeCl3 and alum were effective in
enhancing filterability of mixed liquor and controlling membrane fouling [3,4]. Ferric
chloride has been tested in pre-coating and flocculation experiments to retard membrane
fouling [3]. These studies revealed that ferric chloride was efficient in removing non-
biodegradable materials without stressing the microorganisms. Zhang et al. [5]

3
demonstrated that the addition of FeCl3 to the MBR system at the optimal concentration
improved the filterability of the mixed sludge and mitigated the membrane fouling. The
results indicated that the optimal ferric chloride concentration affected the molecular
weight distribution of the soluble microbial product (SMP) and particle size distribution
of the flocs in the hybrid MBR, reducing the fraction of larger molecular weight higher
than 10 kDa in the SMP and the 1-10 µm particles in the flocs. Moreover, the element
analysis of extracellular polymeric substances (EPS) implied that the addition of Fe(III)
to the MBR system bridged the negatively charged groups of the components of the
EPS and replaced other elements through ion exchange. Song et al. [6] evaluated the use
of ferric chloride in MBR application. It was able to largely improve the phosphorus
removal as well as the filtration resistance.
Applying polymer to improve the performance of MBR has also been studied.
Various synthetic and natural polymers have been tested in fouling control. Yoon et al.
[7] indicated that the total solids in bioreactor could be raised to 50,000 mg/L without
immediate membrane fouling with the addition of 2200 mg/L of a cationic polymer.
After testing a total of 30 different additives, Iversen et al. [8] have shown that some of
the tested additives were able to significantly reduce the concentration of SMP. A new
membrane performance enhancer (MPE50TM) was first introduced by Yoon and Collins
[9] as a commercial product of Nalco Company. Their study showed that with 400 ppm
of MPE50, a full scale municipal MBR plant (2,300 m3/d) could be operated at a higher
flux of 47.25 L/m2.h, which is 39% above the critical flux (34 L/m2.h), for one day
without any significant permeability loss. Another advantage of MPE50 is that it did not
negatively affect the overall aeration demand. Lab and pilot scale experiments with

4
MPE50 addition have shown that the membrane fouling rates could significantly be
reduced even under high flux conditions and the process could be operated at an
extremely high suspended solid level, e.g. 50,000 mg/L [10]. In addition, permeate
chemical oxygen demand (COD) was improved by approximately 30%, whereas no
toxic effects on bioactivity were found. This study also showed that MPE50 could
reduce foaming in the anoxic tank. A study on the influence of MPE50 on membrane
fouling mitigation in a MBR revealed that 50 mg/L of the polymer dosage was the
optimum as it resulted in long filtration time [11]. Moreover, the soluble COD and
soluble EPS concentrations in the MPE50 added MBR were lower than those in the
control MBR (without MPE50). The biofilm structure investigation at the same
transmembrane pressure (TMP) also exhibited that MPE50 addition achieved higher
biofilm porosity and lower amount of attached biomass. Besides, Guo et al [12] proved
that submerged MBR (SMBR) with MPE50 addition could significantly improve the
sustainable flux and reduce membrane fouling. Furthermore, the system achieved high
dissolved organic carbon (DOC) and COD removal efficiencies (>95 %), as well as
outstanding NH4-N removal of over 95 - 98% and PO4-P removal of over 99% after 7
days operation. Koseoglu et al. [13] studied on the effects of different flux enhancing
chemicals on the filterability and the fouling reduction of MBR. The results indicated
that at their optimal dosages, the cationic polymers such as MPE50, MPL30 and KD452
provided 96, 80 and 74% reductions in fouling rates, respectively. Additionally,
consistent with short term filtration test, cationic polymers performed well and
increased critical flux value to above 50 L/m2.h levels.

5
The objective of this study was to investigate the effect of a new combined
CIOF of FeCl3 and MPE50 for SMBR in treating a synthetic wastewater. The
performance of the SMBR was assessed in terms of organic and nutrient removal
efficiencies, membrane fouling based on TMP development and sludge volume index
(SVI). Microbial activity of activated sludge was evaluated in terms of specific oxygen
uptake rate (SOUR).
2. Materials and Method
2.1 Synthetic wastewater
The experiments were conducted using a synthetic wastewater to avoid any
fluctuation in the feed concentration and provide a continuous source of biodegradable
organic pollutants such as glucose, ammonium sulfate and potassium dihydrogen
orthophosphate. The synthetic wastewater used in this study represents high strength
domestic wastewater (just after primary treatment process). The synthetic wastewater
consists of DOC of 120-130 mg/L, COD of 330-360 mg/L, ammonium nitrogen (NH4-
N) of 12-15 mg/L and total phosphate (T-P) of 3.6 - 3.9 mg/L (COD:N:P = 100:5:1).
The composition of synthetic wastewater used in this study is shown in Table 1 [14].
Table 1 Characteristics of the synthetic wastewater
2.2 Flocculant
MPE50 used in this experiment was obtained from Nalco Company. The
combined flocculant CIOF was prepared by mixing ferric chloride and MPE50 at a ratio
of 1:1 (2 g of MPE50 with 100 mL of 2% FeCl3). The CIOF was manually added to the
activated sludge 2 times per day at a dosage of 30 mg/Lwastewater.

6
2.3 SMBR set-up
A polyethylene hollow fiber membrane module was used with the pore size of
0.1µm and the surface area of 0.05 m2 (Mitsubishi-Rayon, Japan). The effective volume
of the bioreactor was 6 L and the filtration rate was maintained at 12 L/m2.h. The
membrane was placed inside the reactor. Synthetic wastewater was pumped into the
reactor using a feeding pump to control the feed rate while the effluent flow rate was
controlled by a suction pump. A pressure gauge was used to measure the TMP and a
soaker hose air diffuser was used to maintain the air flow rate. The SMBR was filled
with the sludge from a local Wastewater Treatment Plant and acclimatised to synthetic
wastewater. The initial mixed liquor suspended solids (MLSS) was 5 g/L. The
experiment was conducted at room temperature, which was about 250C. Hydraulic
retention time and organic loading rate of the system were 10 hours and 4.75 g COD/d,
respectively. No excess sludge was withdrawn during the experiment.
2.4 Analysis
DOC of the influent and effluent was measured using the Analytikjena Multi
N/C 2000. The analysis of COD and measuring of MLSS and biomass (monitored as
mixed liquor volatile suspended solids, MLVSS) were according to Standard Methods
[15]. T-N and T-P were measured by photometric method using Spectroquant ® Cell
Test (NOVA 60, Merck). YSI 5300 Biological Oxygen Monitor was used to measure
the SOUR. The oxygen consumption measurement can be achieved through the use of
oxygen electrode with oxygen permeable Teflon membrane. Voltage generated from the

7
reaction is proportional to the oxygen concentration of the sample and produces oxygen
uptake during a period of 2-15 min.
2.5 Membrane cleaning
The fouled membrane was cleaned using both physical and chemical methods.
The physical cleaning was adopted by providing 1 min backwash every 1 h at a
backwash rate of 30 L/m2.h. The membrane was chemically cleaned on the 53rd day
when the TMP reached a value of 36 kPa. The chemical cleaning procedure is as
follows: (i) the cake layer formed from activated sludge on fouled membrane was
brushed off; (ii) the membrane was soaked in 2% citric acid solution for 2 h; and (iii)
the membrane was immersed for 2 h in 4% NaOH and 0.4% NaOCl solution.
3. Results and discussion
3.1. Short-term SMBR with individual flocculant addition
Short-term experiments were conducted to investigate the effects of the two
individual flocculants (FeCl3 and MPE50) on SMBR performance. Table 2 presents the
comparison results of SMBR alone and SMBRs with flocculants’ addition. As shown in
Table 2, FeCl3 addition could slightly improve the reduction of DOC compared to
SMBR alone, which led up to 97.6±0.7% removal, whereas the DOC removal with
MPE50 (94.1±1.9%) was slightly lower than that of SMBR alone (96.5±0.3%). Both of
the flocculants showed their potential for reducing membrane fouling. Compared to the
membrane fouling rate of SMBR alone (5 kPa/d), the FeCl3 and MPE50 resulted in a
lower membrane fouling rates of 1.3 and 3.3 kPa/d, respectively. With regards to
nutrient removal, flocculants improved the nitrification in the SMBR and MPE50

8
yielded in the highest NH4-N removal efficiency of 75.2% during the 10 day- operation.
Nevertheless, although T-N can be partially removed in aerobic SMBR (53.8%) through
the anoxic micro-zones in the centre of microbial flocs, FeCl3 only increased 7% of T-N
removal while MPE50 decreased the value to 34.9%, indicating the synthetic organic
polymer may have negative effect on denitrification. Moreover, MPE50 also exhibited
an insignificant decrease in T-P removal. However, MPE50 enhanced the SOUR of the
mixed liquor significantly (1.5 times than that of SMBR alone), which indicated that
organic flocculant could improve the microbial activity. In addition, MPE50 also
showed the lowest biomass growth rate of 0.15 g/d, resulting in the lowest sludge
production.
Table 2 The performance of tested flocculants in 10-day submerged MBR experiment (filtration rate 10 L/m2.h, initial MLSS = 5 g/L, backwash rate = 30 L/m2.h, backwash = 2 times per day for 2 min duration, influent DOC = 135-160 mg/L, NH4-N = 16-19 mg/L, T-N = 17-22 mg/L, T-P = 3.6-3.9 mg/L)
Based on the merits of each flocculant, FeCl3 and MPE50 were combined to be a new
flocculant (CIOF) at a ratio of 1:1 to conduct a long-term experiment.
3.2. Evaluation of CIOF as performance enhancer for SMBR
3.2.1. Organic and nutrient removals
Organic and nutrient removals by the SMBR system with the addition of CIOF
are shown in Fig. 1. The results show that over 95% of DOC was removed from the
SMBR system with the effluent concentration of only 2-5 mg/L. Nutrients removal was
investigated in terms of NH4-N, T-N and T-P removal. This system was successful in
achieving phosphorus removal of almost 100%. This high phosphorus removal

9
efficiency was mainly due to two mechanisms, biological phosphorus removal and
chemical precipitation. Biological phosphorus removal relies on the enrichment of the
activated sludge system with phosphorus accumulating organisms (PAOs). Chemical
precipitation of P is by the reaction between ferric ion and phosphorus in the wastewater
to form ferric phosphate as precipitant. This system could also successfully remove
NH4-N with an efficiency of 85 - 95 %. However, the total nitrogen removal was not
significant. During the whole operation process, the system was constantly supplied
with 10 Lair/min. With the biomass growth, the nitrification rapidly reduced due to the
decrease in the dissolved oxygen (DO) in the suspension. Thus, T-N removal efficiency
decreased from 75% at the beginning to only 8% after 35 days of operation. The
systems then recovered back to yield T-N removal of 50-55% till the end of the
experiment. This might be due to the occurrence of large size of sludge flocs in which
the denitrification process may have taken place inside the biomass.
Fig. 1. DOC, NH4-N, T-N and T-P profiles of SMBR system (influent DOC = 120-130 mg/L; NH4-N = 16-18 mg/L; T-N = 16-19 mg/L; T-P = 3.6-3.9 mg/L; filtration flux =
12 L/m2.h; backwash rate = 36 L/m2.h, CIOF dosage = 30 mg/L)
3.2.2. SOUR
Oxygen uptake rate plays a crucial role in aerated activated sludge systems, as
oxygen is required to remove both nitrogen and carbon. In an activated sludge process,
oxygen uptake rate is influenced by several parameters such as MLSS concentration,
wastewater type, mixing characteristics, the availability of substrates and nutrients and
the presence of toxins. In this study, respiration test was conducted with the mixed
liquor taken from the bioreactor periodically.
Fig. 2. Temporal variation of the SOUR and Fe (III) concentration of mixed liquor during the experiment

10
The SOUR was 2.33 to 2.66 mg O2 /g VSS.h from day 1 to day 3 (Fig. 2). It was
increased to 4.5 mg O2 /g VSS.h on day 5 and remained constant up to day 30. This was
followed by a slight drop on day 35 to 2.4 mg O2 /g VSS.h and remained steady from
day 45 to the end of the experiment with the SOUR value of 1.56 to 2.07 mg O2 /g
VSS.h. The decline of the SOUR may be due to the accumulation of FeCl3 in the
system. In this study, Fe (III) concentration was analysed in the supernatant. The result
indicated that at the beginning of the experiment, the Fe (III) concentration was around
11.9-12.3 mg/L. It then accumulated and increased up to 44 mg/L on day 40 and 55.
Zhang et al. [16] observed the inhibiting effect of ferric salts on microbial activity in
membrane bioreactors. Their study showed a decrease of microbial activity for Fe(III)
concentration between 20-60 mg/L. The similar trend was also observed in the present
study. Similarly, Iversen et al. [17] investigated the impacts of several membrane flux
enhancers on activated sludge respiration. Their results also reported that the lower
SOUR value was observed with FeCl3 as compared to chitosans, PAC or polymers.
There was no clear explanation regarding this negative effect with the literature, and the
reason for this is still unclear.
3.2.3. SVI
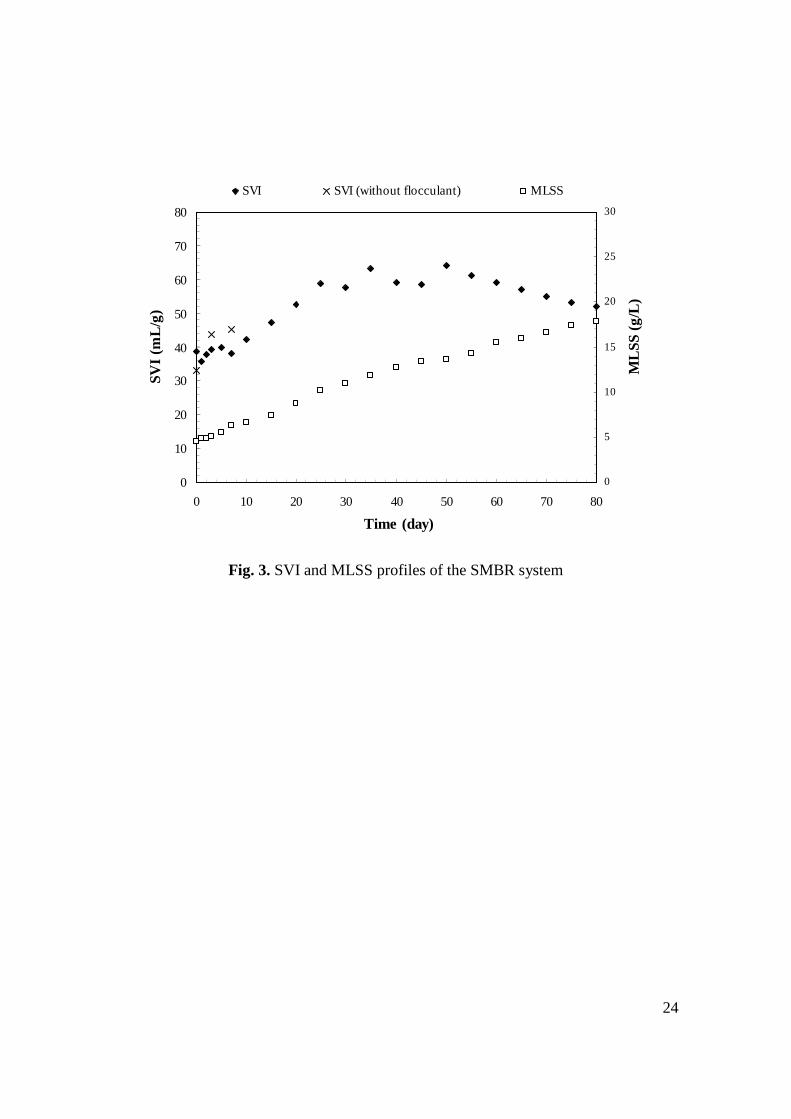
SVI is widely used for characterising sludge settleability. Fig. 3 shows the
variation of SVI with MLSS concentration in the SMBR system. The SVI varied
between 38.6 to 64.2 mL/g. In the initial stage of operation, SVI showed a gradual
increase along with the growth of biomass; however, after 35 days, the SVI stabilized
even at high biomass concentration. This indicates the dependence of SVI on MLSS

11
mainly during the initial phase. The SVI also shows a linear relationship with MLSS
during the first 35 days (rp=0.9788 significant at 0.05 level). There was no correlation
between them after the day 35. Other authors have also reported limited dependence of
SVI on biomass concentration in complete sludge retention MBRs [18].
Fig. 3. SVI and MLSS profiles of the SMBR system
In the present study, SVI value was always below 100 mL/g, indicating good
settling properties of the sludge. High SVI is normally attributed to growth of
filamentous bacteria. Several authors have reported that the presence of metal ions such
as calcium, magnesium or iron ions in the feed contributes to the control of sludge
bulking [19]. Therefore, CIOF used in this study did not lead to the growth of
filamentous microorganisms which is resulted in low SVI. In order to clarify this
assumption, the SVI during the first 3 days was compared with the SVI of blank-MBR.
The result showed the SVI was higher in the experiment without flocculants addition
after 3 days operation. This clearly indicates that the flocculants have positive effect on
controlling SVI.
3.2.4. Soluble EPS in supernatant
There are various biological, physical and chemical factors affecting membrane
fouling in the activated sludge. To elucidate the fouling tendency, the quantity of EPS
was analysed. EPS matrix is heterogeneous, in which polymeric material such as
carbohydrates and proteins, lipids and nucleic acids have been found. However, the sum
of carbohydrates and proteins is considered to represent the EPS because these were the
dominant components found in the extracted EPS [20,21].
Fig. 4. Protein and carbohydrate concentration of soluble EPS

12
In an MBR, the quantity and quality of EPS is influenced by the process design
and operational factors such as type of feed (wastewater), MLSS concentration, SRT,
etc. Moreover, the different growth phases of microbes and the fluctuations in feeding
or sludge wasting also affect the EPS concentration in the reactor [22,23].
Fig. 4 presents the soluble proteins and carbohydrates concentration in the
system. It is evident that proteins are the dominant component in the soluble EPS
isolated from activated sludge. Protein concentration varied from 23.33 mg/L (first day)
to 38.67 mg/L (10th day) whereas carbohydrate concentration was only 0.47 – 9.07
mg/L. Satyawali et al. [24] have also reported the higher proteins concentration in
soluble EPS. In general, carbohydrates are extracellular components synthesized for
specific function, while proteins can exist in the extracellular polymer network due to
the excretion of intracellular proteins/enzymes or cell lysis [25]. Additionally, EPS was
the highest at day 10 and 15, reflecting the increase of TMP from day 0 to day 15 (4 kPa
to 20 kPa). During next 10 days, from day 20 to day 30, EPS remained steady,
corresponding to a stable TMP value at around 20 - 21 kPa. Nevertheless, after 30 days
of operation, there was no relationship between soluble EPS and TMP. During this
period soluble EPS kept constant while TMP gradually increased.
Fig. 5 Correlation of soluble carbohydrates and DOC in the supernatant
Fig. 5 shows the relationship between soluble carbohydrate concentration and
the DOC concentration in the supernatant. It can be observed that soluble carbohydrate
concentration was well correlated with DOC values (R2 = 0.9234). Previously, several

13
authors have also reported the correlation between these two parameters; however, the
R-squared values were not high [26]. This result shows the importance of the
measurement of supernatant DOC for MBR monitoring. In contrast, such a correlation
was not found between soluble proteins and DOC in the supernatant, between turbidity
of supernatant and soluble carbohydrates or proteins.
3.2.5. TMP development
Fig. 6 shows the TMP of the experiments with and without flocculant addition.
The TMP development was very high without flocculant addition as compared to the
flocculant addition. TMP increased gradually during first 20 days of operation with a
TMP development rate of 1 kPa/d. The TMP remained constant at around 20-21 kPa for
the next 10 days. This followed by the increase up to 36 kPa. After the chemical
cleaning on day 53, the TMP dropped to15 kPa. This was followed by a mild increase to
23 kPa till day 70 and kept constant at 24 kPa up to the end of the experiment.
Interestingly, TMP increased only by 2 kPa during this period while the MLSS
concentration was relatively high during last 15 days of operation (around 16.55-17.85
mg/L). This result shows that the system could maintain at high activated sludge
concentration without any significant effect on increasing TMP.
Fig. 6. TMP development of the SMBR systems with and without CIOF addition (Filtration flux = 12 L/m2.h; backwash rate = 36 L/m2.h, backwash 1 min every 1 hr)
3.3. Comparison between CIOF and individual flocculant
Comparative results of CIOF and individual flocculant are summarised in Table
3. The average DOC removal efficiency was 98.2% when using CIOF, it was 0.6 –
4.1% higher comparing to individual flocculant. The better performance of CIOF was
also achieved in terms of T-P removal efficiency with the improvement of 0.1 – 4.4%.

14
The significant enhancement was addressed from 73.8 – 75.2% to 91.3% in NH4-N
removal, showing the advantages of CIOF. In addition, with the biomass growth rate of
only 0.16 g/day, the combined flocculant might be considered as a option for
minimisation the excess sludge production. Furthermore, the CIOF was successful in
reducing membrane fouling rate, with 58-83% less as compared with individual
flocculant. These above comparisons demonstrated the advantages of CIOF in terms of
pollutant removal, controlling sludge production and reducing membrane fouling.
Table 3 Comparison between CIOF and individual flocculant (FeCl3 and MPE50) (filtration rate 10 L/m2.h, backwash rate = 30 L/m2.h, initial MLSS = 5 g/L, influent DOC = 135-160 mg/L, NH4-N = 16-19 mg/L, T-N = 17-22 mg/L, T-P = 3.6-3.9 mg/L)
4. Conclusions
The effect of a CIOF on the performance of a long-term aerated SMBR was
studied in detail. The addition of CIOF to SMBR was significantly improved both
organic and nutrient removals. In addition, the CIOF could also maintain a good
microbial activity with a stable SOUR. A stable SVI and soluble carbohydrate
concentration and a low TMP development rate also supported the importance of CIOF
on the reduction of membrane fouling. Further study on the optimization of FeCl3 and
MPE50 and the characterization of this CIOF for the in-depth understanding of
fundamental mechanisms is essential.
Acknowledgements
This research was funded by DEST International Science Linkages Competitive
Grant. The authors are also grateful for the support of UTS Chancellor’s Postdoctoral
Research Fellowship and UTS Early Career Researcher Grants.

15
References
[1] W. Yang, N. Cicek, J. Ilg, State-of-the-art of membrane bioreactors: Worldwide
research and commercial applications in North America, J. Membr. Sci. 270 (2006)
201-211.
[2] Wu. J, Chen. F, Huang. Xia, Geng. W, Wen. X, Using inorganic coagulants to
control membrane fouling in a submerged membrane bioreactor, Desalination 197
(2006) 124 – 136.
[3] Y. Zhang, D. Bu, C.G. Liu, X. Luo, P. Gu, Study on retarding membrane fouling
by ferric salts dosing in membrane bioreactors, IWA Special Conference, 2004.
[4] J.C. Lee, J.S. Kim, I.J. Kang, M.H. Cho, P.K. Park, C.H. Lee, Potential and
limitations of alum or zeolite addition to improve the performance of a submerged
membrane bioreactor, Water Sci. Technol. 43 (2001) 59 – 66.
[5] H.F. Zhang, B.S. Sun, X.H. Zhao, Z.H. Gao, Effect of ferric chloride on fouling in
membrane bioreactor, Sep. Purif. Technol. 63 (2008) 341 – 347.
[6] K.G. Song, Y. Kim, K.H. Ahn, Effect of coagulant addition on membrane fouling
and nutrient removal in a submerged membrane bioreactor, Desalination 221
(2008) 467 – 474.
[7] S.H. Yoon, J.H. Collins, D. Musale, S. Sundararajan, S.P. Tsai, G.A. Hallsby, J.F.
Kong, J. Koppes, P. Cachia, Effects of flux enhancing polymer on the
characteristics of sludge in membrane bioreactor process, Water Sci. Technol. 51
(2005) 151.
[8] V. Iversen, L. Bonnet, A. Drews, B. Lesjean, M. Kraume, Can we control the
fouling with flux enhancing chemicals?, Proceedings of EUROMBRA Workshop

16
“Biofouling in Membrane Systems”, Trondheim, July 11-12, 2006, ISBN 82-7598-
065-8.
[9] S.H. Yoon, J.H. Collins, A novel flux enhancing method for membrane bioreactor
process using polymer, Desalination 191 (2005) 52 – 61.
[10] J.H. Collins, S.H. Yoon, D. Musale, J.F. Kong, J. Koppes, S. Sundararajan, S.P.
Tsai, G.A. Hallsby, P. Cachia, K. Kronoveter, Membrane performance enhancer
evaluations on pilot and full scale membrane bioreactors, Water Environ. J. 20
(2006) 43 – 47.
[11] W.N. Lee, I.S. Chang, B.K. Hwang, C.H. Lee, X. Huang, Changes in biofilm
architecture with addition of membrane fouling reducer in membrane bioreactor,
Process Biochem. 42 (2007) 655 – 661.
[12] W.S. Guo, S. Vigneswaran, H.H. Ngo, J. Kandasamy, S. Yoon, The role of the
membrane performance enhancer in a membrane bioreactor: a comparison with
other submerged membrane hybrid systems, Desalination 231 (2007) 305 – 313.
[13] H. Koseoglu, N.O. Yigit, V. Iversen, A. Drews, M. Kitis, B. Lesjean, M. Kraume,
Effects of several different flux enhancing chemicals on filterability and fouling
reduction of membrane bioreactor mixed liquors, J. Membr. Sci. 320 (2008) 57 –
64.
[14] W. Lee, S. Kang, H. Shin, Sludge characteristics and their contribution to
microfiltration in submerged membrane bioreactors, J. Membr. Sci. 216 (2003) 217
– 227.
[15] APHA, AWWA, and WEF, Standard Methods for the examination of Water and
Wastewater, 20th edition, American Public Health Association, Washington, DC,
1998.
17
[16] Y. Zhang, D. Bu, C.G. Liu, X. Luo, P. Gu, Study on retarding membrane fouling
by ferric salts dosing in membrane bioreactor, WEMT, Seoul, Korea, 2004.
[17] V. Iversen, H. Koseoglu, N.O. Yigit, A. Drews, M. Kitis, B. Lesjean, M. Kraume,
Impacts of membrane flux enhancers on activated sludge respiration and nutrient
removal in MBRs, Water Res. 43 (2009) 822-830.
[18] A. Pollice, C. Giordano, G. Laera, D. Saturno, G. Mininni, Physical characteristics
of the sludge in a complete retention membrane bioreactor, Water Res. 41 (2007)
1832–1840.
[19] Y.F. Tsang, S.N. Sin, H. Chua, Nocardia foaming control in activated sludge
process treating domestic wastewater, Bioresour. Technol. 99 (2008) 3381–3388.
[20] R. Bura, M. Cheung, B. Liao, J. Finlayson, B.C. Lee, I.G. Droppo, G.G. Leppard,
S.N. Liss, Composition of extracellular polymeric substances in the activated
sludge floc matrix. Water Sci. Technol. 37 (1998) 325.
[21] B. Frølund, R. Palmgren, K. Keiding, P.H. Nielsen, Extraction of extracellular
polymers from activated sludge using a cation exchange resin, Water Res. 30
(1996) 1749.
[22] A. Drews, C.H. Lee, M. Kraume, Membrane fouling – a review on the role of EPS,
Desalination 200 (2006) 186 – 188.
[23] Q.T.T. Thuy, C. Visvanathan, Removal of inhibitory phenolic compounds by
biological activated carbon coupled membrane bioreactor, Water Sci. Technol. 53
(2006) 89 – 97.
[24] Y. Satyawali, M. Balakrishnan, Effect of PAC addition on sludge properties in an
MBR treating high strength wastewater, Water Res. 43 (2009) 1577 – 1588.

18
[25] Z. Ying, G. Ping, Effect of powdered activated carbon dosage on retarding
membrane fouling in MBR, Sep. Purif. Technol. 52 (2006) 154 – 160.
[26] S. Lyko, T. Wintgens, D.A. Halbouni, S. Baumgarten, D. Tacke, K. Drensla, A.
Janot, W. Dott, J. Pinnekamp, T. Melin, Long-term monitoring of a full-scale
municipal membrane bioreactor – Characterisation of foulants and operational
performance, J. Membr. Sci. 317 (2008) 78 – 87.

19
Table 1 Characteristics of the synthetic wastewater
Compound Chemical formula Concentration
(mg/L)
Organics and nutrients
Glucose C6H12O6 280
Ammonium sulfate (NH4)2SO4 142
Potassium phosphate KH2PO4 26
Trace nutrients
Calcium chloride CaCl2.2H2O 0.368
Magnesium sulfate MgSO4.3H2O 5.070
Manganese chloride MnCl2.4H2O 0.275
Zinc sulfate ZnSO4.7H2O 0.440
Cupric sulfate CuSO4. 5H2O 0.391
Cobalt chloride CoCl2. 6H2O 0.42 Sodium molybdate
dihydrate Na2MoO4.2H2O 1.26
Ferric chloride anhydrous FeCl3 1.45
Yeast extract 30

20
Table 2 The performance of tested flocculants in 10-day submerged MBR experiment (filtration rate 10 L/m2.h, initial MLSS = 5 g/L, initial MLVSS/MLSS = 0.87, backwash rate = 30 L/m2.h, backwash = 2 times per day for 2 min duration, influent DOC = 135-160 mg/L, NH4-N = 16-19 mg/L, T-N = 17-22 mg/L, T-P = 3.6-3.9 mg/L)
Flocculant Dosage (g/day)
DOC removal efficiency (%)
SOUR (mg O2/g MLVSS.h)
Biomass growth rate
(g/day)
Membrane fouling rate (kPa/day)
NH4-N removal
efficiency (%)
T-N removal efficiency (%)
T-P removal efficiency
(%)
No flocculant
– 96.5±0.3 3.00±0.64 0.23 5.0 66.4 53.8 99.5
FeCl3 0.9 97.6±0.7 4.11±0.44 0.33 1.3 73.8 60.8 99.9
MPE50
Initial dose 250
mg/L(reactor
volume), then 0.3 g/day
94.1±1.9 4.50±0.41 0.15 3.3 75.2 34.9 95.6

21
Table 3 Comparison between CIOF and individual flocculant (FeCl3 and MPE50) (filtration rate 10 L/m2.h, backwash rate = 30 L/m2.h, initial MLSS = 5 g/L, influent DOC = 135-160 mg/L, NH4-N = 16-19 mg/L, T-N = 17-22 mg/L, T-P = 3.6-3.9 mg/L)
Individual flocculant CIOF Percentage improvement when
using CIOF (%)
DOC removal efficiency (%) 94.1 - 97.6 98.2 0.6 - 4.1
T-P removal efficiency (%) 95.6 - 99.9 100 0.1 - 4.4
NH4-N removal efficiency (%) 73.8 - 75.2 91.3 16.1 - 17.5
Biomass growth rate (g/day) 0.15 - 0.33 0.16 -
Membrane fouling rate (kPa/day) 1.30 - 3.30 0.55 58 - 83

22
0
10
20
30
40
50
60
70
80
90
100
110
0 10 20 30 40 50 60 70 80
Time (day)
Rem
oval
eff
icie
ncie
s (%
)DOC NH4-N T-N T-P
Fig. 1. DOC, NH4-N, T-N and T-P profiles of SMBR system (influent DOC = 120-130 mg/L; NH4-N = 16-18 mg/L; T-N = 16-19 mg/L; T-P = 3.6-3.9 mg/L; filtration flux =
12 L/m2.h; backwash rate = 36 L/m2.h, CIOF dosage = 30 mg/L)

23
0
2
4
6
8
10
12
1 3 5 7 10 15 20 25 30 35 40 45 50 55 60 65 70 75 80
Time (day)
SOU
R (
mg
O2
/gV
SS.h
)
0
10
20
30
40
50
Fe
(III
) co
ncen
trat
ion
(mg/
L)
SOUR Fe (III) concentration
Fig. 2. Temporal variation of the SOUR and Fe (III) concentration of mixed liquor
during the experiment.
24
0
10
20
30
40
50
60
70
80
0 10 20 30 40 50 60 70 80
Time (day)
SVI
(mL
/g)
0
5
10
15
20
25
30
ML
SS (
g/L
)
SVI SVI (without flocculant) MLSS
Fig. 3. SVI and MLSS profiles of the SMBR system

25
0
5
10
15
20
25
30
35
40
45
1 7 10 15 20 25 30 35 40 45 50 55 60 65 70 75 80
Time (day)
EP
S (m
g/L
)
Protein
Carbohydrate
Fig. 4. Protein and carbohydrate concentration of soluble EPS

26
R2 = 0.9234
0
5
10
15
20
25
0 1 2 3 4 5 6 7 8 9 10
Carbohydrate concentration (mg/L)
DO
C c
once
ntra
tion
(m
g/L
)
Fig. 5. Correlation of soluble carbohydrates and DOC in the supernatant

27
Fig. 6. TMP development of the SMBR systems with and without CIOF addition
(Filtration flux = 12 L/m2.h; backwash rate = 36 L/m2.h, backwash 1 min every 1 hr)
0
5
10
15
20
25
30
35
40
45
0 10 20 30 40 50 60 70 80
Time (day)
TM
P d
evel
opm
ent
(kP
a)Flocculant addition Without flocculant addition
Chemical cleaning